

Abstract
Re-excision rates for breast cancer lumpectomy procedures are currently nearly 25% due to surgeons relying on inaccurate or incomplete methods of evaluating specimen margins. The objective of this study was to determine if cancer could be automatically detected in breast specimens from mastectomy and lumpectomy procedures by a classification algorithm that incorporated parameters derived from fluorescence lifetime imaging (FLIm). This study generated a database of co-registered histologic sections and FLIm data from breast cancer specimens (N=20) and a support vector machine (SVM) classification algorithm able to automatically detect cancerous, fibrous, and adipose breast tissue. Classification accuracies were greater than 97% for automated detection of cancerous, fibrous, and adipose tissue from breast cancer specimens. The classification worked equally well for specimens scanned by hand or with a mechanical stage, demonstrating that the system could be used during surgery or on excised specimens. The ability of this technique to simply discriminate between cancerous and normal breast tissue, in particular to distinguish fibrous breast tissue from tumor, which is notoriously challenging for optical techniques, leads to the conclusion that FLIm has great potential to assess breast cancer margins. Identification of positive margins before waiting for complete histologic analysis could significantly reduce breast cancer re-excision rates.
Introduction
Recent statistics indicate that breast cancer is the leading cause of cancer-related death and the 2nd most diagnosed cancer for women in the United States and is the most common cancer in women worldwide (Fitzmaurice et al., 2016). Currently, an American woman has a 1 in 9 chance of developing breast cancer during her lifetime (Fitzmaurice et al., 2016). Breast-conserving surgery (lumpectomy) followed by radiation is the standard-of-care surgical intervention for early-stage cancer and is as effective as mastectomy in many cases (O’Kelly Priddy et al., 2015). From a 2009 study, 37.9% of 1459 lumpectomy procedures resulted in positive margins (Morrow et al., 2009) and 50% of reoperations due to positive margin findings did not find residual tumor (Azu et al., 2010). Additionally, positive margins are correlated with a significant increase in ipsilateral breast tumor regional recurrence (Houssami et al., 2014) and reoperation is associated with greater physical and emotional trauma to the patient, a higher incidence of complications, and poorer cosmetic outcomes (St John et al., 2017). The most accurate methods to assess tumor margins are cytology and frozen sections, both of which require significant time and cost and thus are not commonly performed (St John et al., 2017). A fast, cost-effective and accurate way to assess breast cancer margins intraoperatively or immediately following resection is in high demand.
Optical techniques provide a means to non-destructively probe tissue composition, making them safe for intraoperative use. Studies have been done to determine the capability of several optical techniques to potentially diagnose breast cancer specimens. This includes diffuse reflectance spectroscopy (DRS) (de Boer et al., 2016; Brown et al., 2010; Keller et al., 2010), diffuse optical spectroscopy (DOS) (Nichols et al., 2017), Raman spectroscopy (Kong et al., 2014), fluorescence spectroscopy (Keller et al., 2010), optical coherence tomography (OCT) (Nguyen et al., 2009; Zysk et al., 2015; Erickson-Bhatt et al., 2015), optical coherence micro-elastography (Allen et al., 2016), autofluorescence lifetime microscopy (Sharma et al., 2012), and photoacoustic microscopy (Wong et al., 2017). Moreover, few of these have been used to assess margins intraoperatively (i.e. DRS, DOS, and OCT), but none have been widely adopted into regular clinical practice due to inherent limitations. For example, while fibrous tissue will appear more uniform with OCT than tumor (Erickson-Bhatt et al., 2015), OCT still has limited ability to distinguish between cancerous and fibrous breast tissue due to potentially similar structural features of these tissue types (Nguyen et al., 2009). Also, while a careful study of normal and cancerous breast tissue has been performed with DRS (Kennedy et al., 2016), an automated method to distinguish cancer based on DRS measurements has not been demonstrated. Furthermore, a recent meta-analysis of intraoperative margin assessment techniques showed that optical techniques will need to be both improved in accuracy for cancer detection and more convenient and cost-effective before they will be accepted by the wider clinical community (St John et al., 2017). Additionally, new work is being done to achieve pathology-like images through staining resected samples and performing optical imaging; for instance light-sheet microscopy (Glaser et al., 2017) and fluorescence imaging (Davis et al., 2013). These show great promise for identifying tumor margins, but in comparison to other optical techniques, have the drawback of requiring tissue staining prior to imaging.
Taking advantage of the autofluorescence properties of breast tissue, earlier studies have shown that fluorescence intensity-based spectroscopy techniques enable detection of breast cancer with good sensitivity and specificity (85% and 96%, respectively) (Keller et al., 2010). Time-resolved (lifetime) fluorescence spectroscopy techniques can improve these statistics by providing an additional means to analyze tissue autofluorescence by separating tissue fluorophores with overlapping fluorescence intensity parameters but distinct fluorescence lifetimes. Such techniques, however, have only been sparsely explored for diagnosis of breast cancer (Sharma et al., 2012; Gorpas et al., 2015). Endogenous fluorophores distinguishable by fluorescence lifetime techniques and relevant to breast cancer detection include adipose tissue, collagen fibers, nicotinamide adenine dinucleotide (NADH) and flavin adenine dinucleotide (FAD).
While the potential diagnostic capabilities of fluorescence lifetime techniques have been demonstrated in pre-clinical studies, many challenges exist for clinical translation including complex instrumentation, time-consuming data analysis, and a lack of ability for clinicians to simply obtain fluorescence lifetime data and quickly display conclusive diagnostic information. Recent advances in fluorescence lifetime imaging (FLIm) instrumentation with a fast and compact scanning fiber-based system (Yankelevich et al., 2014; Ma et al., 2015) enable acquisition of FLIm images either during surgery or on excised specimens, in real-time as the FLIm fiber optic is scanned over the tissue via hand scanning or with an automated mechanical stage. The system is housed in a compact cart that can be transported easily to operating or pathology rooms. The goals of this study were to demonstrate: 1) the ability of this compact system to acquire data from breast specimens in scenarios that mimic the intraoperative setting, which would require hand scanning during surgery or a mechanical stage for scanning excised specimens; and 2) the accuracy of a classification algorithm that employs optical parameters derived from FLIm measurements to automatically output diagnostic information about breast specimens as independently validated with histology. Our findings show that this FLIm technique may be a contender for reducing breast cancer re-excision rates due to its ability to accurately and quickly distinguish cancer from normal tissue in a manner that could identify positive margins intraoperatively either during surgery or on resected tissue specimens.
Methods
Breast specimens.
Tissue specimens (N=20) from breast cancer patients (N=14 total: N=4 lumpectomies, N=10 mastectomies) were imaged within an hour of resection. Multiple pieces of tissue were imaged from N=5 of the total patients, which is why there are N=20 specimens, but only N=14 patients. All patients provided informed consent. See table 1 for a summary of patient information. The University of California Davis Health System Institutional Review Board approved this study.
Table 1.
Demographic and tumor characteristics of N=14 patients in this study.
| Characteristic | Number (%) | |
|---|---|---|
| Age | <50 | 3 (21) |
| >50 | 9 (64) | |
| Unknown | 2 (14) | |
| Race | White, not hispanic or latino | 12 (86) |
| Unknown | 2 (14) | |
| Body mass index, kg/m2 | Normal (<25) | 5 (36) |
| Overweight, 25–30 | 5 (36) | |
| Obese, ≥30 | 2 (14) | |
| Unknown | 2 (14) | |
| Menopausal status | Premenopausal | 4 (29) |
| Postmenopausal | 10 (71) | |
| Unknown | 2 (14) | |
| Radiotherapy | No radiotherapy | 8 (57) |
| Radiotherapy | 2 (14) | |
| Unknown | 4 (29) | |
| Hormone therapy | No | 7 (50) |
| Yes | 4 (29) | |
| Unknown | 3 (21) | |
| Type of surgery | Lumpectomy | 3 (21) |
| Mastectomy | 9 (64) | |
| Unknown | 2 (14) | |
| Receptor status | Negative | 2 (14) |
| Positive | 8 (57) | |
| Unknown | 4 (29) | |
| Cancer stage | DCIS | 3 (21) |
| Invasive | 9 (64) | |
| Unknown | 2 (14) |
Imaging protocol.
The tissue was assessed by a pathologist and regions thought to contain tumor were cut into sizes that could be fit in a single tissue processing cassette (~20 mm × 20 mm × 4–5 mm), with slight irregularities in the overall shape to assist with later co-registration between histology and FLIm data. Ink was used to mark the edges of the specimen and to assist with co-registration. The samples were placed on an imaging stage and scanned with the FLIm fiber optic either manually by hand or automatically by a mechanical stage to mimic how this system could be used either during surgery or following surgery on excised tissue specimens, respectively. High-resolution white-light images as well as the video stream of the scanning were also acquired (see videos 1 and 2). The fluorescence lifetime values derived from FLIm measurements were augmented with the video stream of the tissue for visualization during imaging and saved for further analysis. The FLIm system and the process to augment the video stream are described below. Following imaging, specimens were placed in formalin and processed routinely for histologic analysis.
Video 1. Representative breast specimen scanned on a mechanical stage.
This MP4 video was recorded as this breast specimen was scanned automatically on a mechanical stage. The augmented colors represent fluorescence lifetime in detection channel 2.
Video 2. Representative breast specimen scanned by hand.
This MP4 video was recorded as this breast specimen was scanned by hand. The augmented colors represent fluorescence lifetime in detection channel 2.
Histology.
Tissue sections were cut parallel to the imaging plane, thus each histologic section corresponded to one entire field of view of a FLIm dataset. The sections were stained with hematoxylin and eosin (H&E) and scanned with an Aperio Digital Pathology Slide Scanner (Leica Biosystems). The pathologist (M.D.) traced regions of fibrous tissue, normal ducts and lobules, fat, invasive cancer and ductal carcinoma in situ (DCIS) using Aperio ImageScope (Leica Biosystems). The FLIm interrogation depth is ~300 μm (Ghosh et al., 2001; Palmer et al., 2006) and the depth of a single histologic tissue section was 4 μm. To determine how much the breast tissue composition changed within the 300 μm depth, in N=2 cases multiple 4 μm sections were cut within the 300 μm imaged volume. Matlab (The Mathworks, Inc.) software was used for selecting regions of interest in the FLIm images and for image analysis.
Region of Interest Selection.
Pathologist tracings from the histology sections were exported from the Aperio software and co-registered with the white light images of the breast tissue, using the shape of the tissue sections and ink as fiducial markers. Regions of interest (ROIs) were drawn within the tracings, with a 0.5 mm margin to account for errors in co-registration. See fig1.
Figure 1. Representative breast specimen automatically scanned on the mechanical stage.
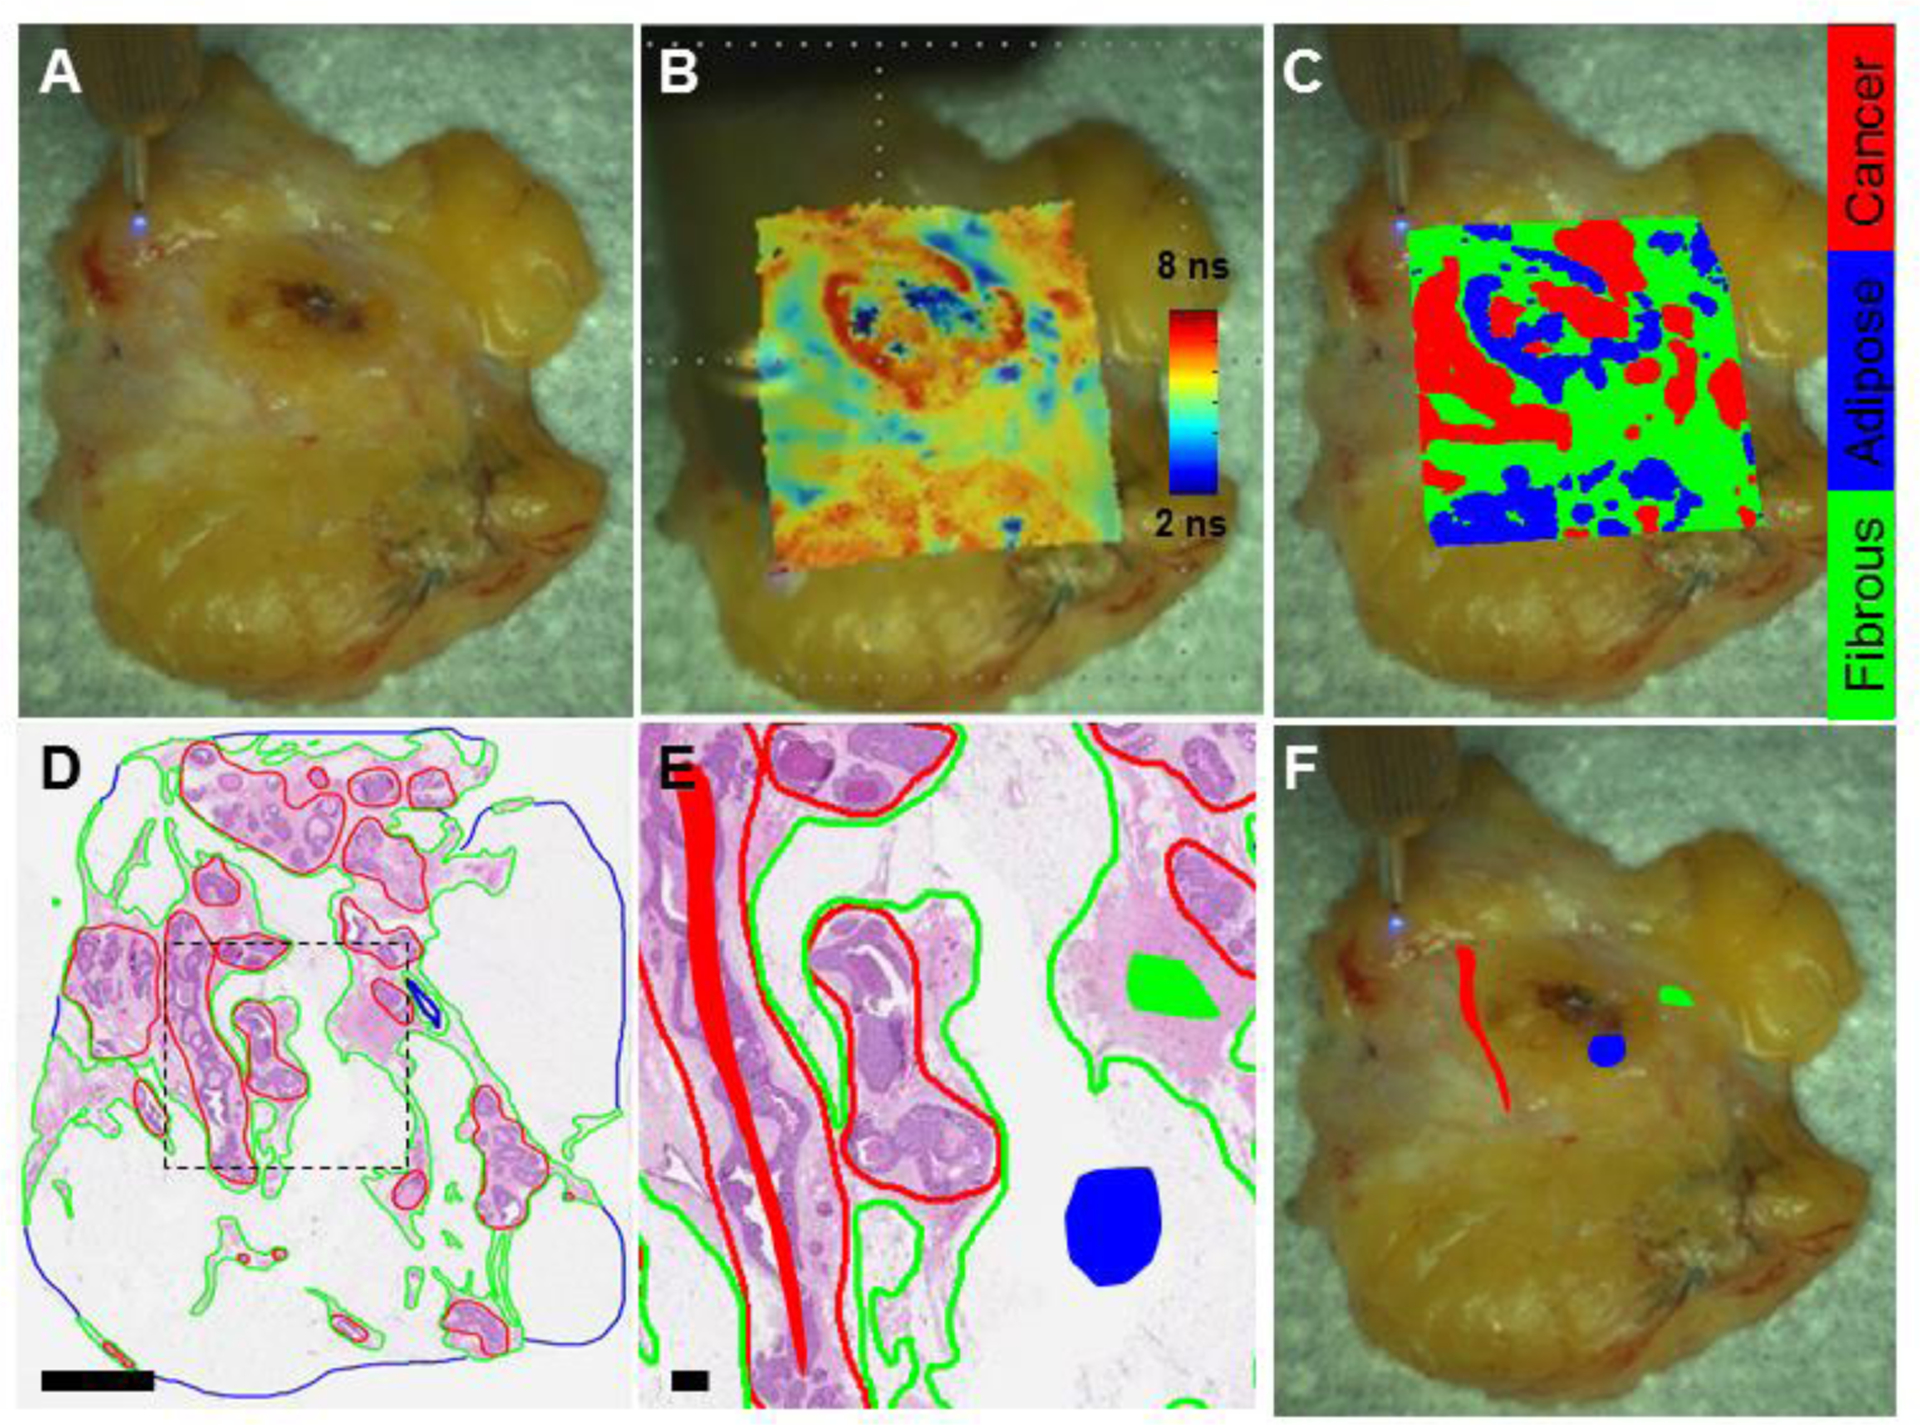
(A) White light image of a breast specimen scanned on a mechanical stage. (B) White light image augmented with FLIm data from spectral channel 2; (C) white light image augmented with classification results when this specimen was left out of the training set. (D) Corresponding H&E histology section. Cancer is outlined in red, adipose in blue and fibrous in green. Scale bar = 4 mm. (E) Zoomed in histology section from black dashed line in (D) with regions of interest included in the study shown with the filled-in shapes (red for cancer, blue for adipose, green for fibrous). Scale bar = 0.5 mm. These regions are overlayed with the breast specimen in (F).
FLIm system.
The imaging setup consisted of a prototype point scanning FLIm instrumentation and an aiming beam module (Gorpas et al., 2016b). The aiming beam detection scheme allowed the FLIm images to be reconstructed from the scanning point measurements in real time. The FLIm system is based on a pulse-sampling fluorescence lifetime measurement technique and has been described previously (Yankelevich et al., 2014; Gorpas et al., 2016b). Fluorescence excitation was produced with a micro Q-switched laser frequency tripled to 355 nm with a 2 KHz repetition rate (Teem Photonics™, France). The resulting fluorescence emission from the tissue specimens was sequentially spectrally resolved into four channels: 390/40 nm (channel 1), 466/40 nm (channel 2), 542/50 nm (channel 3), and 629/53 nm (channel 4) (Yankelevich et al., 2014). Each channel was connected to an optical fiber of varying length that allowed all 4 signals generated from a single laser pulse to arrive sequentially at distinct time points at the detector, a single microchannel plate photomultiplier tube (MCP-PMT, R3809U-50, Hamamatsu, 45 ps FWHM). The signals were then increased by an RF amplifier (AM-1607–3000, 3 GHz bandwidth, Miteq, USA) and temporally resolved (80 ps intervals) by a high sampling frequency digitizer (PXIe-5185, National Instruments, 12.5 GS/s sampling rate). A continuous-wave solid state laser (450 nm, 50 mW, World Star Tech, Canada) coupled into the second channel allowed the aiming beam (power ~ 3 mW) to be projected onto the tissue in the same location as the fluorescence excitation beam. An external camera (Point Grey Chameleon3 1.3 MP Color USB3 Vision with Fujinon HF9HA-1B 2/3” 9mm lens) recorded the entire specimen, including the aiming beam, during the scanning procedure. The video images were converted to the HSV color space and the blue aiming beam was segmented by thresholding the hue channel, providing co-registration between the FLIm measurements and the video of the tissue. Once the location of the aiming beam is determined, the FLIm data acquired from that location was augmented in real time with the video display of the scanning procedure. Thus as the tissue was scanned, an image of the FLIm data was reconstructed within the video stream of the tissue visualized on the FLIm system computer monitor, creating an augmented view of the tissue overlayed with the FLIm values.(Gorpas et al., 2016a) This can be observed in fig1, fig2 and videos 1 and 2.
Figure 2. Representative breast specimen manually scanned by hand.
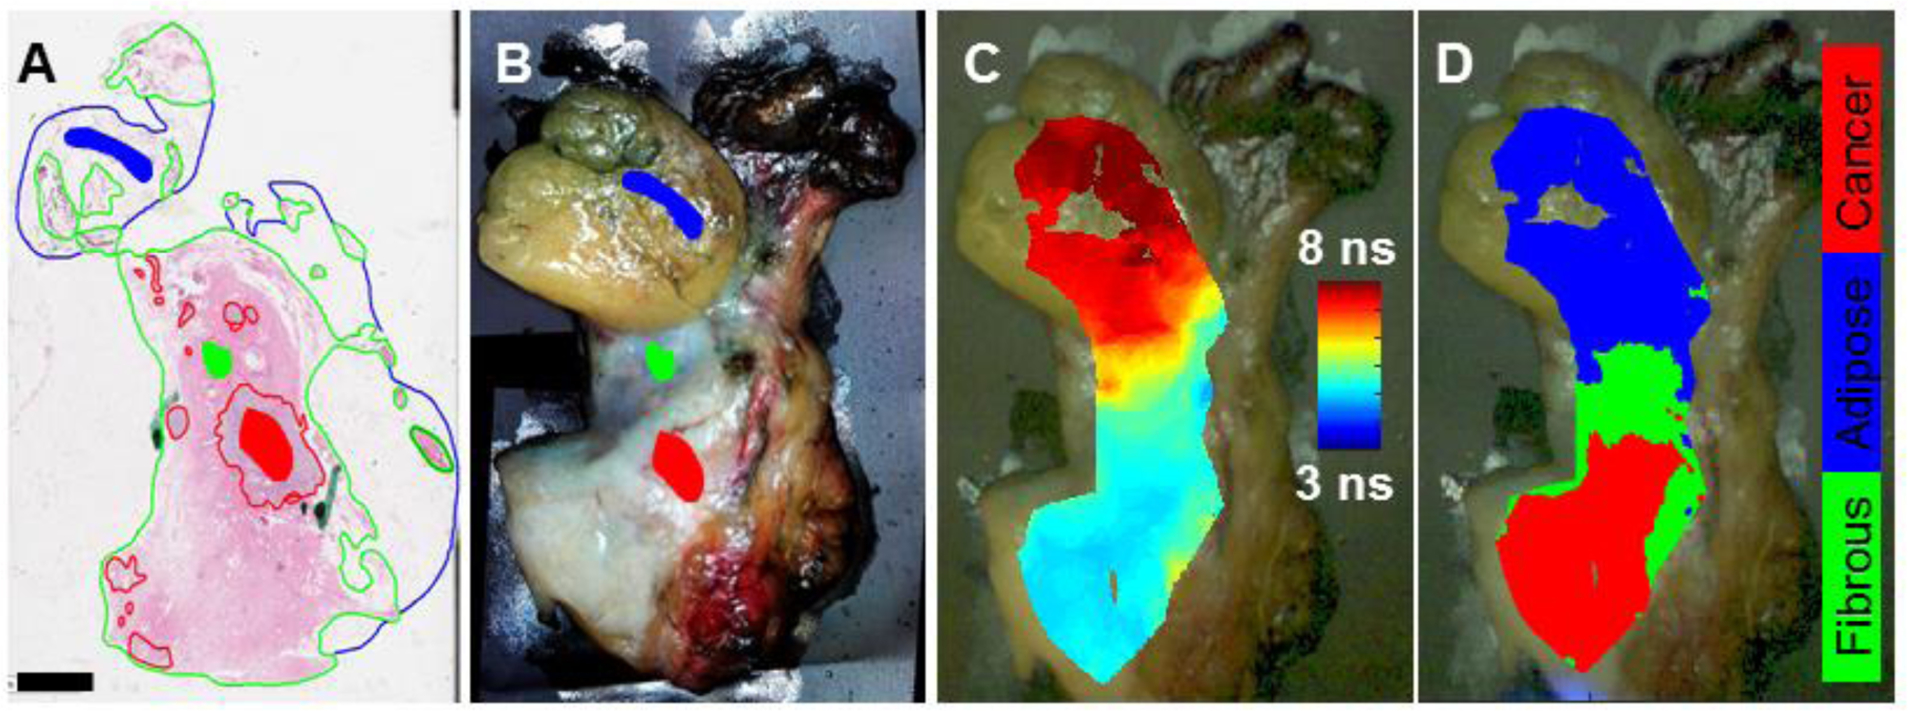
(A) H&E histology section from breast specimen overlayed with pathologist tracings and the regions of interest selected for the study (filled-in shapes). Scale bar = 4 mm. (B) The corresponding white light image of the breast specimen augmented with the regions of interest identified by the pathologist tracings. (C) White light image augmented with FLIm data from detection channel 2; (D) white light image augmented with the classification results when this specimen was left out of the training set.
FLIm parameters.
Following the acquisition of the fluorescence decay signal, constrained least-squares deconvolution based on the Laguerre expansion method was performed to determine the fluorescence response of the tissue (Liu et al., 2012). From the deconvolved fluorescence decay, the average lifetimes and intensity ratios were derived. The average lifetime is the average amount of time a fluorophore spends in the excited state. The probability distribution of detected photons is obtained by normalizing the deconvolved fluorescence intensity decay. The average lifetime is then defined as the expected value of this distribution (Lakowicz, 1999). Intensity ratios were computed by taking the ratio of the fluorescence intensity at each channel divided by the sum of all four intensity channels.
Statistics.
Support vector machines (SVM) with a RBF kernel (Chang and Lin, 2011) were used to classify FLIm data into three groups based on training from histology: adipose, fibrous and cancerous. The feature vector included average fluorescence lifetime from channels 1, 2, 3 and 4. Multiclass classification was realized through the “one-against-one” strategy (Hsu and Lin, 2002). The cancerous regions included both invasive cancer and ductal carcinoma in situ. Sensitivity, specificity, positive predictive value and negative predictive value were calculated with leave one out cross-validation. This involved sequentially leaving data from a single patient out of the training set, then testing the classification accuracy on that single patient for all patients. Since multiple specimens were imaged for N=5 patients, the leave one out cross-validation was performed per patient rather than per specimen. The leave one out cross-validation was performed twice, first with the numbers of pixels per group in the training set imbalanced and next with balanced numbers between groups. The numbers of pixels per group were forced to be balanced by randomly sampling by randomly sampling 31 pixels per group from each sample, the size of the smallest group per sample in the dataset (Chawla et al., 2004). Average fluorescence lifetime values are presented as mean ± standard deviation. To remove dependence between pixels, the median from each patient from each group was used as the outcome variable and a non-parametric Kruskal-Wallis test was performed to determine statistical significance between groups because the data was not normally distributed, as determined with a Kolmogorov-Smirnov test. Post-hoc Mann–Whitney U-tests were performed to determine the p values for the outcome variables (median values) from each set of groups. Image analysis, classification and statistical analyses were performed using MATLAB (The Mathworks, Inc.). The classification algorithm and results (Tables 2 and 3) only included data from a 0.5 mm border within the pathologist tracings of the histology. Data that was scanned by hand was thresholded to remove artifacts that occur at the edges of the specimen (see fig2). The classification algorithm was validated for the ROIs carefully co-registered with histology, however classification was also performed for all pixels acquired for each specimen (fig1C and fig2D).
Table 2.
Results from leave-one-out cross validation with a Gaussian SVM (numbers of pixels per group imbalanced).
| Sensitivity analysis | Specificity analysis | |||||||
|---|---|---|---|---|---|---|---|---|
| No. | No. | |||||||
| Accuracya | PPVa | SEa | TP | FN | SPa | TN | FP | |
| cancer | 99.0 (99.0–99.1) | 98.5 (98.4–98.5) | 100.0 (100.0–100.0) | 70555 | 1 | 97.4 (97.3–97.5) | 40819 | 1093 |
| adipose | 99.3 (99.3–99.4) | 99.9 (99.9–100.0) | 97.2 (97.1–97.3) | 25250 | 723 | 100.0 (100.0–100.0) | 86479 | 16 |
| fibrous | 99.7 (99.6–99.7) | 100.0 (100.0–100.0) | 97.6 (97.5–97.7) | 15552 | 387 | 100.0 (100.0–100.0) | 96527 | 2 |
Abbreviations: PPV, positive predictive value; SE, sensitivity; TP, true positive; FN, false negative; SP, specificity; TN, true negatives; FP, false positives.
Value expressed as: % (95% CI)
Table 3.
Results from leave-one-out cross validation with a Gaussian SVM (numbers of pixels per group balanced with 31 pixels per group from each sample).
| Sensitivity analysis | Specificity analysis | |||||||
|---|---|---|---|---|---|---|---|---|
| No. | No. | |||||||
| Accuracya | PPVa | SEa | TP | FN | SPa | TN | FP | |
| cancer | 97.8 (96.9–98.5) | 93.1 (91.7–94.4) | 100.0 (99.7–100.0) | 434 | 0 | 96.9 (95.8–97.7) | 991 | 32 |
| adipose | 99.9 (99.6–100.0) | 100.0 (100.0–100.0) | 99.8 (99.4–100.0) | 526 | 1 | 100.0 (99.7–100.0) | 930 | 0 |
| fibrous | 97.7 (96.8–98.4) | 99.8 (99.3–100.0) | 93.5 (92.1–94.7) | 464 | 32 | 99.9 (99.5–100.0) | 960 | 1 |
Abbreviations: PPV, positive predictive value; SE, sensitivity; TP, true positive; FN, false negative; SP, specificity; TN, true negatives; FP, false positives.
Value expressed as: % (95% CI)
Results
See videos 1 and 2 for a demonstration of data being recorded and simultaneously displayed on the video feed of samples imaged by hand and by the automated stage, respectively. Regions of interest were selected from each of the specimens for a total of N=14,688 pixels associated with fibrous tissue, N=67,465 associated with cancerous tissue and N=24,311 associated with adipose tissue. Average spatial resolution was approximately 60 points/mm2.
Average fluorescence lifetime.
The mean average lifetime values for each spectral detection channel from within 0.5 mm borders of the pathologist tracings on the FLIm images co-registered with histology (fig3) were computed. Average fluorescence lifetime from detection channel 1 identifies fibrous regions with the highest values and adipose with lowest values. For spectral channels 2, 3 and 4 the lifetimes from adipose are highest, fibrous in the middle and cancer the lowest. Fig1 and fig2 demonstrate representative examples. The Kruskal-Wallis test found that the fluorescence lifetimes were significantly different (p<0.001). Additionally, the rank sum test, found that the differences in all detection channels between all groups were statistically significantly different (p<0.001) for all groups excluding fibrous compared to cancer in channel 1 (p=0.64).
Figure 3. Average fluorescence lifetime from adipose, fibrous and cancerous breast tissue.
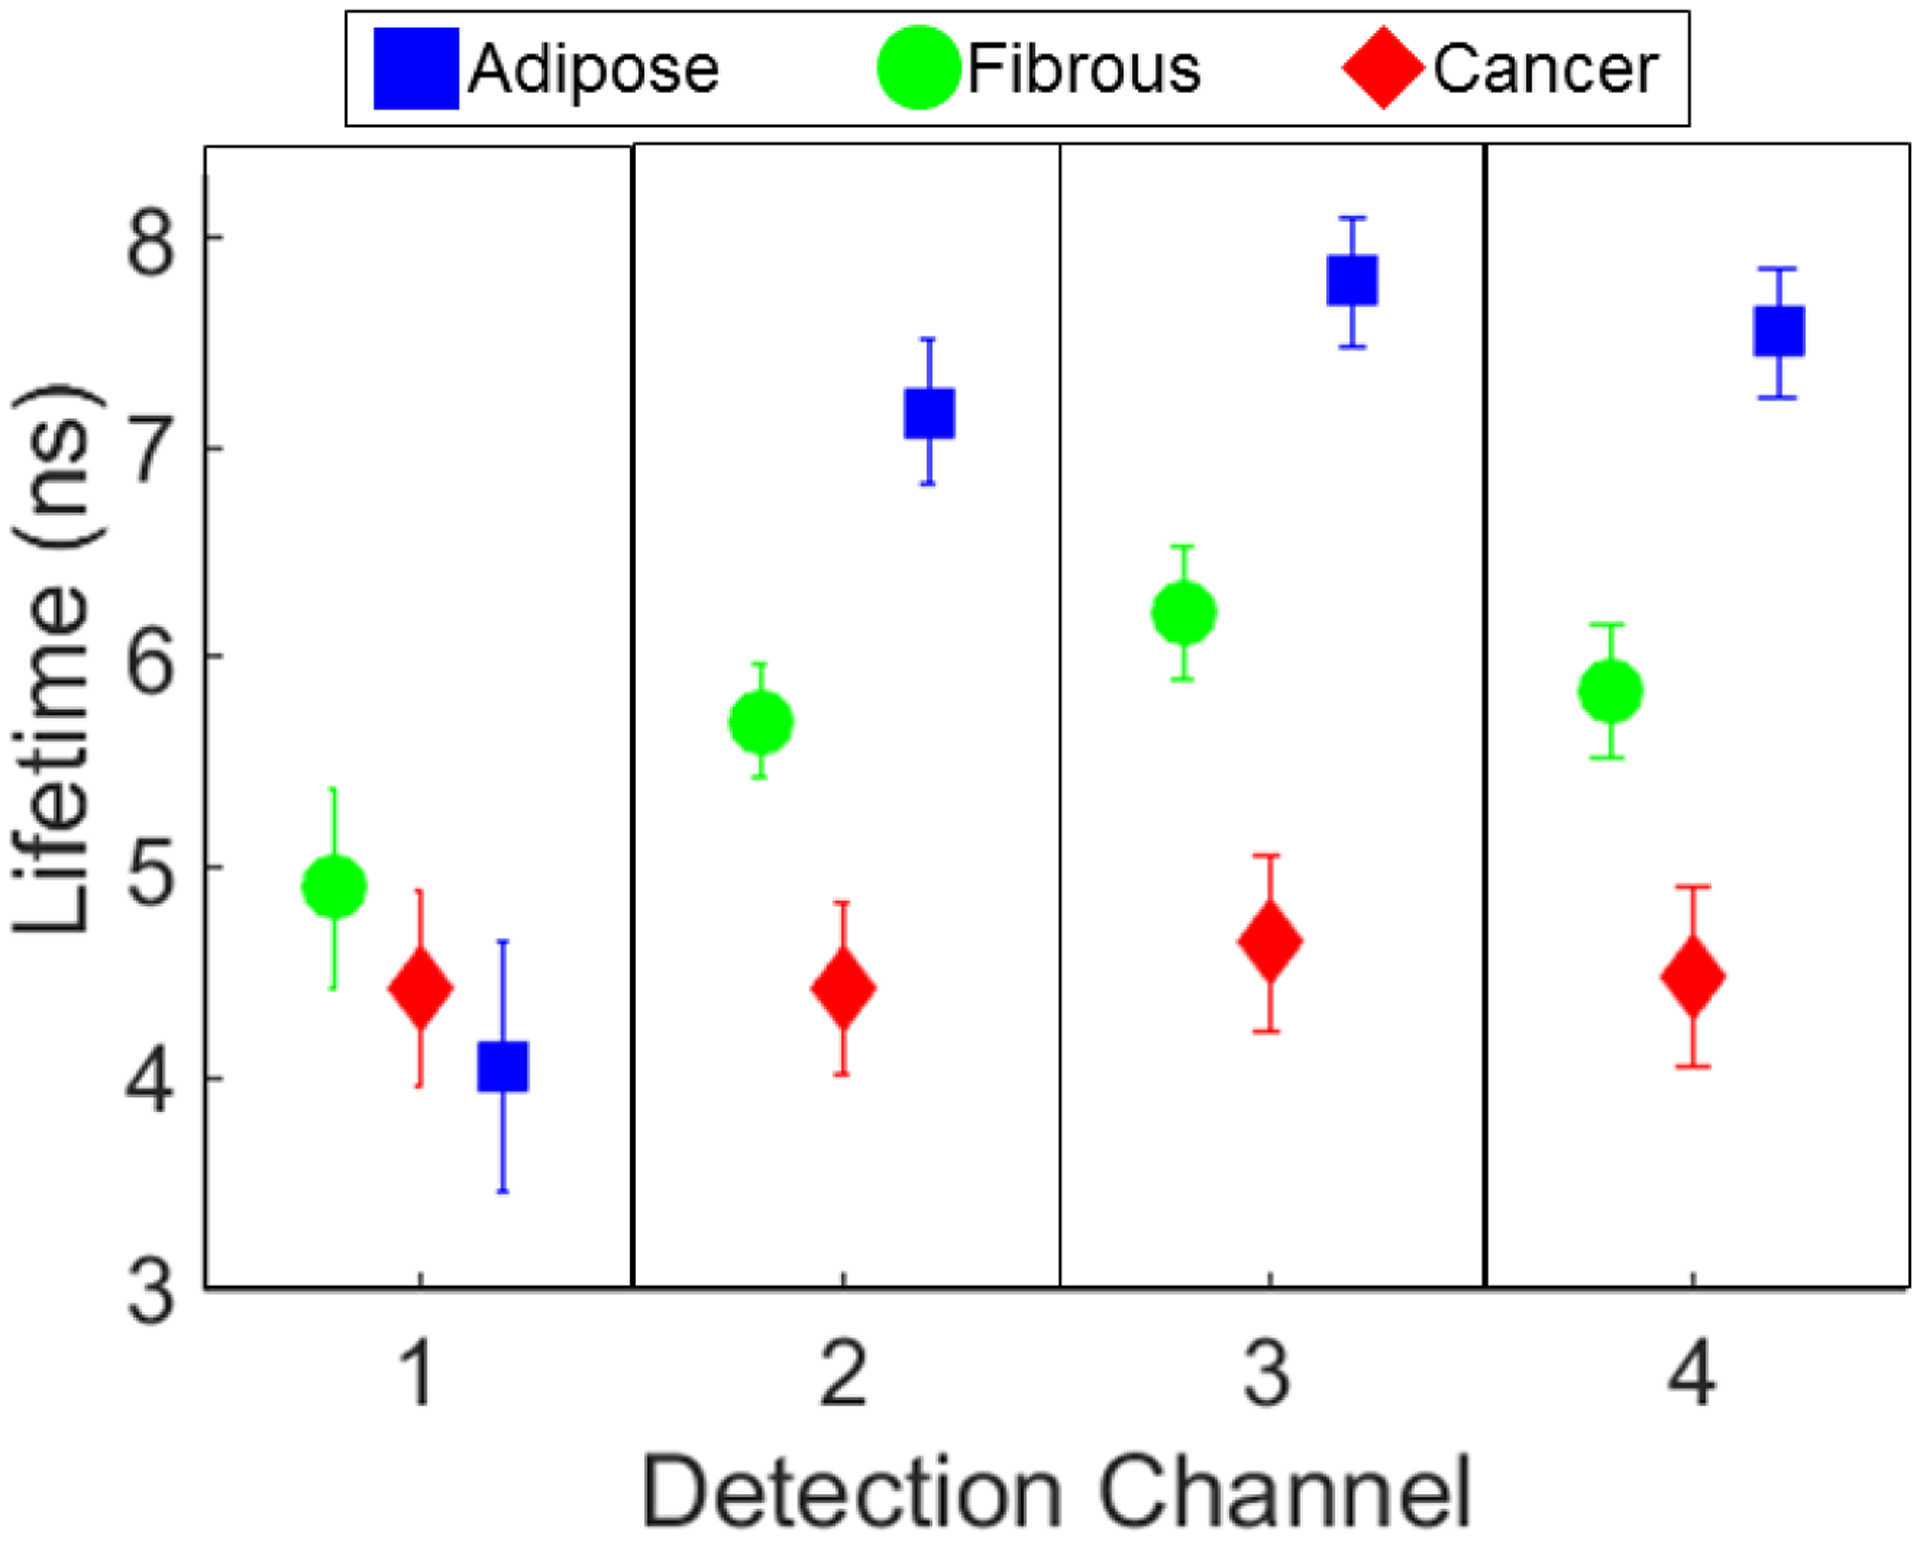
This plot includes all data from the ROIs co-registered with histology and included in the classification algorithm. Fibrous: green circles, adipose: blue squares, and cancerous: red diamonds. Fluorescence lifetime (ns) can be seen to vary between the 3 breast tissue types. P<0.001 except for between fibrous and cancer in channel 1.
Classification results.
The sensitivity, specificity, positive and negative predictive values for discriminating between adipose, cancerous and fibrous tissue are summarized in table 2. When groups were forced to be balanced by randomly sampling N=31 points per group per sample, the results were slightly different, as summarized in table 3. The SVMs for lifetime values of each set of groups (adipose vs. fibrous, adipose vs. cancer, fibrous vs. cancer) and scatter plots of the fluorescence lifetime data can be seen in fig4.
Figure 4. SVM plots demonstrating discrimination between groups.
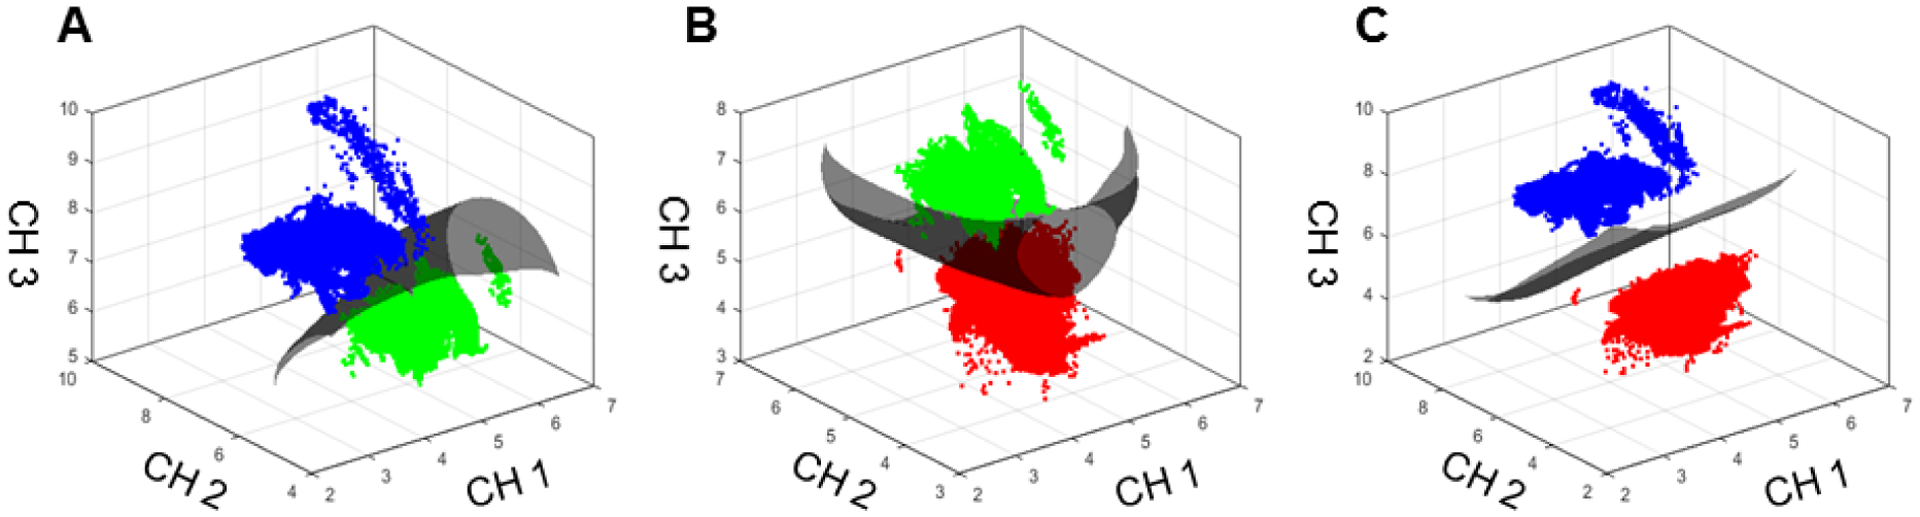
These plots demonstrate the SVMs that separate the three groups: (A) Adipose (blue) and fibrous (green), (B) fibrous and cancer (red), (C) adipose and cancer. The axes represent fluorescence lifetime (ns) in detection channels 1, 2 and 3.
Histology co-registration.
The pathologist (M.D.) compared histology sections from 3 levels within the 300 μm imaged region and found that the breast tissue did not vary significantly in these N=2 samples to warrant cutting multiple levels from each sample. Thus for the remaining N=18 samples, the first complete section from the paraffin block was used to interpret the results of the entire 300 μm imaged volume.
Discussion
This study demonstrates that spectroscopic features derived from FLIm images are capable of being used to distinguish between adipose, fibrous and cancerous regions in breast specimens from women undergoing lumpectomies and mastectomies. The system is compatible with intraoperative applications. It allows for hand scanning the surgical bed with a fiber optic or automatic scanning of resected ex vivo tissue specimens on a mechanical stage. Fluorescence lifetime information is displayed as the scanning is conducted and a classification algorithm was developed to automate distinction between these three tissue types. The classification algorithm worked equally well for data acquired via hand scanning and automated stage scanning. The classification is able to be performed fast enough that it could be implemented in real time as the measurements are acquired, which shows the potential of this technology as an intraoperative tool either during surgery or on resected specimens for tumor margins assessment.
The ability of this FLIm technique to distinguish between breast tissue types is due to the endogenous fluorescence of the fluorophores that comprise those tissues, specifically: fat cells, collagen fibers, NADH and FAD. Adipose tissue is connective tissue predominantly composed of fat cells. From our histologic co-registration, we see that the adipose tissue tends to fluoresce with long lifetimes at the longer wavelengths detected in spectral channels 2, 3 and 4 of the FLIm apparatus (fig3), as is consistent with previous studies of adipose tissue fluorescence (Datta et al., 2015; Swatland, 1987). Fibrous tissue is composed of bundles of collagen fibers, and fluoresces with a lifetime longer than cancer, but shorter than adipose tissue, based on our histologic co-registration (fig3). Importantly, this FLIm technique can clearly distinguish between fibrous and cancer, unlike some other optical techniques (fig3, fig4B). Cancer cells have altered NADH and FAD metabolism in comparison to normal tissue according to the Warburg theory (Druzhkova et al., 2016). Free NADH and bound FAD have relatively short lifetimes and fluoresce predominantly in the wavelengths detected by channels 2, 3 and 4, which may explain the shorter lifetimes of cancerous breast tissue in these channels, though we cannot determine NADH and FAD presence with histologic methods (Skala et al., 2007). While the trends in fluorescence lifetime detected in spectral channel 1 were also statistically significant, channels 2, 3, and 4 exhibit the greatest amount of separation between groups.
The margin of healthy tissue around the lumpectomy specimens necessary for negative margins has been controversial. As recently as 2013, standard of care required breast cancer margins to be 1–2 mm in depth, depending on the cancer type and surgeon. However, recent studies demonstrated that a “no ink on tumor” margin for lumpectomy specimens leads to patient outcomes equivalent to those from the previous 1–2 mm guideline (Moran et al., 2014). The “no ink on tumor” guideline defines negative cancer margins as occurring when there are no tumor cells touching the ink used to mark the entire lumpectomy specimen. The 355 nm FLIm imaging system excitation light penetrates approximately 300 microns into the breast tissue and thus will identify cancer cells right at the surface, in the same region as the “no ink on tumor” guideline suggests. Thus this FLIm system can probe the same region of tissue important for determining margin status based on current clinical guidelines.
The scanning speed of the FLIm system can be varied based on parameters input to the mechanical stage or by the person performing the hand scanning. Two representative speeds can be seen in videos 1 and 2. While mechanical stage scanning is slower in this case, the resolution is higher in comparison to the hand scanning, which is faster but with lower resolution. Thus we anticipate hand scanning would be performed to identify positive margins in the operating room or frozen section room immediately following tissue resection and mechanical stage scanning would be reserved for cases where higher resolution is necessary, such as if in the future it is determined that FLIm can be used to study specifics of cancer type as well as positive or negative margins. However, the limiting factor of the slow mechanical stage scanning was the stage itself; with an improved stage, the FLIm system would be capable of operating at much faster speeds that could allow for the higher resolution scans to be obtained from both the operating room and frozen section room.
We acknowledge that a limitation to this study is the fact that only small regions of tissue within the traced outlines of each tissue type were included in the classification analysis (see fig1F and fig2A). This study design was used to reduce errors caused by co-registration between the FLIm data and histology that are predominantly caused by: 1) tissue shrinkage and warping during histological processing, 2) the use of a single 4 μm histology section to represent the entire imaged volume and 3) the use of a computer mouse to trace the relevant tissue types, which does not allow for very detailed lines to be drawn with the Aperio software. Additionally, while we hypothesize that NADH and FAD allow us to distinguish cancerous from fibrous and adipose tissue based on known fluorescence lifetime properties of these molecules, we can’t verify this without chemical analysis. We also acknowledge that these results will need to be validated in a larger cohort, and we aim to move to entire lumpectomy specimens rather than sections of lumpectomy and mastectomy specimens for this work. A larger cohort will also enable the study of whether DCIS and invasive cancer can be distinguished using this technique. In the current study, nevertheless, cancerous tissue, regardless of cancer type, was discriminated from normal breast tissue (both fibrous and adipose).
In conclusion, normal fibrous and adipose tissue was able to be distinguished from cancerous breast tissue with accuracy > 97% with a classification algorithm designed using FLIm derived parameters. The FLIm measurements can be acquired within minutes either by hand or automated scanning of a fiber optic, without the need for contrast agents or dyes and without damaging tissue. Additionally, the FLIm signal is generated from the region of breast specimens appropriate for current guidelines for determining tumor margin status. All combined, these results indicate that the current technique has great potential for further application in the field of surgical breast oncology to reduce rates of re-excision by determining tumor margin status intraoperatively either during surgery or on resected tissue specimens.
References
- Allen WM, Chin L, Wijesinghe P, Kirk RW, Latham B, Sampson DD, Saunders CM and Kennedy BF 2016. Wide-field optical coherence micro-elastography for intraoperative assessment of human breast cancer margins Biomed Opt Express 7 4139–53 [DOI] [PMC free article] [PubMed] [Google Scholar]
- Azu M, Abrahamse P, Katz SJ, Jagsi R and Morrow M 2010. What is an adequate margin for breast-conserving surgery? Surgeon attitudes and correlates Ann Surg Oncol 17 558–63 [DOI] [PMC free article] [PubMed] [Google Scholar]
- Brown JQ, Bydlon TM, Richards LM, Yu B, Kennedy SA, Geradts J, Wilke LG, Junker M, Gallagher J, Barry W and Ramanujam N 2010. Optical assessment of tumor resection margins in the breast IEEE J Sel Top Quantum Electron 16 530–44 [DOI] [PMC free article] [PubMed] [Google Scholar]
- Chang CC and Lin CJ 2011. LIBSVM: A Library for Support Vector Machines Acm T Intel Syst Tec 2 [Google Scholar]
- Chawla NV, Japkowicz N and Kotcz A 2004. Editorial: special issue on learning from imbalanced data sets SIGKDD Explor. Newsl 6 1–6 [Google Scholar]
- Datta R, Alfonso-Garcia A, Cinco R and Gratton E 2015. Fluorescence lifetime imaging of endogenous biomarker of oxidative stress Sci Rep-Uk 5 [DOI] [PMC free article] [PubMed] [Google Scholar]
- Davis SC, Gibbs SL, Gunn JR and Pogue BW 2013. Topical dual-stain difference imaging for rapid intra-operative tumor identification in fresh specimens Opt Lett 38 5184–7 [DOI] [PMC free article] [PubMed] [Google Scholar]
- de Boer LL, Hendriks BHW, van Duijnhoven F, Peeters-Baas MJTFDV, Van de Vijver K, Loo CE, Jozwiak K, Sterenborg HJCM and Ruers TJM 2016. Using DRS during breast conserving surgery: identifying robust optical parameters and influence of inter-patient variation Biomedical Optics Express 7 5188–200 [DOI] [PMC free article] [PubMed] [Google Scholar]
- Druzhkova IN, Shirmanova MV, Lukina MM, Dudenkova VV, Mishina NM and Zagaynova EV 2016. The metabolic interaction of cancer cells and fibroblasts - coupling between NAD(P)H and FAD, intracellular pH and hydrogen peroxide Cell Cycle 15 1257–66 [DOI] [PMC free article] [PubMed] [Google Scholar]
- Erickson-Bhatt SJ, Nolan RM, Shemonski ND, Adie SG, Putney J, Darga D, McCormick DT, Cittadine AJ, Zysk AM, Marjanovic M, Chaney EJ, Monroy GL, South FA, Cradock KA, Liu ZG, Sundaram M, Ray PS and Boppart SA 2015. Real-time Imaging of the Resection Bed Using a Handheld Probe to Reduce Incidence of Microscopic Positive Margins in Cancer Surgery Cancer Res 75 3706–12 [DOI] [PMC free article] [PubMed] [Google Scholar]
- Fitzmaurice C, Allen C, Barber RM, Barregard L, Bhutta ZA, Brenner H, Dicker DJ, Chimed-Orchir O, Dandona R, Dandona L, Fleming T, Forouzanfar MH, Hancock J, Hay RJ, Hunter-Merrill R, Huynh C, Hosgood HD, Johnson CO, Jonas JB, Khubchandani J, Kumar GA, Kutz M, Lan Q, Larson HJ, Liang X, Lim SS, Lopez AD, MacIntyre MF, Marczak L, Marquez N, Mokdad AH, Pinho C, Pourmalek F, Salomon JA, Sanabria JR, Sandar L, Sartorius B, Schwartz SM, Shackelford KA, Shibuya K, Stanaway J, Steiner C, Sun J, Takahashi K, Vollset SE, Vos T, Wagner JA, Wang H, Westerman R, Zeeb H, Zoeckler L, Abd-Allah F, Ahmed MB, Alabed S, Alam NK, Aldhahri SF, Alem G, Alemayohu MA, Ali R, Al-Raddadi R, Amare A, Amoako Y, Artaman A, Asayesh H, Atnafu N, Awasthi A, Saleem HB, Barac A, Bedi N, Bensenor I, Berhane A, Bernabe E, Betsu B, Binagwaho A, Boneya D, Campos-Nonato I, Castaneda-Orjuela C, Catala-Lopez F, Chiang P, Chibueze C, Chitheer A, Choi JY, Cowie B, Damtew S, das Neves J, Dey S, Dharmaratne S, Dhillon P, Ding E, Driscoll T, Ekwueme D, Endries AY, Farvid M, Farzadfar F, Fernandes J, Fischer F, TT GH, Gebru A, Gopalani S, Hailu A, Horino M, Horita N, Husseini A, Huybrechts I, Inoue M, Islami F, Jakovljevic M, James S, Javanbakht M, Jee SH, Kasaeian A, Kedir MS, Khader YS, Khang YH, Kim D, Leigh J, Linn S, Lunevicius R, El Razek HM, Malekzadeh R, Malta DC, Marcenes W, Markos D, Melaku YA, Meles KG, Mendoza W, Mengiste DT, Meretoja TJ, Miller TR, Mohammad KA, Mohammadi A, Mohammed S, Moradi-Lakeh M, Nagel G, Nand D, Le Nguyen Q, Nolte S, Ogbo FA, Oladimeji KE, Oren E, Pa M, Park EK, Pereira DM, Plass D, Qorbani M, Radfar A, Rafay A, Rahman M, Rana SM, Soreide K, Satpathy M, Sawhney M, Sepanlou SG, Shaikh MA, She J, Shiue I, Shore HR, Shrime MG, So S, Soneji S, Stathopoulou V, Stroumpoulis K, Sufiyan MB, Sykes BL, Tabares-Seisdedos R, Tadese F, Tedla BA, Tessema GA, Thakur JS, Tran BX, Ukwaja KN, Uzochukwu BS, Vlassov VV, Weiderpass E, Wubshet Terefe M, Yebyo HG, Yimam HH, Yonemoto N, Younis MZ, Yu C, Zaidi Z, Zaki ME, Zenebe ZM, Murray CJ and Naghavi M 2016. Global, Regional, and National Cancer Incidence, Mortality, Years of Life Lost, Years Lived With Disability, and Disability-Adjusted Life-years for 32 Cancer Groups, 1990 to 2015: A Systematic Analysis for the Global Burden of Disease Study JAMA oncology [DOI] [PMC free article] [PubMed] [Google Scholar]
- Ghosh N, Mohanty SK, Majumder SK and Gupta PK 2001. Measurement of optical transport properties of normal and malignant human breast tissue Appl Opt 40 176–84 [DOI] [PubMed] [Google Scholar]
- Glaser AK, Reder NP, Chen Y, McCarty EF, Yin C, Wei L, Wang Y, True LD and Liu JTC 2017. Light-sheet microscopy for slide-free non-destructive pathology of large clinical specimens 1 0084. [DOI] [PMC free article] [PubMed] [Google Scholar]
- Gorpas D, Fatakdawala H, Zhang YH, Bold R and Marcu L 2015. Fluorescence lifetime spectroscopy for breast cancer margins assessment Proc Spie 9318 [Google Scholar]
- Gorpas D, Ma D, Bec J, Yankelevich D and Marcu L 2016a. Real-Time Visualization of Tissue Surface Biochemical Features Derived from Fluorescence Lifetime Measurements IEEE T Med Imaging doi: 10.1109/TMI.2016.2530621 [DOI] [PMC free article] [PubMed] [Google Scholar]
- Gorpas D, Ma D, Bec J, Yankelevich DR and Marcu L 2016b. Real-Time Visualization of Tissue Surface Biochemical Features Derived From Fluorescence Lifetime Measurements IEEE Trans Med Imaging 35 1802–11 [DOI] [PMC free article] [PubMed] [Google Scholar]
- Houssami N, Macaskill P, Marinovich ML and Morrow M 2014. The association of surgical margins and local recurrence in women with early-stage invasive breast cancer treated with breast-conserving therapy: a meta-analysis Ann Surg Oncol 21 717–30 [DOI] [PMC free article] [PubMed] [Google Scholar]
- Hsu CW and Lin CJ 2002. A comparison of methods for multiclass support vector machines Ieee T Neural Networ 13 415–25 [DOI] [PubMed] [Google Scholar]
- Keller MD, Majumder SK, Kelley MC, Meszoely IM, Boulos FI, Olivares GM and Mahadevan-Jansen A 2010. Autofluorescence and Diffuse Reflectance Spectroscopy and Spectral Imaging for Breast Surgical Margin Analysis Laser Surg Med 42 15–23 [DOI] [PubMed] [Google Scholar]
- Kennedy S, Caldwell M, Bydlon T, Mulvey C, Mueller J, Wilke L, Barry W, Ramanujam N and Geradts J 2016. Correlation of breast tissue histology and optical signatures to improve margin assessment techniques J Biomed Opt 21 66014. [DOI] [PMC free article] [PubMed] [Google Scholar]
- Kong K, Zaabar F, Rakha E, Ellis I, Koloydenko A and Notingher I 2014. Towards intra-operative diagnosis of tumours during breast conserving surgery by selective-sampling Raman micro-spectroscopy Physics in Medicine and Biology 59 6141–52 [DOI] [PubMed] [Google Scholar]
- Lakowicz JR 1999. Principles of Fluorescence Spectroscopy: Springer, New York: ) [Google Scholar]
- Liu J, Sun Y, Qi J and Marcu L 2012. A novel method for fast and robust estimation of fluorescence decay dynamics using constrained least-squares deconvolution with Laguerre expansion Phys Med Biol 57 843–65 [DOI] [PMC free article] [PubMed] [Google Scholar]
- Ma D, Bec J, Gorpas D, Yankelevich D and Marcu L 2015. Technique for real-time tissue characterization based on scanning multispectral fluorescence lifetime spectroscopy (ms-TRFS) Biomed Opt Express 6 987–1002 [DOI] [PMC free article] [PubMed] [Google Scholar]
- Moran MS, Schnitt SJ, Giuliano AE, Harris JR, Khan SA, Horton J, Klimberg S, Chavez-MacGregor M, Freedman G, Houssami N, Johnson PL and Morrow M 2014. Society of Surgical Oncology-American Society for Radiation Oncology consensus guideline on margins for breast-conserving surgery with whole-breast irradiation in stages I and II invasive breast cancer Ann Surg Oncol 21 704–16 [DOI] [PubMed] [Google Scholar]
- Morrow M, Jagsi R, Alderman AK, Griggs JJ, Hawley ST, Hamilton AS, Graff JJ and Katz SJ 2009. Surgeon recommendations and receipt of mastectomy for treatment of breast cancer JAMA 302 1551–6 [DOI] [PMC free article] [PubMed] [Google Scholar]
- Nguyen FT, Zysk AM, Chaney EJ, Kotynek JG, Oliphant UJ, Bellafiore FJ, Rowland KM, Johnson PA and Boppart SA 2009. Intraoperative evaluation of breast tumor margins with optical coherence tomography Cancer Res 69 8790–6 [DOI] [PMC free article] [PubMed] [Google Scholar]
- Nichols BS, Llopis A, Palmer GM, McCachren SS 3rd, Senlik O, Miller D, Brooke MA, Jokerst NM, Geradts J, Greenup R and Ramanujam N 2017. Miniature spectral imaging device for wide-field quantitative functional imaging of the morphological landscape of breast tumor margins J Biomed Opt 22 26007. [DOI] [PMC free article] [PubMed] [Google Scholar]
- O’Kelly Priddy CM, Forte VA and Lang JE 2015. The importance of surgical margins in breast cancer J Surg Oncol [DOI] [PMC free article] [PubMed] [Google Scholar]
- Palmer GM, Zhu C, Breslin TM, Xu F, Gilchrist KW and Ramanujam N 2006. Monte Carlo-based inverse model for calculating tissue optical properties. Part II: Application to breast cancer diagnosis Appl Opt 45 1072–8 [DOI] [PubMed] [Google Scholar]
- Sharma V, Shivalingaiah S, Peng Y, Euhus D, Gryczynski Z and Liu H 2012. Auto-fluorescence lifetime and light reflectance spectroscopy for breast cancer diagnosis: potential tools for intraoperative margin detection Biomed Opt Express 3 1825–40 [DOI] [PMC free article] [PubMed] [Google Scholar]
- Skala MC, Riching KM, Gendron-Fitzpatrick A, Eickhoff J, Eliceiri KW, White JG and Ramanujam N 2007. In vivo multiphoton microscopy of NADH and FAD redox states, fluorescence lifetimes, and cellular morphology in precancerous epithelia P Natl Acad Sci USA 104 19494–9 [DOI] [PMC free article] [PubMed] [Google Scholar]
- St John ER, Al-Khudairi R, Ashrafian H, Athanasiou T, Takats Z, Hadjiminas DJ, Darzi A and Leff DR 2017. Diagnostic Accuracy of Intraoperative Techniques for Margin Assessment in Breast Cancer Surgery: A Meta-analysis Ann Surg 265 300–10 [DOI] [PubMed] [Google Scholar]
- Swatland HJ 1987. Autofluorescence of Adipose-Tissue Measured with Fiber Optics Meat Sci 19 277–84 [DOI] [PubMed] [Google Scholar]
- Wong TTW, Zhang R, Hai P, Zhang C, Pleitez MA, Aft RL, Novack DV and Wang LV 2017. Fast label-free multilayered histology-like imaging of human breast cancer by photoacoustic microscopy Sci Adv 3 e1602168. [DOI] [PMC free article] [PubMed] [Google Scholar]
- Yankelevich DR, Ma D, Liu J, Sun Y, Sun Y, Bec J, Elson DS and Marcu L 2014. Design and evaluation of a device for fast multispectral time-resolved fluorescence spectroscopy and imaging Rev Sci Instrum 85 034303. [DOI] [PMC free article] [PubMed] [Google Scholar]
- Zysk AM, Chen K, Gabrielson E, Tafra L, Gonzalez EAM, Canner JK, Schneider EB, Cittadine AJ, Carney PS, Boppart SA, Tsuchiya K, Sawyer K and Jacobs LK 2015. Intraoperative Assessment of Final Margins with a Handheld Optical Imaging Probe During Breast-Conserving Surgery May Reduce the Reoperation Rate: Results of a Multicenter Study Annals of Surgical Oncology 22 3356–62 [DOI] [PMC free article] [PubMed] [Google Scholar]