Abstract
Background
The interrelation between the worldwide incidence, mortality, and survival of patients with multiple myeloma (MM) and relevant factors such as Health Care Access and Quality (HAQ) index, gross domestic product (GDP), health care expenditures, access to cancer drugs, and patient empowerment has not been addressed before.
Material and Methods
Epidemiologic data were obtained from the International Agency for Research on Cancer. The mortality‐to‐incidence ratio (expressed as 1‐MIR) was used as proxy for 5‐year survival. Information on health expenditure was obtained from Bloomberg Health‐Care Efficacy ranking, the HAQ Index was used as a measure of available health care. For patient empowerment, visits to the Web site of the International Myeloma Foundation were used as proxy. Data on GDP and population per country were assessed from the International Monetary Fund and the United Nations Population Division, respectively. Possible associations were analyzed using Spearman's rank‐order correlation.
Results
The worldwide incidence of MM is currently 160,000, and mortality is 106,000. Age‐standardized myeloma incidence varies between 0.54 and 5.3 per 100,000 and correlates with 1‐MIR, patient empowerment, HAQ Index, and access to cancer drugs. The 1‐MIR varies between 9% and 64% and is closely related to myeloma incidence, HAQ Index, patient empowerment, access to cancer drugs, and health care expenditures.
Conclusion
The global incidence and outcome of MM shows significant disparities, indicating under‐recognition and suboptimal treatment in many parts of the globe. Results also highlight the importance of economic resources, access to and quality of health care, and patient education for improving diagnosis and survival of patients with MM.
Implications for Practice
Multiple myeloma accounts for 10% of all hematological malignancies and has moved to the forefront of clinical interest because of the significant advances in medical treatment. Diagnosis depends on laboratory tests, imaging, and professional expertise, particularly in patients without a significant M‐component. The present data show a substantial worldwide variation in incidence and mortality, that is mainly due (apart from variations due to ethnicity and lifestyle) to disparities in access to and quality of health care, a parameter strongly related to the economic development of individual countries. Improvement of quality of care and, consequently, in outcome is associated with patient empowerment.
Keywords: Multiple myeloma, Incidence, Mortality, Mortality‐to‐incidence ratio, Patient empowerment, Health care quality and access
Short abstract
This article evaluates possible relationships between epidemiologic data on multiple myeloma and relevant factors, such as health care access and quality, economic resources, access to cancer drugs, and patient empowerment in different countries. This report informs about the complex interplay between these factors and provides the necessary basics for improving diagnosis, management, and outcome of patients with multiple myeloma in many areas of the world.
Introduction
The International Agency for Research on Cancer (IARC) estimated the worldwide incidence of multiple myeloma (MM) amounted to 160,000 cases and the global myeloma mortality amounted to 106,000 patients for the year 2018 1. This translates in a global age‐standardized incidence and mortality rate of 2.1 per 100,000 and 1.39 per 100,000, respectively. Incidence and mortality rates vary significantly between individual countries and depend on various factors. As detailed information on the interrelations between epidemiologic data of MM with health care access and quality, economic resources such as gross domestic product (GDP), access to drugs, and information on patient empowerment in different countries is not available, we aimed to evaluate possible relationships. We used the mortality/incidence ratio (1‐MIR) as proxy for overall survival 2, 3, 4, which is generally accepted as a high‐level comparative measure to identify disparities in cancer outcomes 5, and the visits to the Web site of the International Myeloma Foundation (IMF) 6 as proxy for patient empowerment. Results should inform about the complex interplay between these factors and provide the necessary basics for improving diagnosis, management, and outcome of patients with multiple myeloma in many areas of the world.
Materials and Methods
Incidence and mortality data were obtained from the IARC 7. Data on the GDP per capita were accessed from the International Monetary Fund 8, and data on population per country were from United Nations Population Division estimates 9. The health expenditure per capita ($) for 2015 was obtained from the Bloomberg Health‐Care Efficacy Ranking 10. In addition, the Health Care Access and Quality (HAQ) Index was used as measure of access to and quality of health care (HC) 11. Because recent survival data are not available for most countries, the mortality‐to‐incidence‐ratio (MIR) was used as proxy for MM outcome 4. The MIR is usually calculated by dividing crude rates or numbers of deaths by crude incidence rates or numbers of incident cases 5. Because crude rates or numbers were not publicly available for all selected countries, the MIR for multiple myeloma was calculated by dividing the standardized mortality rate by the standardized incidence rate in a similar calendar period. Results are shown as 1‐MIR, expressed as a percentage between 0 and 100. Values approaching 0% represent a poor survival rate, and those approaching 100% represent an excellent survival rate. As a measurement of patients’ information about MM and patient empowerment, we used the number of visits per 100,000 inhabitants per country to the Web site of the IMF for 51 countries. Data from these countries, with the exception of Serbia and The Netherlands, were used for correlation studies. For Serbia, national incidence data do not exist, and for The Netherlands, the IACR advised not to use projected data for 2018, as the method used for projection might not have been optimal (Dr. Jacques Ferlay, personal communication). Information on access to cancer drugs for 17 countries was obtained from IQVIA Institute 12. Correlation analyses were conducted with R using Spearman's ρ correlation coefficient.
Results
Global MM Incidence
The estimated age‐standardized incidence rates of multiple myeloma in 2018 are shown in Figure 1 (with permission of the World Health Organization, International Agency for Research on Cancer). The lowest incidence rates were noted in South Korea (0.54/100,000), Malaysia (0.75/100,000), Philippines (0.86/100,000), and China (0.92/100,000), followed by Saudi Arabia (1.0/100,000) and India (1.0/100,000), and highest in New Zealand (5.3/100,000), followed by Australia (5.0/100,000), the U.K. (4.3/100,000), Israel, and Norway (both 4.2/100,000). MM incidence correlated most strongly with 1‐MIR, number of visits to the IFM Web site (patient empowerment), access to cancer drugs, HAQ Index (Fig. 2), and other parameters such as health care expenditures and GDP, as shown in Table 1.
Figure 1.
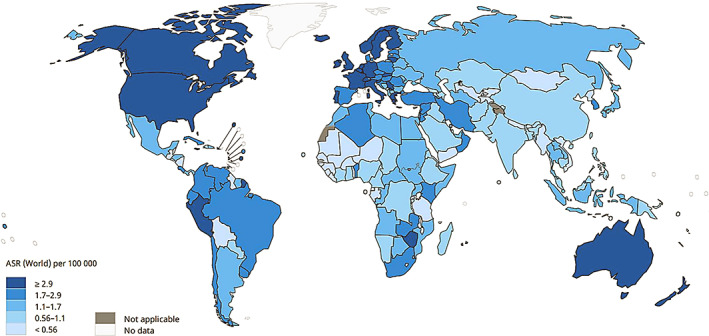
Estimated age‐standardized incidence rates of multiple myeloma 2018.
Used with permission of the International Agency for Research on Cancer/World Health Organization.
Figure 2.
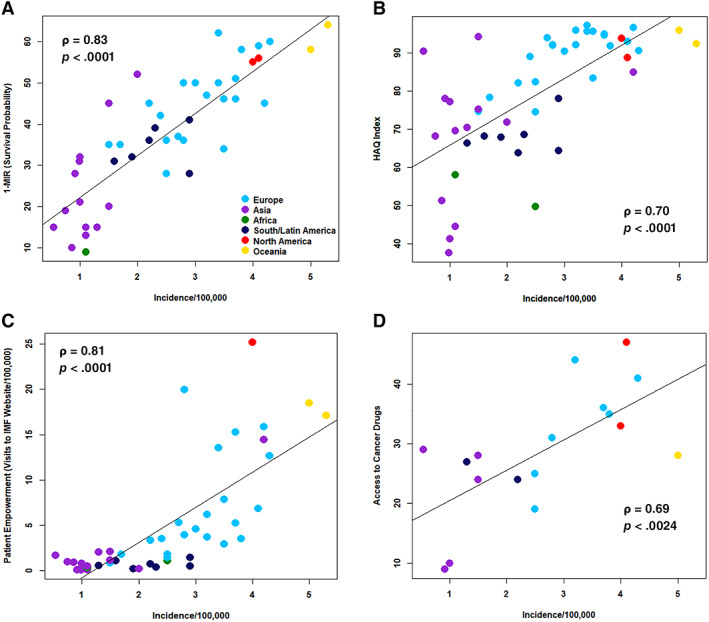
Incidence per 100,000 in relation to 1‐MIR (shown as percentage) (A), HAQ Index (B), visits to the IMF Web site per 100,000 (patient empowerment) (C), and access to cancer drugs (D).
Abbreviations: MIR, mortality‐to‐incidence ratio; IMF, International Myeloma Foundation.
Table 1.
Results of correlation analysis between myeloma incidence and mortality rates and important variables of economic factors, access and quality of health care, and patient empowerment
| Parameters | Incidence | 1‐MIR | GDP | HAQ Index | HC expenditures | Patient empowerment | Access to cancer drugs |
|---|---|---|---|---|---|---|---|
| Incidence | |||||||
| ρ | 0.83 | 0.58 | 0.70 | 0.68 | 0.81 | 0.69 | |
| p value | .0001 | .0001 | .0001 | .0001 | .0001 | .0024 | |
| 1‐MIR | |||||||
| ρ | 0.83 | 0.56 | 0.73 | 0.59 | 0.71 | 0.67 | |
| p value | .0001 | .0001 | .0001 | .0001 | .0001 | .0032 | |
| GDP | |||||||
| ρ | 0.58 | 0.56 | 0.83 | 0.87 | 0.82 | 0.84 | |
| p value | .0001 | .0001 | .0001 | .0001 | .0001 | .0001 | |
| HAQ Index | |||||||
| ρ | 0.70 | 0.73 | 0.83 | 0.85 | 0.86 | 0.64 | |
| p value | .0001 | .0001 | .0001 | .0001 | .0001 | 0.0057 | |
| HC Expenditures | |||||||
| ρ | 0.68 | 0.59 | 0.87 | 0.85 | 0.89 | 0.85 | |
| p value | .0001 | .0001 | .0001 | .0001 | .0001 | .0001 | |
| Patient empowerment | |||||||
| ρ | 0.81 | 0.71 | 0.82 | 0.86 | 0.89 | 0.84 | |
| p value | .0001 | .0001 | .0001 | .0001 | .0001 | .0001 | |
| Access to cancer drugs | |||||||
| ρ | 0.69 | 0.67 | 0.84 | 0.64 | 0.85 | 0.84 | |
| p value | .0024 | .0032 | .0001 | .0057 | .0001 | .0001 |
Abbreviations: GDP, gross domestic product; HAQ, health care access and quality; HC, health care; MIR, mortality‐to‐incidence ratio.
Myeloma Incidence and Mortality
Myeloma incidence correlated closely with mortality in countries with very low incidence rates (below 1/100,000; ρ = 0.95, p < .0001), indicating very short survival in those states (Fig. 3). The correlation between both parameters diverged progressively, with increasing incidence with corresponding decline of correlation coefficients to 0.58 in countries with incidence rates between 1–3 per 100,000, and to 0.36 in those states with incidence rates greater than 3 per 100,000.
Figure 3.
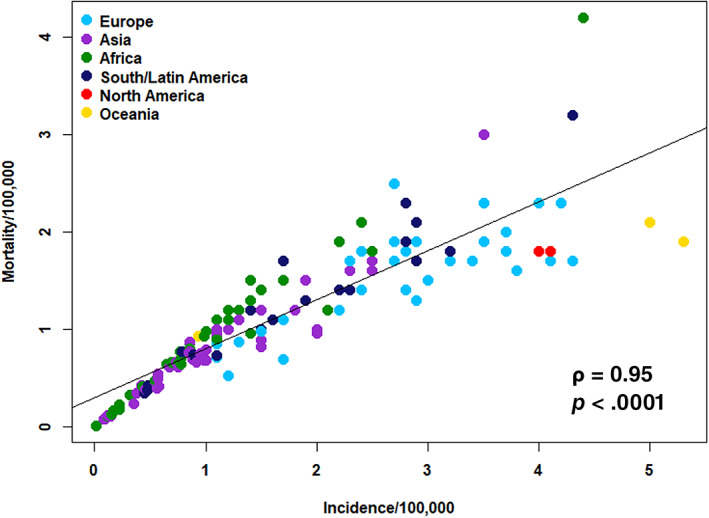
Relationship between mortality and incidence in countries with >1 million inhabitants (n = 150).
Myeloma Mortality/Incidence Ratio as Proxy for Survival
As information of up‐to‐date survival data is not available for most countries, the mortality/incidence ratio expressed as 1‐MIR was used as crude proxy for 5‐year survival rates 3, 4. The analysis revealed a marked variation between individual countries and varied between 9% and 64% in the 50 countries with data on patient access to myeloma information available (Fig. 4). Poor outcome reflected by a low 1‐MIR was observed in Egypt (9%), followed by the Philippines (10%), Thailand (13%), Indonesia, Mexico, South Korea, and United Arab Emirates (UAE) (15% each). The best outcome expressed by a high 1‐MIR was observed in New Zealand (64%), followed by Iceland (62%), U.K. (60%), Belgium (59%), and Australia (57%). Access to cancer drugs, patient empowerment, HAQ Index, and health care expenditure were further parameters closely associated with 1‐MIR (Table 1; Fig. 5).
Figure 4.
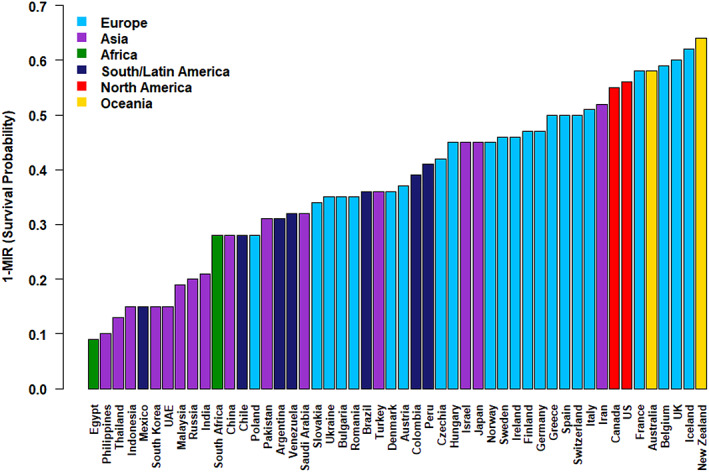
1‐MIR in countries with number of visits to the International Myeloma Foundation Web site available.
Abbreviation: MIR, mortality‐to‐incidence ratio.
Figure 5.
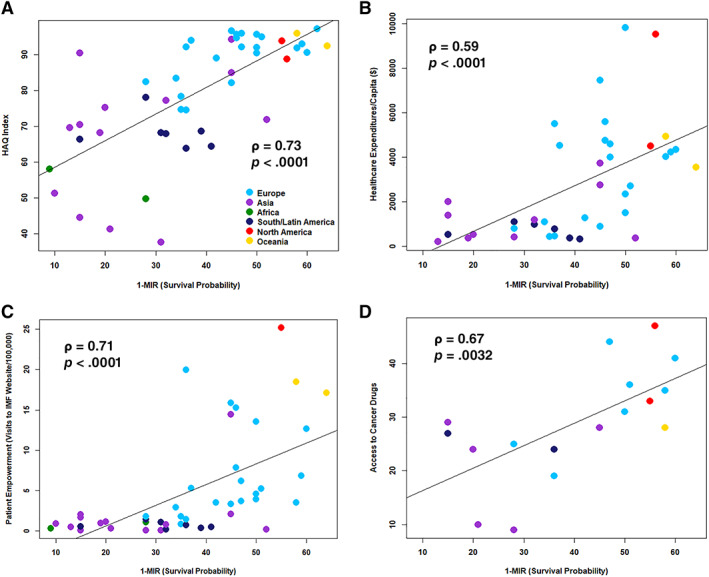
1‐MIR in relation to HAQ Index (A), health care spending (B), visits to the IMF Web site per 100,000 (patient empowerment) (C), and access to cancer drugs (D).
Abbreviations: MIR, mortality‐to‐incidence ratio; HAQ, health care access and quality; IMF, International Myeloma Foundation.
Economic Resources and Access to Drugs
Health care expenditures (ρ = 0.87, p < .0001), HAQ Index (ρ = 0.83, p < .0001), and patient empowerment (ρ = 0.82, p < .0001) were significantly related to GDP (Table 1). Data on access to cancer drugs were available for 17 countries only. Correlation analysis revealed a strong interdependency between economic resources expressed by GDP and access to cancer drugs (ρ = 0.84, p < .0001).
Patient Empowerment
The frequency patients are visiting a Web site providing expert information on the disease and its complex management was used as surrogate for patient empowerment. The number of visits were strongly correlated with health care expenditure (ρ = 0.89, p < .0001), HAQ Index (ρ = 0.86, p < .0001), access to cancer drugs (ρ = 0.84, p < .0001), and GDP (ρ = 0.82, p < .0001; Fig. 6; Table 1).
Figure 6.
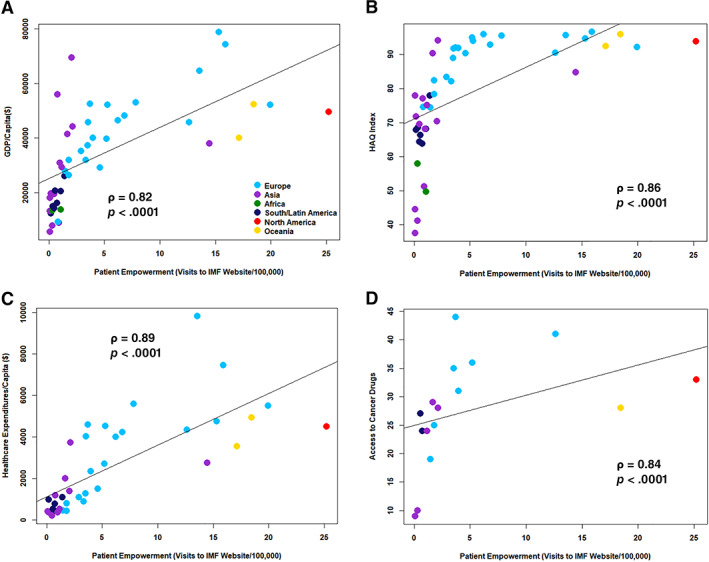
Visits to the IMF Web site per 100,000 (patient empowerment) in relation to GDP (A), HAQ Index (B), health care expenditure (C), and access to cancer drugs (D).
Abbreviations: GDP, gross domestic product; IMF, International Myeloma Foundation.
Discussion
One of the notable findings of this study is the significant variation of the global incidence of multiple myeloma, with age‐standardized incidence rates varying from 0.1 per 100,000 to 5.3 per 100,000 (Fig. 1). Age 13, male gender 14, familial and ethnic background 15, other genetic variants 16, obesity 17, life style 18, and environmental factors 18 are established risk factors for multiple myeloma. Although these variables likely account for some of the reported disparities, missing diagnosis of multiple myeloma in several regions likely accounts for most of the substantial differences. This also suggests that the presently available incidence and mortality figures for multiple myeloma grossly underestimate the global burden of the disease. Interestingly, incidence correlated closely with survival in countries with low incidence rates of lower than 1 per 100,000, but this relationship decreased progressively with increasing incidence (Fig. 3), a phenomenon that reflects the impact of quality and access to health care, which is substantiated by a close correlation between HAQ Index and incidence (ρ = 0.70, p < .0001).
As recent survival data for multiple myeloma are not available for the vast majority of countries, we used the 1‐MIR as proxy for 5‐year survival 2, 3. This measure has been shown to provide a good approximation of survival in most cancers, but according to one study 4, it was found to underestimate survival of patients with multiple myeloma in two of seven countries by as much as 10%–17%. The calculated data expressed as 1‐MIR show a marked disparity in outcome with very short survival in some countries and remarkable survival in countries like New Zealand and Iceland (Fig. 4). Recent research showed a close correlation between the 1‐MIR and the 5‐year survival rate in patients with cancer in The Netherlands 4, as well as in Peru 3. Applying these findings to the myeloma population would result in an estimated 5‐year survival rate of about 9% in Egypt and 62% and 64% in Iceland and New Zealand, respectively.
The 1‐MIR was strongly related with health care access and quality and access to cancer drugs, which is obvious and supports international efforts to improve health care 19, 20. It has to be acknowledged that improving health care and access to high quality care is to a large part related to the economic success and to the level of information of the individual societies’ processes 21, 22, which take time to achieve the desired transformation. Although HAQ Index was closely associated with GDP and HC expenditures, there are exceptions indicating that access to high‐quality health care is not strictly related to economic performance and HC expenditures of individual societies, as several countries with lower GDP still seem to offer high diagnostic and treatment standards. As an example, the highest incidence rate (5.3/100,000) was noted in New Zealand with a GPD of about $ 40,000, whereas in the UAE, with a GDP almost twice as high, around $70,000, an incidence rate of 1.2 per 100,000 only was observed. The 1‐MIR as proxy for survival showed a similar pattern with an estimated 5‐year survival of 64% and 15% in New Zealand and UAE, respectively. The survival estimates, although calculated according to several previous reports 3, 4, 23, need to be interpreted with caution, as they represent a rough estimation and heavily depend on the quality of data available to the cancer registries. Interestingly, increased health financing alone does not guarantee optimal outcome. Instead, how well health spending translates into heightened access to quality health care is more relevant. Present developments in multiple myeloma indicate an increasing dependence on the economic performance of individual societies to maintain unrestricted access to novel cancer drugs, which come at high costs to the market 24, 25. This idea is strongly supported by the close correlation between access to cancer drugs and GDP (ρ = 0.84, p < .001). For the majority of patients with multiple myeloma, most or all of the recently introduced novel drugs are not available as documented by surveys from several parts of the globe 25, 26. This also applies to several European countries 27 with limited or no access to novel drugs such as daratumumab, isatuximab, pomalidomide, carfilzomib, or selinexor reflecting a marked gap between new treatment options and real world practice, resulting in unnecessary suffering and shorter survival.
In several countries, patients with cancer nowadays acquire significant knowledge about their disease, enabling them to cooperate with their caregivers and to make informed decisions about diagnostic procedures and treatment selection. Above this, they may acquire significant expertise in the recognition and management of critical situations, thereby reducing the risk for adverse outcome 28, 29. One of the options for self‐empowerment is by viewing Web sites of international organizations devoted to improve patient education and empowerment, such as the one of the IMF 6. Our data show greater patient interest in myeloma‐specific information in countries with high incidence rates, which usually are the more affluent countries with better HAQ Index, health care expenditures, and access to cancer drugs. Expectedly, patients from those countries experience better treatment outcome.
The study has several limitations. As survival data from national health registries are not available for the vast majority of countries, we used the 1‐MIR as proxy for patient outcome. This value depends on the accuracy of cancer statistics of the individual countries, which has been shown to be a measure of the quality of the organization of the health system of the respective countries 30. Furthermore, the mortality rate does not refer to the same patients as the incidence rate, and health care systems are likely to change and to evolve over time 31. Survival also changes over time, which likely impacts on the assumed correlation between 1‐MIR and 5‐ year survival rates. Presently, an exact definition for patient empowerment is not available, hence we used the number of visits to the Web site of the IMF, the most frequently accessed information tool for patients with myeloma. The frequency of visits is not only a reflection of patient interest but may also be influenced by the public campaigns of the IMF in individual countries, but interestingly, a very high number of hits was noted in countries such as Switzerland, Denmark, or Israel, without much presence of the IMF other than the Web site.
Taken together, these findings show a significant disparity in myeloma incidence and outcome, indicating that myeloma often remains undiagnosed and patients are suboptimally treated in many parts of the globe. Our findings highlight the importance of economic resources, health care spending, access to and quality of health care, access to novel drugs, and patient education for improving diagnosis, management, and survival of patients with MM.
Conclusion
The global age‐standardized incidence of multiple myeloma varies between 0.54 and 5.5 per 100,000. Incidence correlates with 1‐MIR as surrogate for 5‐year survival and varies between 9% and 64%, GDP, health care expenditures, HAQ Index, access to cancer drugs, and patient empowerment. These findings highlight the importance of access to and quality of health care, economic resources, and patient education for improving diagnosis, management, and survival of patients with multiple myeloma.
Disclosures
Heinz Ludwig: Takeda, Amgen (RF), Celgene, Takeda, Amgen, Sanofi, Karyopharm (SAB/Other: Speaker's Bureau); Axel Hinke: Roche (H‐lectures); Brian Durie: Amgen, Celgene, Janssen, Takeda (C/A). The other authors indicated no financial relationships.
(C/A) Consulting/advisory relationship; (RF) Research funding; (E) Employment; (ET) Expert testimony; (H) Honoraria received; (OI) Ownership interests; (IP) Intellectual property rights/inventor/patent holder; (SAB) Scientific advisory board
Acknowledgments
This work was supported in part by the International Myeloma Foundation and by the Austrian Forum against Cancer.
Disclosures of potential conflicts of interest may be found at the end of this article.
No part of this article may be reproduced, stored, or transmitted in any form or for any means without the prior permission in writing from the copyright holder. For information on purchasing reprints contact Commercialreprints@wiley.com. For permission information contact permissions@wiley.com.
References
- 1. Ferlay J, Colombet M, Soerjomataram I et al. Estimating the global cancer incidence and mortality in 2018: GLOBOCAN sources and methods. Int J Cancer 2019;144:1941–1953. [DOI] [PubMed] [Google Scholar]
- 2. Choi E, Lee S, Nhung BC et al. Cancer mortality‐to‐incidence ratio as an indicator of cancer management outcomes in Organization for Economic Cooperation and Development countries. Epidemiol Health 2017;39:e2017006. [DOI] [PMC free article] [PubMed] [Google Scholar]
- 3. Stenning‐Persivale K, Franco MJS, Cordero‐Morales A et al. The mortality‐incidence ratio as an indicator of five‐year cancer survival in metropolitan Lima. Ecancermedicalscience 2018;12:799. [DOI] [PMC free article] [PubMed] [Google Scholar]
- 4. Asadzadeh Vostakolaei F, Karim‐Kos HE, Janssen‐Heijnen ML et al. The validity of the mortality to incidence ratio as a proxy for site‐specific cancer survival. Eur J Public Health 2011;21:573–577. [DOI] [PubMed] [Google Scholar]
- 5. Sunkara V, Hébert JR. The application of the mortality‐to‐incidence ratio for the evaluation of cancer care disparities globally. Cancer 2016;122:487–848. [DOI] [PubMed] [Google Scholar]
- 6.International Myeloma Foundation website. https://www.myeloma.org/. Accessed July 30, 2019.
- 7.International Agency for Research on Cancer. Cancer today website. http://gco.iarc.fr/today/home. Accessed July 30, 2019.
- 8.Gross domestic product, domestic currency. International Financial Statistics. https://data.imf.org/regular.aspx?key=62771448. Accessed July 31, 2019.
- 9.Data query. United Nations Department of Economic and Social Affairs population dynamics. https://population.un.org/wpp/DataQuery/. Accessed July 31, 2019.
- 10. Miller LJ, Lu W. These are the economies with the most (and least) efficient health care. Bloomberg News websie. Sepember 18, 2018. https://www.bloomberg.com/news/articles/2018-09-19/u-s-near-bottom-of-health-index-hong-kong-and-singapore-at-top. Accessed August 2, 2019. [Google Scholar]
- 11. GBD 2016 Healthcare Access and Quality Collaborators . Measuring performance on the Healthcare Access and Quality Index for 195 countries and territories and selected subnational locations: A systematic analysis from the Global Burden of Disease Study 2016. Lancet 2018;391:2236–2271. [DOI] [PMC free article] [PubMed] [Google Scholar]
- 12. IQVIA website. https://www.iqvia.com/. Accessed July 31, 2019.
- 13. Alexander DD, Mink PJ, Adami HO et al. Multiple myeloma: A review of the epidemiologic literature. International journal of cancer. 2007;120(suppl 12):40–61. [DOI] [PubMed] [Google Scholar]
- 14.Cancer registration statistics, England. Office for National Statistics website. https://www.ons.gov.uk/peoplepopulationandcommunity/healthandsocialcare/conditionsanddiseases/datasets/cancerregistrationstatisticscancerregistrationstatisticsengland. Accessed October 16, 2019.
- 15. VanValkenburg ME, Pruitt GI, Brill IK et al. Family history of hematologic malignancies and risk of multiple myeloma: Differences by race and clinical features. Cancer Dauses Control 2016;27:81–91. [DOI] [PMC free article] [PubMed] [Google Scholar]
- 16. Chubb D, Weinhold N, Broderick P et al. Common variation at 3q26.2, 6p21.33, 17p11.2 and 22q13.1 influences multiple myeloma risk. Nat Genet 2013;45:1221–1225. [DOI] [PMC free article] [PubMed] [Google Scholar]
- 17. Marinac CR, Birmann BM, Lee IM et al. Body mass index throughout adulthood, physical activity, and risk of multiple myeloma: A prospective analysis in three large cohorts. Brit J Cancer 2018;118:1013–1019. [DOI] [PMC free article] [PubMed] [Google Scholar]
- 18. Sergentanis TN, Zagouri F, Tsilimidos G et al. Risk factors for multiple myeloma: A systematic review of meta‐analyses. Clin Lymphoma Myeloma Leuk 2015;15:563–577.e1–3. [DOI] [PubMed] [Google Scholar]
- 19. World Health Organization ; UNICEF. A Vision for Primary Health Care in the 21st Century. Geneva, Switzerland; World Health Organization: 2018. https://www.who.int/docs/default-source/primary-health/vision.pdf. Accessed July 31, 2019. [Google Scholar]
- 20. Vrdoljak E, Bodoky G, Jassem J et al. Expenditures on oncology drugs and cancer mortality‐to‐incidence ratio in Central and Eastern Europe. The Oncologist 2019;24:e30–e37. [DOI] [PMC free article] [PubMed] [Google Scholar]
- 21. Lim SS, Updike RL, Kaldjian AS et al. Measuring human capital: A systematic analysis of 195 countries and territories, 1990‐2016. Lancet 2018;392:1217–1234. [DOI] [PMC free article] [PubMed] [Google Scholar]
- 22. Rajkumar SV. Value and cost of myeloma therapy. Am Soc Clin Oncol Educ Book 2018;38:662–666. [DOI] [PubMed] [Google Scholar]
- 23. Parkin DM, Bray F. Evaluation of data quality in the cancer registry: Principles and methods Part II. Completeness. Eur J Cancer 2009;45:756–764. [DOI] [PubMed] [Google Scholar]
- 24. Hollmann S, Moldaver D, Goyert N et al. A U.S. cost analysis of triplet regimens for patients with previously treated multiple myeloma. J Manag Care Spec Pharm 2019;25:449–459. [DOI] [PMC free article] [PubMed] [Google Scholar]
- 25. Pessoa de Magãlhaes Filho RJ, Crusoe E, Riva E et al. Analysis of availability and access of anti‐myeloma drugs and impact on the management of multiple myeloma in Latin American Countries. Clin Lymphoma Myeloma Leuk 2019;19:e43–e50. [DOI] [PubMed] [Google Scholar]
- 26. India and Ukraine Haemato‐oncology Group ; Garg A, Morgunskyy M, Belagali Y et al. Management of multiple myeloma and usage of bortezomib: Perspective from India and Ukraine. Front Oncol 2016;6:243. [DOI] [PMC free article] [PubMed] [Google Scholar]
- 27.European Atlas of Access to Myeloma Treatment website. https://www.mpeurope.org/atlas/info-by-country/. Accessed July 31, 2019.
- 28. Tocchi C, McCorkle R, Knobf MT. Multidisciplinary specialty teams: A self‐management program for patients with advanced cancer. J Adv Pract Oncol 2015;6:408–416. [PMC free article] [PubMed] [Google Scholar]
- 29. Cormican O, Dowling M. Living with relapsed myeloma: Symptoms and self‐care strategies. J Clin Nurs 2018;27:1713–1721. [DOI] [PMC free article] [PubMed] [Google Scholar]
- 30. Batouli A, Jahanshahi P, Gross CP et al. The global cancer divide: Relationships between national healthcare resources and cancer outcomes in high‐income vs. middle‐ and low‐income countries. J Epidemiol Glob Health 2014;4:115–124. [DOI] [PMC free article] [PubMed] [Google Scholar]
- 31. Cordero‐Morales A, Savitzky MJ, Stenning‐Persivale K et al. Conceptual considerations and methodological recommendations for the use of the mortality‐to‐incidence ratio in time‐lagged, ecological‐level analysis for public health systems‐oriented cancer research. Cancer 2016;122:486–487. [DOI] [PubMed] [Google Scholar]


