Abstract
Nowadays the exploration and utilisation of food and feed from marine origin is becoming more important with the increase of human population. Macroalgae are rich in nutritious compounds, which can directly be used in human and animal feed industries. The current study presents the screening of chemical components of eight macroalgae species, Sargassum boveanum, Sirophysalis trinodis, Hypnea caroides, Palisda perforata, Galaxaura rugosa, Caulerpa racemose, Caulerpa sertularioides and Bryopsis corticolans from the Persian Gulf. The results revealed that the eight studied algal species possess high protein (14.46% to 38.20%), lipid (1.27% to 9.13%) and ash (15.50% to 49.14%) contents. The fatty acids and amino acids profile showed the presence of essential fatty acids and amino acids with high nutritional value. Phaeophyta species, S. boveanum and S. trinodis, showed the highest value of ash content and polyunsaturated fatty acids while Chlorophyta species, C. racemose, C. sertularioides and B. corticolans, showed the highest level of lipid and protein contents. Rhodophyta species, G. rugosa and P. perforata, showed the highest essential amino acid content. In conclusion, this study demonstrates the potential of the studied marine species as a nutritional source for human and animal uses.
Keywords: Amino Acid, Fatty Acid, Chlorophyta, Phaeophyta, Rhodophyta
Highlights.
S. boveanum and S. trinodis, Phaeophyta algal species, showed the highest value of ash and polyunsaturated fatty acids contents.
Chlorophyta species "C. racemose, C. sertularioides and B. corticolans" showed the highest level of lipid and protein contents
G. rugosa and P. perforata as a Rhodophyta species showed the highest essential amino acid contents
INTRODUCTION
Fatty acids (FAs) and amino acids (AAs) are important nutritious substances and metabolites in living organism (Chem & Chung 2002). Sixty-eight percent (68%) of all people die from degenerative diseases, i.e. cardiovascular diseases (43.8%), cancer (22.4%) and diabetes (1.8%), which are related to inappropriate FA consumption (Salem et al. 1996; Terry et al. 2001). Some studies have recognised the vital role of conjugated FAs as bioactive molecules in the treatment of tumors and other cancer-related problems, with varying degree of cytotoxic effects on the cancer cells (Kawagishi et al. 2002). The two main polyunsaturated fatty acid (PUFA) classes, n-3 (omega-3) and n-6 (omega-6), play an important role in the prevention of cardiovascular diseases, osteoarthritis and diabetes. It is important to maintain an appropriate balance of omega-3 and omega-6 in the diet (Hibbeln et al. 2006; Miyake et al. 2010). PUFAs are essential nutrients which cannot or only to a limited extent be synthesised by mammals, so they must be ingested via dietary sources (Broadhurst et al. 2000).
Protein is one of the expensive macro-nutrients in ecologic and economic terms and therefore the one requiring the most attention with respect to sustainability (Swanson et al. 2013). Proteins provide nitrogen and carbon for the synthesis of gluconeogenesis and energy. Proteins are composed of different AAs and hence the content, proportion and availability of protein's amino acids have been affected in protein nutritional quality. Essential amino acids (EAA) including arginine, histidine, isoleucine, leucine, lysine, methionine, phenylalanine, threonine, tryptophan and valine cannot be synthesised by mammals, so they must be ingested from their diet.
Global nutritional security concerns have been raised in relation to the increasing human population. Consequently, a quest to explore and utilise foods from unconventional sources of both terrestrial and marine origins has been made (Dawczynski et al. 2007).
Marine macroalgae consist of more than thousands of species and represent a significant part of the littoral biomass. Macroalgae are classified as brown (Phaeophyta), red (Rhodophyta) and green algae (Chlorophyta) depending on their chemical composition and pigments (Dawczynski et al. 2007). Macroalgae are rich in the quantity of nutritious compounds, such as proteins, amino acids, carbohydrates, lipids, fatty acids, vitamins, pigments, minerals and they can be used directly in human nutrition (Aguilera-Morales et al. 2005, Ortiz et al. 2006, Cardozo et al. 2007). The amino acid and fatty acid composition of macroalgae have a wide application in human and animal feed nutrition industries.
Approximately 350 species of marine macroalgae have been reported from the coastline of the Persian Gulf and Oman Sea (Sohrabipour & Rabiei 1996, 1999). Only a limited number of them have been investigated for their chemical composition (Rohani-Ghadikolaei & Abdulalian 2012; Tabarsa et al. 2012; Pirian et al. 2016; 2017). In the light of the presence of the essential nutritional components for human diet in algae, algae have been recommended as valuable sources of nutritional compounds that may have food applications. The current study presents the screening of chemical components, especially AA and FA contents, of eight species of macroalgae from the Persian Gulf. The aim of this study was to evaluate the nutritional value of the macroalgal species as a source of human complementary food for the management of nutrition deficiencies.
MATERIALS AND METHODS
Sampling
Bandar Abbas, Hormuz and Qeshm Islands were selected as the algal sampling sites. They are located close to each other in the Strait of Hormuz in the Persian Gulf and have similar oceanographic conditions with temperature 18°C–20°C, salinity 39–40 PSU and pH 7.8–8.0 during the sampling period from 15 January 2017 to 3 March 2017 (Table 1, Fig. 1).
Table 1.
Macroalgal species with collection details, voucher number and habitat. All sites are located in the Persian Gulf, Iran.
| Species | Voucher No. | Source | Latitude and longitude | Habitat | Collection Date |
|---|---|---|---|---|---|
| Brown algae | |||||
| Sargassum boveanum | 3031 | Ghadir Blvd, Bandar Abbas | N 27° 10.88′ E 56° 22.13' |
Sandy | March 2017 |
| Sirophysalis trinodis | 3039 | Shahrdari Park, Qeshm Island | N 26° 57.74' E 56° 16.6' |
Rocky | February 2017 |
| Red algae Hypnea caroides | 3045 | Portuguese Fortress, Hormuz Island | N 27° 6.08' E 56° 27.10' |
Rocky | January 2017 |
| Palisada perforata | 3041 | Botany Park, Qeshm Island | N 26° 58.42′ E 56° 15.30' |
Rocky | February 2017 |
| Galaxaura rugosa | 3038 | Beach Road, Hormuz Island | N 27° 5.6′ E 56° 26.77' |
Rocky | January 2017 |
| Green algae Caulerpa racemosa | 3042 | Botany Park, Qeshm Island | N 26° 58.42′ E 56° 15.30' |
Sandy | March 2017 |
| Caulerpa sertularioides | 3043 | Shahrdari Park, Qeshm Island | N 26° 57.74' E 56° 16.6' |
Rocky | February 2017 |
| Bryopsis corticolans | 3044 | Zeyttoon Park, Qeshm Island | N 26° 56.08′ E 56° 16.50' |
Sandy | March 2017 |
Figure 1.
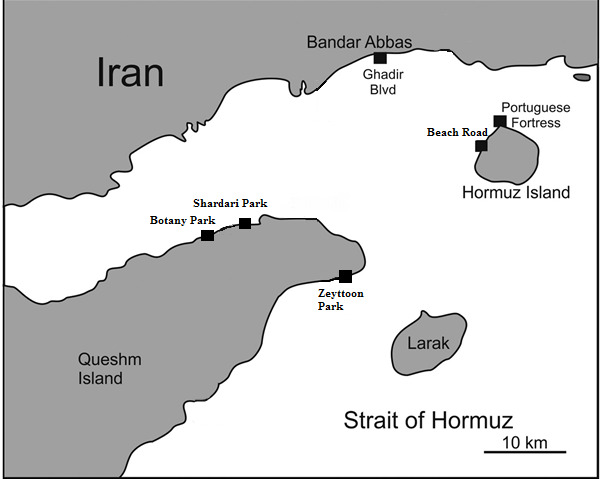
Map of sampling localities in the Persian Gulf, Iran. The sample details are shown in Table 1.
Algal samples were handpicked from the sandy and rocky seashores of the intertidal zone, first identified in the field, and then transferred to the laboratory for phytochemical analyses. In the laboratory, the samples were washed thoroughly in seawater to remove debris and epiphytes, and prior to further analyses were rinsed with distilled water. After washing, a part of each sample was separated for a part of detailed morphological identification and the rest of the sample was air-dried in freeze dryer and preserved for further analysis in air-tight plastic bags in desiccators at room temperature (25°C). Identification of the tested algae was carried out with standard keys by Gabrielson et al. (2006) and Sohrabipour and Rabiei (1996, 1999). Herbarium specimens were deposited at the Algal Herbarium of the Hormozgan Agricultural and Natural Resource Research and Education Centre, Bandar Abbas, Iran. Fig. 2 showed the herbarium specimens of the all eight identified algal samples from the Persian Gulf. Two samples of each of the eight species were processed further chemical analyses.
Figure 2.
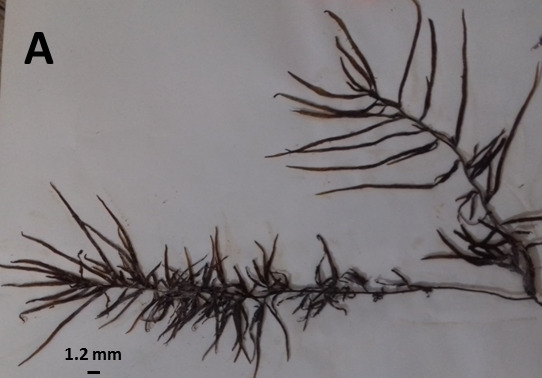
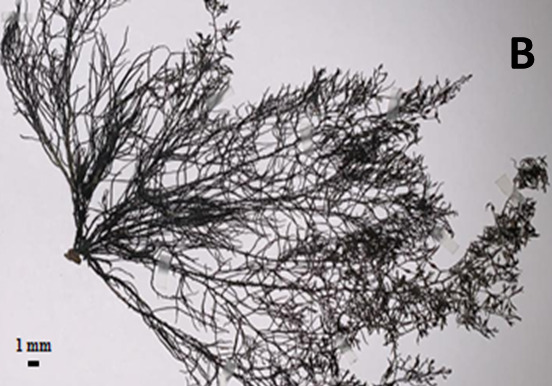
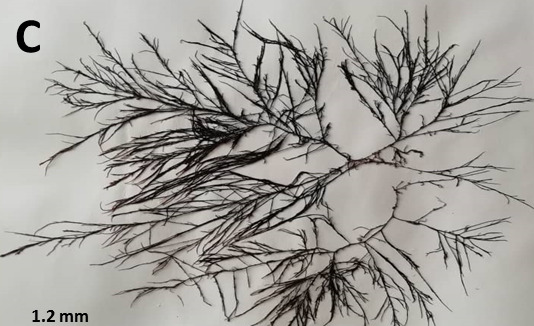
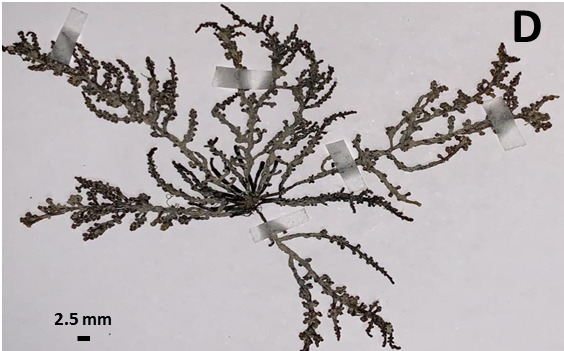
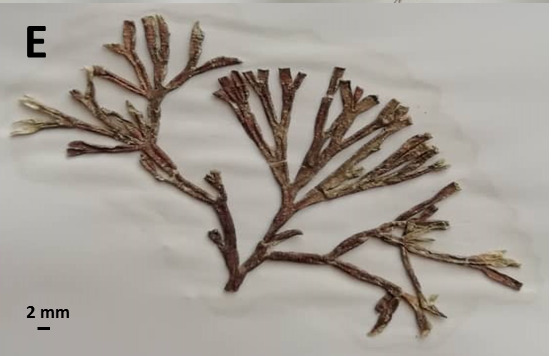
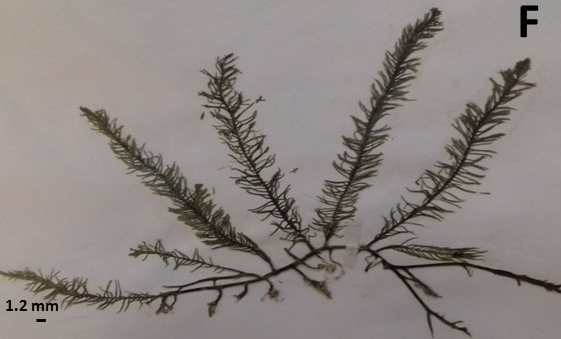
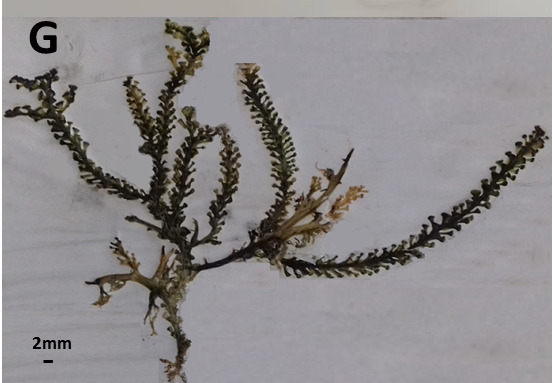
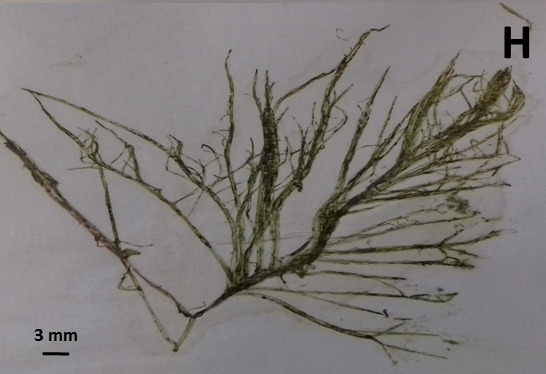
Herbarium specimens of algal samples from the Persian Gulf, Iran. (A) Sargassum boveanum; (B) Sirophysalis trinodis; (C) Hypnea caroides; (D) Palisda perforata; (E) Galaxaura rugosa; (F) Caulerpa sertularioides; (G) Caulerpa racemose; (H) Beriopsis corticolans.
Total Lipid Content
The total lipid content of the samples was extracted according to Folch et al. (1956). Briefly, freeze-dried algal powder was placed into a glass vial and chloroform: methanol (2:1v/v) mixture was added into it. The mixture was heated at 60°C for 1 h, followed by a filtration step (Whatman GF/A filter) to remove particles. The filtered crude extract was washed with 0.9% NaCl solution, mixed with a vortex spin and let to stand for several minutes until an upper and lower phase established. The upper phase was removed and the lower one, containing the lipids, was evaporated under a gentle stream of nitrogen. The lipid extract was then weighed and expressed as g of total lipids per 100 g dry weight of the sample.
Total Protein Content
The total protein content of the samples was estimated by using the method by Bradford (1976). The protein contents of the algae were measured by the absorbance (595 nm) and different concentrations of bovine serum albumin (BSA) was prepared as a standard. Finally, the protein contents of the samples were estimated based on the BSA curve and expressed in percentage of dry weight.
Ash Content
Ash contents of the samples were determined according to the method described by Association of Official Analytical Chemists, AOAC (1995). Briefly, 5 g of a dried algal sample was kept at 525°C for 6 h in blast furnace and weighed. The ash content was expressed as g of ash obtained per 100 g of dry weight sample.
Fatty Acid
The fatty acid (FA) composition was analysed with Gas Chromatography–Flame Ionisation Detector (GC-FID) after the preparation of fatty acid methyl esters (FAMEs) according to the method by Miller and Berger (1985) with some modifications. Initially for saponification process, the starting solution, containing the sample and NaOH (1.2 mol L−1) in an aqueous methanol (50%), was boiled for 30 min. For the methylation process, the sample was acidified with HCl (10 mol L−1) and methanolic BCL3 (12%) (catalyst) was added and heated for 10 min. Hexane/diethylether (1:1) was added to the sample for the extraction of the FAMEs. Finally, NaOH (0.3 mol L−1) was added to the organic extract (FAMEs). The FAME phase was transferred and evaporated completely using nitrogen flushing. The samples could be stored at −20°C for several weeks. FAME samples were analysed using a gas chromatograph (Varian, 3800) equipped with a fused silica capillary column BPX 70 (25 m × 0.32 mm, film thickness 0.25 μm) and a flame ionisation detector. The run was carried out through a temperature gradient of 160°C–230°C, with an increase rate of 1.5°C min−1. FA identification was performed using external standards (SUPELCO F.A.M.E. Mix C4-C24). FA composition was calculated from the total identified FA area and the values were averages of at least three injections of each sample.
Amino Acids
For amino acid (AA) analyses, triplicate sub-samples were hydrolysed with hydrochloric acid (6 N) in evacuated sealed tubes for 24 h at 110°C. The hydrolysed samples were then analysed in high performance liquid chromatography [HPLC] (Knauer-Germany) Amino Acid Analysis System (Column: C18, Detector: Knauer rf-530, UV Absorbance Detector). Sulphur AAs get partially or completely destroyed during acid hydrolysis. Therefore, cysteine and methionine were first oxidised and then transformed to cysteic acid and methionine sulphone, determined after acid hydrolysis. A set of amino acid standards (Sigma chemicals) was analysed with each set of experimental samples. The identification of the amino acid in the sample was carried out by comparison with retention times of the standards.
Statistical Analysis
The measuring of chemical contents of all algal samples was carried out in triplicate sub samples, and the experimental results were expressed as means with ± standard deviation (SD). The means of all factors were studied by one-way analysis of variance (one-way ANOVA) by using the SPSS 18 (SPSS Inc., Chicago). Then the individual means were compared using Duncan's post-hoc test. Finally, the results were considered as significantly different if P values were less than 0.05 (P < 0.05).
RESULTS
Total Lipid, Protein and Ash Content
The total lipid, protein and ash contents of eight studied algal species are shown in Table 2. Statistical differences were found between the lipid content of the algal species (P < 0.05, Table 2). The total lipid content varied between 1.27% and 9.13% d.w., depending on the algal species. The highest and the lowest lipid content were observed in Caulerpa sertularioides (9.13% d.w.) and Sirophysalis trinodis (1.27% d.w.), respectively. The high value of lipid content in our study was shown in the studied green algal species (C. sertularioides, Bryopsis corticolans and C. racemose)(9.13%–6.12% d.w.).
Table 2.
Total lipid, protein and ash contents of the eight different algal species (as % of algal dry weight).
| Species | Total lipid | Total protein | Total ash |
|---|---|---|---|
| Sargassum boveanum | 2.02 ± 0.05e | 21.33 ± 0.35f | 49.14 ± 1.00a |
| Sirophysalis trinodis | 1.27 ± 0.07f | 14.64 ± 0.20h | 22.57 ± 0.15g |
| Hypnea caroides | 3.04 ± 0.05d | 25.63 ± 0.46e | 15.50 ± 0.20h |
| Palisada perforata | 2.12 ± 0.02e | 32.05 ± 0.78c | 26.21 ± 0.10f |
| Galaxaura rugosa | 4.02 ± 0.12c | 17.82 ± 0.15g | 38.31 ± 0.57d |
| Caulerpa racemosa | 6.12 ± 0.10b | 29.10 ± 0.23d | 45.34 ± 0.81b |
| Caulerpa sertularioides | 9.13 ± 0.23a | 35.06 ± 0.55b | 41.18 ± 0.43c |
| Bryopsis corticolans | 6.52 ± 0.15b | 38.20 ± 0.62a | 30.17 ± 0.18e |
Note:
Different superscript letters within each column show significant differences between algal species as determined by Duncan’s post-hoc multiple comparison (P < 0.05).
The protein content of studied algal species (38.20%–14.64% d.w.) showed significant differences between species (P < 0.05, Table 2). The B. corticolans showed the highest protein content (38.20% d.w.) while S. trinodis and Galaxaura rugosa showed the lowest protein content (14.64% and 17.82% d.w., respectively) among the studied species (Table 2). The high value of protein content (35.06%–38.20% d.w.) was observed in two green algal species (B. corticolans and C. sertularioides). The studied algal species showed significant variation in ash content (P < 0.05, Table 2). The ash content of studied algal species varied between 15.50 to 49.14% d.w. The highest ash content was observed in Sargassum boveanum (49.14% d.w.) and the lowest ash content was observed in Hypnea caroides (15.50% d.w.) among algal species (Table 2).
FA Content
The profile and content of the FAs in the studied algal species are shown in Table 3. The saturated fatty acids (SFA) in the studied species ranged from 142.9 mg g−1 FAME in S. boveanum to 427.9 mg g−1 FAME in C. racemosa (Table 3). Palmitic acid (C16:0) was the most abundant SFA and its highest content was observed in green algae; C. racemosa, C. sertularioides and B. corticolans (342.8 to 361.6 mg g−1 FAME) and the lowest in S. boveanum (73.4 mg g−1 FAME) (P < 0.05). The total contents of monounsaturated fatty acids (MUFAs) varied from 282.4 mg g−1 FAME in H. caroides to 350.7 mg g−1 FAME in C. racemosa (P < 0.05). PUFAs ranged from 212.1 to 530.2 mg g−1 FAME. S. trinodis and S. boveanum showed the highest PUFA content (553.2 to 536.7 mg g−1 FAME), while B. corticolans showed the lowest PUFA content (212.1 mg g−1 FAME). There were significant differences between species in their MUFA and PUFA contents (P < 0.05) (Table 3). Oleic acid (C18:1) was the most abundant unsaturated fatty acid which showed the ranged from 193.2 mg g−1 FAME in S. boveanum to 277.2 mg g−1 FAME in B. corticolans. Arachidonic acid (C20:4, AA), as the most abundant PUFA, varied from 45.9 mg g−1 FAME in B. corticolans to 155.5 mg g−1 FAME in S. trinodis. The SFA/UFA ratio showed lower than 1 in all eight algal species (0.16 to 0.80) (Table 3).
Table 3.
The composition of fatty acid methyl esters in eight different algal species from the Persian Gulf (in mg of fatty acid g−1 of total FAME).
| Fatty acids | Sargassum boveanum | Sirophysalis trinodis | Hypnea caroides | Palisada perforata | Galaxaura rugosa | Caulerpa racemosa | Caulerpa sertularioides | Bryopsis corticolans |
|---|---|---|---|---|---|---|---|---|
| C12:0 | 4.3d | 5.4c | 3.6e | 7.3a | 6.8b | 3.0f | 3.6e | 3.9e |
| C14:0 | 27.3de | 22.5e | 36.9c | 21.8e | 31.1d | 52.8a | 57.6a | 48.1b |
| C16:0 | 73.4e | 82.5de | 153.6b | 98.9d | 114.6c | 361.6a | 342.8a | 360.3a |
| C18:0 | 22.5a | 17.9b | 11.4c | 15.8b | 16.7b | 1.4d | 1.5d | 1.3d |
| C20:0 | 9.3a | 7.2b | 4.5de | 6.0c | 5.4cd | 4.9d | 4.1e | 3.7e |
| C22:0 | 6.1b | 7.8a | 4.6c | 5.6b | 4.4c | 4.2cd | 4.6c | 4.0d |
| C16:1 | 90.4b | 102.3a | 79.5d | 85.1c | 82.2c | 37.3f | 43.0e | 31.2f |
| C18:1 | 193.2e | 214.7d | 255.9b | 201.2de | 214.5d | 231.6c | 259.2b | 277.2a |
| C20:1 | 19.6b | 22.6a | 14.3c | 21.9a | 20.0ab | 13.5c | 14.8c | 12.4c |
| C18:2 | 125.7b | 128.2ab | 133.3a | 111.1c | 103.2d | 42.5e | 33.8f | 30.2f |
| C18:3 | 44.9a | 39.5ab | 31.4b | 33.2b | 30.5bc | 29.6c | 31.8b | 30.3bc |
| C18:4 | 42.5d | 48.2c | 58.6a | 44.5cd | 49.5bc | 54.3ab | 59.3a | 50.8b |
| C20:4 | 145.8b | 155.5a | 140.7b | 135.8c | 122.4d | 62.6e | 56.5f | 46.9g |
| C20:5 | 74.1b | 85.3 a | 52.8d | 60.1 c | 62.2c | 49.9de | 40.6f | 45.9e |
| C22:4 | 104.6a | 96.7b | 9.5d | 80.9c | 98.7b | 8.9d | 9.6d | 8.0d |
| ∑SFA | 142.9d | 143.3d | 214.6b | 155.4d | 179.0c | 427.9a | 414.2a | 421.3a |
| ∑MUFA | 303.2d | 339.6b | 350.7a | 308.2d | 316.7c | 282.4e | 317.0c | 320.8c |
| ∑PUFA | 536.7a | 553.2a | 426.3b | 466.8b | 477.4b | 247.8c | 231.6c | 212.1c |
| SFA/UFA | 0.17 | 0.16 | 0.28 | 0.19 | 0.22 | 0.80 | 0.75 | 0.79 |
Note:
different superscript letters within each row show significant differences between eight algal species as determined by Duncan’s post-hoc multiple comparison (P < 0.05).
∑SFA: sum of saturated fatty acids, ∑MUFA: sum of monounsaturated fatty acids, ∑PUFA: sum of polyunsaturated fatty acids, SFA/UFA: saturated fatty acids to unsaturated fatty acids.
Amino Acids
The total amino acid content (∑AA) of the eight algal species ranged from 492.5 to 800.9 g kg−1 protein, the highest content found in G. rugose (800.9 g kg−1 protein) and the lowest in C. sertularioides (492.5 g kg−1 protein) (P < 0.05) (Table 4). All eight studied algal species contained all essential amino acids (EAA) for humans, i.e. methionine, leucine, threonine, histidine, lysine, valine and phenylalanine, and nine non-essential amino acids (NEAA) in different proportions. The sum of EAAs (∑EAA) ranged from 190.8 g kg−1 protein in C. sertularioides to 412.9 g kg−1 protein in G. rugosa. Leucine and phenyl alanine constituted together the biggest part of the EAA fraction (109.8−63.6 and 80.7−36.1 g kg−1 protein, respectively) in all species, except of Palisada perforata in which leucine and lysine showed together the biggest part of EAAs (109.8 and 91.0 g kg−1 protein). Among NEAAs, aspartic and glutamic acids showed the largest part of the NEAA fraction in green and brown algal species (92.1−63.6 g kg−1 and 85.4−66.6 g kg−1 protein, respectively) whereas arginine and glutamic acids showed the largest part of the NEAA fraction in the red algal species studied (82.5−66.8 and 113.2−64.3 g kg−1 protein, respectively) (Table 4).
Table 4.
Amino acid profiles of eight algal species from the Persian Gulf (in g of amino acids kg−1 of protein).
| Amino acids | Sargassum boveanum | Sirophysalis trinodis | Hypnea caroides | Palisada perforata | Galaxaura rugosa | Caulerpa racemosa | Caulerpa sertularioides | Beriopsis corticolans |
|---|---|---|---|---|---|---|---|---|
| Thr | 41.3b | 37.1c | 32.7d | 35.1cd | 55.4a | 44.2b | 18.4e | 33.9d |
| Phe | 80.7b | 63.2e | 68.5d | 52.1f | 86.2a | 71.2c | 36.1g | 70.9c |
| Val | 22.7d | 35.2c | 23.0d | 47.3a | 40.6b | 33.2c | 19.8e | 23.9d |
| Met | 30.5c | 42.9b | 26.8d | 28.5d | 51.2a | 30.5c | 26.6d | 27.7d |
| Leu | 72.8e | 101.1b | 69.2e | 109.8a | 93.9c | 87.2d | 63.6f | 71.7e |
| Lys | 21.1e | 61.2b | 21.1e | 91.0a | 47.7 c | 25.0d | 18.4f | 21.9e |
| His | 9.1d | 21.2b | 5.6f | 16.7c | 37.9a | 7.7e | 7.9e | 5.8f |
| Tyr | 40.2b | 58.4a | 32.7cd | 42.3b | 23.2e | 31.7d | 35.0c | 33.9c |
| Cys | 1.2d | 28.9a | 7.2c | 21.1b | 1.3d | 8.6c | 1.0d | 7.5c |
| Asp | 72.8b | 92.1a | 24.5f | 22.1f | 55.4e | 73.5b | 63.6d | 69.2c |
| Gly | 12.8bc | 6.4d | 10.2c | 28.9a | 16.0b | 11.5c | 11.2c | 10.5c |
| Glu | 83.6d | 91.2c | 64.3f | 113.2a | 105.2b | 85.4d | 73.0e | 66.6f |
| Pro | 51.22b | 61.5a | 35.7e | 40.3d | 42.1d | 47.8c | 44.7cd | 30.7f |
| Ser | 18.0c | 6.5f | 14.6d | 10.5e | 35.1a | 20.6b | 15.7d | 15.1d |
| Arg | 32.5d | 38.9c | 66.8b | 67.3b | 82.5a | 15.0f | 28.3e | 25.4e |
| Ala | 33.5cd | 15.2f | 35.6b | 31.2d | 27.2e | 48.4a | 29.2de | 36.9b |
| ∑EAA | 278.2e | 361.9c | 246.9f | 380.5b | 412.9a | 299.0d | 190.8g | 255.8f |
| ∑AA | 624.3c | 761.5b | 538.5e | 757.4b | 800.9a | 641.5d | 492.5f | 551.6e |
Note:
superscript letters within each row show significant differences between eight algal species as determined by Duncan’s post-hoc multiple comparison (P < 0.05).
∑AA: Sum of amino acids, ∑EAA: Sum of essential amino acids.
DISCUSSION
Algae have been one of the most versatile sources of bioactive compounds and research on their chemical composition has significantly extended in the past three decades (Cardozo et al. 2007; O’Sullivan et al. 2010).
In this study, green algae showed higher lipid content (6.12%–9.13% d.w.) compared to red and brown algae. This is in agreement with previous studies (see Chakraborty & Santra 2008; Anantharaman et al. 2013; Khairy & El-Shafay 2013), which shown that green algae in general have higher lipid contents than red and brown algae. The lipid content of Caulerpa sertularioides (9.13% d.w.) was higher than the lipid content of green algae previously reported from the Persian Gulf; Ulva prolifera (6.06% d.w.), U. paschima (5.36% d.w.), U. lactuca (5.2% d.w.) and Caulerpa sertulariodes (2.7% d.w.) (Rohani-Ghadikolaei & Abdulalian 2012; Mohammadi et al. 2013; Pirian et al. 2016; 2018). Similarly, the lipid content of C. racemosa and C. sertularioides were higher than previously reported for other areas in the world; 0.32% and 3.58% d.w. for Caulerpa taxifolia in India, 4.4% and 0.9% d.w. for C. racemosa in India, 3.6% d.w. for C. scalpelliformis in India, 0.86% d.w. for C. lentillifera in Thailand (Ratana-arporn & Chirapart 2006; Chakraborty & Bhattacharya 2012; Murugaiyan et al. 2012; Kokilam & Vasuki 2013). The lipid content of S. boveanum (2.02% d.w.) was lower than reported for other Sargassum species [S. vulgar (4.15% d.w.), S. subrepandum (3.61% d.w.) and S. wightii (2.33% d.w.)] but was higher than other Sargassum species [S. muticum (1.45% d.w.), S. polycustum (0.9% d.w.), S. wightii (1.4% d.w.)] (Manivannan et al. 2008; Abou-El-Wafa et al. 2011; Murugaiyan et al. 2012; Chakraborty & Bhattacharya 2012; Rodrigues et al. 2015; Pirian et al. 2017). Hypnea cavoides lipid content (3.04% d.w.) was similar to those reported by other authors for Hypnea spp. (H. musciformis and H. cervicornis) (Anantharaman et al. 2013; Mohammadi et al. 2013). Biodiesel can be produced from green macroalgae with high lipid contents (Hossain et al. 2008). Macroalgae with high lipid contents because of their commonly and low harvest costs can be used as economical option for bioenergy.
Quantitative analysis of protein content of the eight species studied showed that the highest protein content was in the green alga Bryopsis corticolans and lowest in the brown alga Sirophysalis trinodis. Similarly, Chakraborty and Santra (2008) studied some algal species and recorded the highest protein content in the green alga Lola capillaris (40.87%) and the lowest in the brown alga Dictyota ceylanica (3.33%). Pycke and Faasse (2015) reported higher protein content in the green alga Ulva sp. (33.6%) and lower in the brown alga Fucus vesiculosus (5%–8%). In general, red and green algae are characterised by higher protein content compared to brown algae (Ibañez & Cifuentes 2013). Protein content varies between genera but also between species of the same genus. Lower protein contents compared to this study have been recorded for Sargassum subrepandum (3.2%) (Abou-El-Wafa et al. 2011), Sargassum tenerimum (12.42%) and Hypnea valentiae (8.34%) (Manivannan et al. 2008), Sargassum coriifolium (16.07%) (Haque et al. 2009), Hypnea pannosa (16.31%) and Hypnea musciformis (18.64%) (Siddique et al. 2013), Caulerpa taxifolia (12.44%) (Kokilam & Vasuki 2013), Sargassum muticum (16.9%) (Rodrigues et al. 2015) and Caulerpa lentillifera (12.49%) (Ratana-arporn & Chirapart 2006). Chakraborty and Bhattacharya (2012) recorded similar values to our study in Caulerpa scalpeliformis (32.4%) and Caulerpa racemosa (24.8%) from the Gulf of Kutch coastline. These variations in the crude protein content of macroalgae can be due to species, season, environmental conditions and the geographic area (Zucchi & Necchi 2001; Ratana-arporn & Chirapart 2006; Stirk et al. 2007). The direct relationship of protein percentage in macroalgae with nitrate of the ambient water was reported by several workers (Banerjee et al. 2009). Marine algae are high value food because of their high protein content. Our study also revealed considerably high concentration of protein in the studied algal species from the Persian Gulf.
All samples, with the ash content of 15.50% to 49.14%, fall within the wide variation of ash contents reported for macroalgae. The ash content of S. boveanum (49.14%) was much higher than that recorded for other species from the Persian Gulf in previous studies (Rohani-Ghadikolaei & Abdulalian 2012; Pirian et al. 2016; 2017; 2018). Khairy and El-Shafay (2013) reported higher levels of ash content of algal species during autumn (with low temperature) compared to spring and summer (with high temperature). Therefore, the high ash content found in our study is likely to be explained by the fact that our samples were collected during the low-temperature season. In general, high level of ash is associated with the amount of mineral elements.
FA are important bio-regulators of many cellular processes and they are precursors in the biosynthesis of eicosanoids, which are essential signaling molecules in humans (Gressler et al. 2010). Fatty acids play also important roles in algal physiology, so they may be very responsive to species and environmental changes (Sánchez-Machado et al. 2004; Ratana-arporn & Chirapart 2006). In our study, algae mainly composed of saturated FA (SFA) and unsaturated FA (UFA) ranged from the C12:0 to C22:4. Despite the differences among the FA concentrations, palmitic acid (C16:0) was the dominant FA in all eight studied algal species. This is similar to previous studies (Gressler et al. 2010; Caf et al. 2015, Pirian et al. 2016; 2017). In general, all our samples contained the essential FA; C18:2(n6) (linoleic acid), C18:3 (n3) (alpha-linolenic acid), C20:4 (n6) (arachidonic acid) and C20:5 (n3) (eicosapentaenoic acid). C18:1 (oleic acid, n9) was the most abundant MUFA in the species analysed. Lower oleic acid content has been recorded for Ulva lactuca, Taonia atomaria and Padina pavonica (Caf et al. 2015), Ulva rigida (Satpati & Pal 2011), Ulva intestinalis, Lola capillaris, Ulva lactuca, Dictyota ceylanica, Catenella repens, Polysiphonia mollis (Chakraborty & Santra 2008), but higher content for Ulva reticulata, Porphyra sp., Palmaria sp., Gracillaria changgi (Ratana-arporn & Chirapart 2006), Rhizoclonium riparium and Gelidiella acerosa (Chakraborty & Santra 2008), than our studied algae. In this study, brown algae exhibited the highest concentrations of PUFA. Our results were in agreement with previous studies in which brown algae showed higher concentrations of PUFA compared to green algae (Dawczynski et al. 2007, Caf et al. 2015, Pirian et al. 2017), and suggest that green algae have a lower potential, compared to the brown algae studied, as a nutritional source of PUFA for human consumption. According to the World Health Organisation (WHO 2008), the ratio of SFA/UFA should be lower than one in the human diet. Ratio values lower than one were observed for all eight studied algae, making these species potential sources for food and feed products, and from the lipid point of view, they can be incorporated in a more balanced diet.
Unlike most plant protein, algal protein is called complete protein as it contains all essential amino acids for humans. The amount of amino acids varied in the studied algal species, and all species contained all essential amino acids (EAA) for humans. The highest amino acid content was found in the red alga Galaxaura rugosa. Similar to our results, in most studies red algae showed considerable levels of EAAs (Gressler et al. 2010; Tabarsa et al. 2012). In our study, leucine and phenyl alanine were the most common EAAs. The limiting amino acid varies depending on the product: lysine in cereals, methionine in legumes, and cysteine in soybean-fermented products (Li et al. 2011; Boland et al. 2013). The studied algae contained considerable level of lysine, methionine and cysteine amino acids, suggesting that they would be suitable to complement terrestrial plant protein meals in food and feed industries. These results agreed with previous reports for other algal species (Kolb et al. 2004; Mata et al. 2016).
CONCLUSION
Our findings suggested that the studied algal species can be used as alternative nutrient sources of mineral, fatty acids, protein and amino acid for human and animal consumption. Two green studied algal species, C. sertularioides and B. corticolans, can be used as protein and lipid sources. Two brown algal species, S. boveanum and S. trinodis can be considered as a nutritional source of PUFA for human consumption. In general, the ratio values of lower than one (SFA/UFA) for all eight studied algae, making them healthy sources for food and feed products. Two red algal species, G. rugosa and P. perforata, would be suitable as a nutritional sources of EAA. Therefore, the Persian Gulf algae have a great potential for economic application and deserve more attention.
REFERENCES
- Abou-El-Wafa GSE, Shaaban KA, El-Naggar MEE, Shaaban M. Bioactive constituents and biochemical composition of the Egyptian brown alga Sargassum subreppanum (Forsk) Revista Latinoamericana Química. 2011;39(1–2):62–74. [Google Scholar]
- Aguilera-Morales M, Casas-Valdez M, Carrillo-Domínguez S, González-Acosta B, Pérez-Gil F. Chemical composition and microbiological assays of marine algae Enteromorpha spp. as a potential food source. Journal of Food Composition Analysis. 2005;18(1):79–88. doi: 10.1016/j.jfca.2003.12.012. [DOI] [Google Scholar]
- Anantharaman P, Parthiban C, Saranya C, Girija K, Hemalatha A, Suresh M. Biochemical composition of some selected seaweeds from Tuticorin coast. Advances in Applied Sciences and Research. 2013;4(3):362–366. [Google Scholar]
- Association of Official Analytical Chemists (AOAC) Official methods for analysis. 16th edition. Washington: AOAC; 1995. [Google Scholar]
- Banerjee K, Ghosh R, Homechaudhuri S, Mitra A. Biochemical composition of marine macroalgae from Gangetic Delta at the apex of Bay of Bengal. African Journal of Basic and Applied Science. 2009;1(5–6):96–104. [Google Scholar]
- Boland MJ, Rae AN, Vereijken JM, Meuwissen MPM, Fischer ARH, van Boekel MAJS, Rutherfurd SM, Gruppen H, Moughan PJ, Hendriks WH. The future supply of animal-derived protein for human consumption. Trends in Food Science Technology Journal. 2013;29(1):62–73. doi: 10.1016/j.tifs.2012.07.002. [DOI] [Google Scholar]
- Bradford MM. A rapid and sensitive method for the quantitation of microgram quantities of protein utilizing the principle of protein-dye binding. Analytical Biochemistry. 1976;72(1–2):248–254. doi: 10.1016/0003-2697(76)90527-3. [DOI] [PubMed] [Google Scholar]
- Broadhurst CL, Wang Y, Crawford MA, Cunnane SC, Parkington JE, Schmidt WF. Brain-specific lipids from marine, lacustrine, or terrestrial food recources: potential impact on early African Homo sapiens. Comparative Biochemistry and Physiology. 2000;131(4):653–673. doi: 10.1016/S1096-4959(02)00002-7. [DOI] [PubMed] [Google Scholar]
- Caf F, Yilmaz Ö, Durucan F, Özdemir N. Biochemical components of three marine macroalgae (Padina pavonica, Ulva lactuca and Taonia atomaria) from the levantine seacoast of Antalya, Turkey. Journal of Biodiversity and Environmental Sciences. 2015;6(4):401–411. [Google Scholar]
- Cardozo KHM, Guaratini T, Barros MP, Falcao VR, Tonon AP, Lopes NP, Campos S, Torres MA, Souza AO, Colepicolo P. Metabolites from algae with economical impact. Comparative Biochemistry and Physiology. 2007;146(1–2):60–78. doi: 10.1016/j.cbpc.2006.05.007. [DOI] [PubMed] [Google Scholar]
- Chakraborty S, Santra SC. Biochemical composition of eight benthic algae collected from Sunderban. Indian Journal of Marine Science. 2008;37(3):329–332. [Google Scholar]
- Chakraborty S, Bhattacharya T. Nutrient composition of marine benthic algae found in the Gulf of Kutch coastline, Gujarat, India. Journal of Algal Biomass Utilization. 2012;3(1):32–38. [Google Scholar]
- Chem SH, Chung YJ. Analysis of fatty acids by column liquid chromatography. Analytica Chimica Acta. 2002;465(1–2):145–155. doi: 10.1016/S0003-2670(02)00095-8. [DOI] [Google Scholar]
- Dawczynski C, Schubert R, Jahreis G. Amino acids, fatty acids, and dietary fibre in edible seaweed products. Food Chemistry. 2007;103(3):891–899. doi: 10.1016/j.foodchem.2006.09.041. [DOI] [Google Scholar]
- Folch J, Lees M, Sloane-Stanley GHS. A simple method for the isolation and purification of total lipids from animal tissues. Journal of Biological Chemistry. 1956;226(1):497–509. [PubMed] [Google Scholar]
- Gabrielson PW, Widdowson TB, Lindstrom SC. Keys to the seaweeds and seagrasses of Southeast Alaska, British Columbia, Washington, and Oregon. Vancouver, Canada: University of British Columbia; 2006. [Google Scholar]
- Gressler V, Yokoya NY, Fujii MT, Colepicolo P, Mancini Filho J, Pavan Torres R, Pinto E. Lipid, fatty acid, protein, amino acid and ash contents in four Brazilian red algae species. Food Chemistry. 2010;120(2):585–590. doi: 10.1016/j.foodchem.2009.10.028. [DOI] [Google Scholar]
- Haque FKM, Shamima YC, Shanhina A, Abdul Wahab MD, Nath KK. Collection, identification and biochemical analysis of different seaweeds from Saint Martin’s Island, Bangladesh. Journal of Agriculture Research. 2009;34(1):59–65. doi: 10.3329/bjar.v34i1.5754. [DOI] [Google Scholar]
- Hibbeln JR, Nieminen LRG, Blasbalg TL, Riggs JA, Land WEM. Healthy intakes of n-3 and n-6 fatty acids: estimations considering worldwide diversity. American Journal of Clinical Nutrition. 2006;83(6):1483S–1493S. doi: 10.1093/ajcn/83.6.1483S. [DOI] [PubMed] [Google Scholar]
- Hossain ABMS, Salleh A, Boyce AN, Chowdhury P, Naqiuddin M. Biodiesel fuel production from algae as renewable energy. American Journal of Biochemistry and Biotechnology. 2008;4(3):250–254. doi: 10.3844/ajbbsp.2008.250.254. [DOI] [Google Scholar]
- Ibañez E, Cifuentes A. Benefits of using algae as natural sources of functional ingredients. Journal of the Science of Food and Agriculture. 2013;93(4):703–709. doi: 10.1002/jsfa.6023. [DOI] [PubMed] [Google Scholar]
- Kawagishi H, Miyazawa T, Kume H, Arimoto Y, Inakuma T. Aldehyde dehydrogenase inhibitors from the mushroom Clitocybe clavipes. Journal of Natural Products. 2002;65(11):1712–1714. doi: 10.1021/np020200j. [DOI] [PubMed] [Google Scholar]
- Khairy HM, El-Shafay SM. Seasonal variations in the biochemical composition of some common seaweed species from the coast of Abu Qir Bay, Alexandria, Egypt. Ocenologia. 2013;55(2):435–452. doi: 10.5697/oc.55-2.435. [DOI] [Google Scholar]
- Kokilam G, Vasuki S. Biochemical and phytochemical analysis on Ulva fasciata and Caulerpa taxifolia. International Journal of Pharmacy and Pharmaceutical Science. 2013;4(1):7–11. [Google Scholar]
- Kolb N, Vallorani L, Milanovi N, Stocchi V. Evaluation of marine algae Wakame (Undaria pinnatifida) and Kombu (Laminaria digitata japonica) as food supplements. Food Technology and Biotechnology. 2004;42(1):57–61. [Google Scholar]
- Li X, Rezaei R, Li P, Wu G. Composition of amino acids in feed ingredients for animal diets. Amino Acids. 2011;40(4):1159–1168. doi: 10.1007/s00726-010-0740-y. [DOI] [PubMed] [Google Scholar]
- Manivannan K, Thirumaran G, Karthikai DG, Hemalatha A, Anantharaman P. Biochemical composition of seaweeds from mandapam coastal regions along Southeast coast of India. American-Eurasian Journal of Botany. 2008;1(2):32–37. [Google Scholar]
- Miller L, Berger T. Hewlett-Packard Application Note. Avondale, PA: Hewlett-Packard Co; 1985. Bacteria identification by gas chromatography of whole cell fatty acids; pp. 228–241. [Google Scholar]
- Mata L, Magnusson M, Paul NA, Nys R. The intensive land-based production of the green seaweeds Derbesia tenuissima and Ulva ohnoi: Biomass and products. Journal of Applied Phycology. 2016;28(1):365–375. doi: 10.1007/s10811-015-0561-1. [DOI] [Google Scholar]
- Miyake Y, Sasaki S, Tanaka K, Fukushima W, Kiyohara C, Tsuboi Y, Yamada T, Oeda T, Miki T, Kawamura N, Sakae N, Fukuyama H, Hirota Y, Nagai M. Dietary fat intake and risk of Parkinson's disease: A case-control study in Japan. Journal of the Neurological Sciences. 2010;288(1–2):117–122. doi: 10.1016/j.jns.2009.09.021. [DOI] [PubMed] [Google Scholar]
- Mohammadi M, Tajik H, Hajeb P. Nutritional composition of seaweeds from the Northern Persian Gulf. Iranian Journal of Fisheries Sciences. 2013;12(1):232–240. [Google Scholar]
- Murugaiyan K, Narasimman V, Anatharaman P. Proximate composition of marine macro algae from Seeniappa Dharka, Gulf of Mannar region, Tamil Nadu. International Journal of Research Marine Science. 2012;1(1):1–3. [Google Scholar]
- Ortiz J, Romero N, Robert P, Araya J, Lopez-Hernandez J, Bozzo C, Navarrete E, Osorio A, Rios A. Dietary fiber, amino acid, fatty acid and tocopherol contents of the edible seaweeds Ulva lactuca and Durvillaea Antarctica. Food Chemistry. 2006;99(1):98–104. doi: 10.1016/j.foodchem.2005.07.027. [DOI] [Google Scholar]
- O’Sullivan L, Murphy B, McLoughlin P, Duggan P, Lawlor PG, Hughes H, Gardiner GE. Prebiotics from marine macroalgae for human and animal health application. Marine Drugs. 2010;8(7):2038–2064. doi: 10.3390/md8072038. [DOI] [PMC free article] [PubMed] [Google Scholar]
- Pirian K, Piri KH, Sohrabipour J, Tamadoni Jahromi S, Blomster J. Nutritional and phytochemical evaluation of the common green algae, Ulva spp. (Ulvophyceae), from the Persian Gulf. Fundamental Applied Limnology. 2016;188(4):315–327. doi: 10.1127/fal/2016/0947. [DOI] [Google Scholar]
- Pirian K, Zarei Z, Sohrabipour J, Arman M, Faghihi MM, Yousefzadi M. Nutritional and bioactivity evaluation of common seaweed species from the Persian Gulf. Iranian Journal of Science and Technology, Transactions A: Science. 2017;42(4):1795– 1804. doi: 10.1007/s40995-017-0383-x. [DOI] [Google Scholar]
- Pirian K, Piri KH, Sohrabipour J, Blomster J. Three species of Ulva (Ulvophyceae) from the Persian Gulf as potential sources of protein, essential amino acids and fatty acids. Phycological Research. 2018;66(2):149–154. doi: 10.1111/pre.12212. [DOI] [Google Scholar]
- Pycke BFG, Faasse M. Biochemical composition and quality assessment of native macroalgae collected along the Flemish coast, Public output report of the EnAlgae project, Oostende. 2015. Dec 30, 2015. http://www.aquacultuurvlaanderen.be/sites/aquacultuurvlaanderen.be/files/public/enalgae_belgian_seaweed_study.pdf.
- Ratana-arporn P, Chirapart A. Nutritional evaluation of tropical green seaweeds Caulerpa lentillifera and Ulva reticulata. Kasetsart Journal (Natural Science) 2006;40(Suppl):75–83. [Google Scholar]
- Rodrigues D, Freitas AC, Pereira L, Rocha-Santos TAP, Vasconcelos MW, Roriz M, Rodríguez-Alcala LM, Gomes AMP, Duarte AC. Chemical composition of red, brown and green macroalgae from Buarcos bay in Central West Coast of Portugal. Food Chemistry. 2015;183:197–207. doi: 10.1016/j.foodchem.2015.03.057. [DOI] [PubMed] [Google Scholar]
- Rohani-Ghadikolaei K, Abdulalian E. Evaluation of the proximate, fatty acid and mineral composition of representative green, brown and red seaweeds from the Persian Gulf of Iran as potential food and feed resources. Journal of Food Science Technology. 2012;49(6):774–780. doi: 10.1007/s13197-010-0220-0. [DOI] [PMC free article] [PubMed] [Google Scholar]
- Salem N, Simopoulos AP, Galli C, Lagarde M, Knapp HR. Fatty acids and lipids from cell biology to human disease. Lipids. 1996;31(1):1–326. doi: 10.1007/BF02637042. [DOI] [Google Scholar]
- Sánchez-Machado DI, López-Hernández J, Paseiro-Losada P. Fatty acids, total lipid, protein and ash contents of processed edible seaweeds. Food Chemistry. 2004;85(3):439–444. doi: 10.1016/j.foodchem.2003.08.001. [DOI] [Google Scholar]
- Satpati GG, Pal R. Biochemical composition and lipid characterization of marine green alga Ulva rigida: A nutritional approach. Journal of Algal Biomass Utilization. 2011;2(4):10– 13. [Google Scholar]
- Siddique MAM, Aktar M, Mohd Khatib MA. Proximate chemical composition and amino acid profile of two red seaweeds (Hypnea pannosa and Hypnea musciformis) collected from St. Martin’s Island, Bangladesh. Journal of Fish Science. 2013;7(2):178–186. [Google Scholar]
- Sohrabipour J, Rabiei R. New records of algae for Persian Gulf and flora of Iran. Iranian Journal of Botany. 1996;7(1):53–61. [Google Scholar]
- Sohrabipour J, Rabiei R. A list of marine algae of sea shores of the Persian Gulf and Oman Sea in the Hormozgan province. Iranian Journal of Botany. 1999;8:131–162. [Google Scholar]
- Stirk WA, Reinecke DL, Staden JV. Seasonal variation in antifungal, antibacterial and acetylcholinesterase activity in seven South African seaweeds. Journal of Applied Phycology. 2007;19(3):271–276. doi: 10.1007/s10811-006-9134-7. [DOI] [Google Scholar]
- Swanson KS, Carter RA, Yount TP. Nutritional sustainability of pet food. Advances in Nutrition. 2013;4(2):141–150. doi: 10.3945/an.112.003335. [DOI] [PMC free article] [PubMed] [Google Scholar]
- Tabarsa M, Rezaei M, Ramezanpour Z, Waaland JR, Rabiei R. Fatty acids, amino acids, mineral contents, and proximate composition of some brown seaweeds. Journal of Phycology. 2012;48(2):285–292. doi: 10.1111/j.1529-8817.2012.01122.x. [DOI] [PubMed] [Google Scholar]
- Terry P, Lichtenstein P, Feychting M, Ahlbom A, Wolk A. Fatty fish consumption and risk of prostate cancer. Lancet. 2001;357(9270):1764–1766. doi: 10.1016/S0140-6736(00)04889-3. [DOI] [PubMed] [Google Scholar]
- World Health Organisation (WHO) Population nutrient intake goals for preventing diet-related chronic diseases. WHO Technical Report Series No. 916 2008 [Google Scholar]
- Zucchi MR, Necchi O. Effects of temperature, irradiance and photoperiod on growth and pigment content in some freshwater red algae in culture. Phycological Research. 2001;49(2):103–114. doi: 10.1111/j.1440-1835.2001.tb00240.x. [DOI] [Google Scholar]


