Abstract
Brain PET scanners that simultaneously provide high-resolution across the field-of-view and high-sensitivity can be constructed using detectors based on SiPM arrays coupled to both ends of scintillator arrays with finely segmented and long detector elements. To reduce the dead space between detector modules and hence improve the sensitivity of PET scanners, crystal arrays with curved surfaces are proposed. In this paper, the performance of a proof-of-concept detector module with nine detector submodules based on SiPMs coupled to both ends of a curved LYSO array with a pitch size of 1.0 × 1.0 mm2 at the front-end and a length of 30 mm was evaluated. A simple signal multiplexing method using the shared-photodetector readout method was evaluated to identify the crystals. The results showed that all the LYSO elements in the detector module of interest could be clearly resolved. The energy resolution, depth-of-interaction resolution, and timing resolution were 14.6 ± 3.6 %, 2.77 ± 0.39 mm, and 1.15 ± 0.07 ns respectively, obtained at a bias voltage of 28.0 V and a temperature of 16.8 ± 0.2 °C.
1. Introduction
Development of a brain PET scanner which simultaneously provides high spatial resolution and high sensitivity could significantly benefit detection of neurological disease and measurement of brain function, especially in the study of low-density receptors in the thin strip of grey matter comprising the cerebral cortex, which has a thickness of 1–3 mm (Jones and Rabiner 2012, Kandel et al 2000).
Various methods have been proposed to improve the spatial resolution and to increase the sensitivity, such as using LYSO arrays with a small pitch to improve the resolution (James et al 2009b, Yamamoto et al 2016, Du et al 2018b), and using monolithic scintillators (eliminating inter-crystal reflectors) and scintillator arrays with a tapered shape (reducing the dead space between the detector modules) to improve the sensitivity (James et al 2009a, Yang et al 2016, Borghi et al 2018, Gonzalez et al 2018). The sensitivity of monolithic scintillator-based PET scanners can be significantly higher due to the elimination of the reflector gaps that are present in multi-crystal arrays (Borghi et al 2018, Gonzalez et al 2018). However, the limitations of monolithic detectors include the need for complex position estimation algorithms, the strong trade-off between sensitivity and spatial resolution, and the non-uniform spatial resolution (Joung et al 2002, Wang et al 2011, Dam et al 2011). Although tapered scintillator arrays have been proposed and used in small animal PET scanners/detectors, the dead space between detector modules is only reduced and not entirely eliminated (James et al 2009a and Yang et al 2016).
We are proposing to build a brain PET scanner without any deadspace between dual-ended readout detector modules to obtain both high-sensitivity and uniformly high spatial resolution across the field-of-view (FOV) (figure 1) (Moses and Derenzo 1994, Yang et al 2009 and Du et al 2018b). The detector modules are based on SiPM arrays coupled to both ends of curved-shape LYSO arrays with identical LYSO elements. The proposed PET scanner, with an inner diameter of 305.6 mm and an axial length of 240 mm, will have 256 detector modules arranged in 8 rings, and each detector module will have a 30 × 30 LYSO array with a pitch size of 1.0 mm (for high-resolution) at the front-end and a length of 30 mm (for high-sensitivity). The estimated sensitivity of the proposed scanner is ~16.0%, which is ~2× higher than the sensitivity of scanners based on conventional detectors. A shared-photodetector readout method is also proposed to identify all the LYSO elements (Du el al 2018c). This has previously been evaluated in one-dimension and here is extended to two-dimensions. In this paper, the performance of a proof-of-concept detector module consisting of 9 submodules was evaluated in terms of flood histogram, energy resolution, depth-of-interaction (DOI) resolution and timing resolution. A signal multiplexing readout with the two-dimensional shared-photodetector readout implemented was also introduced and evaluated.
Figure 1.
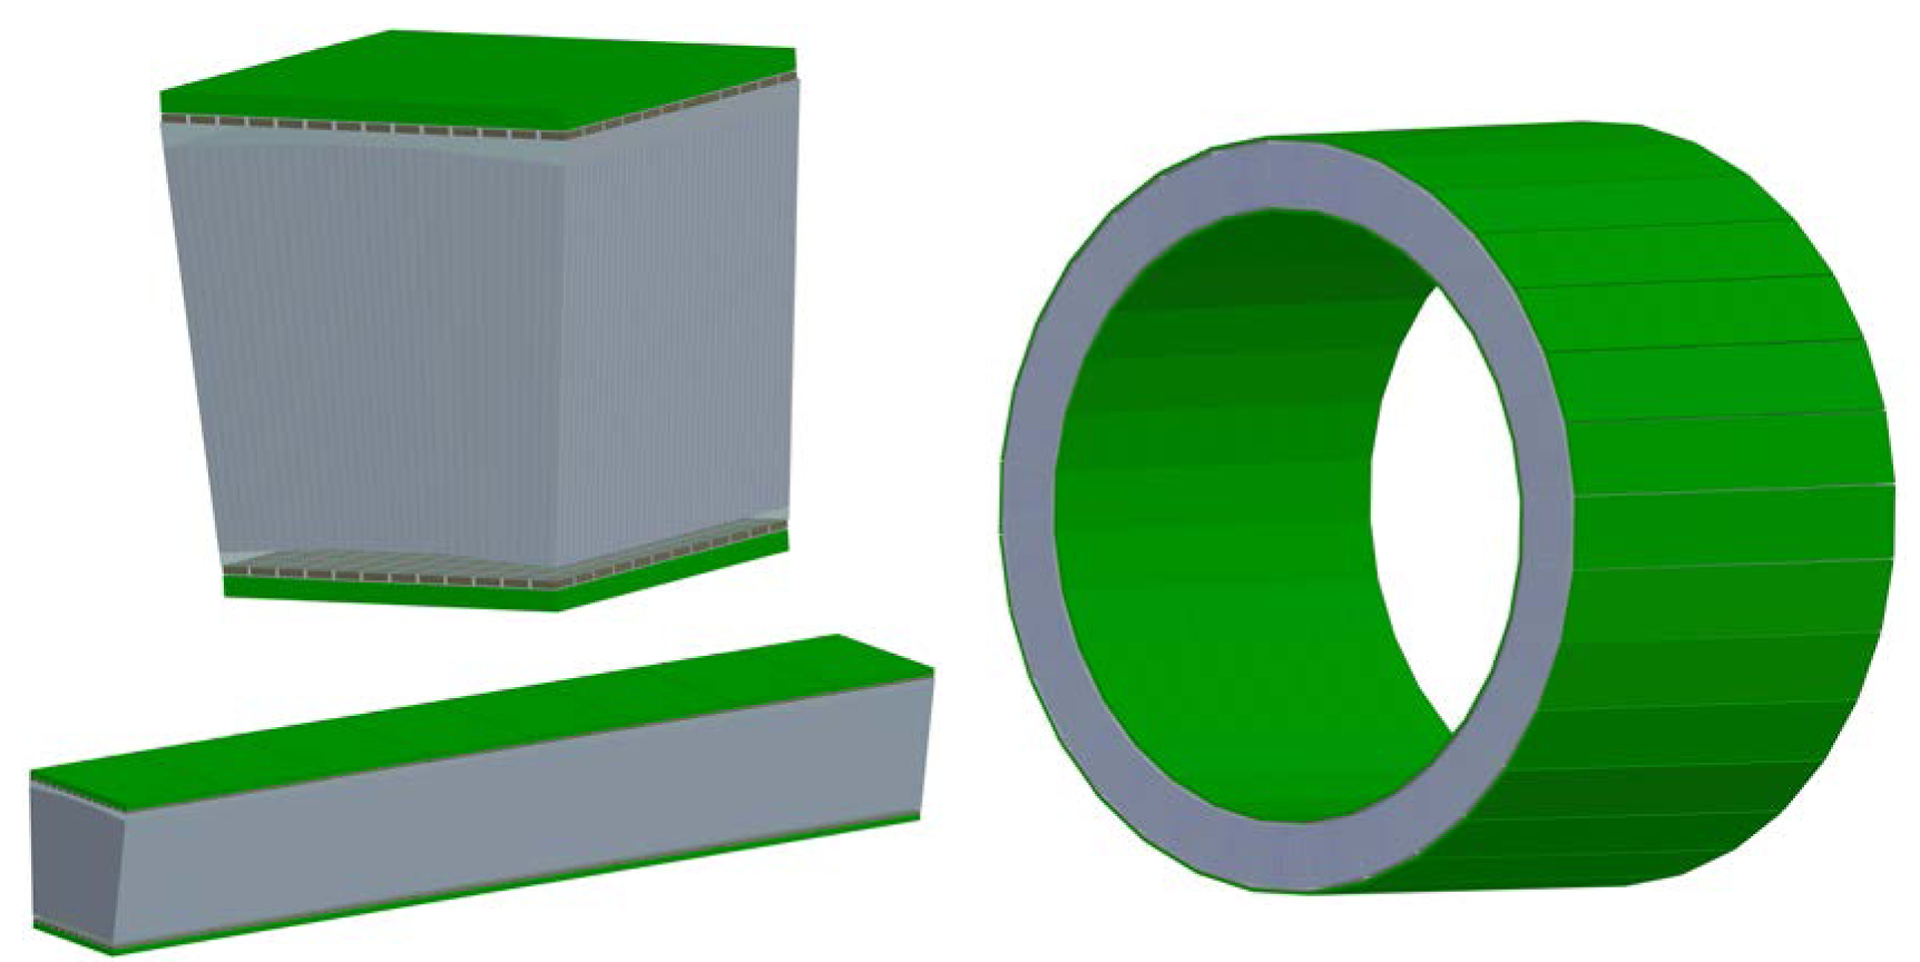
Schematics of (left top) one detector module, (left bottom) the eight detector modules in the axial direction and (right) the proposed scanner. The proposed scanner has an inner diameter of 305.6 mm and an axial length of 240 mm.
2. Materials and Methods
2.1. DOI detector module
The dimensions and a photograph of the curved LYSO array are shown in figure 2. The LYSO array, consisting of a 30 × 30 array of identical LYSO elements and fabricated by working with Sichuan Tianle Photonics (Chengdu, China), has a pitch size of 1.0 × 1.0 mm2 at the front-end and a pitch size of 1.0 × 1.196 mm2 at the rear-end. The length of the LYSO elements is 30 mm, and Toray reflector, with a thickness of 50 um, was used between the crystals. The LYSO array has an inner radius of 152.78 mm, which is designed for a brain PET scanner with 960 crystals elements per crystal ring.
Figure 2.
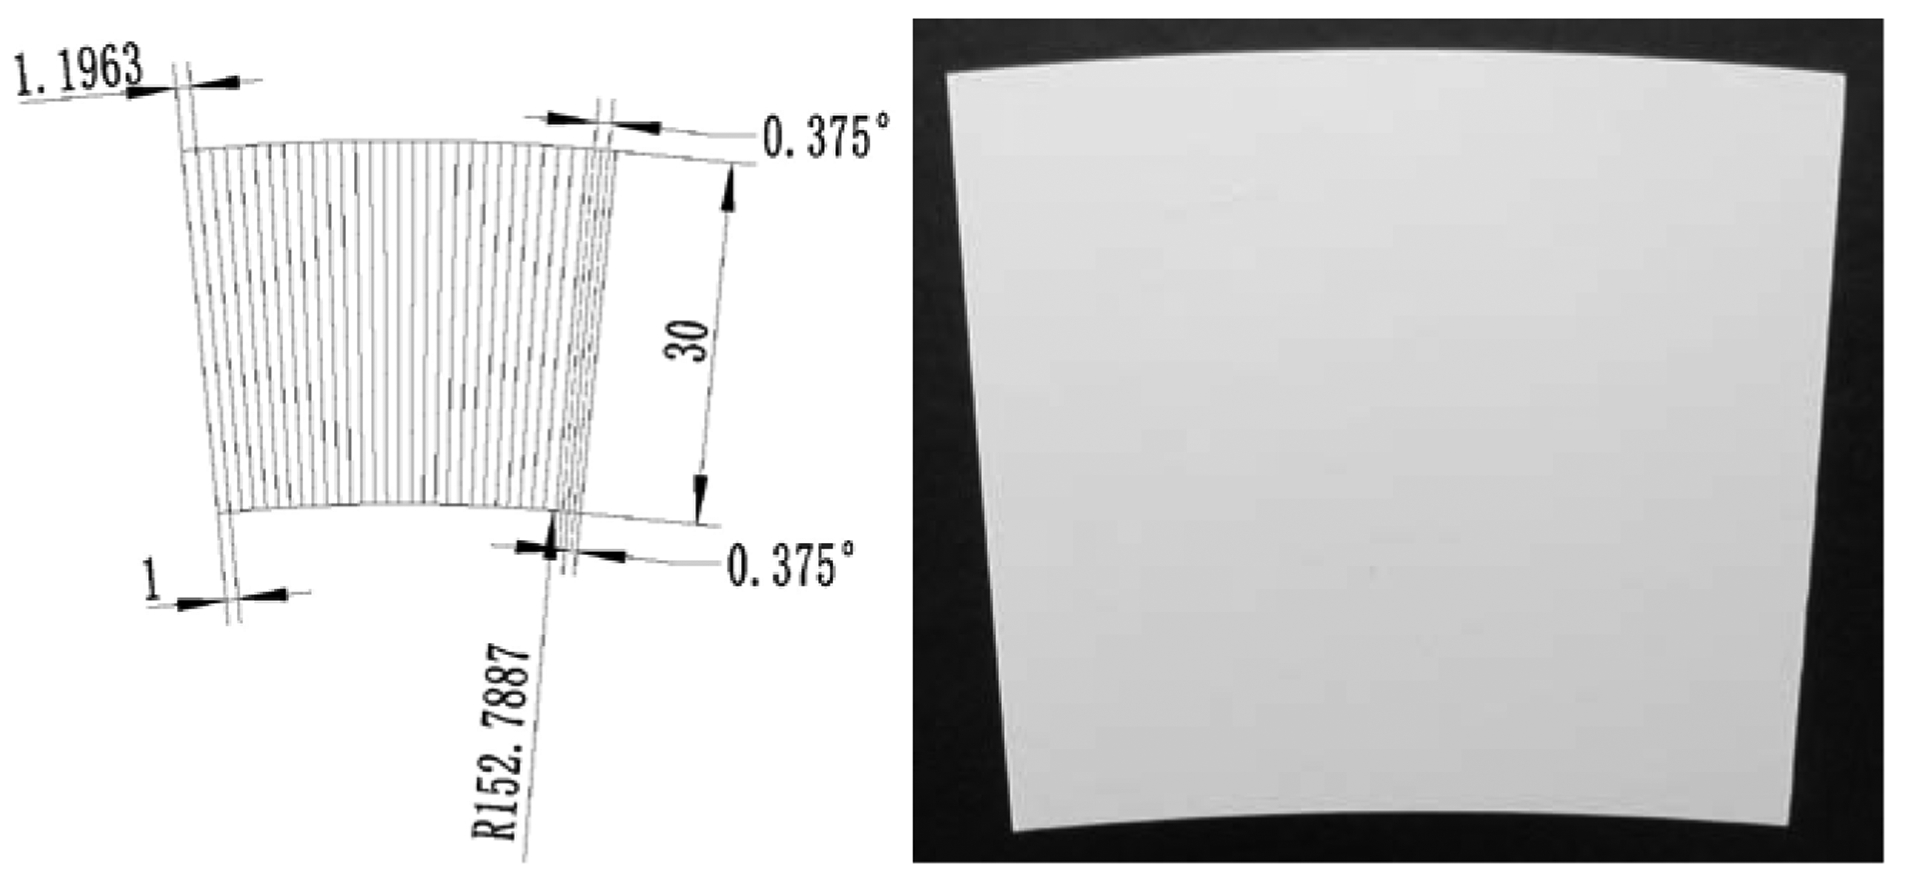
(left) schematic and (right) photograph of the curved LYSO array.
The assembled detector block, consisting of 3 × 3 detector submodules, is shown in figure 3. Each detector submodule consists of two 3 × 3 SiPM arrays coupled to both ends of 10 × 10 LYSO elements within the LYSO array (figure 3). Clear flexible silicone rubber sheets with a thickness of 1.0 mm were used as a light guide (ASIN: B071KQLRXB, Shenzhen Laimeisi Silicone Industry Co. Ltd., Shenzhen, China), and BC-630 silicon grease (Saint-Gobain S.A.) was used as coupling material both between the SiPM arrays and the silicone rubber sheets, as well as between the silicon rubber sheets and the LYSO array. The LYSO array, the silicone rubber sheets and the SiPM arrays were assembled together using a 3D-printed holder (figure 3).
Figure 3.

Photographs of (left) the front-end and (middle) the rear-end of the assembled detectors, and (right) a schematic showing the locations of the nine detector submodules (view from the front-end).
2.3. SiPM arrays
Two different SiPM array boards were fabricated using SensL MicroFJ-30035 SiPMs. Each SiPM array board has three 3 × 3 SiPM arrays (figure 4). The SiPM array boards coupled to the front-end and the rear-end of the LYSO array have a width of 9.8 mm and 12.0 mm respectively, and the pitch sizes of the SiPM arrays coupled to the front-end and the rear-end of the LYSO array are 3.33 × 3.26 mm2 and 3.33 × 4.0 mm2 respectively (figure 4).
Figure 4.
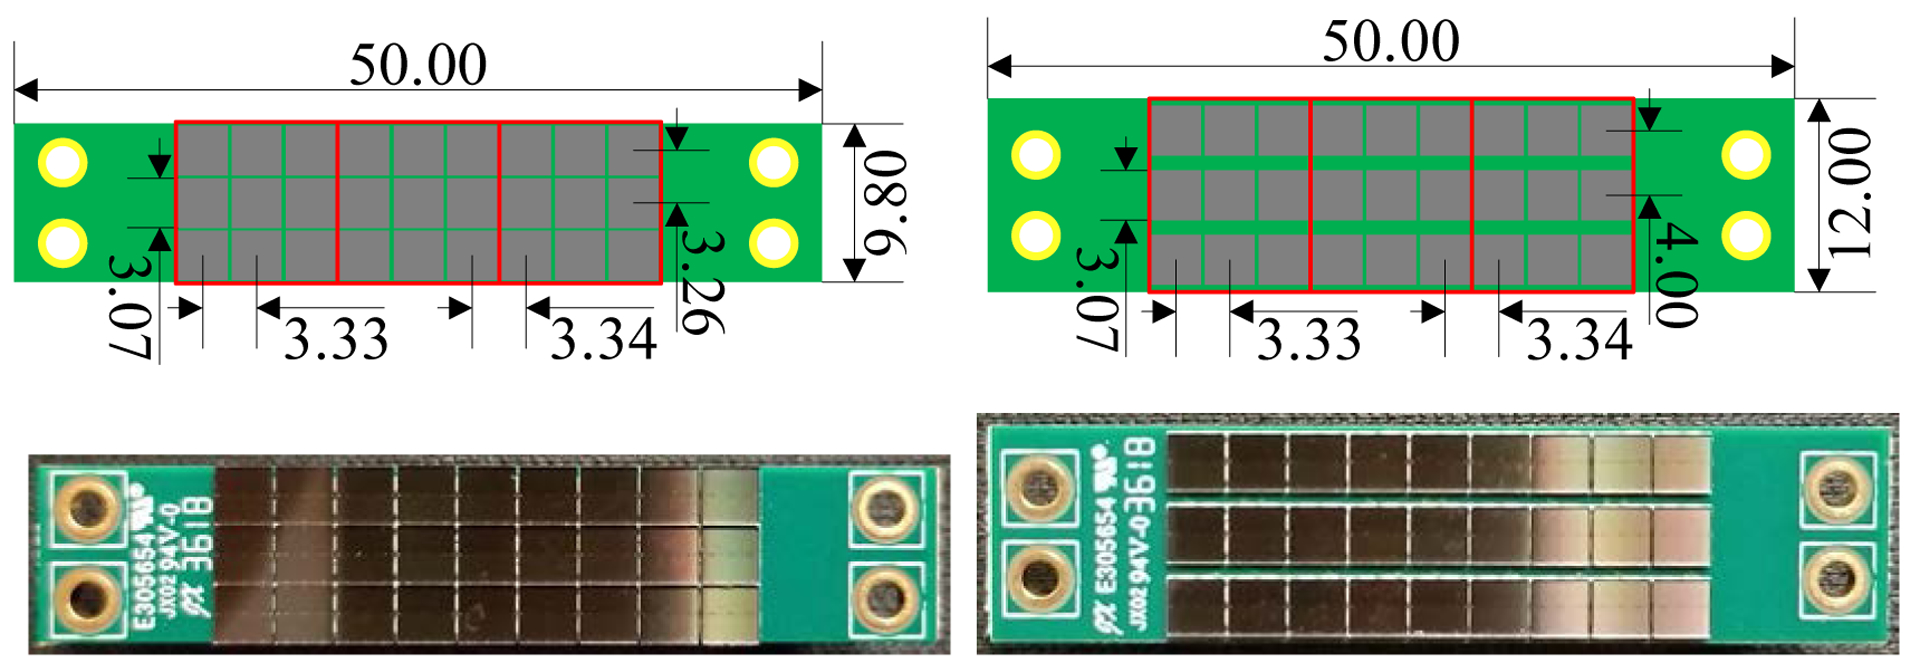
(top row) schematics and (bottom row) photographs of the SiPM array boards coupled to (left column) the front-end and (right column) the rear-end of the LYSO array. Each SiPM array board has three 3 × 3 SiPM arrays (red rectangles). All the dimensions in the schematics are in millimeters.
The SensL MicroFJ-30035 SiPMs have an active area of 3.07 × 3.07 mm2, a package size of 3.16 × 3.16 mm2, and each SiPM has 5676 microcells (35 um). The peak sensitivity of the SiPMs is at 420 nm, matching the peak emission wavelength of the LYSO scintillator (Mao et al 2008).
2.3. Readout electronics
To simplify the readout electronics, a signal multiplexing method was implemented (figure 5 (left). In this readout method, the signals of each SiPM array were read out from both the anode sides and the cathode sides of the SiPMs. For each 3 × 3 array of SiPMs (such as these shown in black in figure 5 (left)), the anodes of SiPMs in the same row were connected directly to form 3 row signals, and the cathodes of SiPMs in the same column were connected directly to form 3 column signals. Each row/column signal was then amplified individually.
Figure 5.
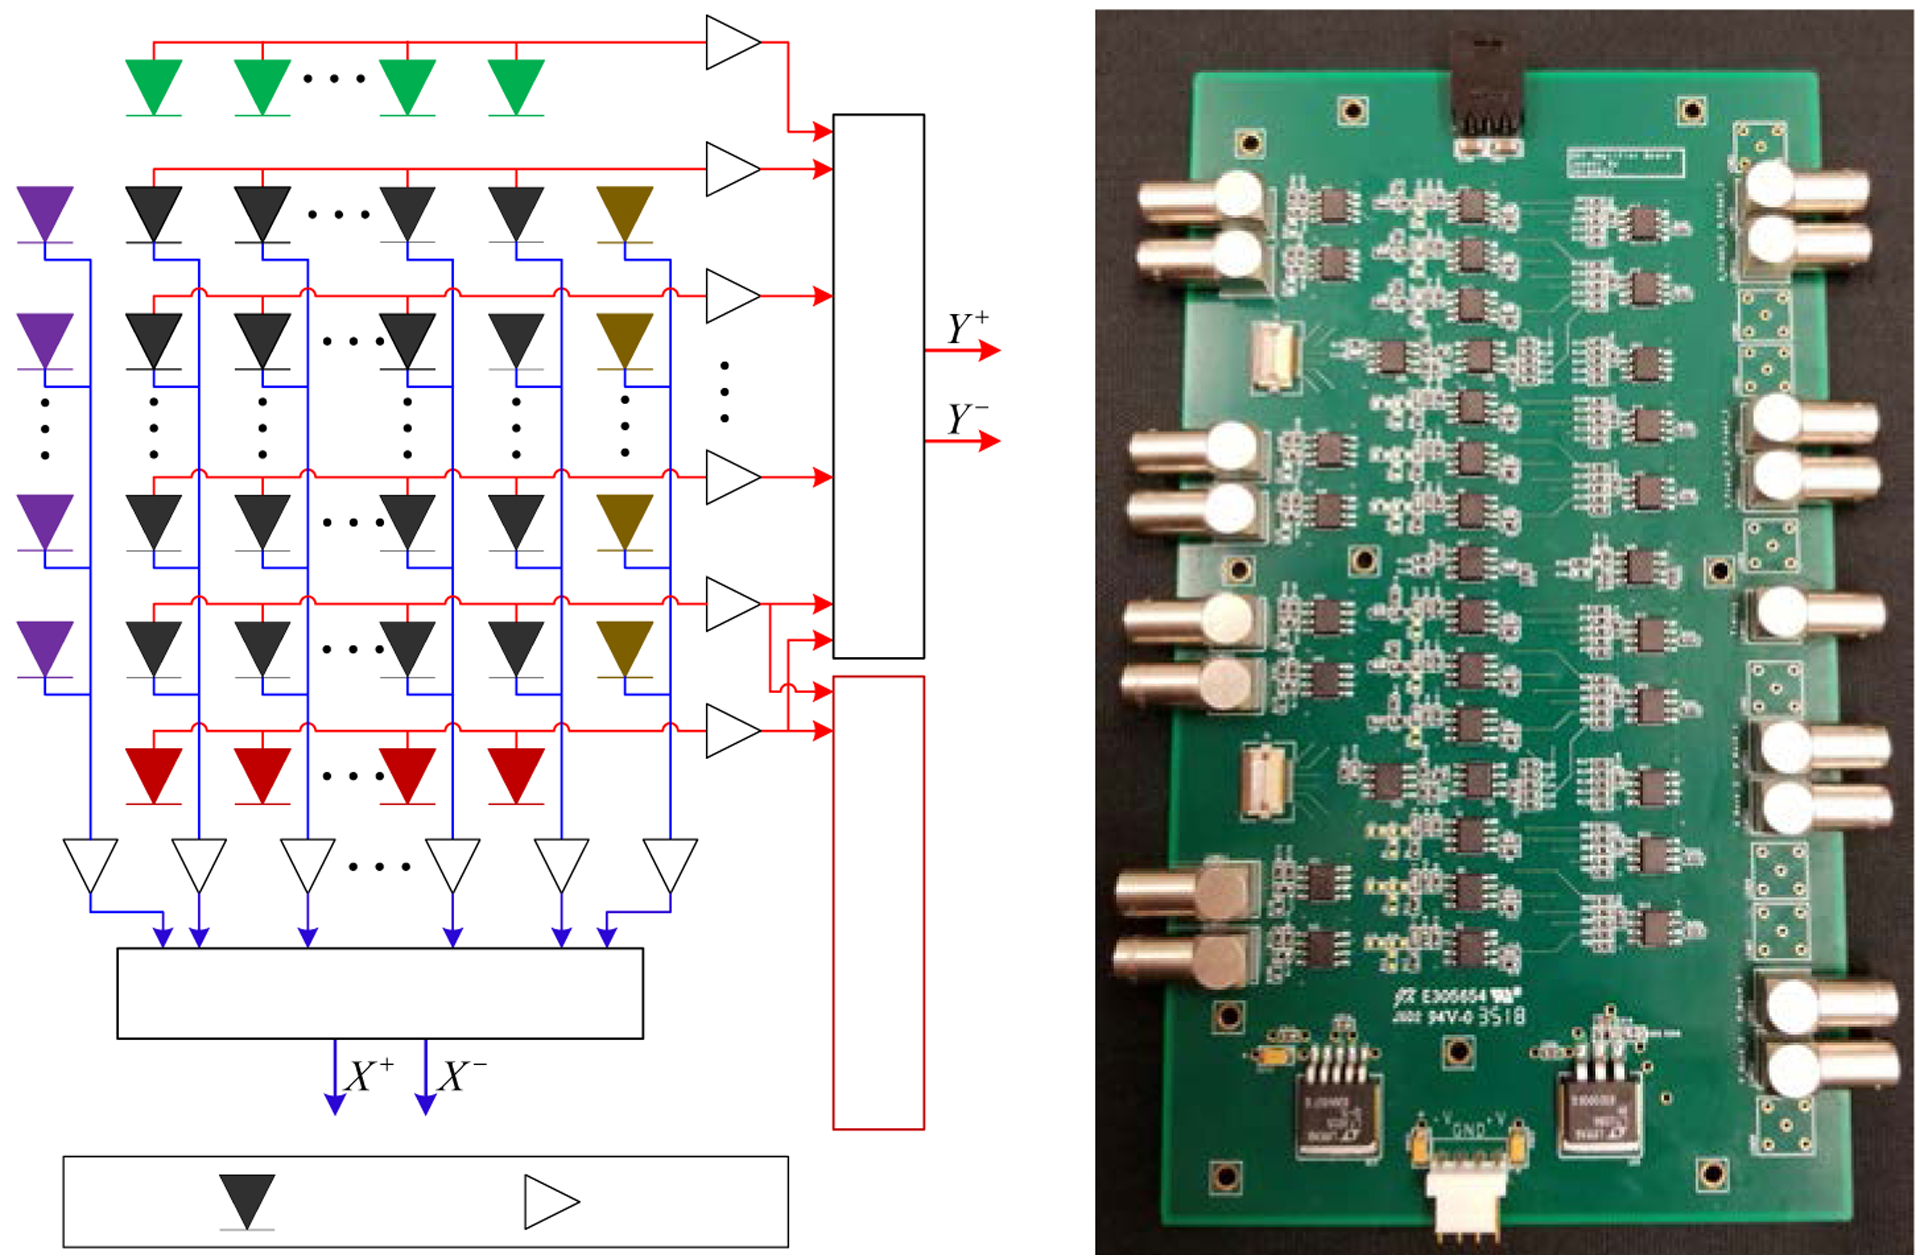
(left) schematic of the readout electronics and (right) photograph of the amplifier board.
To resolve all the 10 × 10 LYSO crystals of the central detector submodule and eliminate the edge effect, which is a common feature in PET detectors in which the pitch size of the photodetectors is larger than the pitch size of the scintillator elements, the nearest neighbor SiPMs (shown in colors other than black) around the central SiPM array (shown in black) were also used for positioning (figure 5 (left)). These amplified row/column signals of the nearest neighbor SiPMs together with the amplified row/column signals of the central SiPM array were sent to the position encoding circuit which weights each row/column signal by applying a weighted gain to each row/column signal proportional to its location along each axis, generating 4 signals (X+, X– and Y+, Y–) for position information (Du et al 2018a). For a DOI detector submodule with two SiPM arrays, 8 signals for position information are generated. In a full scanner, this shared photodetector readout approach can be used to read out all detector modules, except the ones at the axial extremes of the scanner which do not have a neighbor in the axial direction.
The timing signal was obtained from the sum of all the amplified row/column signals, including the 6 row/column signals of the central detector submodule and the 4 row/column signals of the nearest four surrounding detector submodules of the central detector module.
Whilst the signal multiplexing stage was implemented on the SiPM array board (figure 4), the amplification and position encoding stages were implemented on a dedicated amplifier board (figure 5 (right)) using AD8045 amplifiers (Analog Device, Inc.). Each amplifier board can receive the signals of one detector submodule and the 8 row/column signals of the four surrounding neighboring detector modules.
The eight position signals from the central detector submodule were further amplified and shaped using a CAEN spectroscopy amplifier (N568B, CAEN) and digitized by an 8-channel digitizer (PD2MFS, United Electronic Industries).
During the flood histogram and the DOI measurements, the gamma photon interaction position (x, y), deposited energy (E) and DOI information were calculate as follows (Du et al 2018b):
| (1) |
| (2) |
| (3) |
| (4) |
Where , , , (i=1, 2) are the 4 digitized position signals from the front-end and rear-end SiPM array of the central detector submodule respectively, and E1 and E2 are the total energy values measured by the two SiPM arrays.
For the timing resolution measurement, as the digitizer has only 8 channels and the output of the time-to-digital converter (TAC) also needs to be digitized, the 8 position signals were further reduced to 4 position signals using summing amplifiers based on AD8045 amplifiers and the following formula:
| (5) |
| (6) |
The gamma photon interaction position (x, y) and the deposited energy (E) were calculated as follows:
| (7) |
| (8) |
2.4. Experimental methods
Performance in terms of flood histograms, energy resolution, DOI resolution and timing resolution were measured at a bias voltage of 28.0 V and a temperature of 16.8 ± 0.2 °C. A 0.25 mm diameter, 25 uCi 22Na point source was used to irradiate the LYSO array.
A 350 −750 keV energy window was used to select events and two different event selection methods were used as follow:
After the events were assigned to each crystal, energy spectra were generated for each crystal, and the 350 – 750 keV energy window was applied to the events from each crystal. This event selection method was abbreviated as “Crystal-EW”.
First events were assigned to each crystal, then events were assigned to different depths of each crystals (10 depths for the flood histograms measurement, and 14 depths for the DOI measurements), and then the energy window was applied to events from each crystal and each depth. This event selection method was abbreviated as “crystal-depth-EW”.
The interaction depths of the events obtained for the flood histogram were calculated using the detector-level DOI calibration curve (the relationship between the DOI ratio and the depth) obtained from the DOI measurement.
The flood histograms, energy resolution and DOI resolution obtained using the two event selection methods were calculated and compared.
2.4.1. Flood histogram
The flood histograms of the central detector (detector 5 shown in figure 3) were acquired using a reference detector consisting of a Hamamatsu R13449–10 PMT coupled to a LYSO cylinder with a diameter of 25 mm and a length of 30 mm. Two different readout methods were used to acquire the flood histogram: the conventional readout method without using signals from the 4 nearest surrounding detectors and the shared-photodetector readout method using the signals from the 4 surrounding detectors (detectors 2, 4, 6 and 8 shown in figure 3) (Du et al 2018b).
2.4.2. Energy resolution
The energy resolution, calculated as the ratio of the FWHM to the peak position of the 511 keV photopeak from a Gaussian fit, was calculated using the data obtained for the flood histogram. The energy resolution was calculated for each crystal, and the average value and the standard deviation value of the energy resolution of all the 100 crystals of the central detector was used as a measure of the energy resolution.
2.4.3. DOI resolution
The DOI resolution of an edge detector (detector 8 shown in figure 3) was measured using a reference detector consisting of a 0.5 × 20 × 20 mm3 LYSO slab coupled to a Hamamatsu R13449–10 PMT and at 14 depths (from 2 mm to 28 mm, in 2 mm steps) by irradiating the detector from one side (figure 6) (Yang et al 2009 and Du et al 2018b). An edge detector instead of the central detector is used for the DOI measurement to avoid the reduction in signal, increase in scattered photons and the divergence of the collimated beam with increasing penetration into the crystal array when using side irradiation. The distance between the reference detector and the radiation source was 10 cm, and the distance between the radiation source and the surface of the LYSO array was 6.5 cm (figure 6). Due to the geometry of the experimental setup (figure 6), only part of the LYSO array can be irradiated at one time, therefore only the 8 × 8 LYSO elements shown in the white rectangle in figure 7 were used to measure the DOI resolution, which was quantified as the FWHM of a Gaussian fit to the DOI distribution.
Figure 6.
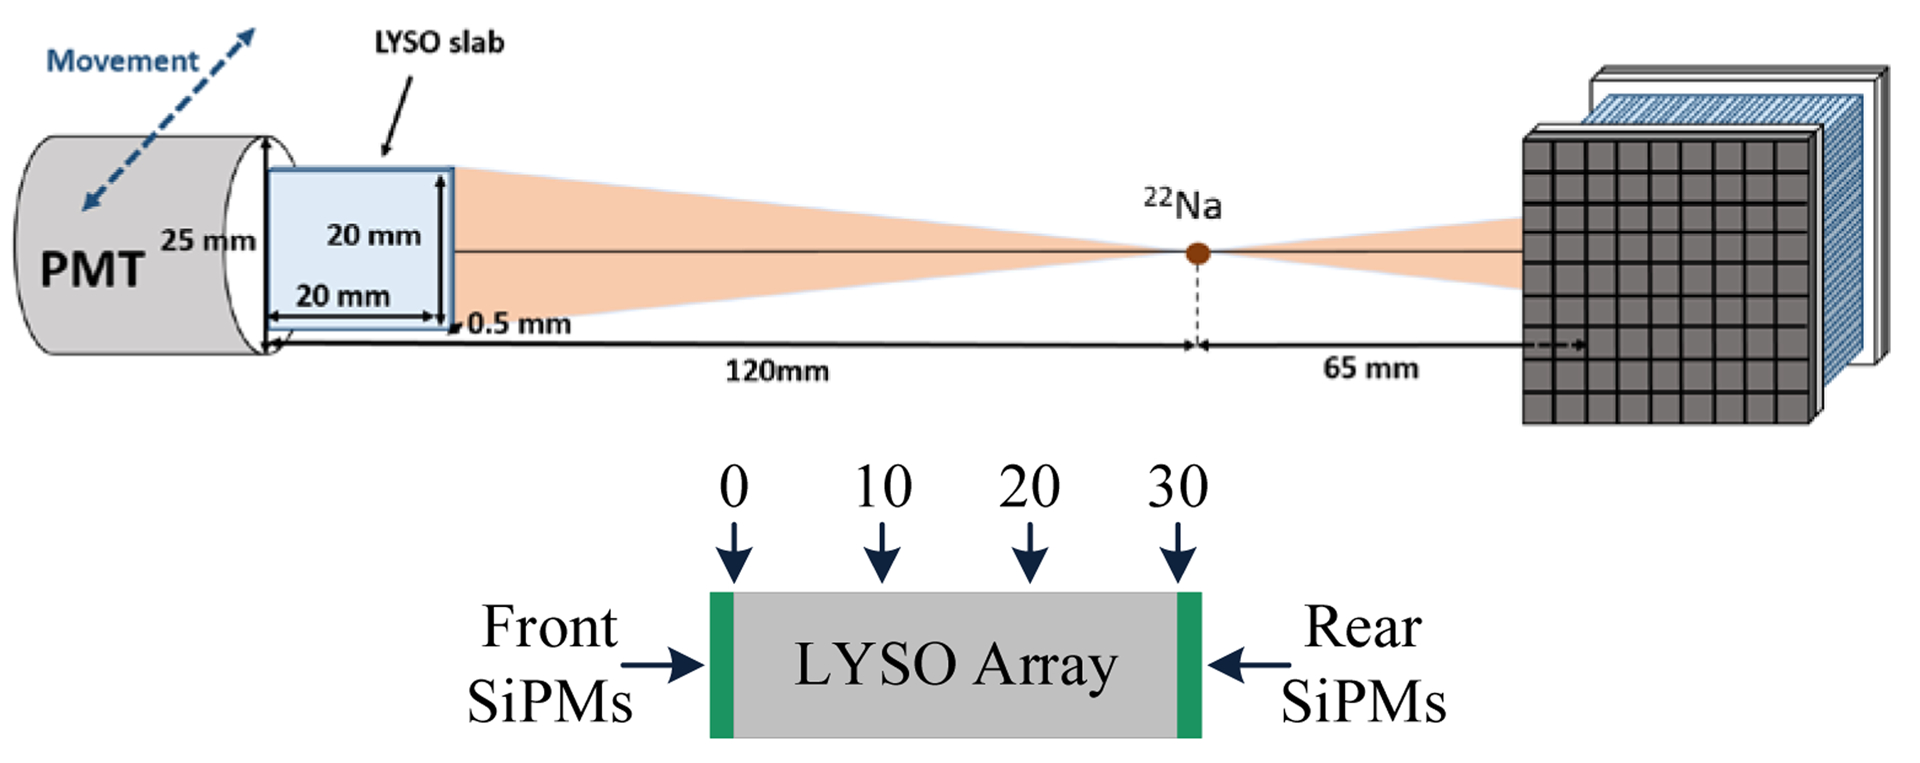
Schematic showing (top) the geometry of the DOI setup and (bottom) the interaction position of the gamma photons in millimeters.
Figure 7.
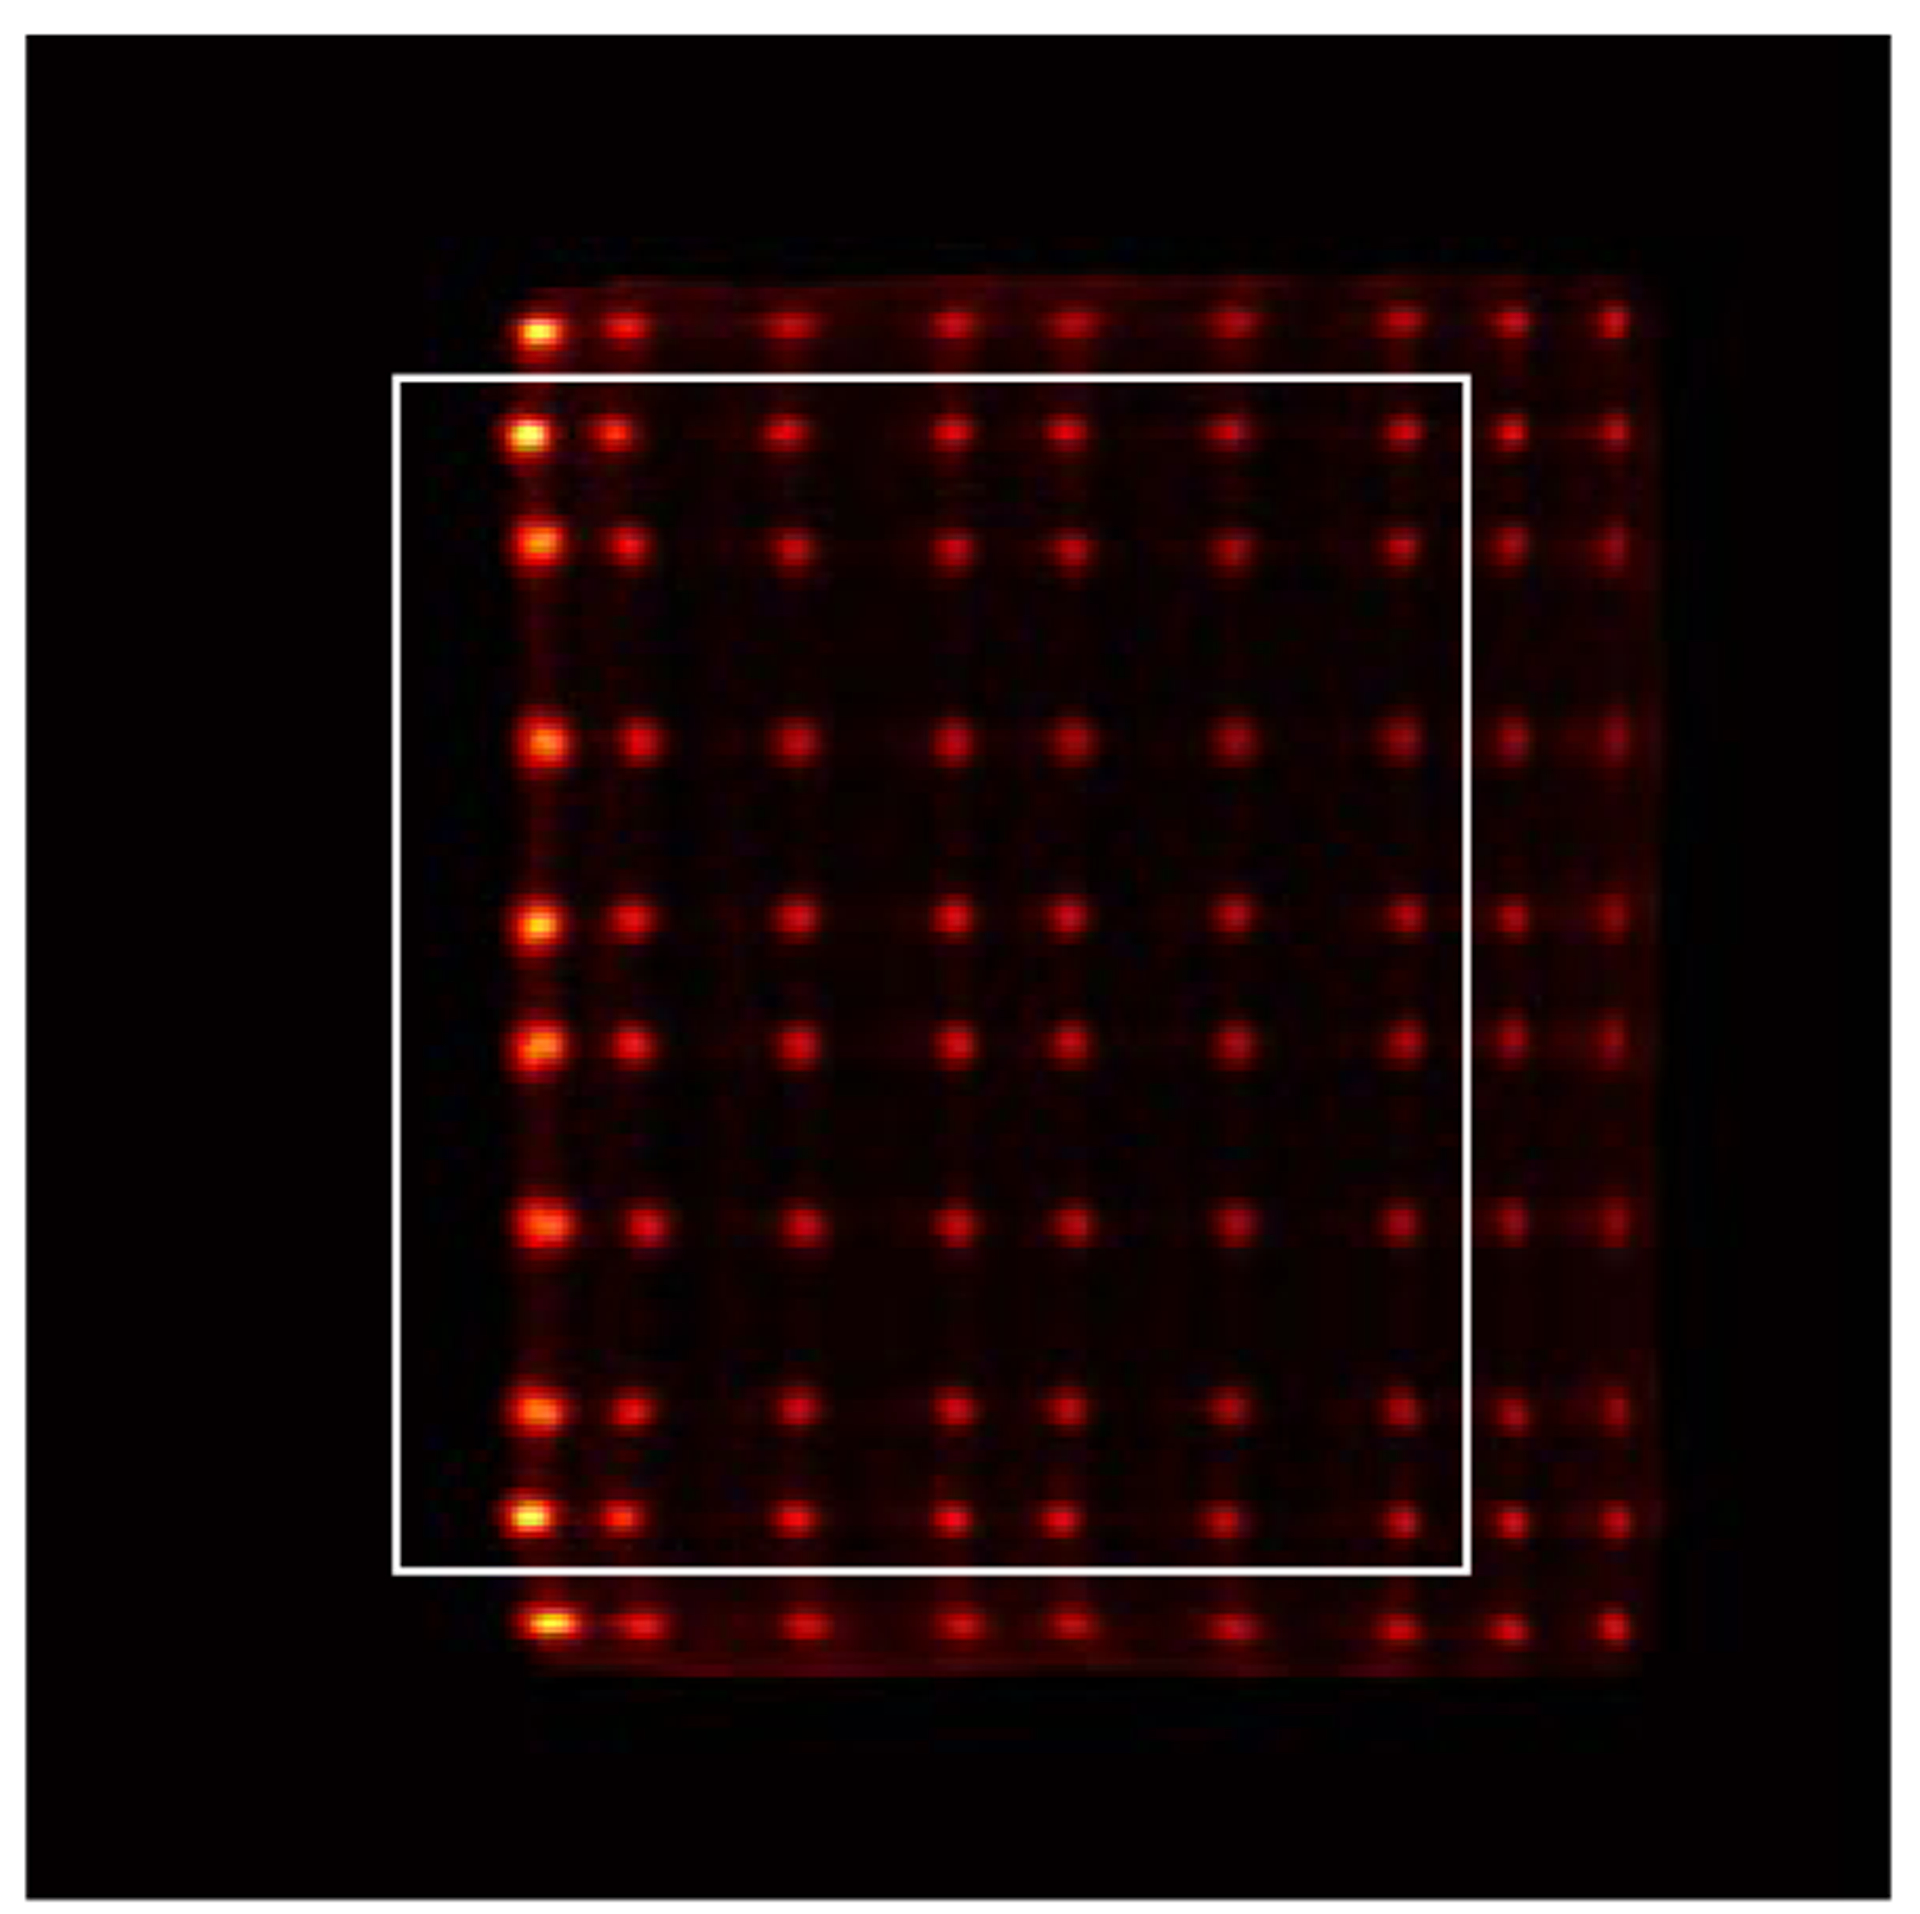
Flood histogram obtained during the DOI resolution measurement. The 8 × 8 LYSO elements in the white rectangle were used to measure the DOI resolution. Due to the edge effect, the two outmost left column crystals could not be resolved but separated manually by draw a line across the crystal spot.
Two different DOI resolutions, the crystal-level DOI resolution and the detector-level DOI resolution, were calculated using the same experimental data following the method of Yang et al 2009 and described briefly here (Yang et al 2009):
Crystal-level DOI resolution: the relationship between the DOI ratio and depth were calculated for each crystal after the events were assigned to each crystal, and the DOI resolution was calculated for each crystal and each depth. 896 DOI resolution values were obtained by making measurements across the 64 crystals and the 14 depths in this method. The average value and the standard deviation value of the 896 DOI resolution values were used as a measure as the crystal-level DOI resolution of the detector.
Detector-level DOI resolution: the relationship between the DOI ratio and the depth were calculated for the whole detector without assigning the events to each crystal. Measurements at just 14 DOI resolution values were obtained in this method. The average value and the standard deviation value of the 14 DOI resolution values were used as a measure as the detector-level DOI resolution of the detector.
2.4.4. Timing resolution
The timing resolution of the central detector (detector 5 shown in figure 3) was measured using a reference detector consisting of a Hamamatsu R13449–10 PMT coupled to a LYSO cylinder with a diameter of 20 mm and a length of 5 mm. The LYSO signal and the PMT signal were used as the start and the stop signal of a TAC, and the output of the TAC was digitized by the PD2MFS digitizer. The timing spectra were extracted for each LYSO crystal and the FWHM of a Gaussian fit to the timing spectrum was treated as the timing resolution of that crystal. The average timing resolution across all 100 crystals of the central detector submodule was used as a measure of the timing resolution. The coincidence timing resolution of two identical reference detectors was measured to be 200 ± 10 ps.
3. Results
3.1. Flood histograms
Figure 8 shows the flood histograms obtained using different data processing methods. The outermost two rows/columns of LYSO elements of the central detector cannot be resolved using the conventional readout method which does not use the signals from its surrounding detectors (figure 8 (a)) due to the edge effects, whilst all 10 × 10 LYSO elements of the central detector can be clearly identified using the proposed shared-photodetector readout method (figure 8 (d) and (e)).
Figure 8.
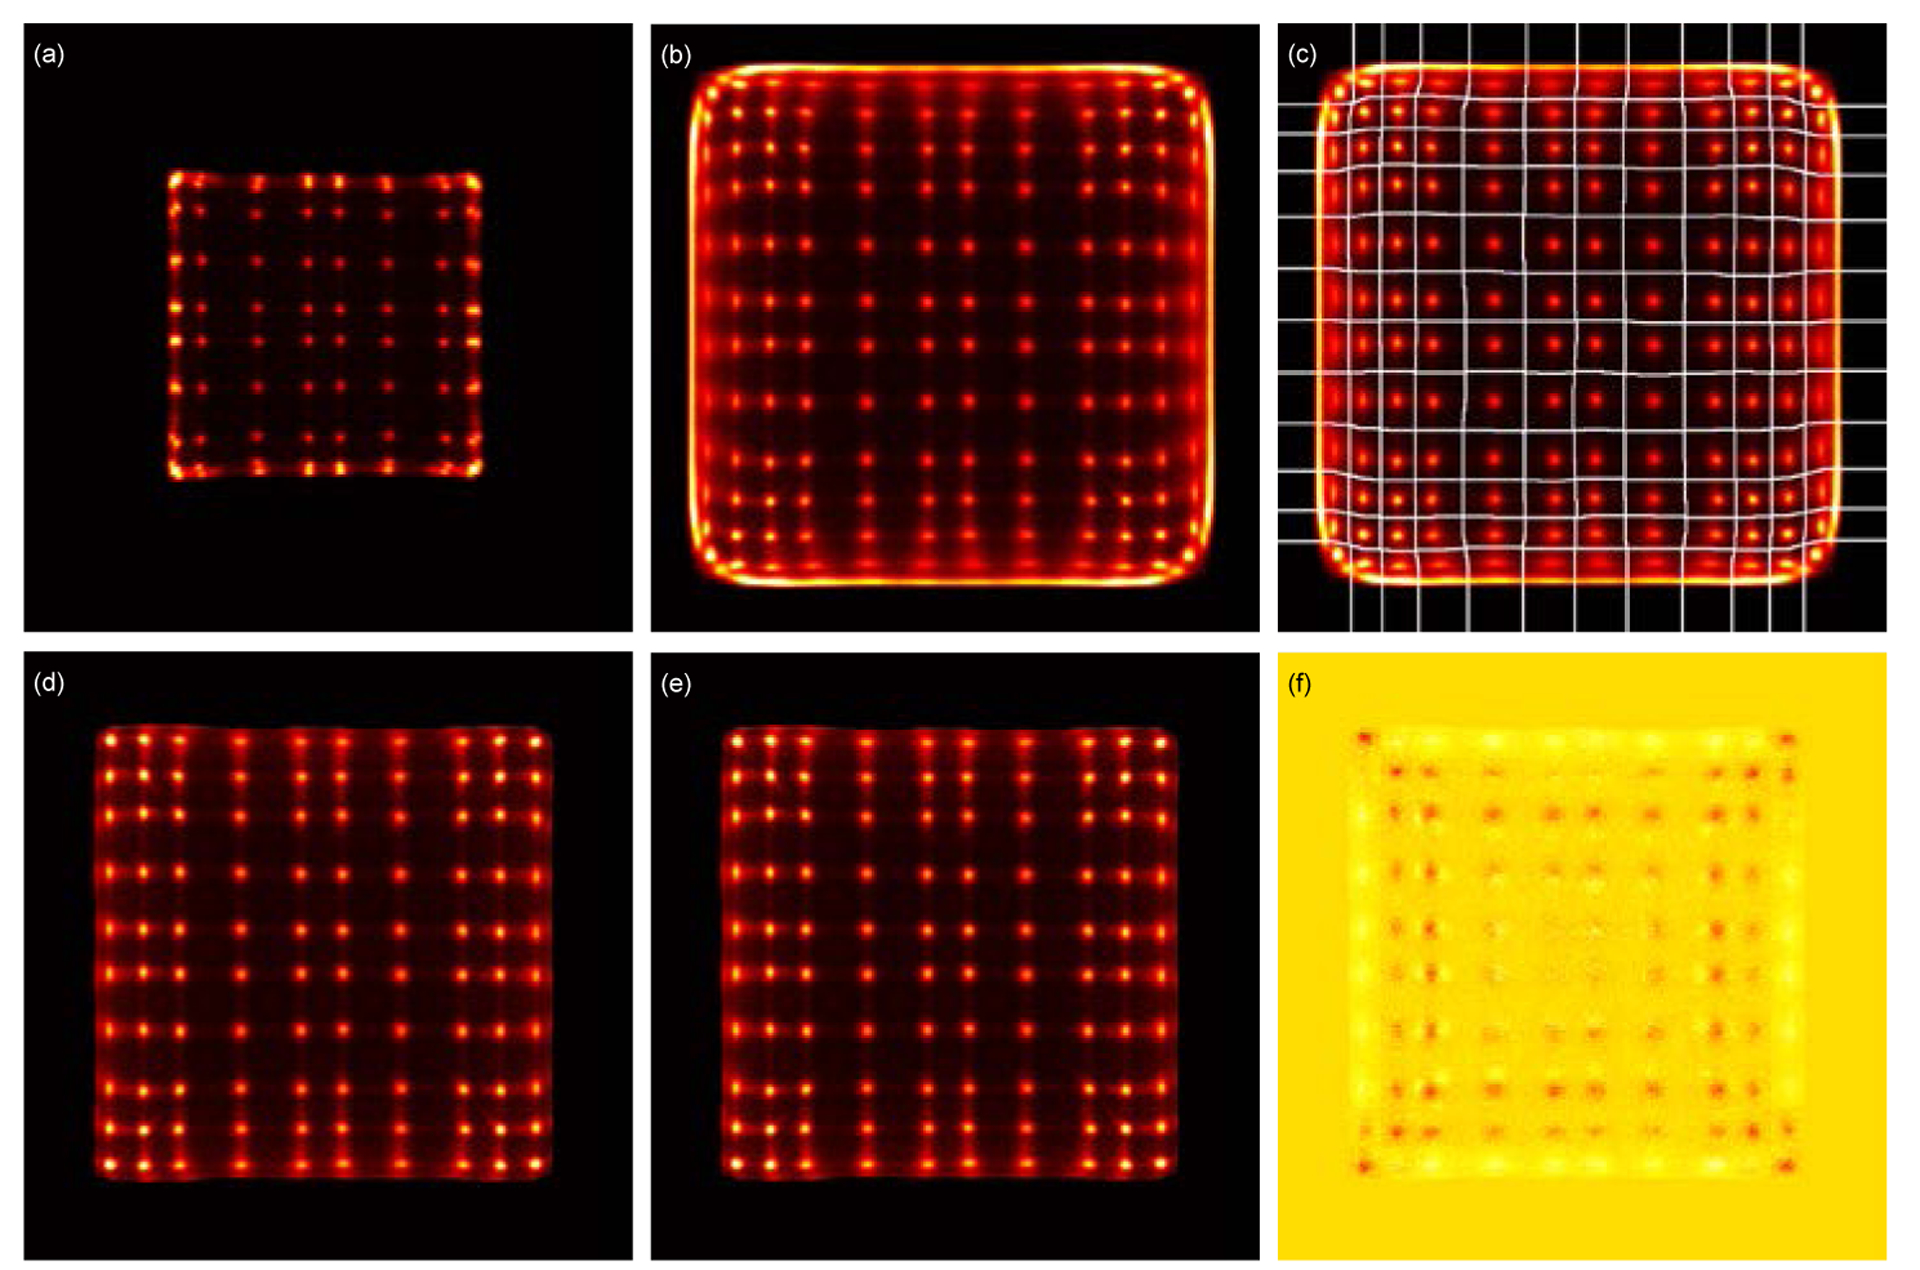
Flood histograms obtained using (a) the conventional readout method and (b) the shared-photodetectors readout method with a 200 keV energy threshold to select events. (c) flood histogram of (b) with the LUT overlaid. Flood histograms obtained using (d) the “crystal-EW” and (e) the “crystal-depth-EW” to select events and the shared-photodetectors readout method. (f) the difference of the two flood histograms obtained using the “crystal-EW” and the “crystal-depth-EW” to select events.
Figure 8 (b) shows the raw flood histogram obtained using the shared-photodetector readout method and a 200 keV lower threshold to select events. Due to the light sharing among detectors, more than 10 × 10 crystal elements and a surrounding frame are seen in the flood histogram. A crystal look-up-table (LUT) with 12 × 12 crystal elements was built using this flood histogram and the central 10 × 10 crystals were selected for further processing (figure 8 (c)).
Figure 8 (d) and figure 8 (e) show the flood histograms obtained using the “crystal-EW” and the “crystal-depth-EW” method to select events, respectively. The difference between these two flood histograms (figure 8 (d) and (e)) is shown in figure 8 (f), whilst the position profiles of the fifth crystal row and the fifth crystal column are shown in figure 9. The flood histograms obtained using the two event selection methods are comparable. A measure of the flood histogram quality calculated using the ratio of the distance to the width of the crystal spots gave values of 2.95 ± 0.56 and 2.96 ± 0.57 for the flood histograms shown in figure 8(d) and (e) respectively.
Figure 9.

Position profiles of (left) the fifth crystal row and (right) the fifth crystal column, obtained from the flood histograms shown in figures 8 (e) and (f).
The flood histograms versus irradiation depth are shown in figure 10. The flood histogram is depth-dependent due to the tapered shape of the LYSO elements and the different pitch of the SiPM arrays. The tapered crystal shape results in more scintillation photons being detected at the back end of the crystal, whilst the different pitch of the SiPM arrays results in different light-collection efficiency.
Figure 10.
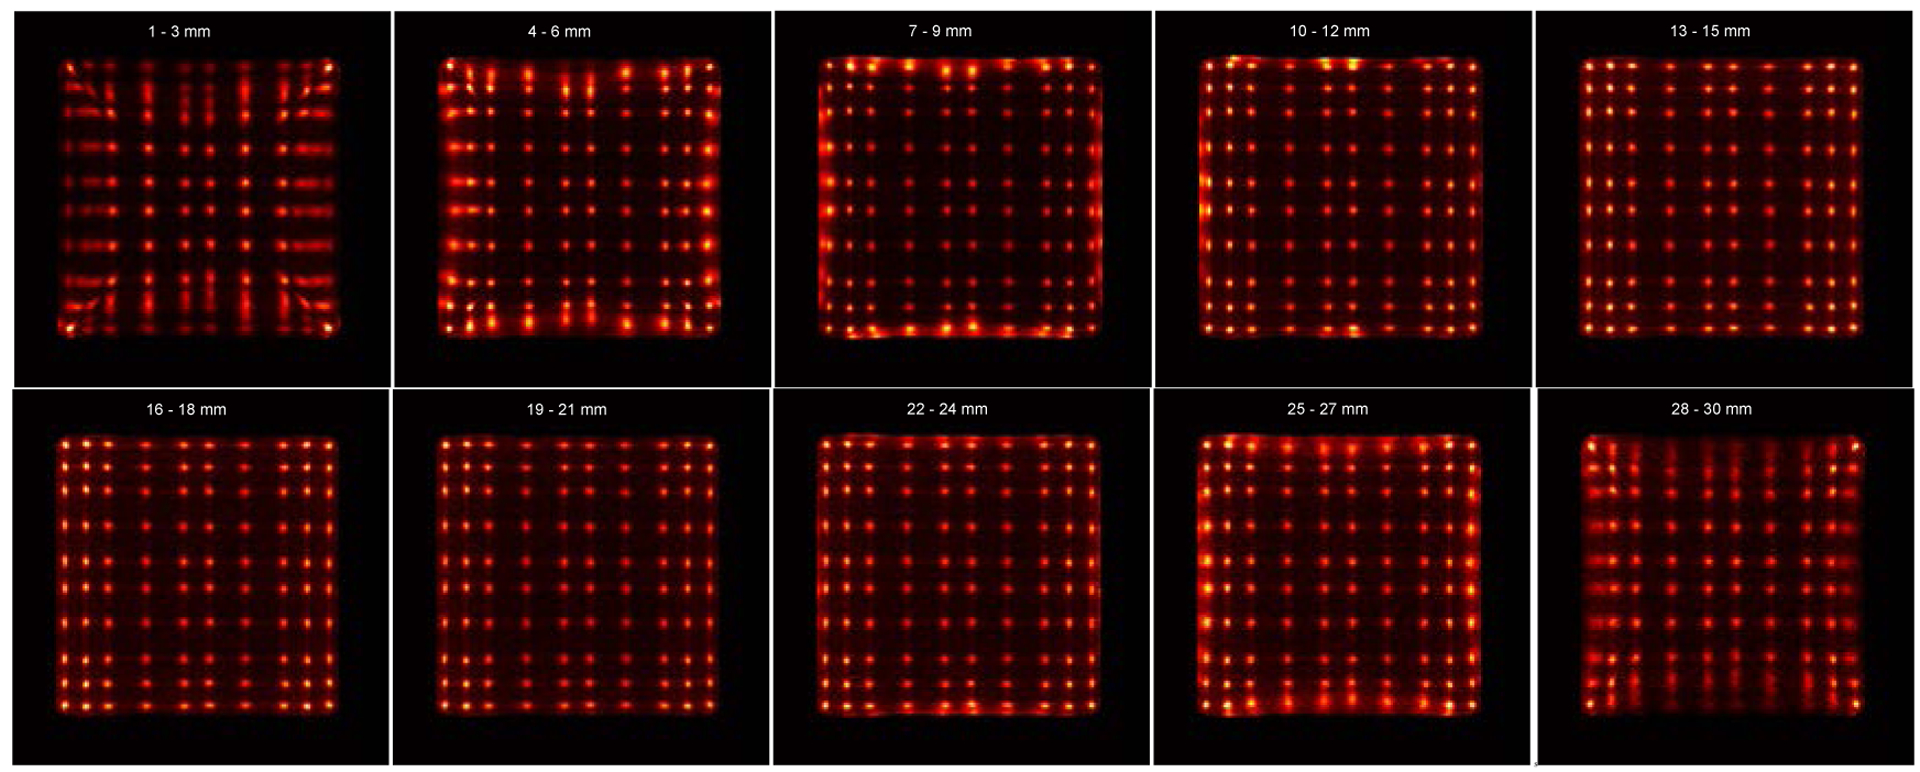
Flood histograms versus irradiation depth.
3.2. Energy resolution and 511 keV photopeak position
Figure 11 shows the energy spectra versus irradiation depth for one central crystal, whilst the average energy resolution and the average 511 keV photopeak position across all the 100 crystals versus depth are shown in figure 12. It is clear that the energy resolution and the 511 keV photopeak position varies with the interaction depth of the gamma photons, mainly caused by the specific construction of the LYSO array. The use of Toray as a diffuse reflector, which reduces the light collection efficiency but helps to improve the DOI resolution, contributed to the variation of the 511 keV photopeak position with depth and location (Ren et al 2014).
Figure 11.
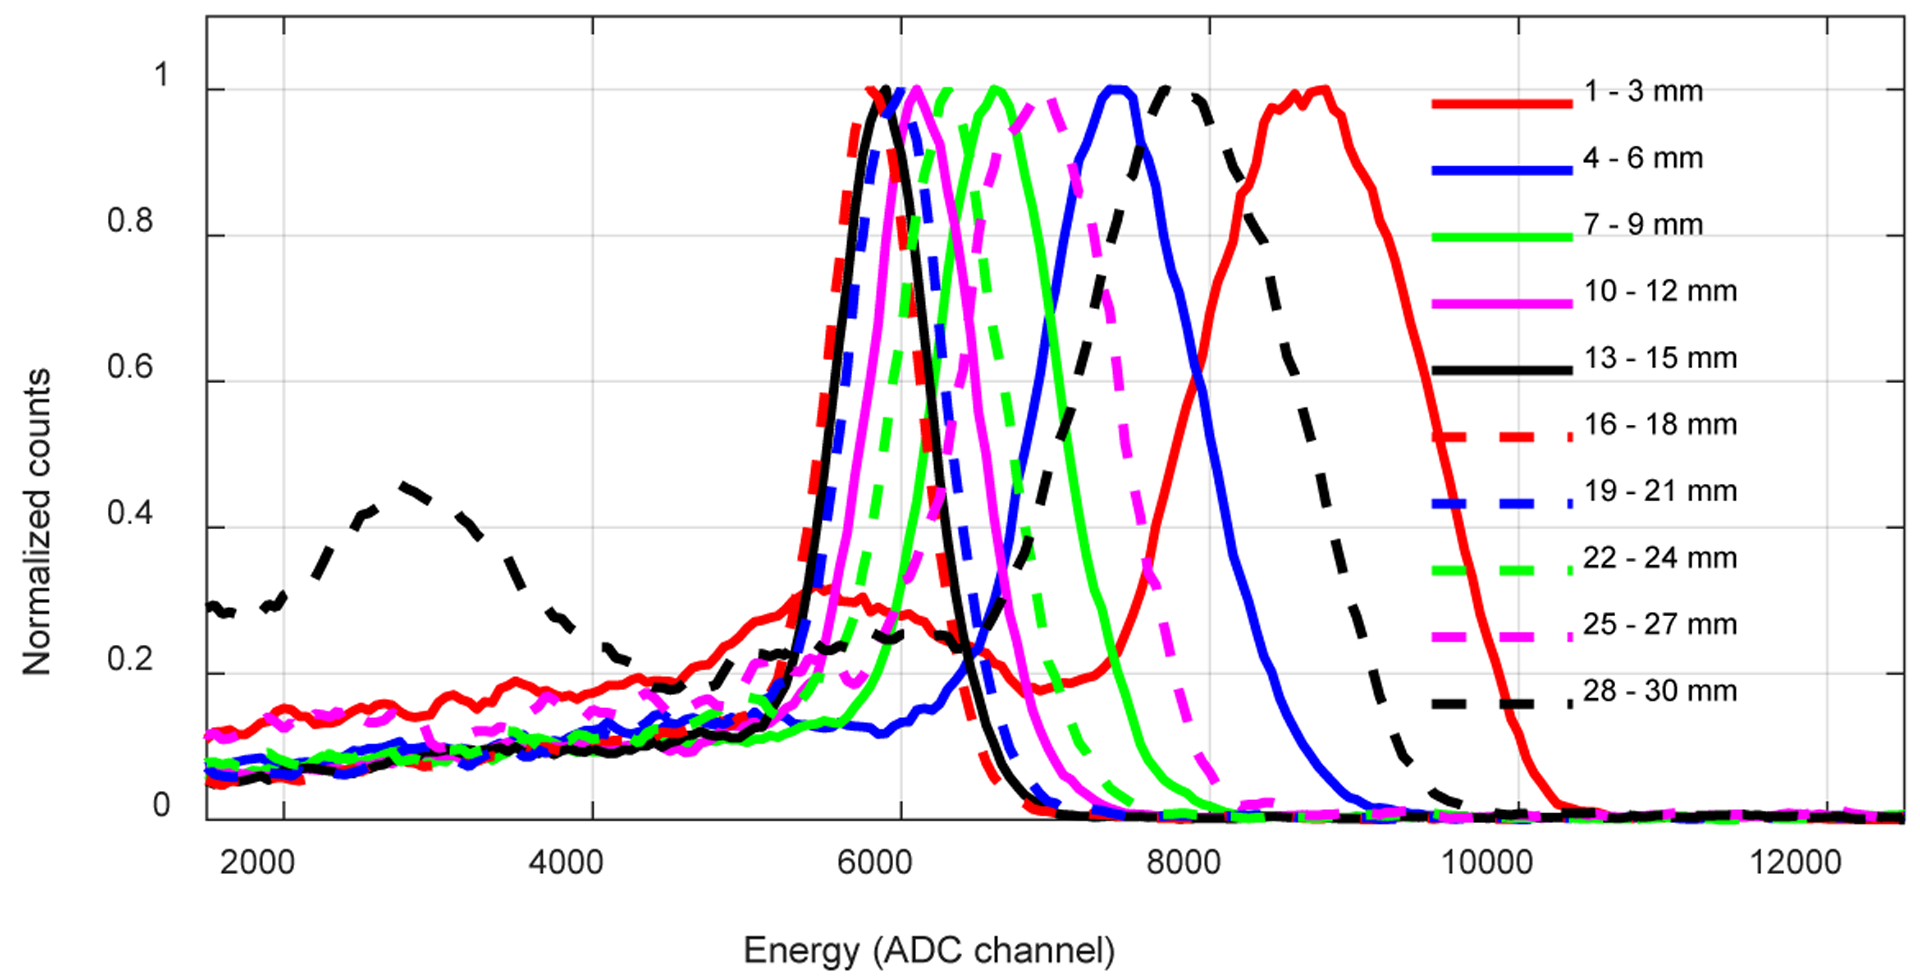
Energy spectra from a central crystal versus irradiation depth. All spectra are normalized to a peak value of 1.
Figure 12.
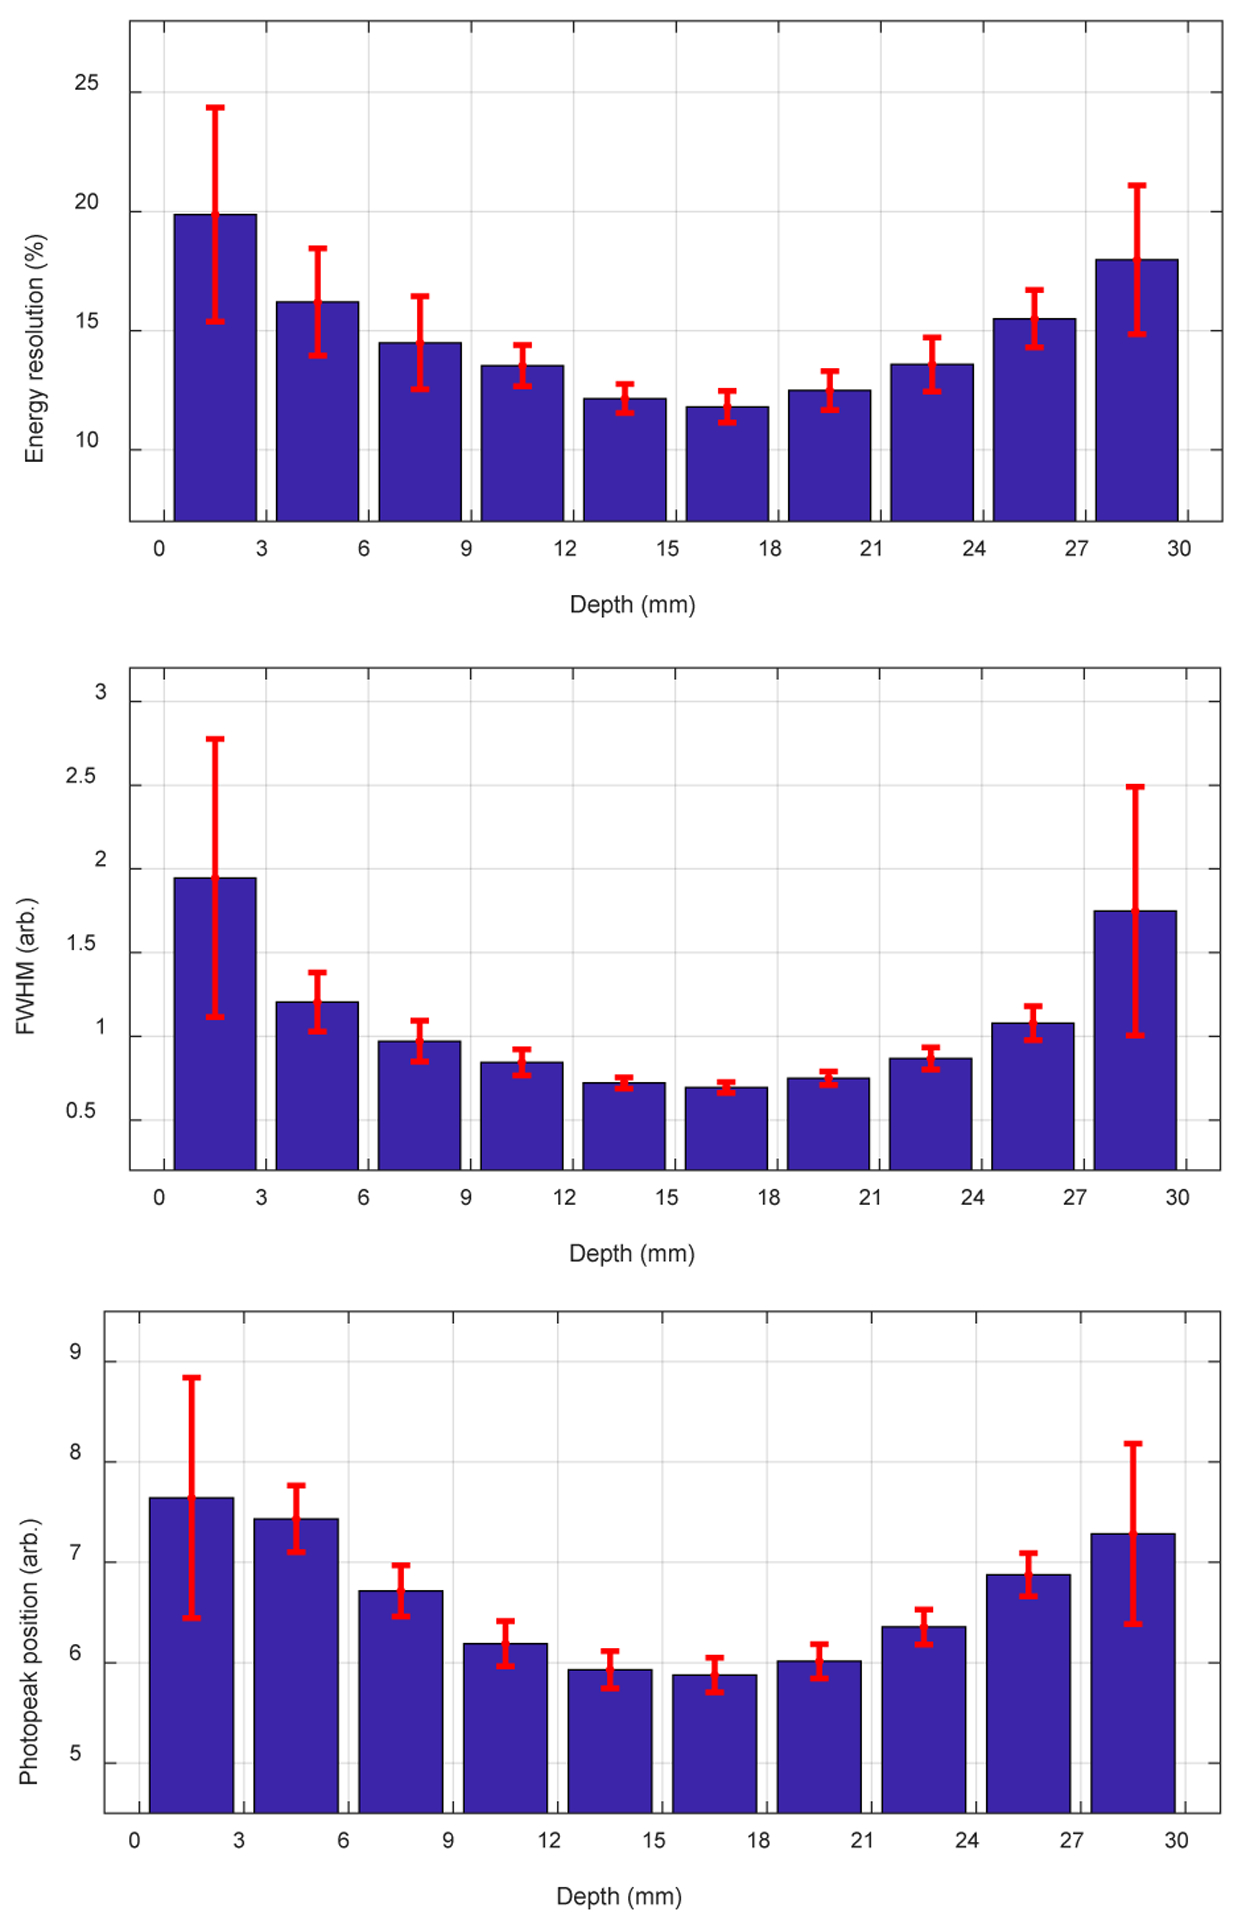
(top) energy resolution, (middle) FWHM and (bottom) 511 keV photopeak position versus
The somewhat counter-intuitive relationship between light collection and energy resolution as a function of irradiation depth in figure 12 is commonly seen in dual-ended detectors which use a fairly lossy reflector (Toray) to enhance DOI resolution as previously described (Yang et al, 2010). The average energy resolution across all the 100 crystals and all the 10 depths was 14.6 ± 3.6 %, which was not saturation corrected.
The energy resolution and 511 keV photopeak position for each crystal, obtained without using the DOI information, are shown in figure 13. The energy resolutions and the 511 keV photopeak position of the four corner crystals are worse than other crystals, mainly due to the incomplete light collection, which is caused by the readout method shown in figure 5 (left).
Figure 13.
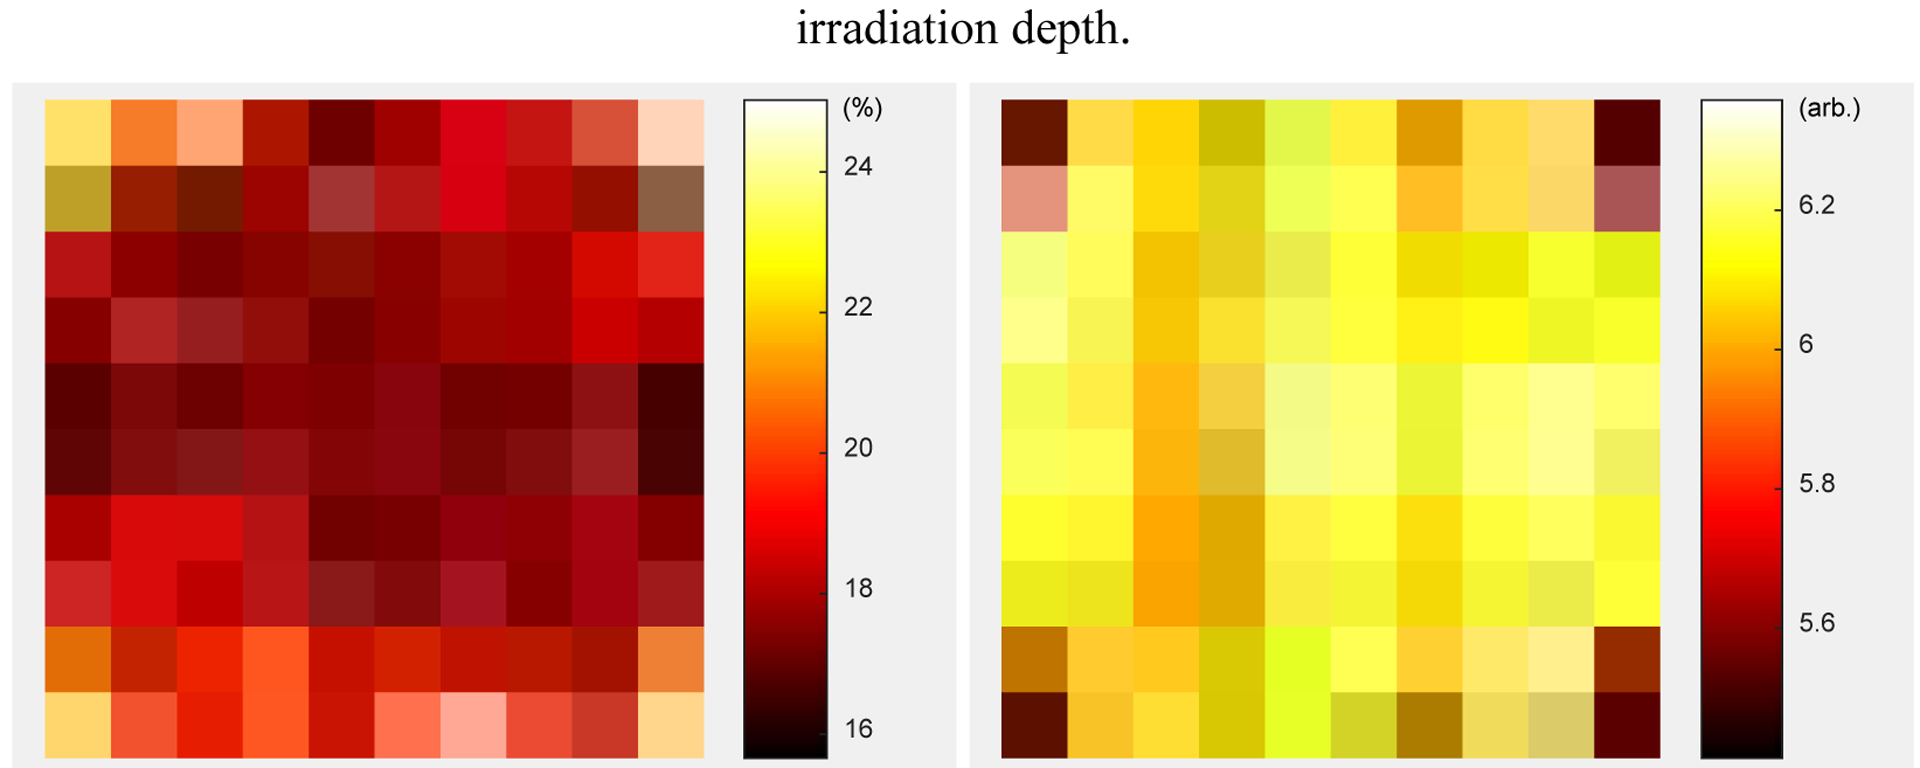
(left) energy resolution and (right) 511 keV photopeak position for each crystal.
3.3. Effect of energy window
Figure 14 (top) shows the number of events per layer (layer thickness is 3 mm) when a 350 – 750 keV energy window was used to select events. The number of events per layer obtained using the two event selection methods are similar, mainly because of the relatively wide energy window used to maximize the sensitivity of the detector module. As a comparison, the number of events per layer obtained using tighter a 450 – 650 keV energy window to select events is shown in figure 14 (middle).
Figure 14.
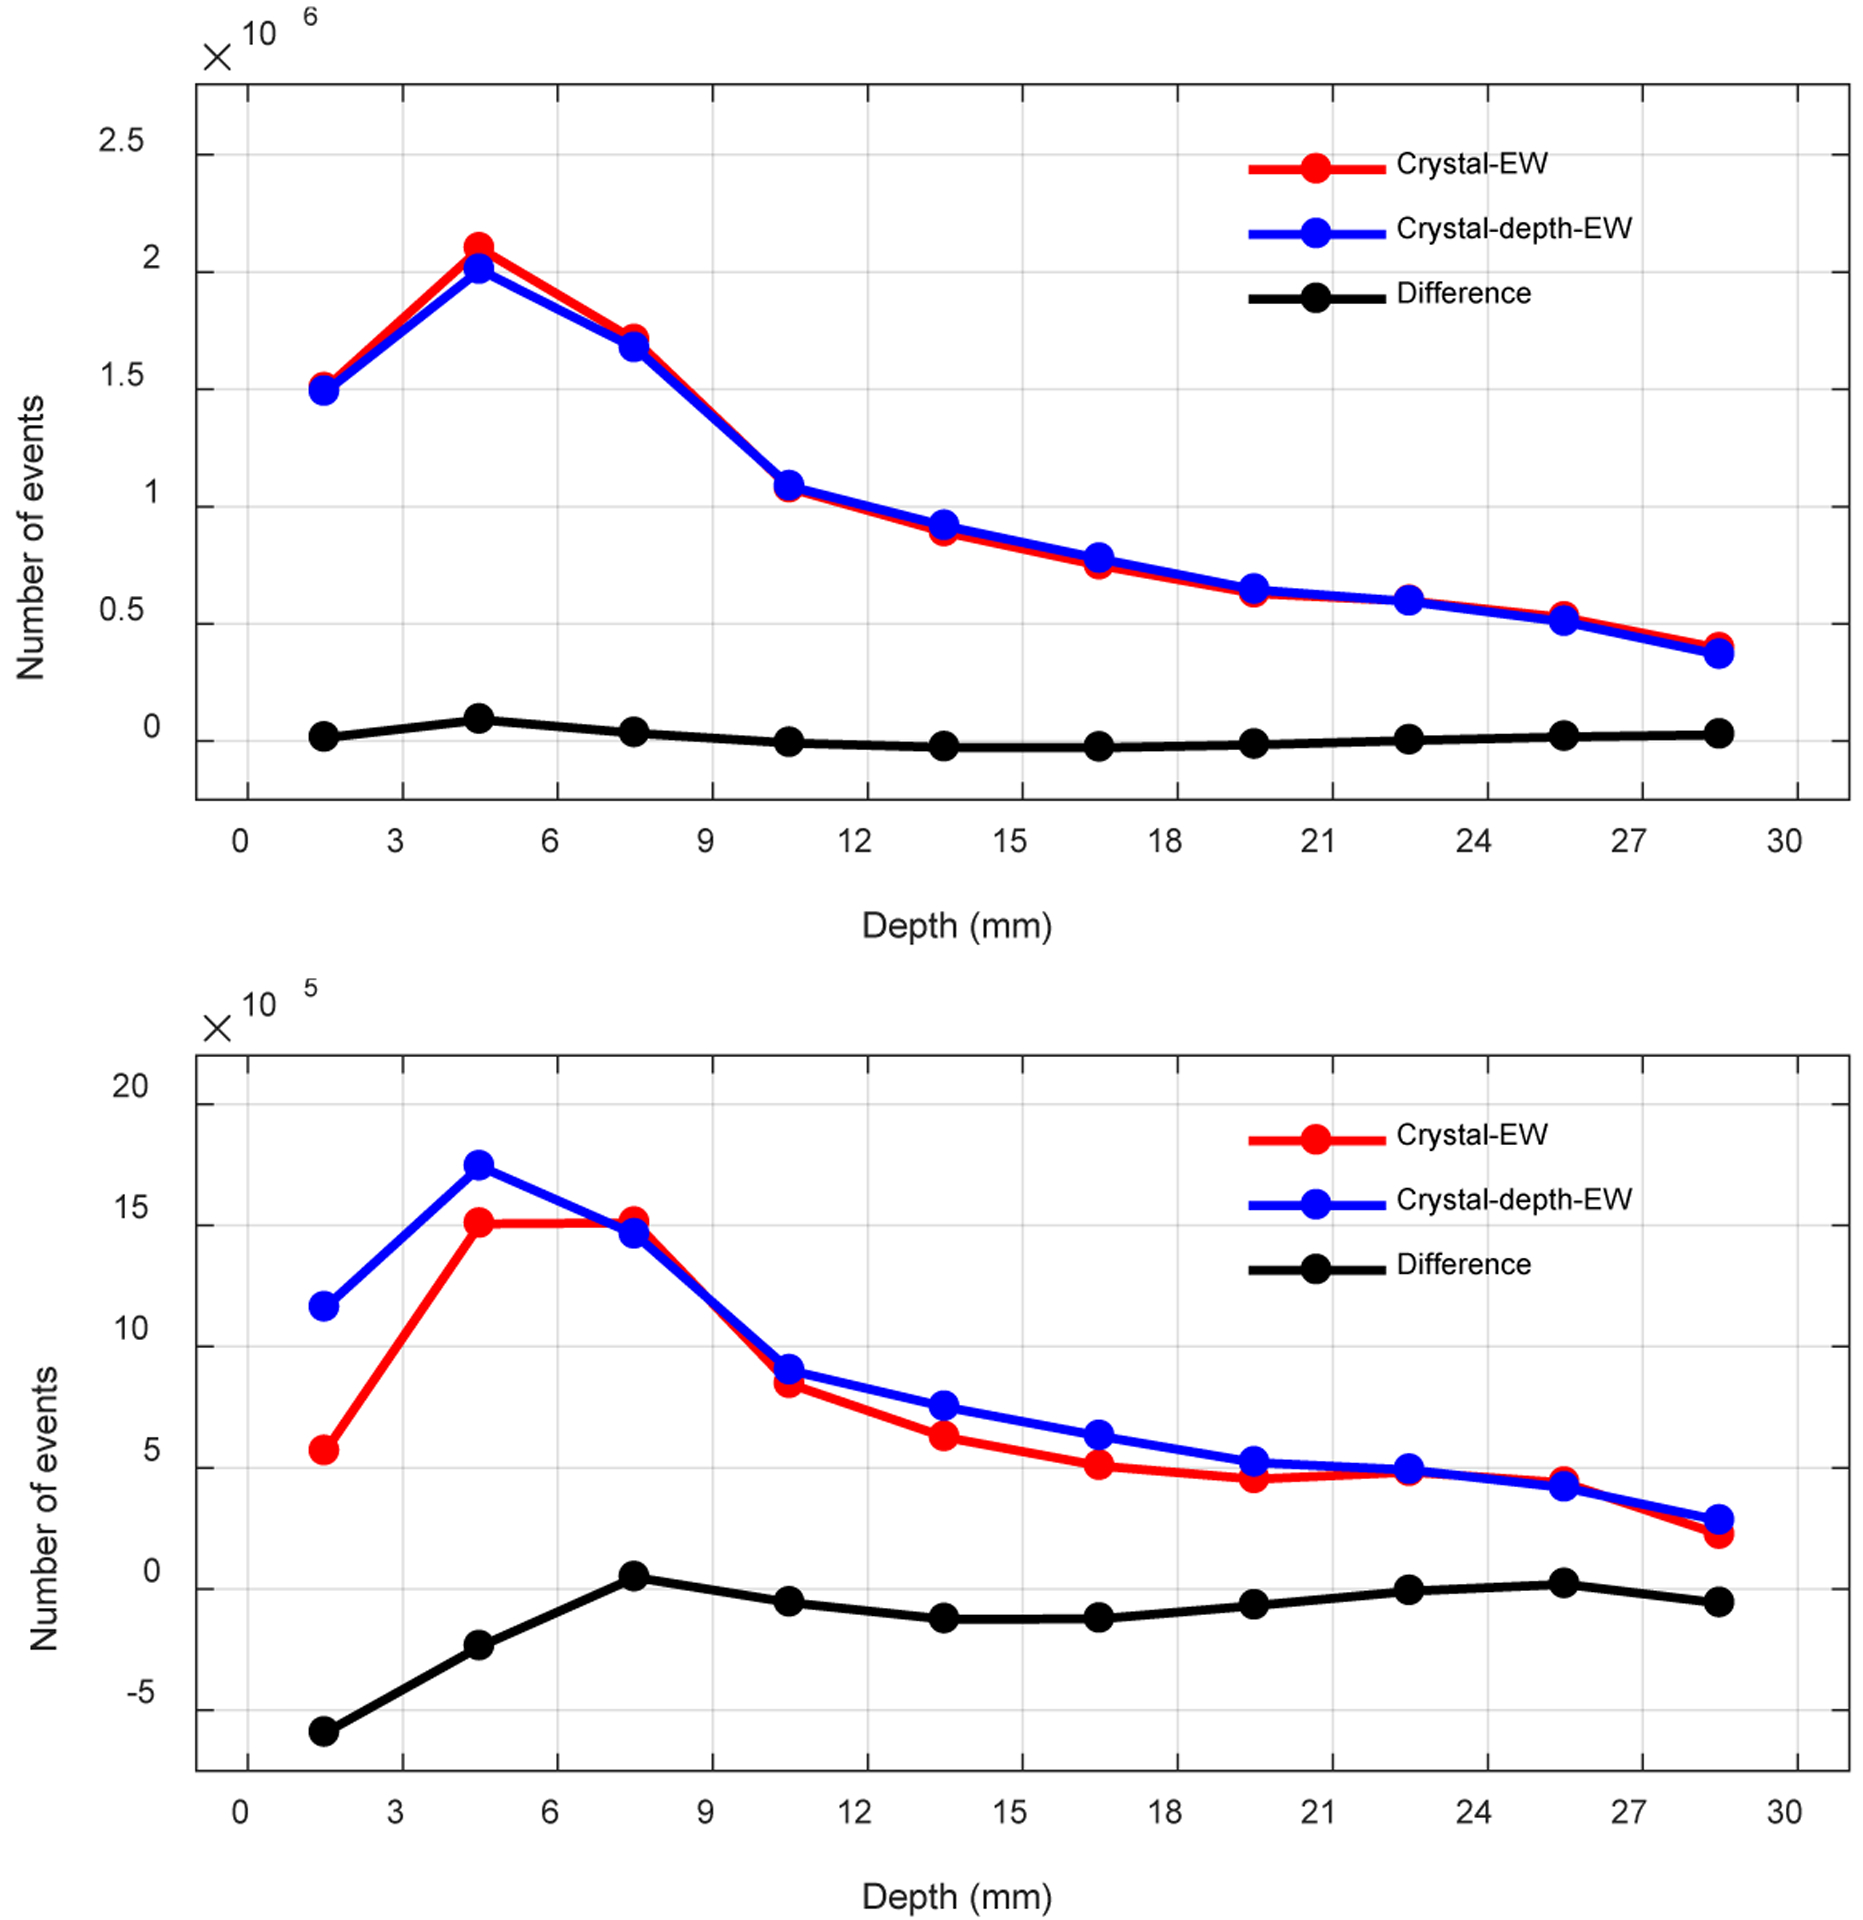
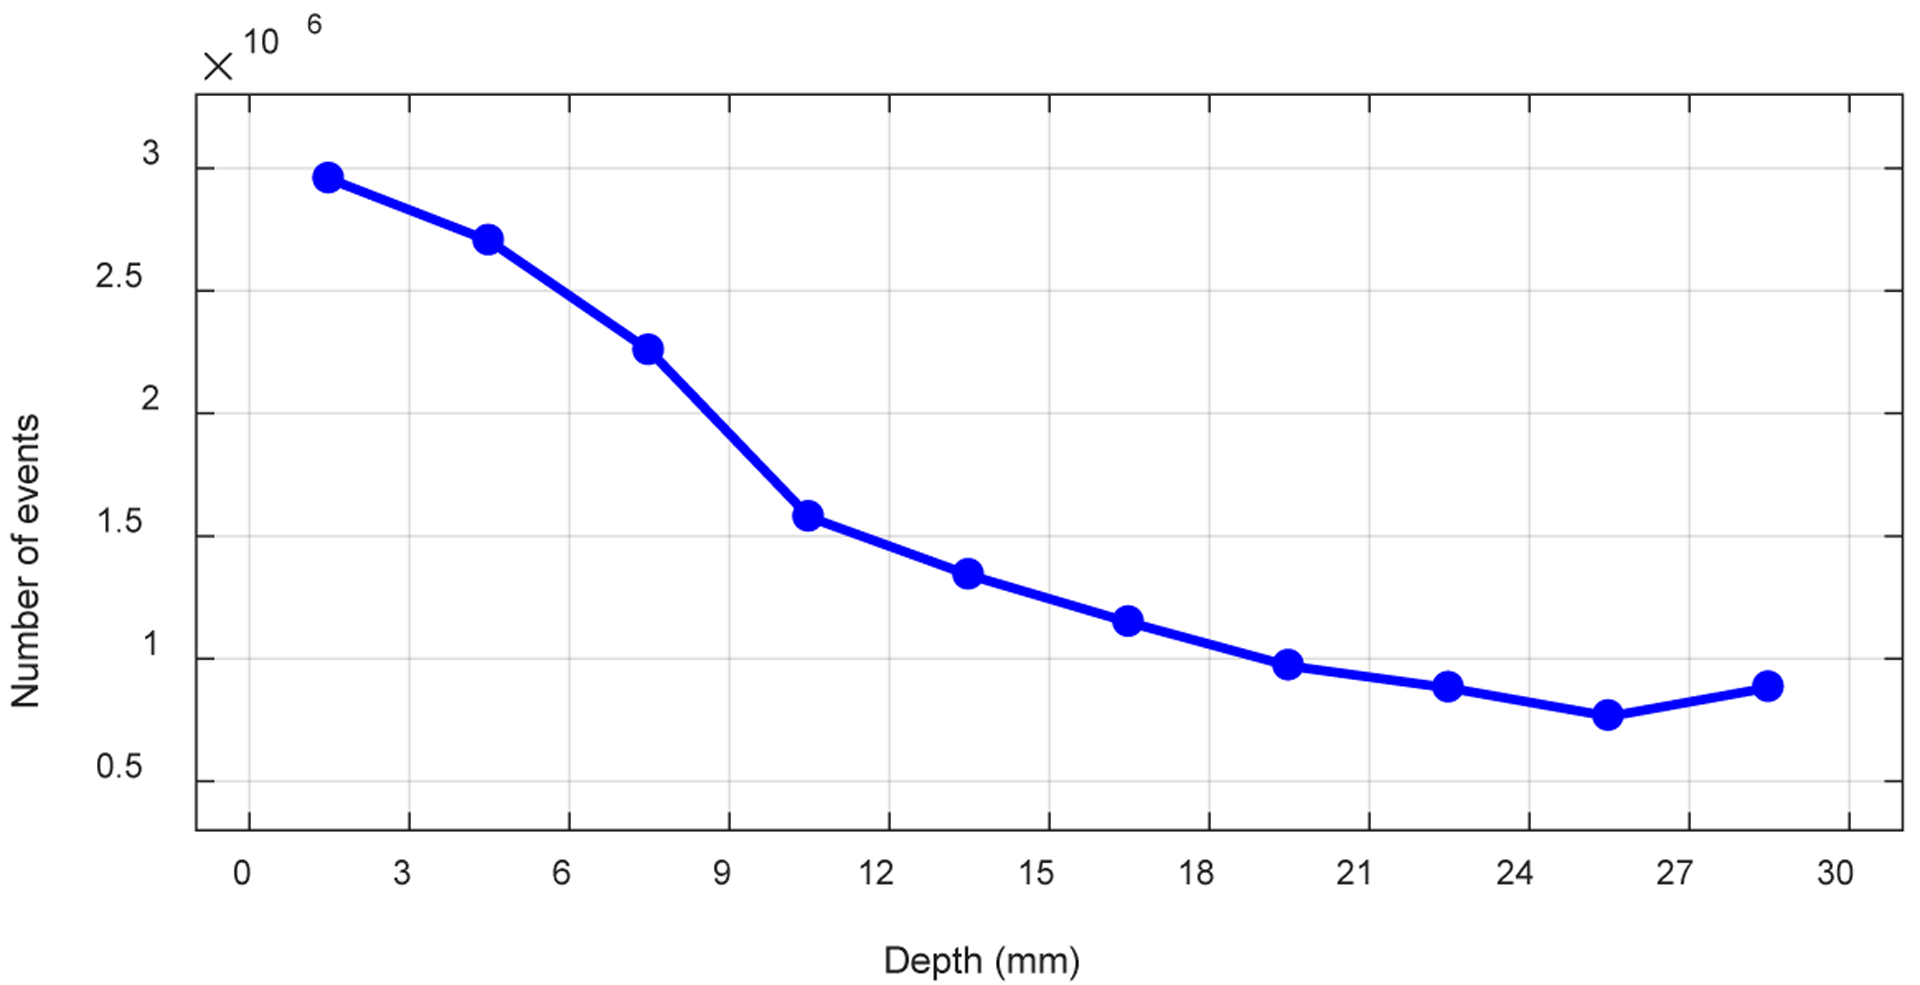
Number of events per layer using (top) a 350 – 750 keV energy window, (middle) a 450 – 650 keV energy window and (bottom) a 20 keV lower threshold to select events.
It is worth noting that the second layer (3–6 mm) detected more events than the first layer (0–3 mm) when an energy window (350 – 750 keV or 450 – 650 keV) was used to select events. This is caused by a combination of the escape of backscattered photons from the crystal (leaving the event outside the energy window) and the worse energy resolution in the first layer. When using a 20 keV lower threshold to select events, this effect disappears, but now the 10th layer (27–30 mm) has more events than the 9th layer (24–27 mm) due to the predominance of forward scatter which results in positioning deeper into the crystal than the first interaction point.
3.4. DOI resolution
The DOI profiles of one central crystal from detector 8 are shown in figure 15. The average DOI resolution across the 14 depths measured for each crystal are show in figure 16, whilst figure 16 (left) and figure 16 (middle) show the DOI resolution obtained using the “crystal-EW” and the “crystal-depth-EW” method to select events, respectively. The difference of the DOI resolution of each crystal obtained using the two event selection methods is very small, as shown in figure 15 (right). The average DOI resolution across all crystals and all depths obtained using the two event selection methods are both 2.77 ± 0.39 mm (Table I).
Figure 15.
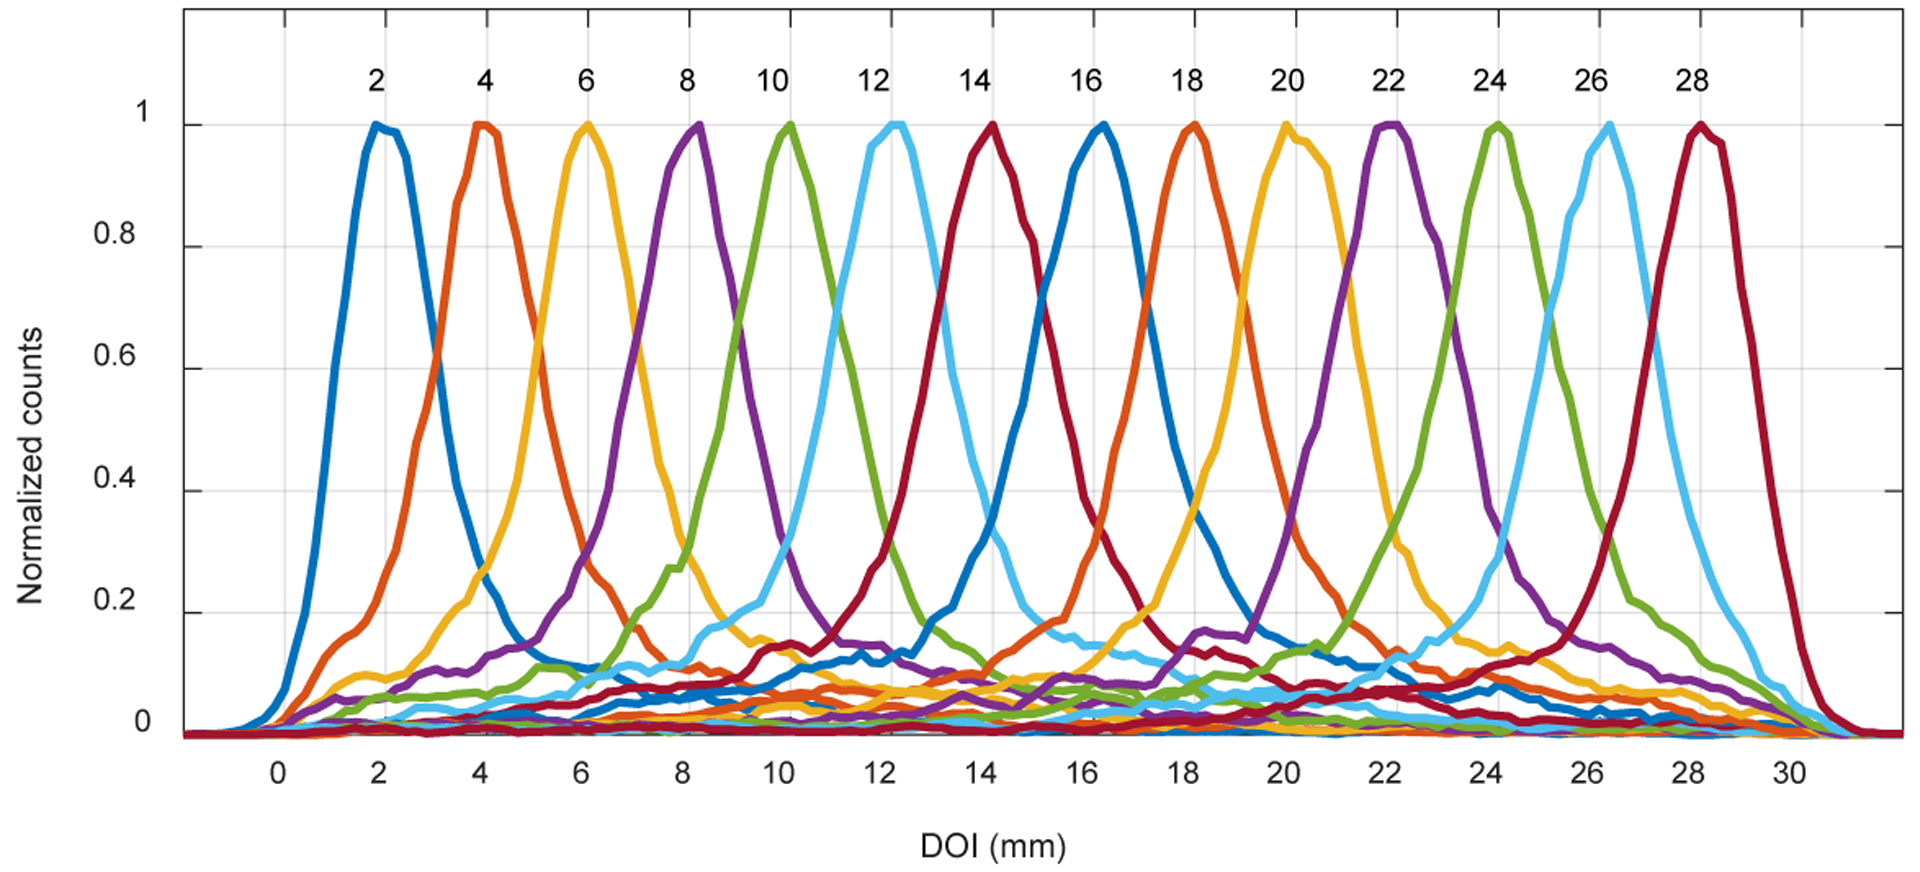
The DOI profile of one central crystal.
Figure 16.

Average DOI resolution across the 14 depths for each crystal obtained using (left) the “crystal-EW” and (middle) the “crystal-depth-EW” to select events. (right) the difference of the DOI resolution obtained using the two event selection methods.
Table I.
The crystal-level and the detector-level DOI resolution.
| Event selection method | DOI resolution / mm | |
|---|---|---|
| Crystal-level | Detector-level | |
| Crystal-EW | 2.77 ± 0.39 | 3.47 ± 0.21 |
| Crystal-depth-EW | 2.77 ± 0.39 | 3.48 ± 0.18 |
Figure 17 shows the average DOI resolution across the 64 crystals versus depth obtained using the “crystal-depth-EW” to select events. Better DOI resolution were obtained at the two ends of the LYSO arrays, which is consistent with the results from other dual-ended readout detectors (Yang et al 2006). Better DOI resolution was also obtained close to the front-end of the LYSO array, due to the better light collection (the front-end SiPM arrays have less dead space than those of the rear-end SiPM arrays as shown in figure 3).
Figure 17.
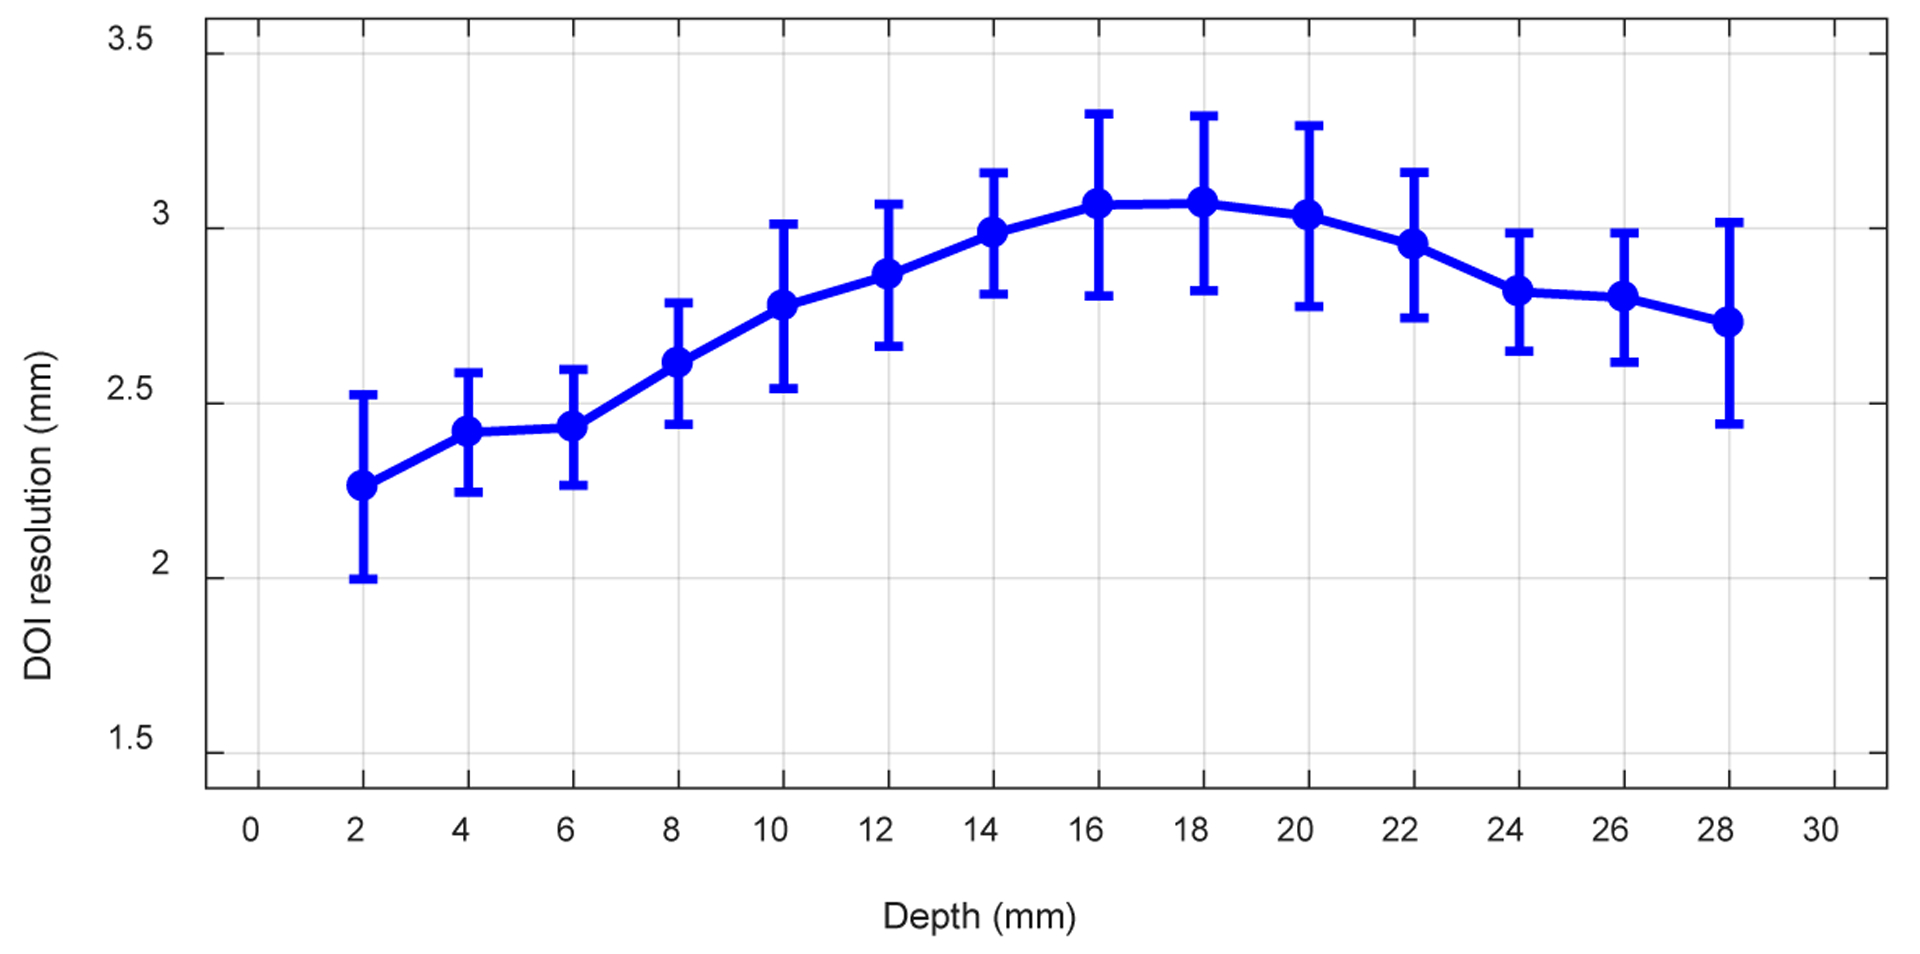
The average DOI resolution versus depth.
The detector-level DOI resolution obtained using the two event selection methods are also similar (~ 3.5 mm) as shown in the Table I. However, there is a clear advantage to calculating the DOI on a crystal-by-crystal basis.
3.4. Timing resolution
The timing resolution for each crystal is shown in figure 18 (left), whilst the peak position of the timing spectra for each crystal is shown in figure 18 (right). The average crystal-level timing resolution across all 100 crystals is 1.15 ± 0.07 ns, and the detector-level timing resolution is 1.16 ± 0.01 ns. Since the timing shift of the spectra across the detector are small (~0.33 ns as shown in figure 18 (right)), the crystal-level and the detector-level timing resolution are comparable, which means a detector-level timing window can be used at a system level to simplify the readout electronics and data processing.
Figure 18.
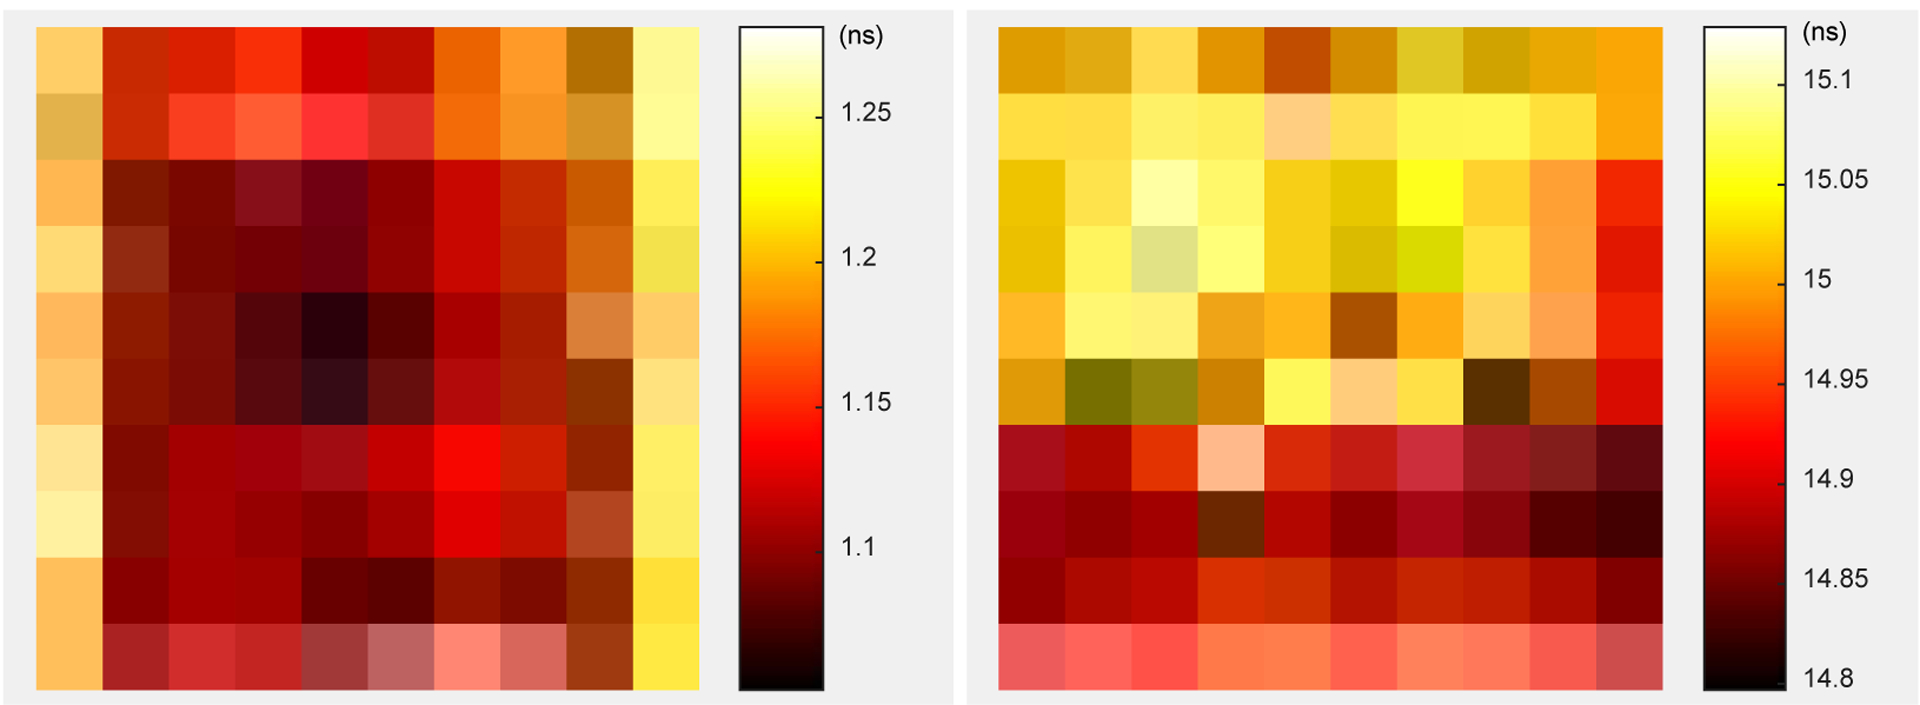
(left) the timing resolution and (right) the peak position of the timing spectra for each crystal.
4. Summary and Discussion
In this paper, an approach to designing a dedicated brain PET scanner that simultaneously has high-resolution and high-sensitivity based on curved-shaped LYSO arrays and a dual-ended readout method was proposed and evaluated. PET detectors with 100% packing fraction and PET scanners without gaps/dead space between detector modules can in principle be built based on the proposed detector design method (the only dead space is that due to inter-crystal reflectors). The one drawback of using curved scintillator arrays is that they can only be used for a given scanner radius. The estimated sensitivity of the proposal PET scanner (figure 1) could be as high as ~16% at the center of the field-of-view, which is ~2× higher than the sensitivity of scanners based on conventional detectors. A new readout method was also proposed to solve the edge effect in PET detector modules and to simplify the readout electronics by combining the shared-photodetector readout method (Du et al 2018c) and reading out the anodes and cathodes of the SiPMs simultaneously.
PET scanners based on monolithic detector designs also can provide very high sensitivity, however, a difficult trade-off between sensitivity and resolution always exists. To obtain high resolution, thin crystals are required (sensitivity is low); to obtain high sensitivity, thicker crystals are required (resolution is low). To obtain the same sensitivity achieved with our detectors, monolithic LYSO scintillator with a thickness of ~ 18.5 mm would be needed. At this thickness it is very difficult to obtain ~ 1 mm resolution across the entire detector volume. For example, the resolution obtained from a 20 mm thick LSO monolithic detector with one-sided readout is ~1.6 mm (Borghi et al 2016) and it varies across the detector. In addition, monolithic detectors require extremely careful calibration and complex positioning algorithms to obtain these levels of spatial resolution.
Our results demonstrated that all the LYSO elements in the central detector module can be clearly identified using the proposed readout method, whilst the outmost rows and columns cannot be resolved using the conventional readout method (figure 8). The energy resolution ranged from 11.8% to 19.8 %, whilst the average energy resolution across all depths and all crystals was 14.6 ± 3.6 % (figure 12(top)). The DOI resolution ranged from 2.26 mm to 3.07 mm (figure 17), whilst the average crystal-level DOI resolution and the detector-level DOI resolution were 2.77 ± 0.39 mm and 3.48 ± 0.18 mm, respectively. Better energy resolution was obtained at the middle of the LYSO array, however, better DOI resolution was obtained at the two ends of the LYSO array. The energy resolution and the DOI resolution all varied with the interaction depth (figures 11, 12 and 17), due to the use of Toray film (diffuse reflector) as the inter-crystal reflector, which reduced the light collection efficiency but helped to improve the DOI resolution (Ren et al 2014).
The energy spectra and energy resolution shown in the paper are not corrected for possible SiPM saturation, as it is extremely challenging to calibrate in this particular situation. Unlike single-ended readout detectors with little or no DOI information, these detectors exhibit strongly depth-dependent signal amplitudes, and each crystal also is coupled to a variable number of SiPMs depending on the light spread and the crystal location relative to the SiPM arrays. Thus, the saturation calibration would need to be done for each crystal, for each interaction depth, and for each of the two SiPM arrays separately. This is an enormously time-consuming undertaking (several thousand calibrations), but is rendered almost impossible for crystals in the middle of the array because of the strong attenuation and scatter of side-collimated gamma rays before they can reach them (which is why the DOI also can only be measured in a small subset of the crystals). We have good reason to believe saturation is not a significant effect in these measurements, because the light from each crystal is spread across at least two and often as many as nine SiPMs, and the very small crystals with lossy reflector leads to low light collection efficiency.
The average crystal-level timing resolution and the detector level-timing resolution were 1.15 ± 0.07 ns and 1.16 ± 0.01 ns, respectively, which means a simple detector-level timing window can be used at a system level and the coincidence logic of the PET scanner could be simplified. The timing resolution is not good enough for time-of-flight brain PET applications but the main focus of the proposed detector design is to improve the sensitivity and the spatial resolution of a brain PET scanner. The timing resolution could likely be significantly improved if the timing information is extracted from individual SiPMs, for example using an ASIC designed for SiPM arrays (Francesco et al 2016).
The energy resolution, DOI resolution and timing resolution obtained in our work are all better than previous work obtained using dual-ended readout and crystals with a length of 30 mm (Shao et al 2014). Improvements are likely due to several reasons, such as the use of newer SiPM technology and improved LYSO array fabrication methods. We spent considerably effort with the vendor to optimize the methods to fabricate the curved-shape LYSO array and found that the LYSO fabrication method played a very important role in obtaining good energy resolution, DOI resolution and timing resolution.
Although the 511 keV photopeak position varied with the interaction depth, which indicated that the “crystal-depth-EW” method should be used to select events, the flood histogram, DOI resolution and the number of events per layer obtained using the “crystal-EW” and the “crystal-depth-EW” with a 350 −750 keV energy window were similar.
Overall, these experiments lay the foundation for designing a dedicated brain PET scanner which combines excellent spatial resolution with a sensitivity that is limited only by the deadspace caused by inter-crystal reflectors, and not gaps between detector modules, or limited detection efficiency from using shorter crystals. The new readout method also largely eliminates issues with resolving edge crystals within a module when the crystal size is smaller than the SiPM size. We now will perform detailed simulations of the proposed system to optimize the design and predict performance at the system level.
5. Conclusion
A proof-of-concept detector block with 9 detector sub-modules based on curved-shape LYSO array and dual-ended readout was evaluated for simultaneous high-resolution and high-sensitivity brain PET applications. The detector modules have a 100% packing fraction and all the crystals of the detectors could be clearly resolved using the shared-photodetector readout method. PET scanners without gaps between detector modules could be built based on the proposed design to improve the sensitivity of the PET scanners. Although the proposed detector design method was evaluated using a dual-ended readout detector block, it is can be also used for single-ended readout detectors.
Acknowledgements
This work was funded by an Academic Federation Innovative Developmental Award from the University of California at Davis, and NIH grant R01 EB019439.
References
- Borghi G, Peet B, Tabacchini V and Schaart D 2016. A 32mm × 32mm × 22mm monolithic LYSO:Ce detector with dual-sided digital photon counter readout for ultrahigh-performance TOF-PET and TOF-PET/MRI Phys. Med. Biol 61:4929–4949. [DOI] [PubMed] [Google Scholar]
- Borghi G, Tabacchini V, Bakker R and Schaart D 2018. Sub-3 mm, near-200 ps TOF/DOI-PET imaging with monolithic scintillator detectors in a 70 cm diameter tomographic setup Phys. Med. Biol 63:155006. [DOI] [PubMed] [Google Scholar]
- Dam H, Seifert S, Vinke R, Dendooven P, Löhner H, Beekman F and Schaart D 2011. Improved nearest neighbor methods for gamma photon interaction position determination in monolithic scintillator PET detectors IEEE Trans. Nucl. Sci 58:2139–2147 [Google Scholar]
- Du J, Bai X and Cherry SR 2018a. A depth-of-interaction encoding PET detector module with dual-ended readout using large-area silicon photomultiplier arrays Phys. Med. Biol 63:245019. [DOI] [PMC free article] [PubMed] [Google Scholar]
- Du J, Bai X, Gola A, Acerbi F, Ferri A, Piemonte C, Yang Y and Cherry SR 2018b. Performance of a high-resolution depth-encoding PET detector module using linearly-graded SiPM arrays Phys. Med. Biol 63:035035. [DOI] [PMC free article] [PubMed] [Google Scholar]
- Du J, Peng P, Bai X and Cherry SR 2018c. Shared-Photodetector Readout to Improve the Sensitivity of PET Phys. Med. Biol 63:205002. [DOI] [PMC free article] [PubMed] [Google Scholar]
- Du J, Yang Y, Bai X, Judenhofer M, Berg E, Di K, Buckley S, Carl J and Cherry SR 2016. Characterization of large-area SiPM array for PET applications IEEE Trans. Nucl. Sci 63:8–16 [DOI] [PMC free article] [PubMed] [Google Scholar]
- Francesco A, Bugalho R, Oliveira L, Pacher L, Rivetti A, Rolo M, Silva J, Silva R and Varela J 2015. TOFPET2: a high-performance ASIC for time and amplitude measurements of SiPM signals in time-of-flight applications J. Inst 11:C03042 [Google Scholar]
- Gonzalez A, Berr S, Cañizares G, Gonzalez-Montoro A, Orero A, Correcher C, Rezaei A, Nuyts J, Sanchez F, Majewski S and Benlloch J 2018. Feasibility Study of a Small Animal PET insert based on a single LYSO monolithic tube Front. Med 5:328. [DOI] [PMC free article] [PubMed] [Google Scholar]
- James S, Yang Y, Bowen SL, Qi J and Cherry SR 2009a. Simulation study of spatial resolution and sensitivity for the tapered depth of interaction PET detectors for small animal imaging Phys. Med. Biol 55:N63. [DOI] [PMC free article] [PubMed] [Google Scholar]
- James S, Yang Y, Wu Y, Farrell R, Dokhale P, Shah K and Cherry SR 2009b. Experimental characterization and system simulations of depth of interaction PET detectors using 0.5 mm and 0.7 mm LSO arrays Phys. Med. Biol 54:4605–19 [DOI] [PMC free article] [PubMed] [Google Scholar]
- Jones T and Rabiner E 2012. The development, past achievements, and future directions of brain PET Journal of Cerebral Blood Flow & Metabolism 32:1426–1454 [DOI] [PMC free article] [PubMed] [Google Scholar]
- Joung J, Miyaoka R and Lewellen T 2002. CMICE: a high resolution animal PET using continuous LSO with a statistics based positioning scheme Nucl. Instrum. Methods Phys. Res. A 489:584–98 [Google Scholar]
- Kandel E, Schwartz J and Jessell T 2000. Principles of neural science (fourth edition) McGraw-Hill. [Google Scholar]
- Mao R, Zhang L and Zhu R 2008. Emission Spectra of LSO and LYSO Crystals Excited by UV Light, X-Ray and -ray IEEE Trans. Nucl. Sci 55:1759–1766 [Google Scholar]
- Moses WW and Derenzo SE 1994. Design studies for a PET detector module using a PIN photodiode to measure depth of interaction IEEE Trans. Nucl. Sci 41:1441–1445. [Google Scholar]
- Ren S, Yang Y and Cherry SR 2014. Effects of reflector and crystal surface on the performance of a depth-encoding PET detector with dual-ended readout Med. Phys 41:072503. [DOI] [PMC free article] [PubMed] [Google Scholar]
- Shao Y, Sun X, Lan K, Bircher C, Lou K and Deng Z 2014. Development of a prototype PET scanner with depth-of-interaction measurement using solid-state photomultiplier arrays and parallel readout electronics Phys. Med. Biol 59:1223–1238. [DOI] [PMC free article] [PubMed] [Google Scholar]
- Wang Y, Du J, Zhou Z, Yang Y, Zhang L and Peter B 2011. FPGA based electronics for PET detector modules with neural network position estimators IEEE Trans. Nucl. Sci 58:34–42 [Google Scholar]
- Yamamoto S, Watabe H, Watabe T, Ikeda H, Kanai Y, Ogata Y, Kato K and Hatazawa J 2016. Development of ultrahigh resolution Si-PMbased PET system using 0.32 mm pixel scintillators Nucl. Instrum. Methods. Phys. Res. A 836:7–12 [Google Scholar]
- Yang Y et al. 2016. A prototype high-resolution small-animal PET scanner dedicated to mouse brain imaging J. Nucl. Med 57:1130–5 [DOI] [PMC free article] [PubMed] [Google Scholar]
- Yang Y, Dokhale P, Silverman R, Shah K, McClish M, Farrell R, Entine G and Cherry SR 2006. Depth of interaction resolution measurements for a high resolution PET detector using position sensitive avalanche photodiodes Phys. Med. Biol 51: 2131–2142. [DOI] [PubMed] [Google Scholar]
- Yang Y, Qi J, Wu Y, St James S, Farrell R, Dokhale P, Shah K and Cherry SR 2009. Depth of interaction calibration for PET detectors with dual-ended readout by PSAPDs Phys. Med. Biol 54:433–445. [DOI] [PMC free article] [PubMed] [Google Scholar]
- Yang Y, St. James S, Wu Y, Du H, Qi J, Farrell R, Dokhale P, Shah K, Vaigneur K and Cherry SR 2010. Tapered LSO arrays for small animal PET Phys. Med. Biol 56:139–153. [DOI] [PMC free article] [PubMed] [Google Scholar]


