Abstract
In this report, we investigated the physical conditions for creating pectin polymer-polymer (homopolymer) entanglement. The potential role of water movement in creating pectin entanglement was investigated by placing water droplets—equivalent to the water content of two gel phase films—between two glass phase films and compressing the films at variable probe velocities. Slow probe velocity (0.5 mm/sec) demonstrated no significant debonding. Corresponding videomicroscopy demonstrated an occasional water bridge, but no evidence of stranding or polymer entanglement. In contrast, fast probe velocity (5 mm/sec) resulted in 1) an increase in peak adhesion strength, 2) a progressive debonding curve, and 3) increased work of cohesion (p<.001). Corresponding videomicroscopy demonstrated pectin stranding and delamination between pectin films. Scanning electron microscopy images obtained during pectin debonding provided additional evidence of both stranding and delamination. We conclude that water movement can supply the motive force for the rapid chain entanglement between pectin films.
Introduction
Pectin is a structural heteropolysaccharide that comprises approximately 30% of the primary cell walls of plants (Scheller, Jensen, Sorensen, Harholt, & Geshi, 2007). The most abundant component of pectin is homogalacturonan, a glycan of α1→4-linked D-galacturonic acid that can be largely carboxy methyl esterified (Monsoor, Kalapathy, & Proctor, 2001; Nunes et al., 2012). When exposed to calcium, low-methoxyl pectin forms calcium-pectin salt bridges, sometimes referred to as egg box-like structures, that facilitate the immobilization of substances within the gel structure (Munarin et al., 2011). Pectin also has the interesting property of being a bioadhesive. The bioadhesivity of pectin, combined with its ability to trap drugs or growth factors within the gel structure, has led to considerable interest in using pectin to target drug delivery (Smistad, Boyum, Alund, Samuelsen, & Hiorth, 2012) as well as facilitate tissue engineering (Coimbra et al., 2011) and wound healing (Munarin, Tanzi, & Petrini, 2012).
A more general adhesive property of pectin is suggested by the ability of pectins to bind not only nasal and gut mucosa (mucoadhesion), but also the mesothelial glycocalyx of visceral organs (Servais et al., 2018). Although the mechanism of mucoadhesion is poorly understood, at least two steps have been proposed (Edsman & Hagerstrom, 2005). The first step in the process is intimate contact between the mucoadhesive and the mucosa (Smart, 2014). This wetting phase increases the contact area between the surfaces (Sriamornsak, Wattanakorn, Nunthanid, & Puttipipatkhachorn, 2008). The second phase involves the entanglement of the branched polymers. The interpenetrated chains interact forming physical entanglements as well as chemical bonds and weak chemical interactions (Hagesaether & Sande, 2007). Evidence for pectin entanglement includes the diminished adhesion after restrictive crosslinking or covalent modification of polymer chains (Bernkop-Schnurch & Apprich, 1997). Similarly, spectroscopic investigations have found evidence for chain interpenetration at the biointerface (Jabbari, Wisniewski, & Peppas, 1993; Sriamornsak et al., 2008). Despite the interest in the process of interpenetration and its relevance to biomedical application, there is limited direct evidence of branched chain entanglement (Zheng, Pierce, Wagner, Scheller, Mohnen, Ackermann, et al., 2020).
In this report, we investigated the physical conditions for creating pectin polymer-polymer (homopolymer) entanglement. The evidence for entanglement was based on enhanced adhesive function including a protracted debonding curve as well as direct visualization of branched-chain entanglement.
Methods
Pectin.
The citrus pectins used in this study were obtained from a commercial source (Cargill, Minneapolis, MN, USA) as described (Pierce et al., 2020). Briefly, the proportion of galacturonic acid residues in the methyl ester form determined the degree of methoxylation. High-methoxyl pectins (HMP) were defined as those pectin polymers with a greater than 50% degree of methoxylation (Mean = 68±9%). The pectin films had a glycosyl residue content of 75–88% mole % galacturonic acid, 2–4% rhamnose, 10–15% galactose and 2–5% arabinose based on gas chromatography–mass spectrometry of trimethylsilyl derivatives (Biswal et al., 2017) and with a 75–85% homogalacturonan and 15–23% rhamnogalacturonan I content. The pectin powder was stored in low humidity at 25°C.
Pectin dissolution in water.
The pectin powder was dissolved at 25°C by a controlled increase in water as previously described (Zheng, Pierce, Wagner, Scheller, Mohnen, Tsuda, et al., 2020). Briefly, the complete dissolution of the pectin was obtained using a high-shear 10,000 rpm rotor-stator mixer (L5M-A, Silverson, East Longmeadow, MA USA). The dissolved pectin was poured into standardized molds and cured to glass phase films for further studies as previously described (Pierce et al., 2020).
Nanocellulose fibers (NCF).
The linear chains of NCF films were used as a control for pectin entanglement. The NCF powder was dissolved at 25°C by a controlled increase in water similar to the previously described process for pectin (Zheng, Pierce, Wagner, Scheller, Mohnen, Tsuda, et al., 2020). Briefly, NCF was obtained from the University of Maine (Process Development Center, Orono, ME, USA). The NCF dissolution was achieved with progressive hydration followed by high-shear 10,000 rpm rotor-stator mixer (L5M-A, Silverson). The dissolved NCF was poured into standardized molds and cured for further studies.
Adhesion testing.
Polymer-polymer adhesion experiments were performed with a custom fixture designed for the TA-XT plus with 50 kg load cell (Stable Micro Systems, Godalming, Surrey, UK). The fixture was composed of a 30 mm diameter flat-ended stainless-steel cylindrical probe and a flat stainless-steel fixture surface; both surfaces used vacuum-controlled fixation. The assay involved films mounted onto both surfaces. The probe descended at the selected probe velocity for a distance of 1.5 mm above the film plane. The cylindrical probe velocity range was 0.5 mm/sec to 10 mm/sec. The probe compressed the two polymers at a selectable compression force (typically 1–5 N) and development time (typically 20 sec). The probe was then withdrawn at 0.2 mm/sec with constant force and time recordings at 500 pps.
Transillumination stereo microscopy.
The film interface was transilluminated with a 4000 lumen 6000K LED light with custom diffusion filter to assure uniform illumination. Probe compression and withdrawal was recorded with a 16 megapixel camera (Hayear, Shenzhen, PRC) mounted to a Nikon SMZ 1000 stereo microscope (Nikon, Tokyo, Japan). Recorded at 60 fps, the MOV files were converted to MetaMorph (Molecular Devices, Downington, PA, USA) compatible STK files for morphometric analysis.
Contact angles and water droplets.
The contact angle of water in air was measured by the sessile drop method. A 10 μl droplet of double-distilled H2O was gently placed onto the polymer surface or plastic substrate. The analysis was performed at 20°C. The assay was performed in a controlled humidity environment. Polypropylene substrate controls were used to estimate evaporative losses. All droplets were released within 3–4 mm of the polymer surface. The contact angle was assessed using MetaMorph 7.8 morphometric software (Molecular Devices).
Morphometric measurements.
The optical intensity was calculated as the inverse logarithm of the grayscale transmittance where the transmittance at a given pixel was the grayscale value divided by the maximum number of grayscale levels. Mean or average optical intensity was normalized by region size. Intensity variation was calculated as the standard deviation of optical intensity in the region of interest.
Scanning electron microscopy (SEM).
After coating with 20–25 Å gold in an argon atmosphere, the pectin films were imaged using a Philips XL30 ESEM scanning electron microscope (Philips, Eindhoven, Netherlands) at 15 Kev and 21 μA. A eucentric sample holder was used for standardized automation.
Statistical analysis.
The statistical analysis was based on measurements in at least three different samples. The unpaired Student’s t test for samples of unequal variances was used to calculate statistical significance. The data were expressed as mean ± one standard deviation. The significance level for the sample distribution was defined as p<.01.
Results
Probe velocity and debonding.
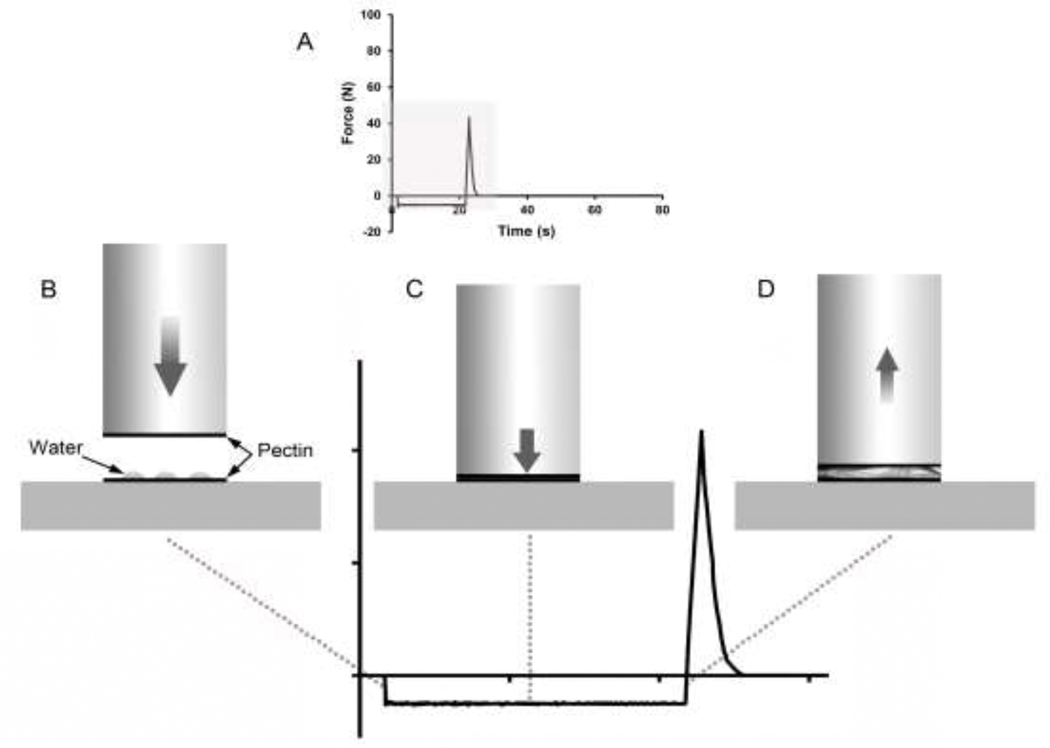
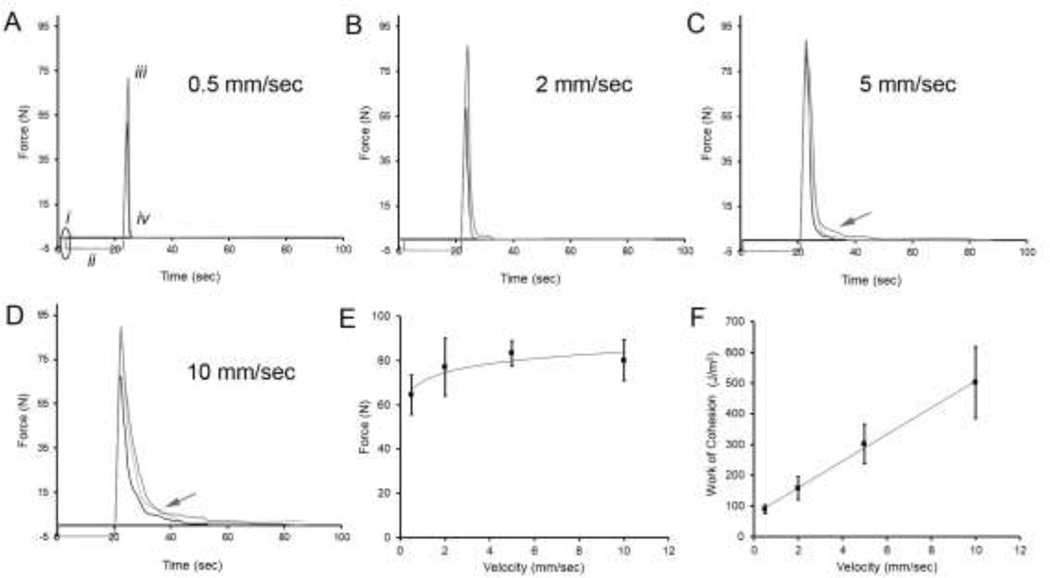
Previous work showed that gel phase (37–42% water content), but not glass phase (10–14% water content), high-methoxyl pectin films demonstrated pectin polymer-polymer adhesion (Zheng, Pierce, Wagner, Scheller, Mohnen, Ackermann, et al., 2020). To investigate the potential role of water movement in creating pectin entanglement, we placed water droplets—equivalent to the water content of 2 gel phase films—between glass phase films (Figure 1). In the adhesion assay, the probe descended at a preset velocity, maintained a desired compression force for a predetermined interval, then was withdrawn at a constant velocity (Figure 1). The initial experiments evaluated the effect of probe probe velocity on pectin adhesion (Figure 2A–D). Increasing compression velocities resulted in an increase in peak adhesions strength (p<.01) (Figure 2E). Interestingly, the adhesion curves also demonstrated a progressive debonding curve (Figure 2C–D, arrow). The debonding curve was associated with an increased work of cohesion (p<.001) (Figure 2F).
Figure 1.
Schematic of the adhesion test. A) The tracing reflects the probe forces during the adhesion and deadhesion events (recorded at 500 pps). Detail of the gray region is shown in B-D. B) In the initial phase, the probe descends at a pre-set velocity. The probe stops 1.5 mm above the film plane. C) In the second phase, the probe maintains a selectable compression force for a preset length of time. This time interval is referred to as the development time; it is the time allotted for the process of entanglement. D) The final phase of the assay is the withdrawal of the probe at 0.2 mm/sec. Probe withdrawal determines the peak force and debonding curve of the film interaction.
Figure 2.
Tensile strength adhesion curve between two glass phase pectin films (10% water content). Water droplets (50 μl) were placed between the glass films prior to compression. A) The films were compressed at an increasing velocity (i, elilipse), but constant compression force (5 N) and time (20 sec) (ii). The forces measured at peak adhesion (iii) and deadhesion (iv) were recorded at 500 pps. A-D) The tensile strength adhesion curves were measured at increasing probe compression velocities: 0.5 mm/sec (A), 2 mm/sec (B), 5 mm/sec (C), and 10 mm/sec (D). Evidence of a debonding curve was noted at 5 mm/sec (C, arrow) and 10 mm/sec (D, arrow). E) The peak adhesion strength modestly increased with increasing compression velocity (logarithmic trendline, R2 = 0.821). F) The area under the curves, reflecting the work of cohesion, significantly increased with increasing compression velocity (linear trendline, R2 = 0.998). Three representative curves are shown in A-D; error bars = 1 SD.
Pectin surface energy.
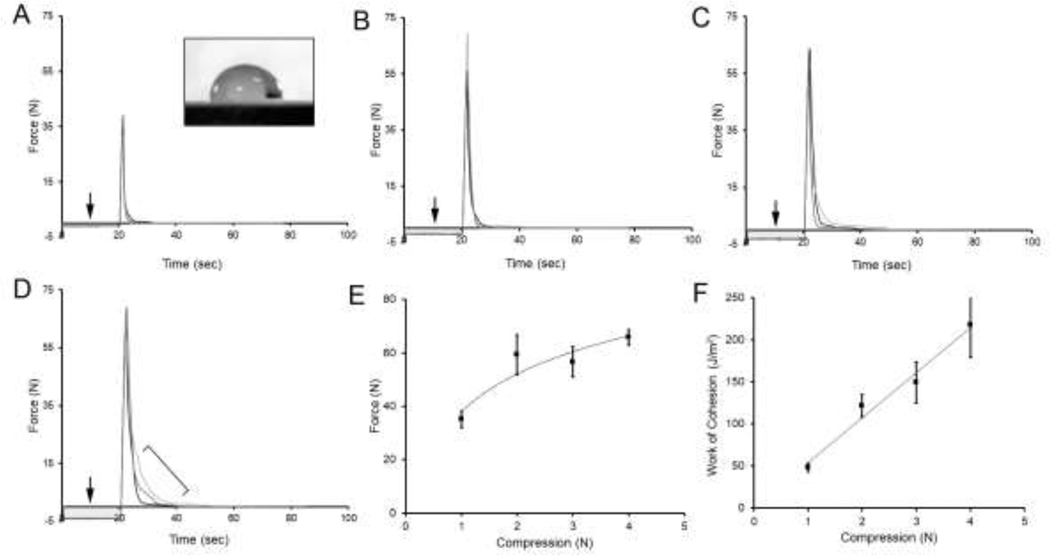
To evaluate the behavior of water on the surface of pectin films, the contact angles of water droplets placed on the glass phase pectin film were measured. Contact angles (Θ ≈ 90°) were unchanged for more than 20 seconds indicating minimal water absorption during the adhesion assay. To assess the compressive force required for pectin entanglement, the probe was set at a constant 5 mm/sec velocity, but the force of film compression was varied (Figure 3A–D). The compression forces were examined between 1 N and 4 N (Figure 3E–F). Increased adhesion strength and debonding curves were occasionally observed at 1 N to 2 N, but consistently observed at 3 N to 4 N.
Figure 3.
Surface energy of the glass phase films at the adhesive interface. Tensile strength adhesion curve between two glass phase pectin films (10% water content). Water droplets (10 μl) were gently placed between the glass films and compressed at variable forces (A-D, arrows). A) Without compression, the water droplets demonstrated a contact angle of 90° (inset) for more than 20 seconds indicating their availability for compression. A compression force of 1 N produced some increase in adhesion strength, but no debonding curve. B-D) Compression force of 2 N, 3 N and 4 N consistently demonstrated increased adhesion strength and evidence of debonding curves (D, bracket). E) The relationship of adhesion strength and compression force was described by a logarithmic trendline (R2= 0.9894). F) The area under the curves, reflecting the work of cohesion, increased with increasing compression velocity (linear trendline, R2 = 0.9745). Three representative curves are shown in each condition; error bars=1 SD; grayscale levels of individual curves are arbitrarily varied for presentation purposes.
Development time.
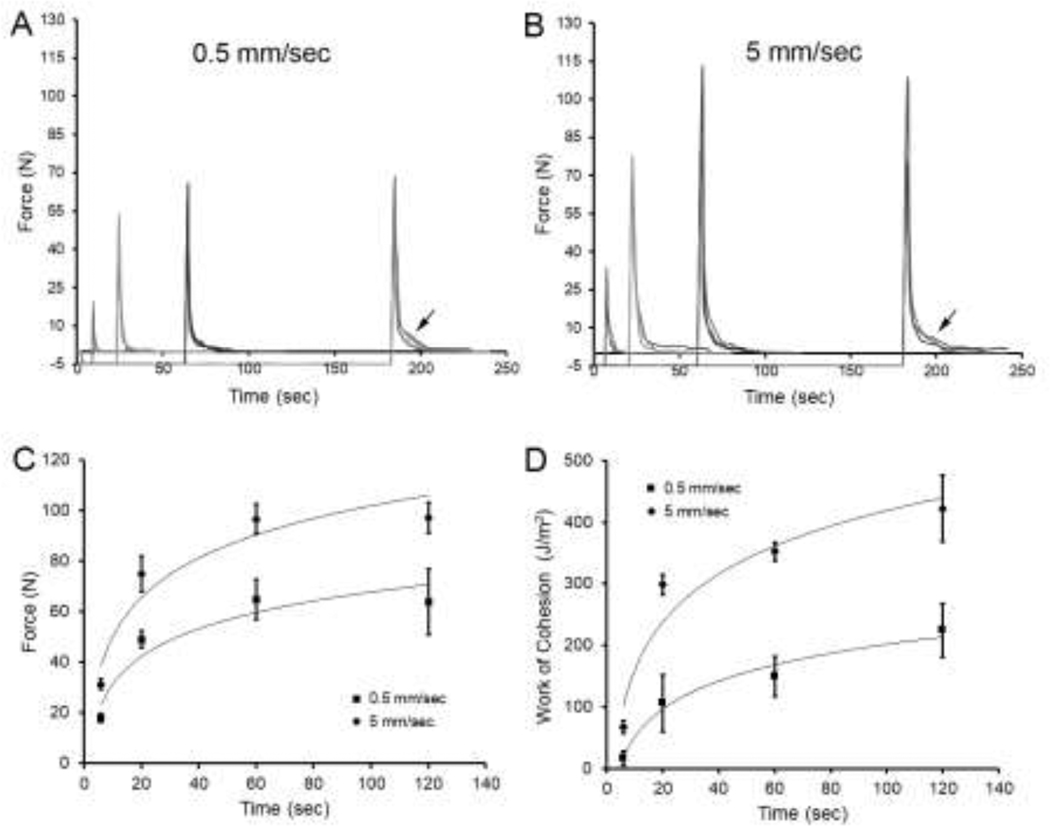
The influence of development time on polymer-polymer adhesion was assessed at slow (0.5 mm/sec) and fast (5 mm/sec) probe velocities (Figure 4). At a slower (0.5 mm/sec) probe velocity and a compression force of 5 N, increasing development time demonstrated increasing adhesion strength, but little evidence of debonding (Figure 4A). In contrast, a faster (5 mm/sec) probe velocity and increasing development time resulted in higher peak forces (p<.01) and a detectable debonding curve (Figure 4B, arrow). The peak force (Figure 4C) and work of cohesion (Figure 4D) were significantly greater with higher probe velocities and increased development time (p<0.001).
Figure 4.
The effect of development time on adhesion strength and pectin debonding. Two probe velocities, 0.5 mm/sec and 5 mm/sec, were compared. A) Increasing development time at a slow probe velocity (0.5 mm/sec) produced increased adhesion strength at 60 seconds and some evidence of debonding at 200 sec (arrow). B) Increasing development time at a fast probe velocity (5 mm/sec) produced increased adhesion strength at 60 seconds as well as functional evidence of debonding (arrow). In A and B, three representative curves are shown in each condition. Grayscale of individual curves are arbitrarily varied for presentation purposes. A comparison of the 2 peak velocities demonstrated that the fast probe velocity correlated with greater adhesion strength (C) and work of cohesion (D) at each development time point (P<0.001). Logarithmic trend lines are shown; error bars=1 SD.
Visualizing entanglement.
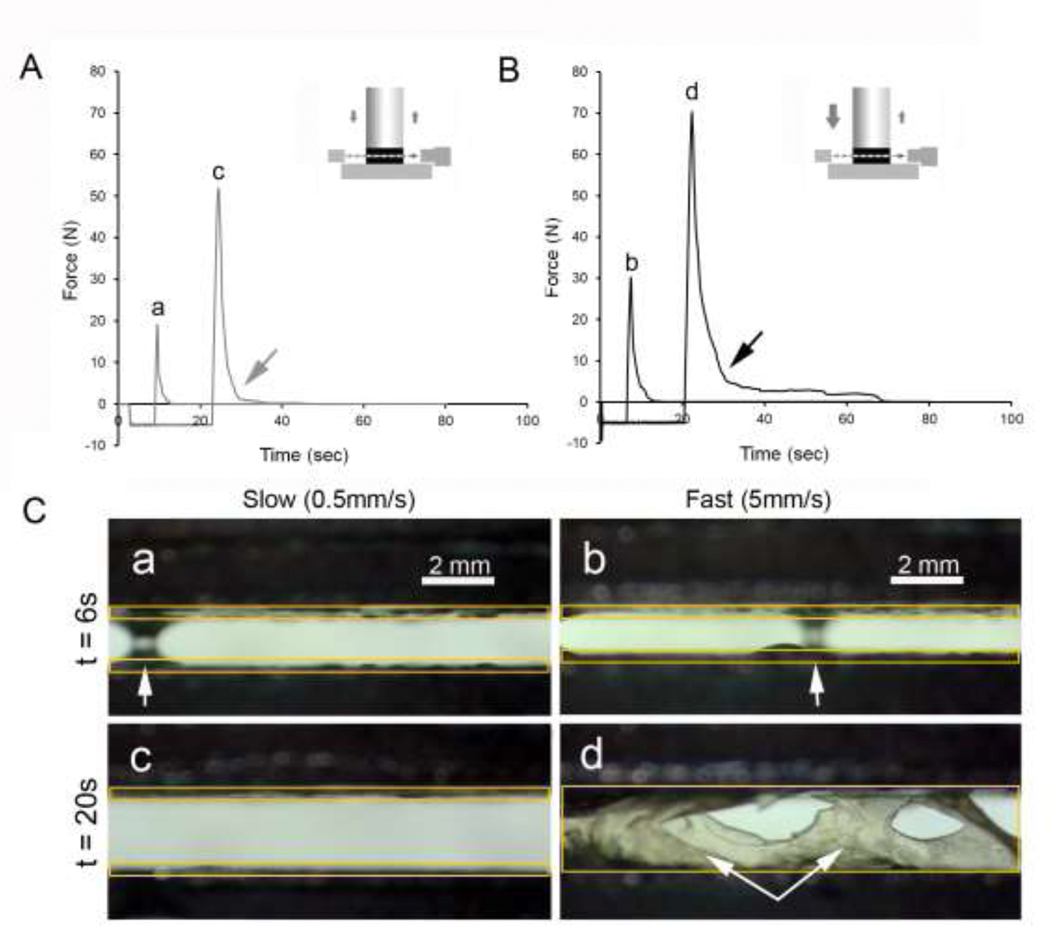
To investigate the physical interactions occurring during the debonding phase, we exploited the translucent optical properties of the pectin films and used transillumination stereo microscopy to visualize the polymer-polymer interface. The branched-chain configuration of pectin polymers was compared to the linear configuration of NCF polymers in these polymer-polymer interactions. Slow probe compression velocity (0.5 mm/sec) at 6 sec and 20 sec development time demonstrated no significant debonding (Figure 5A, arrow). Corresponding videomicroscopy demonstrated an occasional water bridge (Figure 5C a, arrow) but no evidence of stranding or delamination. In contrast, the fast probe velocity (5 mm/sec) at 20 sec development time demonstrated a significant debonding curve (Figure 5B, arrow). Corresponding videomicroscopy demonstrated similar water bridges in the 6 sec samples (Figure 5C b, arrow), but also polymer entanglement with stranding interactions between pectin films in the 20 sec samples (Figure 5C d, arrows).
Figure 5.
Visualization of pectin entanglement at slow and fast probe velocity using transillumination stereomicroscopy. The film interface was recorded using videomicroscopy coincident with force and distance recordings at 500 pps. Compression of the pectin films with A) slow (0.5 mm/sec) and B) fast (5 mm/sec) probe velocity was followed by 6 sec and 20 sec development time. A) The slow probe velocity produced a minimal debonding curve (gray arrow). B) The fast probe velocity produced evidence of significant debonding (black arrow). C) Transillumination videomicroscopy of the slow probe velocity demonstrated no evidence of interfascial stranding or delamination after either 6 or 20 sec development time (a, c). D) Videomicroscopy of the fast probe velocity demonstrated evidence of film entanglement after 20 sec of development time (d, double arrow). Bridges of water were noted in both fast and slow probe conditions (a,b white single arrow). The location of the pectin films is denoted with orange rectangles.
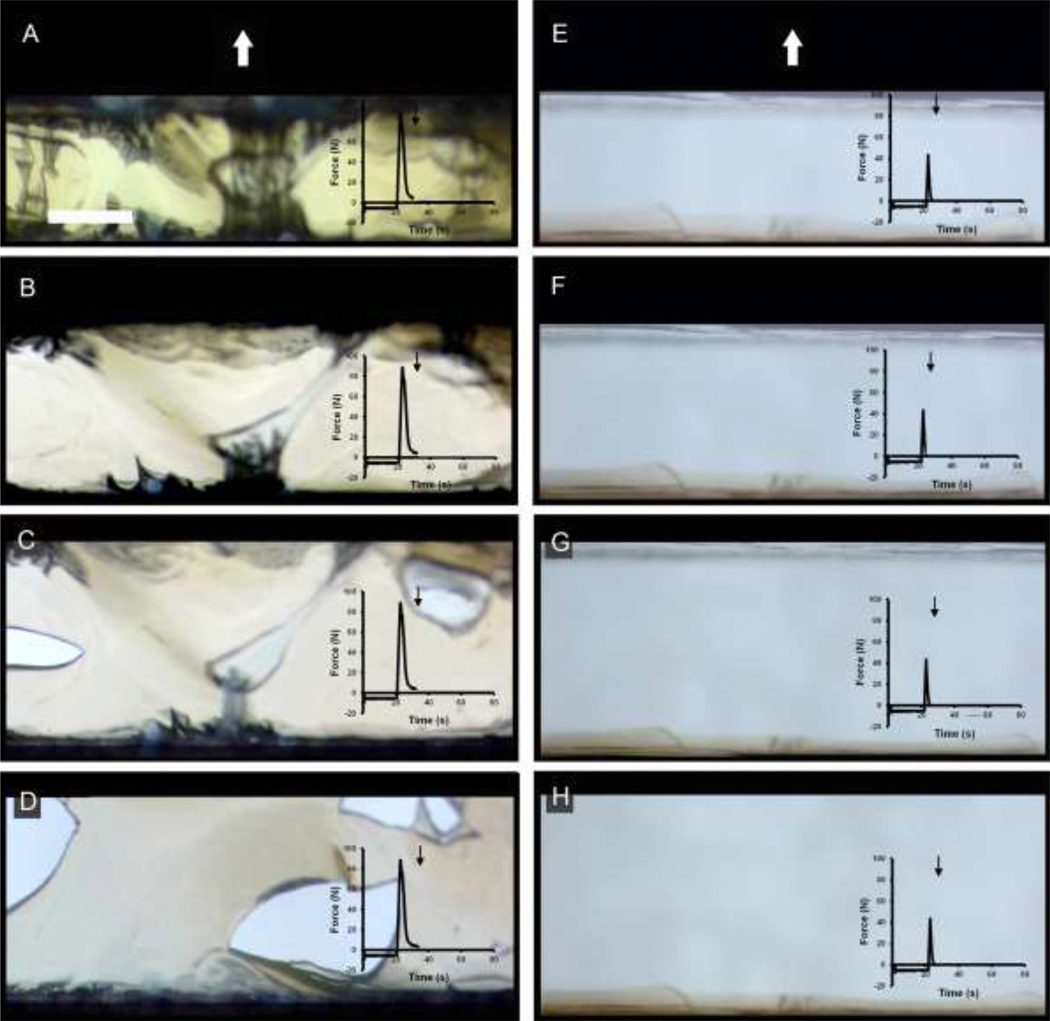
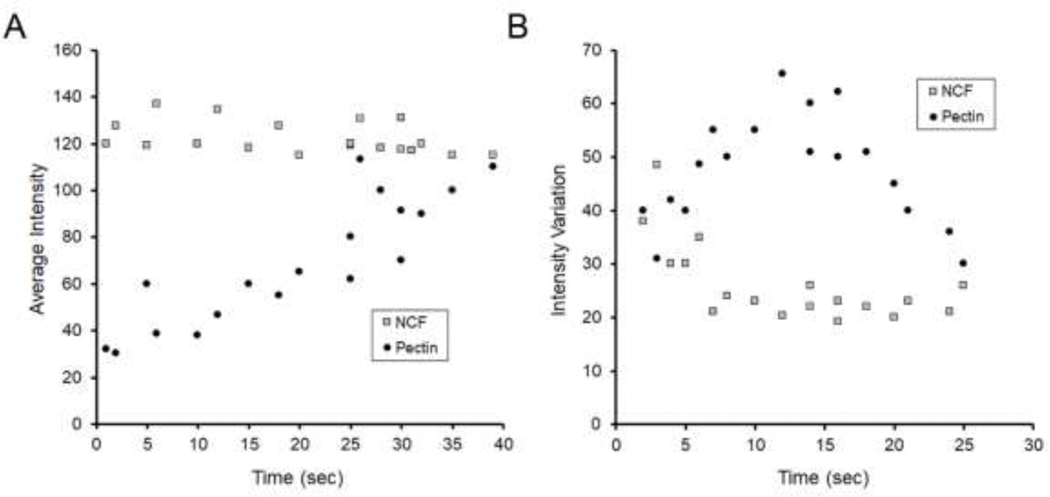
Qualitative analysis of the video recordings indicated that early stages of polymer separation were characterized by stranding or fibrillation (Figure 6A, B). Later stages of separation were characterized by delamination (Figure 6C, D). In contrast, NCF polymers separated with lower peak adhesion force, and demonstrated no evidence of debonding or entanglement (Figure 6E–H). Morphometry of the entangled polymers was consistent with these observations (Figure 7). The unentangled separation of the NCF polymers resulted in high average intensity measurements (high transmittance). In contrast, the entangled polymers demonstrated significantly lower average intensity in the early stages of separation (p<.001) (Figure 7A). Similarly, there was greater intensity variation in the entangled polymers than in the unentangled control NCF polymer (p<.001) (Figure 7B).
Figure 6.
Serial image sequence of transillumination microscopy of pectin and NCF polymer-polymer interactions. The sequence is shown for pectin (A-D) and NCF (E-H) polymers. The water droplets on the polymer surface were compressed at 5 N for 20 seconds prior to probe withdrawal. The force tracing at each step in the process is shown as an inset. Note the change in color as well as the character of the debonding as the process unfolds. The probe was withdrawn vertically (arrow) resulting in a progressively larger transillumination window. The images were obtained at 65 sec (A,E), 70 sec (B,F), 78 sec (C,G) and 88 sec (D,H). Bar = 3 mm.
Figure 7.
Morphometry of entangled polymers. Pectin and NCF polymer-polymer interactions were compared for changes in image intensity and intensity variation. After 5N of compression, the probe was withdrawn, and morphometry was performed at various times after withdrawal. The initial evaluable gap was defined as t=0. A) The average optical intensity, reflecting the intensity of transilluminated light averaged over the gap between the two polymers, was measured during probe withdrawal. Rapid separation of the polymers (gray squares) was reflected by higher average intensity. In contrast, entangled polymers demonstrated lower optical intensity during the debonding phase (solid circles) (p<.001). B) The intensity variation, reflecting the standard deviation of the entangled polymers, was similar for both NCF (gray squares) and pectin (solid circles) during the early stages of probe withdrawal; however, the optical variation of the pectin films increased in the debonding phase associated with stranding, fibrillation and delamination (p<.001). Each data point represents the mean of three films.
Scanning electron microscopy (SEM).
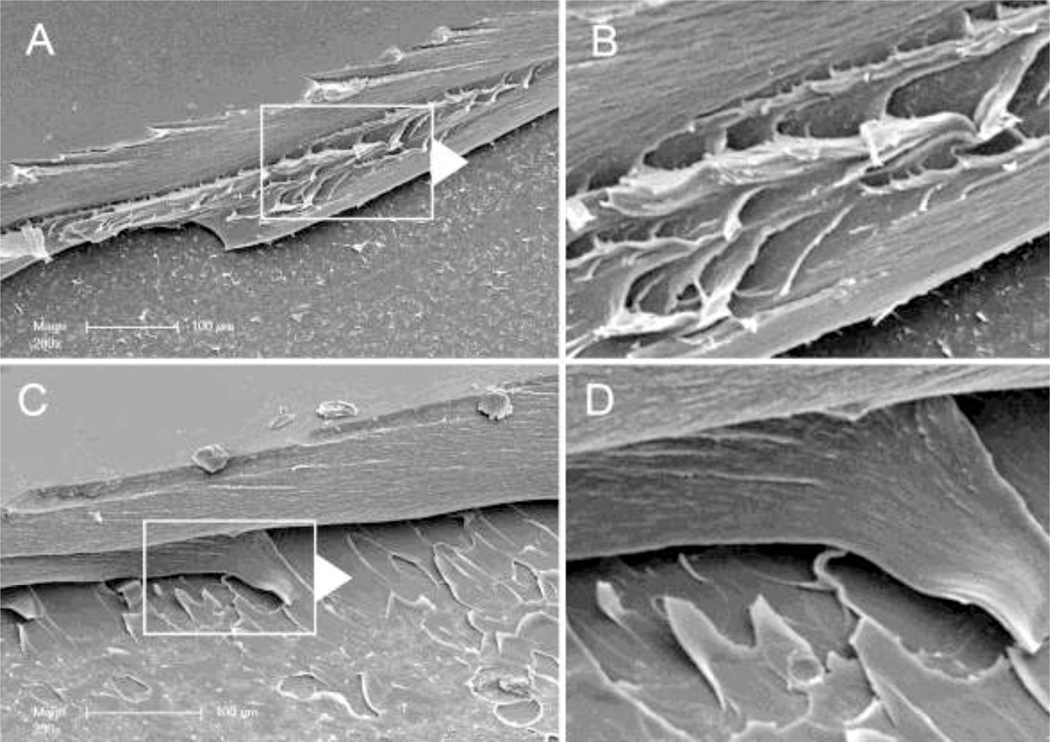
Pectin entanglement was also visualized by SEM. Polymer-polymer entanglement was produced by fast probe velocity (5 N compression for 20 seconds). Probe withdrawl was suspended immediately after the peak adhesion force and early in the debonding phase of the separation. The films were examined by SEM. Two patterns were observed (Figure 8). Consistent with our findings using optical microscopy, some of the films demonstrated stranding or apparent fibrillation (Figure 8A–B) whereas other samples demonstrated clear evidence of delamination (Figure 8C–D).
Figure 8.
Scanning electron microscopy (SEM) of the entangled pectin films. The entangled films were produced by high velocity compression of the two gel phase films at 5 mm/sec and 5 N compression force and a 20 sec development time. The films were separated to a point just beyond the peak adhesion force followed by curing to the glass phase. The glass phase conjoined films were sharply divided at the midpoint and examined by SEM. A) A polymer-polymer surface is notable for apparent stranding at the interface B) line. B) High resolution of the interface shows fibrillation at the interface. C) Other samples demonstrated clear evidence of delamination at the polymer interface. D) High resolution of the delaminating pectin polymer.
Discussion
In this report, the pectin chain entanglement between two glass phase films—as visualized by transillumination stereomicroscopy—required three elements: 1) water droplets, the equivalent water content of two gel phase films, placed between the pectin films; 2) compression of the water droplets between the pectin films at a velocity of 5 mm/sec; and 3) a development time of at least 20 seconds with a minimum compression force of 2–3 N. These elements produced debonding curves as well as visible evidence of pectin film entanglement. We conclude that water movement can supply the motive force for the rapid chain entanglement between pectin films.
The probe compression of the water droplets between pectin films is the functional equivalent of injecting water between two glass phase pectin films. The flow of water in the infinitesimally small gap between two compressed glass phase pectin films is reminiscent of Hele-Shaw flow (Hele-Shaw, 1898). In the case of pectin films, the probe velocity drives the water to fill the voids in the porous pectin medium. As noted by Taylor (Taylor, 1950) and Lewis (Lewis, 1950), when two fluids (or water and pectin) of different densities are accelerated in a direction perpendicular to their interface, the interface demonstrates small deviations as the acceleration is directed from the more dense to the less dense fluid or vice versa (Saffman & Taylor, 1958). In this case, we speculate that these small deviations facilitated pectin branched-chain interactions.
The crucial feature of these experiments is water behavior at the pectin interface. We have previously shown that an equivalent amount of water present within the pectin films does not result in chain entanglement—irrespective of compression force or development time (Zheng, Pierce, Wagner, Scheller, Mohnen, Ackermann, et al., 2020). Here, water droplets were not immediately adsorbed by the pectin film but remained on the pectin surface where they were available for injection into the interface.
An unexpected finding was the rapidity of pectin chain entanglement. In contrast to conventional polymer melts, pectin entanglement was observed between glass phase films at room temperature. The effective injection of water (equivalent to the content of two gel phase films) between the films produced mechanical and visual evidence of a debonding curve after only 20 seconds. In our experimental system, the motion of the water and the physical proximity of the films led to efficient pectin chain entanglement. We speculate that water movement released the constraints of the two glass phase films while simultaneously facilitating the interaction between opposing chains.
The pattern of debonding of the pectin films reflected both stranding and delamination. Sometimes described as fibrillation (Zosel, 1995, 1998) or stringiness (Shitajima, Karyu, Fujii, Nakamura, & Urahama, 2015; Urahama, 1989), these linear structures were the dominant pattern during the first stages of film separation. Stranding is commonly observed at the leading edge of-pressure sensitive adhesive testing. In both pectin and pressure-sensitive adhesives, the stranding functions to disperse applied stress concentrated at the film interface (Shitajima et al., 2015). In the later phases of film separation, the videomicroscopy demonstrated apparent delamination of the pectin film. The delamination pattern is likely a reflection of intrinsic pectin structure and may vary with different pectin sources. In addition, we speculate that delamination would be limited by the cross-grain effect observed in conjoined pectin films (Zheng, Pierce, Wagner, Scheller, Mohnen, Ackermann, et al., 2020).
Finally, the observation that water provides the motive force for pectin entanglement has several interesting implications. In mucoadhesion, the movement of water from the mucous layer to the pectin has been associated with enhanced pectin adhesivity (Thirawong, Kennedy, & Sriamornsak, 2008; Thirawong, Nunthanid, Puttipipatkhachorn, & Sriamornsak, 2007). In the mesothelium, the physiologic mechanisms controlling pectin-glycocalyceal adhesion are less clear. Relatively dehydrated (glass phase) films adhere strongly to the pleural glycocalyx in the absence of exogenous water (Servais et al., 2018). A potential explanation for the entanglement between pectin and pleural glycocalyx is the presence of endogenous water movement. Recently, a complex array of membrane pits underlying the mesothelial glycocalyx have been described (Wagner et al., 2020). We speculate that these Wagner pits may provide a source of hydration that facilitates chain interactions between the pectin and the native glycocalyx.
Highlights.
The compression of water droplets between two glass phase pectin films produces polymer-polymer adhesion.
High velocity compression produces greater adhesion and work of cohesion.
High velocity, but not low velocity, compression is associated with physical entanglement between polymers.
Acknowledgements
The authors would like to acknowledge the support of Gaert Maesmans, Piet Bogaert, Christoph Peters and Ivo Kohls of the Cargill Corporation.
Supported in part by NIH Grant HL94567, HL134229, HL007734, CA009535, ES000002 and the German Research Foundation (SFB1066). HVS was supported by Contract DEAC0205CH11231 between Lawrence Berkeley National Laboratory and the U.S. Department of Energy. DM was supported in part by the Center for Bioenergy Innovation (CBI), a U.S. Department of Energy Bioenergy Research Center supported by the Office of Biological and Environmental Research in the DOE Office of Science and by the Department of Energy funded Center for Plant and Microbial Complex Carbohydrates grant DESC0015662.
Abbreviations:
- HMP
high-methoxyl pectin
- NCF
nanocellulose fibers
- PPS
points per second
- SEM
scanning electron microscopy
- Wc
water content
Footnotes
Publisher's Disclaimer: This is a PDF file of an unedited manuscript that has been accepted for publication. As a service to our customers we are providing this early version of the manuscript. The manuscript will undergo copyediting, typesetting, and review of the resulting proof before it is published in its final form. Please note that during the production process errors may be discovered which could affect the content, and all legal disclaimers that apply to the journal pertain.
References
- Bernkop-Schnurch A, & Apprich I. (1997). Synthesis and evaluation of a modified mucoadhesive polymer protecting from alpha-chymotrypsinic degradation. Int. J. Pharm, 146(2), 247–254. [Google Scholar]
- Biswal AK, Tan L, Atmodjo MA, DeMartini J, Gelineo-Albersheim I, Hunt K, . . . Mohnen D. (2017). Comparison of four glycosyl residue composition methods for effectiveness in detecting sugars from cell walls of dicot and grass tissues. Biotechnol. Biofuels, 10. [DOI] [PMC free article] [PubMed] [Google Scholar]
- Coimbra P, Ferreira P, de Sousa HC, Batista P, Rodrigues MA, Corriea IJ, & Gil MH (2011). Preparation and chemical and biological characterization of a pectin/chitosan polyelectrolyte complex scaffold for possible bone tissue engineering applications. Int. J. Biol. Macromol, 48(1), 112–118. [DOI] [PubMed] [Google Scholar]
- Edsman K, & Hagerstrom H. (2005). Pharmaceutical applications of mucoadhesion for the non-oral routes. J. Pharm. Pharmacol, 57(1), 3–22. [DOI] [PubMed] [Google Scholar]
- Hagesaether E, & Sande SA (2007). In vitro measurements of mucoadhesive properties of six types of pectin. Drug Dev. Ind. Pharm, 33(4), 417–425. [DOI] [PubMed] [Google Scholar]
- Hele-Shaw HS (1898). The Flow of Water. Nature, 58(1489), 34–36. [Google Scholar]
- Jabbari E, Wisniewski N, & Peppas NA (1993). Evidence of mucoadhesion by chain interpenetration at a poly(acrylic acid)-mucin interface using ATR-FTIR spectroscopy. J. Control. Release, 26(2), 99–108. [Google Scholar]
- Lewis DJ (1950). The instability of liquid surfaces when accelerated in a direction perpendicular to their planes .2. Proc. R. Soc. Lond. A Math. Phys. Sci, 202(1068), 81–96. [Google Scholar]
- Monsoor MA, Kalapathy U, & Proctor A. (2001). Determination of polygalacturonic acid content in pectin extracts by diffuse reflectance Fourier transform infrared spectroscopy. Food Chem, 74(2), 233–238. [DOI] [PubMed] [Google Scholar]
- Munarin F, Guerreiro SG, Grellier MA, Tanzi MC, Barbosa MA, Petrini P, & Granja PL (2011). Pectin-based injectable biomaterials for bone tissue engineering. Biomacromolecules, 12(3), 568–577. [DOI] [PubMed] [Google Scholar]
- Munarin F, Tanzi MC, & Petrini P. (2012). Advances in biomedical applications of pectin gels. Int. J. Biol. Macromol, 51(4), 681–689. [DOI] [PubMed] [Google Scholar]
- Nunes C, Silva L, Fernandes AP, Guine RPF, Domingues MRM, & Coimbra MA (2012). Occurrence of cellobiose residues directly linked to galacturonic acid in pectic polysaccharides. Carbohydr. Polym, 87(1), 620–626. [DOI] [PubMed] [Google Scholar]
- Pierce A, Zheng Y, Wagner WL, Scheller HV, Mohnen D, Tsuda A, . . . Mentzer SJ (2020). Pectin biopolymer mechanics and microstructure associated with polysaccharide phase transitions. J. Biol. Mat. Res. Part A, 108, 246–253. [DOI] [PMC free article] [PubMed] [Google Scholar]
- Saffman PG, & Taylor G. (1958). The penetration of a fluid into a porous medium or hele-shaw cell containing a more viscous liquid. Proc. R. Soc. Lond. A Math. Phys. Sci, 245(1242), 312–329. [Google Scholar]
- Scheller HV, Jensen JK, Sorensen SO, Harholt J, & Geshi N. (2007). Biosynthesis of pectin. Physiol. Plant, 129(2), 283–295. [Google Scholar]
- Servais AB, Kienzle A, Valenzuela CD, Ysasi AB, Wagner WL, Tsuda A, . . . Mentzer SJ (2018). Structural heteropolysaccharide adhesion to the glycocalyx of visceral mesothelium. Tissue Eng Part A, 24, 199–206. [DOI] [PMC free article] [PubMed] [Google Scholar]
- Shitajima K, Karyu N, Fujii S, Nakamura Y, & Urahama Y. (2015). Effect of adhesive thickness on the stringiness of crosslinked polyacrylic pressure-sensitive adhesives. Journal of Applied Polymer Science, 132(27). [Google Scholar]
- Smart JD (2014). Theories of Mucoadhesion. In Khutoryanskiy VV (Ed.), Mucoadhesive Materials and Drug Delivery Systems; (pp. 159–174) [Google Scholar]
- Smistad G, Boyum S, Alund SJ, Samuelsen ABC, & Hiorth M. (2012). The potential of pectin as a stabilizer for liposomal drug delivery systems. Carbohydr. Polym, 90(3), 1337–1344. [DOI] [PubMed] [Google Scholar]
- Sriamornsak P, Wattanakorn N, Nunthanid J, & Puttipipatkhachorn S. (2008). Mucoadhesion of pectin as evidence by wettability and chain interpenetration. Carbohydr. Polym, 74(3), 458–467. [Google Scholar]
- Taylor G. (1950). The instability of liquid surfaces when accelerated in a direction perpendicular to their planes .1. Proc. R. Soc. Lond. A Math. Phys. Sci, 201(1065), 192–196. [Google Scholar]
- Thirawong N, Kennedy RA, & Sriamornsak P. (2008). Viscometric study of pectin-mucin interaction and its mucoadhesive bond strength. Carbohydr. Polym, 71(2), 170–179. [Google Scholar]
- Thirawong N, Nunthanid J, Puttipipatkhachorn S, & Sriamornsak P. (2007). Mucoadhesive properties of various pectins on gastrointestinal mucosa: An in vitro evaluation using texture analyzer. Eur. J. Pharm. Biopharm, 67(1), 132–140. [DOI] [PubMed] [Google Scholar]
- Urahama Y. (1989). Effect of peel load on stringiness phenomena and peel speed of pressure-sensitive adhesive tape. Journal of Adhesion, 31(1), 47–58. [Google Scholar]
- Wagner WL, Zheng Y, Pierce A, Ackermann M, Horstmann H, Kuner T, . . . Mentzer SJ (2020). Mesopolysaccharides: The extracellular surface layer of visceral organs. In revision. [DOI] [PMC free article] [PubMed] [Google Scholar]
- Zheng Y, Pierce A, Wagner WL, Scheller HV, Mohnen D, Ackermann M, & Mentzer SJ (2020). Water-dependent blending of pectin films: The mechanics of conjoined biopolymers. Molecules, In press. [DOI] [PMC free article] [PubMed] [Google Scholar]
- Zheng Y, Pierce A, Wagner WL, Scheller HV, Mohnen D, Tsuda A, . . . Mentzer SJ (2020). Analysis of pectin biopolymer phase states using acoustic emissions. Carbohydr. Polym, 227:115282. [DOI] [PMC free article] [PubMed] [Google Scholar]
- Zosel A. (1995). Mechanical-properties of films from polymer latices. Polymers for Advanced Technologies, 6(5), 263–269. [Google Scholar]
- Zosel A. (1998). The effect of fibrilation on the tack of pressure sensitive adhesives. International Journal of Adhesion and Adhesives, 18(4), 265–271. [Google Scholar]


