

Abstract
In vitro studies have indicated that the P2Y12 receptor antagonist selatogrel is a substrate of organic anion‐transporting‐polypeptide (OATP)1B1 and OATP1B3 that are known to mediate hepatic uptake. Selatogrel is primarily eliminated via the biliary route. Therefore, the study aim was to investigate the effect of rifampin‐mediated OATP1B1 and OATP1B3 inhibition on the pharmacokinetics (PK) of selatogrel. This was a randomized, double‐blind, placebo‐controlled, two‐period, crossover study in 14 healthy subjects. In each period, a single subcutaneous dose of 4 mg selatogrel was administered, either immediately after a single intravenous 30 minutes infusion of 600 mg rifampin or after placebo. Plasma samples were collected for 36 hours and analyzed using a validated liquid chromatography‐tandem mass spectrometry method. PK parameters of selatogrel were calculated using noncompartmental analysis. The effect of rifampin was explored based on geometric mean peak plasma concentration (Cmax) and area under the concentration curve from zero to infinity (AUC0–∞) ratios and for time of maximum plasma concentration (Tmax) by Wilcoxon signed rank test. In addition, the safety and tolerability of the study treatments were evaluated. The geometric mean ratios of Cmax and AUC0–∞ were 1.19 (90% confidence interval (CI) 1.11–1.28) and 1.43 (90% CI 1.36–1.51), respectively, indicating a minor selatogrel exposure increase when administered after an infusion of rifampin compared with placebo. Rifampin administration did not affect terminal half‐life (t ½) or Tmax of selatogrel. All study treatments were safe and well‐tolerated. A single dose of 600 mg rifampin, a potent OATP1B1/1B3 inhibitor, did not impact the PK of selatogrel to a clinically relevant extent suggesting that OATP1B1 and OATP1B3 transporters do not play a major role in the elimination of selatogrel.
Selatogrel (ACT‐246475) is a novel, potent, selective, and reversible P2Y12 receptor antagonist currently in development for early treatment of a suspected acute myocardial infarction. It is planned to be self‐administered s.c. as a single dose at symptom onset of an acute myocardial infarction shortening the time gap until treatment in the hospital.1, 2
In a single‐ascending dose study, selatogrel was safe and well‐tolerated across a dose range from 1–32 mg and showed dose‐proportional exposure.1 Selatogrel is quickly absorbed within 30–45 minutes after s.c. administration and has a short elimination half‐life (~ 2–9 hours).1 It has a short onset of action, whereas the extent and duration of platelet inhibition are dose‐dependent.1 In healthy subjects and patients with chronic coronary syndrome, single s.c. doses of 8 and 16 mg resulted in potent platelet inhibition from 15 minutes until 8 hours and the pharmacodynamic effect was reversed within 24 hours postdose.1, 3 It has low potential for cytochrome P450 (CYP) mediated drug‐drug interactions (DDIs) as it is not a substrate and neither an inducer nor an inhibitor of CYP enzymes. Selatogrel is mainly eliminated unchanged via the biliary route and is highly bound to plasma proteins.4, 5
The role of human drug transporters in the disposition of selatogrel was investigated in vitro as per US Food and Drug Administration (FDA) guidance with respect to organic anion‐transporting polypeptides (OATP1B1 and OATP1B3), organic anion transporters (1 and 3), organic cation transporter, P‐glycoprotein, breast cancer resistance protein, and multidrug resistance protein 2 (MRP2).6 Based on these in vitro studies, selatogrel is a substrate of OATP1B1 and OATP1B3 and MRP2 only (Idorsia Pharmaceuticals, data on file). OATP1B1/1B3 are key hepatic uptake transporters that are mainly expressed on the basal side of human hepatocytes and mediate the transport into the hepatocytes.7 MRP2 is predominantly located on the canalicular membrane of hepatocytes and transports endogenous and exogenous compounds into the bile.8 Because being a substrate of MRP2 has not been associated with any clinical DDI and is not mentioned in the FDA guidance, inhibition of MRP2 was not clinically investigated.9, 10
Rifampin has been shown to potently inhibit OATP1B1/1B3 in several clinical studies and is a model inhibitor, as per FDA guidance.7, 10, 11
Because selatogrel is a substrate of OATP1B1/1B3 based on in vitro data and is primarily eliminated via the biliary route, this study aimed to investigate the effect of rifampin‐mediated OATP1B1 and OATP1B3 inhibition on the single‐dose pharmacokinetics (PK) of selatogrel.
METHODS
Subjects
This study (NCT03814200; EudraCT 2018‐004226‐28) was approved by the Dutch health authority and an independent ethics committee (Stichting Beoordeling Ethiek Biomedisch Onderzoek, Assen, The Netherlands) prior to study initiation and was conducted in full accordance with the principles of the Declaration of Helsinki and according to good clinical practice. Healthy male and female subjects between 18 and 65 years (inclusive) were eligible for this study and provided written informed consent.
Subjects were included if they had a body mass index of 18.0–30.0 kg/m2 and showed no clinically relevant findings in clinical laboratory tests (including hematology and coagulation), 12‐lead electrocardiography (ECG), vital signs, and physical examination. Pregnant or lactating women and subjects with bleeding or platelet disorders or any other disease able to interfere with the evaluation of the study were excluded.
Study design
This was a prospective, single‐center, randomized, double‐blind, two‐period, crossover study. Both treatment periods were separated by a washout period of 7–10 days. Subjects were randomized to receive either treatment A followed by treatment B, or vice versa. Treatment A consisted of a single i.v. infusion of 100 mL saline immediately followed by a single s.c. dose of 4 mg selatogrel. Treatment B consisted of a single i.v. infusion of 600 mg rifampin (100 mL) immediately followed by a single s.c. dose of 4 mg selatogrel. Each infusion was administered over 30 minutes. In both treatment periods, selatogrel was administered in the thigh by a healthcare professional while the subject was under fasting conditions. A dose of 4 mg was selected based on predictions to not exceed exposure levels of the highest tested dose (i.e., 32 mg) in a previous study.1
The sample size of 14 subjects was based on a precision estimate assuming similar intrasubject and intersubject variability of 0.25 and 0.15 (SD on logarithmic scale) for peak plasma concentration (Cmax) and area under the concentration time curve from zero to infinity (AUC0–∞), respectively.1
Pharmacokinetic analysis
Blood samples to determine the PK profile were collected at 5, 10, 20, 30, 45 minutes, and 1, 1.5, 2, 3, 4, 6, 8, 12, 24, and 36 hours post‐selatogrel dosing. Plasma was prepared by centrifugation and stored in polypropylene tubes at −25°C (±5°C) prior to analysis.
Plasma concentrations of selatogrel were determined using a validated liquid chromatography coupled to tandem mass spectrometry assay with a lower limit of quantification (LLOQ) of 1.00 ng/mL.12 The method was linear in the range from 1.00 to 2,000 ng/mL. Calibration and quality control samples were measured throughout the study and used to determine the interbatch precision (< 5% coefficient of variation) and the interbatch accuracy (103.1–111.6% relative deviation).
The PK parameters of selatogrel were determined by noncompartmental analysis performed with WinNonlin software version 8.0 (Pharsight, Mountain View, CA). The parameters Cmax and time of maximum plasma concentration (Tmax) were derived directly from the plasma concentrations of selatogrel. AUC time profiles (AUC0–t) was calculated according to the linear trapezoidal rule, using the measured concentration‐time values above the LLOQ. AUC0–∞ was calculated by combining AUC0–t and AUCextra. The AUCextra represented an extrapolated value obtained by C t/λ z, where C t was the last concentration above the LLOQ and λ z represented the terminal elimination rate constant determined by log‐linear regression analysis of the measured plasma concentrations of the terminal elimination phase. The terminal half‐life (t ½) of selatogrel was calculated as ln 2/λ z. The apparent clearance (CL/F) and the apparent volume of distribution (Vd/F) were calculated as follows: CL/F = Dose/AUC0–∞ and Vd/F = Dose/(λ z * AUC0–∞).
Safety and tolerability evaluations
The safety of the subjects and tolerability of the study treatments were monitored throughout the study and evaluated based on clinical assessment of adverse events (AEs), serious adverse events, physical examination, vital sign measurements, 12‐lead ECG recordings, body weight, and laboratory data, including clinical chemistry, hematology, and coagulation.
RESULTS
Subjects
Fourteen healthy male and female subjects (8 women and 6 men) were enrolled and completed this study. Each subject was included in the safety evaluation. One subject was excluded from the PK analysis, as all plasma samples of one period were determined to be below the LLOQ.
The overall mean age was 37.4 years (range 24–65 years) and the mean body mass index was 23.05 kg/m2 (range 19.0–28.3 kg/m2). All subjects were white.
Effect of rifampin on the PK of selatogrel
The mean plasma concentration‐time profiles of selatogrel in the absence (treatment A) or presence (treatment B) of rifampin are shown in Figure 1 . The Cmax of selatogrel was 19% higher when administered in combination with rifampin compared with placebo, as reflected by the ratio (90% confidence interval) of the geometric mean of Cmax (1.19; 90% confidence interval 1.11–1.28). The overall exposure to selatogrel, as reflected by AUC0–t and AUC0–∞, was increased by 44% and 43%, respectively (Table 1 ). Rifampin administration did not affect t ½ as indicated by a geometric mean ratio of 0.97. The median Tmax was 0.5 hours in the presence or absence of rifampin (Table 1 ). CL/F and Vd/F decreased upon concomitant rifampin administration as reflected by a geometric mean ratio of 0.70 and 0.68, respectively (Table 1 ).
Figure 1.
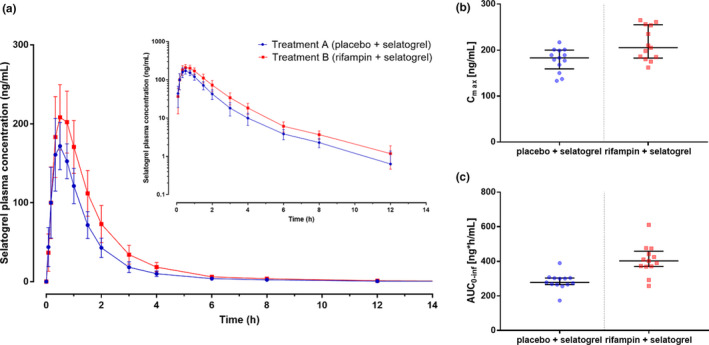
(a) Mean plasma concentration (with SD) vs. time profiles of selatogrel after administration of rifampin (treatment B) or placebo (treatment A) on a linear (main panel) and semilogarithmic (inset) scale. (b) Individual peak plasma concentrations (Cmax) after treatment A (blue dots) and treatment B (red dots). Bars represent the median and the interquartile range. (c) Individual area under the curve data from time 0 to infinity (AUC0–∞) after treatment A (blue dots) and treatment B (red dots). Bars represent the median and the interquartile range; n = 13.
Table 1.
Summary of pharmacokinetic parameters of selatogrel in the absence (treatment A) and presence (treatment B) of rifampin and geometric mean ratios for treatment comparison
| Parameter | Statistics | Treatment A (placebo + selatogrel) | Treatment B (rifampin + selatogrel) | GMR or median difference |
|---|---|---|---|---|
| Tmax, hours | Median | 0.5 | 0.5 | 0.00 |
| Min, Max | 0.3, 0.8 | 0.3, 0.8 | 0.00, 0.13 | |
| CV% | 33.7 | 27.5 | ||
| Cmax, ng/mL | Geometric mean | 176.9 | 210.4 | 1.19 |
| 95% CI | 161.4–193.8 | 189.8–233.2 | 1.11–1.28 | |
| CV% | 15.2 | 17.2 | ||
| AUC0–t, ng hours/mL | Geometric mean | 273.7 | 392.6 | 1.44 |
| 95% CI | 245.6–304.9 | 344.2–447.8 | 1.37–1.52 | |
| CV% | 18.0 | 22.0 | ||
| AUC0–∞, ng hours/mL | Geometric mean | 279.8 | 398.7 | 1.43 |
| 95% CI | 251.2–311.7 | 349.8–454.3 | 1.36–1.51 | |
| CV% | 18.0 | 21.9 | ||
| t 1/2 hours | Geometric mean | 2.5 | 2.5 | 0.97 |
| 95% CI | 2.0–3.2 | 2.1–2.9 | 0.78–1.19 | |
| CV% | 38.6 | 26.0 | ||
| CL/F, L/hours | Geometric mean | 14.3 | 10.0 | 0.70 |
| 95% CI | 12.8–15.9 | 8.8–11.4 | 0.66–0.75 | |
| CV% | 18.0 | 21.9 | ||
| Vd/F, L | Geometric mean | 52.2 | 35.5 | 0.68 |
| 95% CI | 41.6–65.6 | 30.5–41.4 | 0.55–0.85 | |
| CV% | 39.1 | 25.6 |
AUC0–∞, area under the plasma concentration‐time curve from zero to infinity; AUC0–t, area under the plasma concentration‐time curve from zero to the last detectable plasma concentration; CI, confidence interval; CL/F, apparent clearance; Cmax, maximum plasma concentration; CV%, coefficient of variation of the geometric mean; F, absolute bioavailability; GMR, geometric mean ratio; t 1/2, terminal elimination half‐life; Tmax, time to maximum plasma concentration; Vd/F , apparent volume of distribution.
Treatment period: A = selatogrel following saline infusion, B = selatogrel following rifampin infusion.
Data are expressed as geometric mean (95% CI and CV%) and ratio of geometric mean (90% CI) for treatment B/A, except for Tmax for which the median (range and arithmetic mean coefficient of variation) and the median difference B‐A (90% CI) is displayed; pharmacokinetic analysis based on n = 13 subjects.
Safety and tolerability
No serious adverse events or AEs leading to study discontinuation occurred during this study. In total, 25 AEs were reported by nine subjects during selatogrel treatment with rifampin (17 AEs reported by eight subjects) or with placebo (8 AEs reported by five subjects). All AEs were mild in intensity.
The most common AEs were catheter‐site related reactions that occurred in both treatment periods and were considered not related to study treatment (two AEs reported by one subject in treatment period A and three AEs reported by three subjects in treatment period B).
Among the total of 25 AEs, 8 AEs reported by five subjects were considered related to study treatment by the investigator and were reported more frequently in treatment period B (7 AEs, five subjects, mainly gastrointestinal disorders and chromaturia) compared with treatment period A (1 AE).
Chromaturia (reported by two subjects in treatment period B) and gastrointestinal disorders are well‐known side effects of rifampin.
No clinically significant treatment‐related changes were observed for hematology, coagulation, clinical chemistry, vital signs, ECG variables, or body weight.
DISCUSSION
This double‐blind phase I study was designed to evaluate the effect of the OATP1B1 and OATP1B3 inhibitor rifampin on the PK of the P2Y12 receptor antagonist selatogrel. Concomitant administration of a single i.v. dose of 600 mg rifampin increased the Cmax and AUC0–∞ by 19% and 43%, respectively, as reflected by the geometric mean ratios. This exposure increase is not considered clinically relevant, given the twofold margin between the highest dose confirmed as safe and tolerated (32 mg) in a previous study1 and the anticipated maximum therapeutic dose (16 mg), which was investigated in patients with chronic coronary syndrome.3 Therapeutically, as selatogrel shows a dose‐dependent duration of effect, the inhibition of platelet aggregation is likely to be prolonged by ~ 2–4 hours, which is considered as not clinically relevant.1 The Tmax and t ½ of selatogrel were not altered by the administration of rifampin, whereas CL/F and Vd/F decreased both by ~ 30%, explaining the lack of change in t ½.
These data indicate that a prohibition of OATP1B1/1B3 inhibitors (e.g., statins that may be concomitantly administered in clinical practice) is not required in future clinical trials with selatogrel.
As the PK of selatogrel is dose proportional,1 the results of this study with 4 mg selatogrel are also considered applicable to doses up to 32 mg.
Selatogrel is unlikely to cross membrane barriers easily via passive diffusion as it has a poor cellular permeability (transcellular permeability 0.2 to 10−6 cm/seconds; Idorsia Pharmaceuticals, data on file). Hence, transporter‐mediated uptake into the hepatocytes is considered relevant to explain the rapid elimination of selatogrel (t½ of ~ 2–9 hours1). When taking into consideration the low dose of the substrate (4 mg selatogrel) and the i.v. administration of 600 mg rifampin, this study investigated a worst‐case scenario with regard to OATP1B1 and OATP1B3 transporter inhibition.
An explanation for the low systemic exposure increase might be that other hepatic uptake transporters (e.g., OATP2B1) are involved in the uptake of selatogrel, as transporters often have overlapping substrate specificities.7, 13 OATP2B1 might compensate for the uptake of selatogrel into hepatocytes during the inhibition of OATP1B1 and OATP1B3 in this study, as rifampin is not a potent inhibitor of OATP2B1.14 It has been discussed that hepatic OATP2B1 may play an important role in drug clearance, however, due to lack of clinical evidence, prospective evaluation of OATP2B1 in drug development is currently not recommended15 and was not performed for selatogrel neither in vitro nor clinically.
It is well‐established that inhibition of uptake transporters leads to a decrease in Vd/F, as observed also in this study.16 As selatogrel is mainly eliminated via the liver, reduced uptake of selatogrel into the liver may prevent elimination of the drug leading to a decrease in clearance. An unchanged t ½ despite reduction in clearance has previously been reported for other transporter inhibition studies.11, 17 This has been ascribed to clearance and Vd/F changing in a parallel manner.18
Rifampin was selected in this study as it is a potent inhibitor of OATP1B1 and OATP1B3 following a single 600 mg dose14, 19, 20 and listed as model inhibitor in the regulatory guidances.10, 21 Although multiple dosing of rifampin leads to induction of primarily CYP3A4 enzymes and P‐glycoprotein, single‐dose administration of 600 mg i.v. rifampin triggers relevant inhibition of the OATP1B1/1B3 transporters.7, 11, 22 Cyclosporine is also listed as model inhibitor in the guidance, however, rifampin was preferred as it is more selective for OATP1B1/1B3.7
A double‐blind, placebo‐controlled design was chosen for this study, as it allowed for unbiased investigation of safety and tolerability. Saline served as placebo and all infusion bags and lines were covered to mitigate the risk that the red color of rifampin might introduce any bias with regard to AE reporting. AEs were more frequently reported after rifampin administration and were mainly well‐known side effects of rifampin (e.g., chromaturia and gastrointestinal disorders).
A limitation of the study might be that no genotyping was performed, even though genetic polymorphisms exist of the OATP1B1 and OATP1B3 gene resulting in altered transport activity.7 However, due to the low variability in PK parameters and exposure in this study (< 25% coefficient of variation for Cmax and AUC), genotyping for OATP1B1/1B3 was not deemed necessary.
In conclusion, selatogrel 4 mg s.c. administered after rifampin or its matching placebo was safe and well‐tolerated. Based on the study results a single dose of 600 mg rifampin, a potent OATP1B1/1B3 inhibitor, did not impact the PK of selatogrel to a clinically relevant extent suggesting that OATP1B1 and OATP1B3 transporters do either not play a major role in the elimination of selatogrel or their inhibition is compensated by other hepatic uptake transporters. Therefore, DDIs with OATP1B1/1B3 inhibitors are considered unlikely.
Funding
This study was sponsored by Idorsia Pharmaceuticals, Allschwil, Switzerland.
Conflict of Interest
U.S., J.D., and M.U. are employees of Idorsia Pharmaceuticals Ltd, the sponsor of the study, and possess stock options/shares. C.V.P., C.R., and P.D. are employed by QPS Netherlands B.V.
Author Contributions
All authors wrote the manuscript. U.S., J.D., and M.U. designed the research. C.V.P., C.R., and P.D. performed the research. U.S. analyzed the data.
Study Highlights.
WHAT IS THE CURRENT KNOWLEDGE ON THE TOPIC?
☑ Selatogrel is a potent and selective P2Y12 receptor antagonist currently in development for s.c. self‐injection in case of a suspected acute myocardial infarction. It is mainly excreted unchanged via the biliary route and a substrate of the organic anion‐transporting polypeptide (OATP)1B1 and OATP1B3 based on in vitro studies.
WHAT QUESTION DID THIS STUDY ADDRESS?
☑ This study investigated the impact of OATP transporter inhibition on the pharmacokinetics (PK) of selatogrel using a single i.v. dose of 600 mg rifampin.
WHAT DOES THIS STUDY ADD TO OUR KNOWLEDGE?
☑ Inhibition of OATP1B1 and OATP1B3 by a single dose of the OATP1B1/1B3 inhibitor rifampin did not change the PK of selatogrel to a clinically relevant extent. Selatogrel exposure was increased by ~ 20% in peak plasma concentration (Cmax) and 40% in area under the concentration time curve from zero to infinity (AUC0–∞), whereas time to peak plasma concentration (Tmax) and half‐life were not affected.
HOW MIGHT THIS CHANGE CLINICAL PHARMACOLOGY OR TRANSLATIONAL SCIENCE?
☑ Based on the study results inhibition of OATP1B1 and OATP1B3 transporters does not impact the elimination of selatogrel to a clinically relevant extent. Therefore, drug‐drug interactions with OATP1B1 and OATP1B3 inhibitors are considered unlikely.
Acknowledgments
The authors thank Anne‐Sophie Guern for the statistical analysis and Mark Enzler for the bioanalysis of study samples.
References
- 1. Juif, P. , Boehler, M. , Dobrow, M. , Ufer, M. & Dingemanse, J. Clinical pharmacology of the reversible and potent P2Y12 receptor antagonist ACT‐246475 after single subcutaneous administration in healthy male subjects. J. Clin. Pharmacol. 59, 123–130 (2019). [DOI] [PubMed] [Google Scholar]
- 2. Rey, M. et al The reversible P2Y12 antagonist ACT‐246475 causes significantly less blood loss than ticagrelor at equivalent antithrombotic efficacy in rat. Pharmacol. Res. Perspect. 5, e00338 (2017). [DOI] [PMC free article] [PubMed] [Google Scholar]
- 3. Storey, R.F. et al Pharmacodynamics, pharmacokinetics, and safety of single‐dose subcutaneous administration of selatogrel, a novel P2Y12 receptor antagonist, in patients with chronic coronary syndromes. Eur. Heart J. 1–9 (2019). 10.1093/eurheartj/ehz807 [DOI] [PMC free article] [PubMed] [Google Scholar]
- 4. Ufer, M. et al Absorption, distribution, metabolism and excretion of the P2Y12 receptor antagonist selatogrel after subcutaneous administration in healthy subjects. Xenobiotica 50, 427–434 (2019). [DOI] [PubMed] [Google Scholar]
- 5. Caroff, E. et al 4‐((R)‐2‐{[6‐((S)‐3‐Methoxypyrrolidin‐1‐yl)‐2‐phenylpyrimidine‐4‐carbonyl]amino}‐ 3‐phosphonopropionyl)piperazine‐1‐carboxylic Acid Butyl Ester (ACT‐246475) and its prodrug (ACT‐281959), a novel P2Y12 receptor antagonist with a wider therapeutic window in. J. Med. Chem. 58, 9133–9153 (2015). [DOI] [PubMed] [Google Scholar]
- 6. US Food and Drug Administration . In vitro metabolism‐ and transporter‐mediated drug‐drug interaction studies guidance for industry. (2017). <https://www.fda.gov/regulatory‐information/search‐fda‐guidance‐documents/vitro‐drug‐interaction‐studies‐cytochrome‐p450‐enzyme‐and‐transporter‐mediated‐drug‐interaction> and <https://www.fda.gov/downloads/Drugs/Guidances/UCM581965.pdf>.
- 7. Kalliokoski, A. & Niemi, M. Impact of OATP transporters on pharmacokinetics. Br. J. Pharmacol. 158, 693–705 (2009). [DOI] [PMC free article] [PubMed] [Google Scholar]
- 8. Jetter, A. & Kullak‐Ublick, G.A. Drugs and hepatic transporters: a review. Pharmacol. Res. 10.1016/j.phrs.2019.04.018 [DOI] [PubMed] [Google Scholar]
- 9. Hillgren, K.M. et al Emerging transporters of clinical importance: an update from the international transporter consortium. Clin. Pharmacol. Ther. 94, 52–63 (2013). [DOI] [PubMed] [Google Scholar]
- 10. US Food and Drug Administration . Clinical Drug Interaction Studies — Study Design, Data Analysis, and Clinical Implications – Draft Guidance for Industry (2017). <https://www.fda.gov/downloads/drugs/guidances/ucm292362.pdf>.
- 11. Juif, P. , Voors‐Pette, C. , Ufer, M. , Dogterom, P. & Dingemanse, J. Influence of rifampin‐mediated organic anion‐transporting polypeptide 1B1/1B3 inhibition on the pharmacokinetics of clazosentan. Clin. Transl. Sci. 12, 440–444 (2019). [DOI] [PMC free article] [PubMed] [Google Scholar]
- 12. Baldoni, D. et al A new reversible and potent P2Y12 receptor antagonist (ACT‐246475): tolerability, pharmacokinetics, and pharmacodynamics in a first‐in‐man trial. Clin. Drug Investig. 34, 807–818 (2014). [DOI] [PubMed] [Google Scholar]
- 13. Kitamura, S. , Maeda, K. , Wang, Y. & Sugiyama, Y. Involvement of multiple transporters in the hepatobiliary transport of rosuvastatin. Drug Metab. Dispos. 36, 2014–2023 (2008). [DOI] [PubMed] [Google Scholar]
- 14. Karlgren, M. et al Classification of inhibitors of hepatic organic anion transporting polypeptides (OATPs): influence of protein expression on drug‐drug interactions. J. Med. Chem. 55, 4740–4763 (2012). [DOI] [PMC free article] [PubMed] [Google Scholar]
- 15. Zamek‐Gliszczynski, M.J. et al Transporters in drug development: 2018 ITC recommendations for transporters of emerging clinical importance. Clin. Pharmacol. Ther. 104, 890–899 (2018). [DOI] [PMC free article] [PubMed] [Google Scholar]
- 16. Grover, A. & Benet, L.Z. Effects of drug transporters on volume of distribution. AAPS J. 11, 250–261 (2009). [DOI] [PMC free article] [PubMed] [Google Scholar]
- 17. Mück, W. et al Increase in cerivastatin systemic exposure after single and multiple dosing in cyclosporine‐treated kidney transplant recipients. Clin. Pharmacol. Ther. 65, 251–261 (1999). [DOI] [PubMed] [Google Scholar]
- 18. Benet, L.Z. , Bowman, C.M. , Liu, S. & Sodhi, J.K. The extended clearance concept following oral and intravenous dosing: theory and critical analyses. Pharm. Res. 35, 242 (2018). [DOI] [PMC free article] [PubMed] [Google Scholar]
- 19. Lau, Y.Y. , Huang, Y. , Frassetto, L. & Benet, L.Z. Effect of OATP1B transporter inhibition on the pharmacokinetics of atorvastatin in healthy volunteers. Clin. Pharmacol. Ther. 81, 194–204 (2007). [DOI] [PubMed] [Google Scholar]
- 20. van Giersbergen, P.L.M. , Treiber, A. , Schneiter, R. , Dietrich, H. & Dingemanse, J. Inhibitory and inductive effects of rifampin on the pharmacokinetics of bosentan in healthy subjects. Clin. Pharmacol. Ther. 81, 414–419 (2007). [DOI] [PubMed] [Google Scholar]
- 21. European Medicines Agency (EMA) Guideline on the investigation of drug interactions. (2012). <https://www.ema.europa.eu/en/documents/scientific‐guideline/guideline‐investigation‐drug‐interactions_en.pdf>.
- 22. Niemi, M. , Backman, J.T. , Fromm, M.F. , Neuvonen, P.J. & Kivistö, K.T. Pharmacokinetic interactions with rifampicin: clinical relevance. Clin. Pharmacokinet. 42, 819–850 (2003). [DOI] [PubMed] [Google Scholar]