Following conservative media skepticism of hurricane warnings in 2017, a partisan wedge in evacuation behavior rapidly emerged.
Abstract
Mistrust of scientific evidence and government-issued guidelines is increasingly correlated with political affiliation. Survey evidence has documented skepticism in a diverse set of issues including climate change, vaccine hesitancy, and, most recently, COVID-19 risks. Less well understood is whether these beliefs alter high-stakes behavior. Combining GPS data for 2.7 million smartphone users in Florida and Texas with 2016 U.S. presidential election precinct-level results, we examine how conservative-media dismissals of hurricane advisories in 2017 influenced evacuation decisions. Likely Trump-voting Florida residents were 10 to 11 percentage points less likely to evacuate Hurricane Irma than Clinton voters (34% versus 45%), a gap not present in prior hurricanes. Results are robust to fine-grain geographic controls, which compare likely Clinton and Trump voters living within 150 m of each other. The rapid surge in media-led suspicion of hurricane forecasts—and the resulting divide in self-protective measures—illustrates a large behavioral consequence of science denialism.
INTRODUCTION
The 2017 Atlantic hurricane season was the costliest on record, with Hurricanes Harvey, Irma, and Maria causing more than $250 billion in damages, directly killing hundreds of people, and thousands more due to slow recovery, poor sanitation, and limited access to medical services. Increasingly destructive storms highlight the importance of public confidence in advance warning systems—and the science behind them (1).
Survey evidence highlights that limited mobility, lack of transportation or shelter access, misinformation about storm severity, and fear of property damage all contribute to low evacuation rates (2, 3). Further complicating disaster management, politicization of hurricanes spiked in 2017 when conservative media outlets claimed that hurricane warnings were another example of “fake news.” Most notably, on 5 September 2017, just weeks after Hurricane Harvey devastated the Texas and Louisiana gulf coastline, conservative commentator Rush Limbaugh, the most popular talk radio host in America, publicly questioned the severity of Hurricane Irma and motivation behind government advisories:
[T]here is a desire to advance this climate change agenda, and hurricanes are one of the fastest and best ways to do it… All you need is to create the fear and panic accompanied by talk that climate change is causing hurricanes to become more frequent and bigger and more dangerous… and it’s mission accomplished. … TV stations begin reporting this and the panic begins to increase… so the media benefits with the panic with increased eyeballs, and the retailers benefit from the panic with increased sales. … You have people in all of these government areas who believe man is causing climate change, and they’re hell-bent on proving it… these storms, once they actually hit, are never as strong as they’re reported.
–Rush Limbaugh, 5 September 2017 (4)
Notably, Limbaugh linked existing conservative skepticism of climate science with appeals to ignore official warnings of Irma’s severity as landfall approached. While Limbaugh evacuated his Palm Beach, Florida home 3 days later, his dismissal of hurricane risks represented a discrete change in the politicization of storm warnings. Shortly after his show aired, conservative pundit Ann Coulter also questioned Irma’s severity, sparking thousands of supportive and outraged comments on Twitter (5). Reporting on both commentators reached mainstream news outlets, extending awareness of the controversy beyond Limbaugh’s regular listeners (6–8). Before this, only occasional instances of “hurricane trutherism” existed on right-wing blogs, making comparisons before and after Limbaugh’s statements a useful study of partisan effects on high-stakes behavior. Google search trends confirm both the novelty and virality of this hurricane skepticism, peaking just before Irma made Florida landfall (fig. S1).
We examine evacuation patterns for Hurricanes Matthew, Harvey, and Irma using GPS location data for more than 2.7 million U.S. smartphone users residing in Florida and Texas. Unlike prior studies that rely on questions about a hypothetical hurricane or post-landfall surveys, our study is the first to measure actual evacuation behavior for millions of residents affected by at least one major hurricane. Beyond simply altering stated beliefs about climate change, partisan skepticism shifts people’s choice to evacuate an oncoming storm, a personally consequential decision.
Our study adds to the growing literature on the role partisanship plays in news receptivity and biased-belief formation. Allcott and Gentzkow (9) find that Democrats and Republicans were more likely to believe fake news stories about the 2016 election if the stories matched their own political views. This divide widens among those measuring high in science literacy, suggesting that partisan disagreements persist even as scientific evidence accumulates (10). Reducing susceptibility to polarizing misinformation may be possible with low-cost, crowd-sourced flagging of low-quality news sources (11). Chen and Rohla (12) find evidence of abbreviated 2016 Thanksgiving dinners among cross-party families, highlighting one impact of increased political polarization on close family ties.
Surveys show that views on climate change differ along political lines, even among those with more science education (13) and meteorological expertise (14). The belief that climate change strengthens hurricane intensity displays a partisan divide: 60% of liberal Democrats but only 19% of conservative Republicans believe that climate change produces more severe storms (15). Parallel divides appear in hypothetical responses to warnings of an impending hurricane (16) or government evacuation orders (17). Blame attribution to local or national politicians in the wake of a devastating hurricane like Katrina further reveals a partisan bias (18).
RESULTS
Evacuation rates
Although Irma reached category 5 status with sustained wind speeds reaching 180 miles per hour (mph)—the strongest hurricane recorded in 2017—evacuation rates varied substantially, even among geographically proximate regions (Fig. 1). Of the 1.3 million smartphone users in our 2017 Florida sample, 37% evacuated their home for >24 hours during Irma (table S1), but rates ranged from 20 to 78% among locations within 5 km of the coast, an area at high risk of storm surge (Fig. 1). Among evacuees, one-third departed before a National Hurricane Center (NHC) watch was issued, two-thirds evacuated within 24 hours, and nearly 90% left within 48 hours (fig. S2). Hurricane Harvey, a category 4 storm, triggered a similar evacuation rate of 33% among the 1.0 million Texas residents in our dataset who live within 300 km of the Gulf Coast. During Hurricane Matthew, 16% of the 378,000 Florida residents in our 2016 dataset evacuated for >24 hours, in part because only 35% of residents lived in counties under an official hurricane watch or warning, compared to 73% of residents during Irma. Examining southern Florida, for instance, illustrates Irma’s considerably higher evacuation rates—across the political spectrum—than Matthew (fig. S3).
Fig. 1. Hurricane evacuation maps.
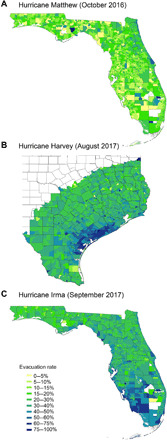
Proportion of residents (by voting precinct) who evacuate for >24 hours during Hurricanes Matthew (A), Harvey (B), and Irma (C).
Partisan differences in evacuation behavior
Using precinct-level vote share as a proxy for likely political affiliation, Fig. 2 depicts raw differences in cumulative evacuation probability between residents of Trump- and Clinton-majority precincts across these three hurricanes. Our main regression analysis (Table 1) demonstrates that Trump voters were approximately 10 percentage points less likely (P < 0.0001) to evacuate their home for >24 hours during Irma than nearby Clinton voters, a difference that emerged only after Republican-leaning skepticism of hurricane risks surfaced. Evacuation differences are not explained by obvious spatial or demographic covariates, including distance to the nearest coastline, household income, or education level (table S2). Using a stricter definition of “evacuation” as leaving home for >48 hours, our general findings are unchanged with Trump voters 11 to 12 percentage points (P < 0.0001) less likely to evacuate than similar Clinton voters (table S3).
Fig. 2. Hurricane evacuation rates by voting precinct.
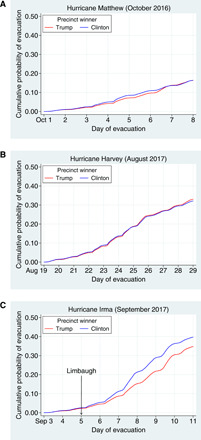
Kaplan-Meier curves for probability of >24-hour evacuation during Hurricanes Matthew (A), Harvey (B), and Irma (C).
Table 1. Regression estimates of partisan skepticism on hurricane evacuations.
***P < 0.0001, **P < 0.001, *P < 0.01. Standard errors are clustered at the level of political variation (precinct level) and reported in parentheses. Geographic controls include polynomials for distance to coast and elevation. Demographic controls include residential density, median age, median household income, college graduation rate, employment, and race/ethnicity. Full results are in table S2.
| Dependent variable: >24-hour evacuation | ||||
| Independent variable | (1) | (2) | (3) | (4) |
| Trump vote share | 0.0115* | −0.00626 | −0.00998 | 0.00659 |
| (0.00418) | (0.00563) | (0.00674) | (0.00713) | |
| Trump share × After Limbaugh | −0.117*** | −0.130*** | −0.0959*** | −0.104*** |
| (0.00951) | (0.00875) | (0.00809) | (0.00804) | |
| Hurricane alert received | 0.107*** | 0.0727*** | 0.144*** | 0.0870*** |
| (0.00279) | (0.00273) | (0.00364) | (0.00404) | |
| Geographic controls | No | Yes | Yes | Yes |
| Demographic controls | No | Yes | Yes | Yes |
| Fixed effects (# units) | Hurricane (3) | Hurricane (3) | Hurricane (3), | Hurricane (3), |
| County (166) | Geohash-4 (708) | |||
| Observations | 2,727,999 | 2,677,181 | 2,677,181 | 2,677,175 |
| Adjusted R2 | 0.031 | 0.035 | 0.043 | 0.044 |
Closer examination of Irma evacuations indicates that the partisan divide in hurricane response behavior is present in counties that received an official hurricane warning and, importantly, in counties that received no such alert and thus were not in the direct path of the storm (Fig. 3A). The no-alert counties serve as a useful basis of comparison, as these residents faced equally low risks of hurricane damage, yet evacuation rates among Clinton-majority precincts are consistently higher. The evacuation gap further widens among voting precincts at both ends of the political spectrum. Within the top 10% of precincts by Trump’s two-party vote share, fewer than 29% of residents evacuated during Irma, compared to more than 40% among precincts with the most Clinton support (Fig. 3B). Neither pattern is evident during Matthew or Harvey.
Fig. 3. Hurricane Irma evacuation rates by alert status and voting precinct.
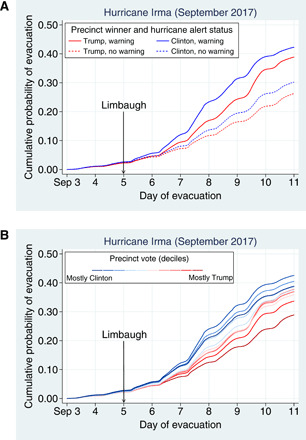
Kaplan-Meier curves for probability of >24-hour evacuation during Hurricane Irma in precincts with and without a hurricane watch/warning issued (A) and by decile of Trump vote share (B).
Robustness tests
The main threat to our identification strategy is whether, compared to Matthew and Harvey, Irma disproportionately affected Clinton-majority precincts, beyond what is captured by county-level hurricane advisories. To exclude this explanation for the observed effect, we add progressively finer spatial fixed effects (Table 1, columns 3 and 4). The estimated 10– to 11–percentage point partisan difference in evacuations translates to 45% of likely Clinton voters evacuating during Irma, compared to 34% of Trump voters. This evacuation wedge persists even when comparing residents living less than 20 km apart (i.e., in the same geohash-4). As hurricane-force winds exceeded 100 km in diameter, it is highly unlikely that Irma systematically hit Clinton precincts more severely than Trump precincts less than 20 km away. An advantage of using geohash (a rectangular grid) fixed effects is their independence from political, geographic, and demographic boundaries (fig. S4). As a robustness check, we vary the fixed effects using rectangular regions 150 (geohash-3) to 0.15 km (geohash-7) in width, while clustering standard errors at the precinct level, the unit of aggregation in public election results. We find stable estimates of this partisan difference of 9 to 11 percentage points (Fig. 4) across a wide scale of geographic controls, indicating that neither differential storm severity nor spatially correlated omitted variables drive our results.
Fig. 4. Partisan differences in evacuation probability.
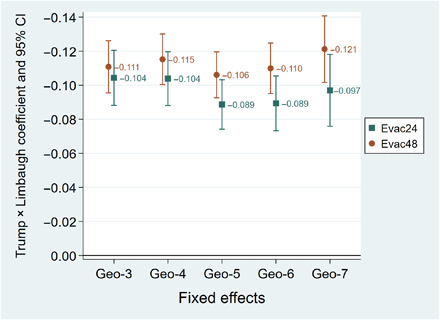
Main coefficient estimate and 95% confidence interval (CI) for varying geohash fixed effects, assuming residents evacuate their homes for >24 or >48 hours.
Next, we perform a decomposition of our main regression specification, effectively altering the comparison groups. Restricting our analysis to only the hurricanes making landfall in Florida (Matthew and Irma) or those only occurring in 2017 (Harvey and Irma), we estimate a slightly larger partisan wedge: an 11– to 14–percentage point effect (table S4, columns 1 and 2). If we instead limit our analysis to just Hurricane Irma and use fine geographic spatial controls, then we measure a difference of 7 to 8 percentage points. This smaller effect size occurs because, in previous hurricanes, likely Trump voters were slightly more likely to evacuate than their Clinton-voting neighbors, after controlling for key demographics (table S4, columns 3 and 4).
Our use of precinct-level voting data to infer likely political affiliation of constituents might give rise to concerns of ecological fallacy, whereby behavior differences in group averages may not represent average individual-level differences. To test for this possibility, we repeat our main regressions using only those precincts in the tails of the vote share distribution (table S5). Restricting the sample to precincts in the top (>75% votes won by Trump) and bottom tertile (<27% Trump), we estimate a 10–percentage point evacuation difference. Repeating this for the top and bottom quartiles or quintiles produces remarkably consistent estimates. If ecological bias were present, then we would expect a diminished effect size among more precincts in the tails of the distribution, where there is less room for between-precinct partisan differences to mask within-precinct heterogeneous effects; however, we observe no evidence of such potential bias.
Although our primary analysis estimates the effect of Limbaugh’s comments on all Irma evacuations, we test whether variations in when his statements went viral affect our results, using a classic difference-in-differences specification for just Hurricane Irma with person and day fixed effects. Partisan differences in overall evacuation probabilities ranged from 10 to 15 percentage points, with the greatest jump in partisan differences occurring between September 6th and 7th (table S6). In the days leading up to Irma’s landfall in Florida, we observe that the peak difference in overall evacuations between Clinton and Trump precincts coincides with the peak in Google search trends for “Rush Limbaugh hurricane” (Fig. 5). Together, these results support our findings of the Limbaugh-driven emergence of hurricane skepticism.
Fig. 5. Hurricane Irma trends pre- and post-Limbaugh statements.
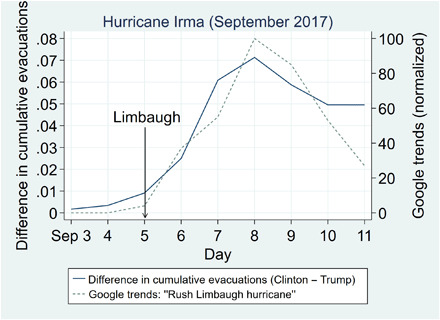
Difference in daily evacuation rates between Clinton and Trump precincts during Hurricane Irma (solid line) and Google trends of “Rush imbaugh hurricane” (dashed line) over the same period.
As a final robustness check, we adjust for unobservable variable selection (19), which generates a significantly stronger estimate than our original regression (δ = −0.003, z = −28.19, P < 0.0001). Florida residents of Trump-voting precincts have, on average, observable demographics associated with higher predicted evacuation rates during Irma, yet they actually evacuated at lower rates than their Clinton-voting counterparts. Partisan evacuation differences post-Limbaugh are unlikely to be explained by omitted variable bias and, if anything, underestimate the true effect size.
DISCUSSION
Most of the residents in our sample stay home during a hurricane. Yet, the observed partisan evacuation wedge arose even before the earliest official alerts. By casting doubt on the severity of Hurricane Irma, government advisories, and concomitant news reporting, partisan media outlets negated a sizable portion of advance warning systems. Altogether, hurricane skepticism led to an immediate and high-stake divide in evacuation behavior, complicating the ability of scientific and government organizations to mitigate storm risks. Federal agencies, including the National Oceanic and Atmospheric Administration (NOAA) and the Federal Emergency Management Agency are increasingly investing in efforts to counter hurricane rumors and misinformation, diverting limited resources and personnel from more critical tasks and reporting (20, 21).
The politicization of hurricane warnings shows no signs of abating (22), yet a remaining question is whether its impact on actual behavior will persist. Since Irma made landfall in 2017, Limbaugh has continued questioning the veracity of hurricane risks, making nearly identical comments about Hurricane Dorian in 2019 and affirming that “politics has forever changed hurricane coverage” (23). Partisan skepticism has broadened to other crises. In February 2020, several commentators joined Limbaugh in claiming that the “overhyped coronavirus” is no worse than the common cold and is being “weaponized” by the scientific community and liberal media to harm President Trump (24). In the face of these rapidly evolving and uncertain threats, trust in scientific evidence and government communications is paramount, and partisan disparities in protective behavior should be examined.
Our study has several limitations. Although our dataset includes movement patterns for millions of residents in Florida and Texas, we only observe smartphone users, likely underweighting some populations (e.g., older residents). We define an evacuation as departing one’s home for >24 hours during the storm, but it is possible that someone left their home yet remained in a high-risk area. Repeating our analysis with a >48-hour definition does not meaningfully change any results.
While it is beyond the scope of our analysis to determine optimal evacuation behavior for every resident at risk of hurricane harm, the arrival of partisan differences in evacuation rates is alarming. Our study cannot delineate why political affiliation has come to affect evacuation decision-making. Have beliefs about the likelihood of hurricane harm diverged, or is media-fueled partisanship shifting behavior, independent of beliefs?
Record wind speeds, rainfall, and flooding have characterized recent storm seasons (25), and rising ocean temperatures are expected to increase the frequency and intensity of hurricanes, a long-standing scientific consensus (26). Reaching the most vulnerable residents who stay behind, despite advance warnings, will require cultivating and maintaining the public’s trust of vital hurricane information. In the current era of fake news dominating headlines and the widening politicization of shared risks, finding credible, nonpartisan ways of communicating the potential dangers of hurricanes is warranted.
MATERIALS AND METHODS
Study design
We conduct a retrospective analysis of smartphone location data to impute a smartphone user’s approximate home location, for Florida and Texas residents. For three separate hurricanes (Matthew and Irma in Florida; Harvey in Texas), we then estimate the date and time that a resident evacuated their home location for at least 24 hours during the hurricane, if at all. After merging this with other publicly available hurricane alert information, demographics, and geographic covariates, and 2016 presidential election precinct-level results, we run both fixed-effect panel and difference-in-differences regressions to estimate whether a difference in evacuation behavior exists, between likely Trump and Clinton voters, following the emergence of conservative media–led skepticism of Hurricane Irma.
Data summary
Our primary dataset consists of anonymized smartphone location data for more than 30 million U.S. residents, from the data firm SafeGraph. Each observation (“ping”) includes an anonymous phone ID, date, time, latitude and longitude coordinates, and location accuracy. Smartphones typically ping every 10 min, with more frequent pings (approximately every 5 s) while driving.
Dates and times of county-level hurricane alerts come from the NHC, a branch of the U.S. NOAA (27). NHC provides forecasts and issues “watches” (48 hours before possible landfall) and “warnings” (36 hours before expected landfall) for hurricanes ranging from category 1 (wind speed 74 to 95 mph) to category 5 (wind speed >156 mph).
Demographic data at the block level consists of race or ethnicity (White, Black, Asian, and Hispanic) from the 2010 U.S. Census. Block group-level data on median household income, education, and employment rate come from the 2012–2016 American Community Survey, as do tract-level data on residential density (urban, suburban, and rural) and median household age. Geographic variables include distance to the coast (28) and elevation above sea level (29). Voting data come from the 2016 U.S. presidential election precinct-level results (the finest granularity legally permitted), specified as the two-party vote share won by Donald Trump (30). All control variables are summarized in table S1.
Definitions
We examine smartphone data over a 3-week period for each hurricane. To estimate a user’s home location, we examine pings over 1 week, beginning 10 days before their state’s first hurricane alert (7 September 2017 for Irma). We define a user’s “home area” as their modal location between 10:00 p.m. and 6:00 a.m. over this period, aggregated to the geohash-7 to preserve anonymity. For Hurricanes Irma (n = 1,321,571) and Matthew (n = 378,248), we include all smartphone users in Florida; for Hurricane Harvey (n = 1,032,525), we exclude Texas residents who live more than 300 km from the coast, as they did not receive any hurricane alerts and were not in the path of the storm.
A hurricane “evacuation” is defined as a smartphone user spending >24 continuous hours at least 100 m away from their home area, over a period beginning 4 days before the first alert until 4 days after all alerts were discontinued (3 to 15 September 2017 for Irma). This definition captures both early evacuees and evacuations to nearby shelters and uses a consistent window across the state of Florida. As a robustness exercise, we consider a >48-hour definition, summarized in table S3. The smartphone data are similarly processed for Hurricane Matthew in Florida (first alert on 4 October 2016) and Hurricane Harvey in Texas (first alert on 23 August 2017). Maps depicting >24-hour evacuations by voting precinct are shown in Fig. 1.
Regression specification
Our first regressions examine whether evacuation behavior differs by likely political affiliation post-Limbaugh, assuming the following linear probability model
where Evac24ih is a binary variable indicating whether individual i had a >24-hour evacuation during hurricane h. TrumpSharei is the 2016 presidential election precinct-level two-party vote share won by Donald Trump in i’s imputed precinct. TrumpSharei × AfterLimbaughh is our main variable of interest, defined as the product of TrumpSharei and an indicator variable AfterLimbaughh for whether a hurricane made U.S. landfall after Limbaugh’s comments in September 2017 (i.e., Hurricane Irma). HurricaneAlertih indicates whether an individual i’s imputed county received a storm watch and/or warning during hurricane h, which we view as both an important marker of risk and a useful benchmark coefficient size. The vector Fi is a set of fixed effects for hurricanes and substate geographical units such as counties. The vector Xi includes demographic, geographic, and census controls for individual i (table S1).
Robustness tests
Our main coefficient β2 estimates the partisan effect of Limbaugh’s statements on evacuation behavior. As tests of this coefficient’s estimating assumptions, we perform six robustness exercises.
First, we vary the geographical level of fixed effects (Table 1 and Fig. 4) to examine whether the evacuation wedge between likely Trump and Clinton voters during Hurricane Irma can be explained by spatial autocorrelation in hurricane intensity. In other words, did Irma systematically strike more Republican areas in ways that previous hurricanes did not?
Second, we replicate our main regressions using a stricter, >48-hour definition of evacuation (table S3). This tests whether our results are sensitive to the cutoff used to define a hurricane evacuation.
Third, we perform a decomposition exercise that repeats our main regression but systematically varies the identifying comparison group used to identify the partisan wedge (table S4). We first remove spatial fixed effects and compare Irma to either Mathew in Florida the prior year or Harvey striking Texas the same year. Then, we restrict our analysis to only Irma but retain the spatial controls of our main regression.
Fourth, we examine whether our results potentially suffer from ecological biases by restricting our sample to only residents of progressively more extreme percentile cuts of precinct-level two-party vote share (table S5). Fifth, we perform a standard difference-in-differences analysis using only Irma data, to examine whether emergence of the observed partisan wedge coincides with Limbaugh’s comments and their spread (table S6).
Last, we test our main coefficient’s stability to unobservable selection as developed in (31) and recently updated in (19). This procedure adjusts the main coefficient on TrumpSharei × AfterLimbaughh to remove the effect of selection on unobservables and further calculates how strong the selection on unobservables would need to be for the causal effect to be zero.
Supplementary Material
Acknowledgments
We thank SafeGraph for providing the dataset and K. Oswald for research assistance. Funding: None. Author contributions: Conceptualization, methodology, analysis, and writing (E.F.L. and M.K.C.); data visualization (E.F.L., M.K.C., and R.R.). Competing interests: The authors declare that they have no competing interests. Data and materials availability: Evacuation data are available at https://doi.org/10.7910/DVN/XSIZRL. All data needed to evaluate the conclusions in the paper are present in the paper and/or the Supplementary Materials. Additional data related to this paper may be requested from the authors.
SUPPLEMENTARY MATERIALS
Supplementary material for this article is available at http://advances.sciencemag.org/cgi/content/full/6/37/eabb7906/DC1
REFERENCES AND NOTES
- 1.World Meteorological Organization, Caribbean 2017 hurricane season: An evidence-based assessment of the early warning system (2018); https://library.wmo.int/doc_num.php?explnum_id=5459.
- 2.Huang S.-K., Lindell M. K., Prater C. S., Who leaves and who stays? A review and statistical meta-analysis of hurricane evacuation studies. Environ. Behav. 48, 991–1029 (2016). [Google Scholar]
- 3.Stephens N. M., Hamedani M. G., Markus H. R., Bergsieker H. B., Eloul L., Why did they “choose” to stay? Perspectives of Hurricane Katrina observers and survivors. Psychol. Sci. 20, 878–886 (2009). [DOI] [PubMed] [Google Scholar]
- 4.R. Limbaugh (2017); www.rushlimbaugh.com/daily/2017/09/05/my-analysis-of-the-hurricane-irma-panic/.
- 5.A. Coulter (2017); https://twitter.com/AnnCoulter/status/906876843667619840.
- 6.O. Darcy, in CNN (2017); https://money.cnn.com/2017/09/08/media/rush-limbaugh-evacuates-hurricane-irma/index.html.
- 7.A. Selk, in The Washington Post (2017); www.washingtonpost.com/news/to-your-health/wp/2017/09/06/rush-limbaughs-hurricane-survival-guide-stop-buying-water-and-dont-listen-to-the-news/?.
- 8.M. Snider, in USA Today (2017); www.usatoday.com/story/money/2017/09/12/rush-limbaugh-ann-coulter-facing-blowback-hurricane-irma-comments/654353001/.
- 9.Allcott H., Gentzkow M., Social media and fake news in the 2016 election. J. Econ. Perspect. 31, 211–236 (2017). [Google Scholar]
- 10.Kahan D. M., Peters E., Wittlin M., Slovic P., Ouellette L. L., Braman D., Mandel G., The polarizing impact of science literacy and numeracy on perceived climate change risks. Nat. Clim. Change 2, 732–735 (2012). [Google Scholar]
- 11.Pennycook G., Rand D. G., Fighting misinformation on social media using crowdsourced judgments of news source quality. Proc. Natl. Acad. Sci. U.S.A. 116, 2521–2526 (2019). [DOI] [PMC free article] [PubMed] [Google Scholar]
- 12.Chen M. K., Rohla R., The effect of partisanship and political advertising on close family ties. Science 360, 1020–1024 (2018). [DOI] [PubMed] [Google Scholar]
- 13.Drummond C., Fischhoff B., Individuals with greater science literacy and education have more polarized beliefs on controversial science topics. Proc. Natl. Acad. Sci. U.S.A. 114, 9587–9592 (2017). [DOI] [PMC free article] [PubMed] [Google Scholar]
- 14.Stenhouse N., Maibach E., Cobb S., Ban R., Bleistein A., Croft P., Bierly E., Seitter K., Rasmussen G., Leiserowitz A., Meteorologists’ views about global warming: A survey of American Meteorological Society professional members. Bull. Am. Meteorol. Soc. 95, 1029–1040 (2014). [Google Scholar]
- 15.Pew Research Center, The Politics of Climate (2016); www.pewresearch.org/science/2016/10/04/the-politics-of-climate/.
- 16.Morss R. E., Demuth J. L., Lazo J. K., Dickinson K., Lazrus H., Morrow B. H., Understanding public hurricane evacuation decisions and responses to forecast and warning messages. Wea. Forecasting 31, 395–417 (2016). [Google Scholar]
- 17.Lazo J. K., Bostrom A., Morss R. E., Demuth J. L., Lazrus H., Factors affecting hurricane evacuation intentions. Risk Anal. 35, 1837–1857 (2015). [DOI] [PubMed] [Google Scholar]
- 18.Malhotra N., Kuo A. G., Attributing blame: The public’s response to Hurricane Katrina. J. Polit. 70, 120–135 (2008). [Google Scholar]
- 19.Oster E., Unobservable selection and coefficient stability: Theory and evidence. J. Bus. Econ. Stat. 37, 187–204 (2019). [Google Scholar]
- 20.National Oceanic Atmospheric Administration (NOAA), FAQ: Why don’t we try to destroy tropical cyclones by nuking them? (2018); www.aoml.noaa.gov/hrd/tcfaq/C5c.html.
- 21.Federal Emergency Management Agency (FEMA), Hurricane Florence Rumor Control (2018); www.fema.gov/florence-rumors.
- 22.A. Ohlheiser, Sharks, dishwashers and guns: A running list of viral hoaxes about Hurricane Florence. The Washington Post (2018).
- 23.R. Limbaugh (2019); www.rushlimbaugh.com/daily/2019/09/03/hurricane-dorian/.
- 24.R. Limbaugh (2020); www.rushlimbaugh.com/daily/2020/02/24/overhyped-coronavirus-weaponized-against-trump/.
- 25.Patricola C. M., Wehner M. F., Anthropogenic influences on major tropical cyclone events. Nature 563, 339–346 (2018). [DOI] [PubMed] [Google Scholar]
- 26.Webster P. J., Holland G. J., Curry J. A., Chang H.-R., Changes in tropical cyclone number, duration, and intensity in a warming environment. Science 309, 1844–1846 (2005). [DOI] [PubMed] [Google Scholar]
- 27.National Hurricane Center (NHC), Data Archive (2019); www.nhc.noaa.gov/data/.
- 28.National Aeronautics Space Administration (NASA), Ocean Biology Processing Group: Distance to the Nearest Coast (2009); https://oceancolor.gsfc.nasa.gov/docs/distfromcoast/.
- 29.United States Geological Survey (USGS), The National Map - Data Delivery (2018); www.usgs.gov/core-science-systems/ngp/tnm-delivery/.
- 30.R. Rohla (2018); http://rynerohla.com/index.html/election-maps/2016-presidential-general-election-maps/.
- 31.Altonji J. G., Elder T. E., Taber C. R., Selection on observed and unobserved variables: Assessing the effectiveness of Catholic schools. J. Polit. Econ. 113, 151–184 (2005). [Google Scholar]
Associated Data
This section collects any data citations, data availability statements, or supplementary materials included in this article.
Supplementary Materials
Supplementary material for this article is available at http://advances.sciencemag.org/cgi/content/full/6/37/eabb7906/DC1


