

Abstract
Rationale and Objectives:
Pulmonary atelectasis presumably promotes and facilitates lung injury. However, data are limited on its direct and remote relation to inflammation. We aimed to assess regional 2-deoxy-2-[18F]-fluoro-D-glucose (18F-FDG) kinetics representative of inflammation in atelectatic and normally aerated regions in models of early lung injury.
Materials and Methods:
We studied supine sheep in four groups: Permissive Atelectasis (n=6)- 16h protective tidal volume (VT) and zero positive end-expiratory pressure; Mild (n=5) and Moderate Endotoxemia (n=6)- 20–24h protective ventilation and intravenous lipopolysaccharide (Mild=2.5 and Moderate=10.0 ng/kg/min), and Surfactant Depletion (n=6)- saline lung lavage and 4h high VT. Measurements performed immediately after anesthesia induction served as controls (n=8). Atelectasis was defined as regions of gas fraction<0.1 in transmission or computed tomography scans. 18F-FDG kinetics measured with positron emission tomography were analyzed with a three-compartment model.
Results:
18F-FDG net uptake rate in atelectatic tissue was larger during Moderate Endotoxemia (0.0092±0.0019/min) than controls (0.0051±0.0014/min, P=0.01). 18F-FDG phosphorylation rate in atelectatic tissue was larger in both endotoxemia groups (0.0287±0.0075/min) than controls (0.0198±0.0039/min, P=0.05) while the 18F-FDG volume of distribution was not significantly different among groups. Additionally, normally aerated regions showed larger 18F-FDG uptake during Permissive Atelectasis (0.0031±0.0005/min, P<0.01), Mild (0.0028±0.0006/min, P=0.04), and Moderate Endotoxemia (0.0039±0.0005/min, P<0.01) than controls (0.0020±0.0003/min).
Conclusion:
Atelectatic regions present increased metabolic activation during moderate endotoxemia mostly due to increased 18F-FDG phosphorylation, indicative of increased cellular metabolic activation. Increased 18F-FDG uptake in normally aerated regions during permissive atelectasis suggests an injurious remote effect of atelectasis even with protective tidal volumes.
Keywords: atelectasis, acute lung injury, endotoxin, 18F-FDG PET, mechanical ventilation
INTRODUCTION
Atelectasis is usually defined as “incomplete air filling and underexpansion of pulmonary tissue” (1). It is often observed in dependent lung regions of the large number of mechanically ventilated surgical (2) and critically ill patients, particularly those with the acute respiratory distress syndrome (ARDS) (3). As atelectasis contributes to systemic hypoxemia and presumably infectious risks, its presence has been associated with increased morbidity and mortality (4,5). Additionally, atelectasis results in redistribution of ventilation to aerated regions so that large areas with atelectasis can increase the regional tidal expansion in aerated regions with increased risk of lung injury (6,7). Accordingly, atelectasis could be an important additional factor for acute lung injury in those patients, as they are exposed to mechanical ventilation with risk for ventilation induced lung injury, as well as to the pulmonary effects of systemic inflammatory responses triggered by surgery or other disease conditions.
Experimental studies have reported conflicting results on inflammatory changes associated with acute atelectasis. Observations favoring increased inflammation with atelectasis reported alveolar macrophage activation with cytokine release (8); neutrophil activation and infiltration either in the atelectatic or the peri-atelectatic regions due to local hypoxia (9,10); and increased susceptibility to pneumonia due to the lack of the anti-bactericidal and anti-inflammatory effects of surfactant when atelectasis is produced by surfactant depletion (11). In line with these findings, open lung ventilation has been associated with attenuation of bactericidal growth and translocation in experimental pneumonia (12). However, others documented reduced inflammatory activity with depression of phagocytic activity in alveolar macrophages from tissue atelectatic for 24h (13). The additional association of atelectasis with a 10-fold decrease in regional lung perfusion and corresponding load of inflammatory cells could further reduce inflammation in atelectatic tissue (14). Accordingly, factors contributing to increased and reduced regional metabolic activity of lung tissue are present as atelectasis progresses. While presumably a key factor in the early stages of lung injury, it is currently unknown what is the net effect of those reported changes on regional inflammation in atelectatic tissue. In addition, increases of regional inflammation in normally aerated reigons have been previously suggested in progressively derecruited lungs (6). Yet, it is currently unknown whether and by how much inflammatory activity progress in such normally aerated regions as compared to unaffected normally aerated lung regions.
Plain chest X-ray or computed tomography (CT) are current methods to assess atelectasis. However, these methods are unable to quantify inflammatory activity. Positron emission tomography (PET) imaging with 2-deoxy-2-[18F]-fluoro-D-glucose (18F-FDG) has been used to quantify inflammation in the setting of experimental (15–17) and clinical lung injury (18–20), and specifically early acute lung injury (6,21–23). A previous study indicated a positive relationship between the density of collapsed lung and the intensity of 18F-FDG uptake in lungs with tumors. It also showed higher 18F-FDG uptake in atelectatic than in normal lung, yet generally lower than in tumor tissue (24). This study did not account for the effect of local density on local increases in 18F-FDG uptake. Consequently, the study could not indicate whether local increased 18F-FDG uptake was merely due to lung collapse, i.e., more tissue in the region of interest (ROI), or true increased metabolic activity in the examined tissue potentially related to inflammation. Furthermore, previous studies have not addressed either the potential components contributing to inflammation in atelectatic regions. In contrast to the common clinical measure of standardized uptake value (SUV), modeling 18F-FDG kinetics allows for the partitioning of regional 18F-FDG uptake into the contribution from phosphorylation rates (k3), i.e., metabolic activity of individual cells (25), and the volume of 18F-FDG tissue distribution (Fe), related to increased numbers of inflammatory cells (26). It is currently unknown how these parameters change in atelectatic lung regions in the early stages of different types of acute lung injury.
Considering the conflicting data on the inflammatory changes due to atelectasis and the ability of obtaining in vivo information with 18F-FDG PET imaging, we implemented this study to quantify the changes of 18F-FDG kinetics in atelectatic regions among different acute lung injury models and to compare those with changes occurring in normally aerated regions. The aims of the current work are to: 1) quantitatively compare 18F-FDG uptake rate and measures of pulmonary 18F-FDG kinetics in atelectatic regions of experimental acute lung injury models due to mild and moderate endotoxemia, permissive atelectasis with protective tidal volume mechanical ventilation, and surfactant depletion with lung lavage; 2) contrast the measurements in atelectatic regions with those present in normally aerated regions in the same lungs; and 3) determine if changes based on dynamic 18F-FDG can be approximated by those from SUV based measurements.
MATERIALS AND METHODS
Experiments were in accordance with Guide for the Care and Use of Laboratory Animals published by National Institutes of Health (publ. no. 86–23, revised 1996).
Animals
Twenty-three sheep (20.6±3.6 kg), aged 3–4 months, were anesthetized and intubated in supine position. Animals were sedated with intramuscular ketamine (3–8 mg/kg) and midazolam (1 mg/kg), and general anesthesia was induced with intravenous propofol (1–2 mg/kg); and maintained with the continuous infusion of ketamine and propofol, and boluses of fentanyl (1–2 μg/kg) titrated to heart rate and blood pressure. Muscular relaxation was achieved by intravenous pancuronium (0.1 mg/kg for induction and 0.02–0.04 mg/kg for maintenance) or rocuronium (1–2 mg/kg for induction and 0.2–0.5 mg/kg maintenance). Femoral and pulmonary artery catheters were placed with strict aseptic techniques for monitoring and blood sampling.
Ventilation
Four acute lung injury models were studied in supine sheep receiving volume controlled ventilation (Table 1): (1) Permissive Atelectasis (n=6), (2) Mild Endotoxemia (n=5), (3) Moderate Endotoxemia (n=6), and (4) Surfactant Depletion (n=6). Animals in the first three groups received a single lumen endotracheal tube for mechanical ventilation. In the Surfactant Depletion group, a left-sided double lumen endobronchial tube was placed through a tracheotomy and used for lung surfactant depletion by alveolar saline lavage. Warm saline (~400mL) was instilled into the left bronchus (airway pressure, ~30 cmH2O) for initially supine sheep, followed by draining to gravity. After three aliquots, animals were turned prone for additional three aliquots. Ventilation was resumed and continued.
TABLE 1.
Mechanical ventilation settings for studied acute lung injury models
| Variables | Permissive Atelectasis | Mild Endotoxemia | Moderate Endotoxemia | Surfactant Depletion |
|---|---|---|---|---|
| VT, mL/kg | 8 | 6–9 | 6–9 | adjusted to ΔP=20 cmH2O |
| FIO2, % | 30% adjusted to SpO2 > 90% | per ARDSNet Lower PEEP/Higher FIO2 Protocol | per ARDSNet Lower PEEP/Higher FIO2 Protocol | 60% adjusted to SpO2 > 90% |
| PEEP, cm H2O | 0 | 10 | ||
| RR, min−1 | adjusted to normocapnia | adjusted to normocapnia | ||
| I : E | 1 : 2 | 1 : 2 | 1 : 2 | 1 : 2 |
| Length of mechanical ventilation, hour | 16 | 24 | 20 | 4 |
Variables are expressed. VT=tidal volume; FIO2=inspired fraction of oxygen; PEEP=positive end-expiratory pressure; RR=respiratory rate; I:E=Inspiratory:Expiratory ratio; SpO2=peripheral capillary oxygen saturation; ARDSNet=Acute Respiratory Distress Syndrome Network; ΔP=driving pressure.
Induction of endotoxemia
A continuous intravenous infusion of endotoxin (Escherichia coli O55:B5; List Biologic Laboratories Inc., USA) was started after collection of baseline images and physiological data in the Mild (2.5 ng/kg/min) and Moderate (10 ng/kg/min) Endotoxemia groups and maintained throughout the experiment. For stable hemodynamics with continuous systemic inflammation, we followed an algorithm to adjust blood pressure by providing lactate Ringer solution boluses and/or reducing the endotoxin infusion rate (23).
Imaging
A PET scanner (Scanditronix PC4096, General Electric, USA) was used for the Permissive Atelectasis, Moderate Endotoxemia, and Surfactant Depletion groups, and a PET-CT scanner (Photo Diagnostic Systems, Inc., USA) for the Mild Endotoxemia group. Animals were positioned with the most caudal slice of the field of view adjacent to the diaphragm dome. Final positioning was determined after recruiting lungs with airway pressure of 40 cmH2O for 30 seconds. No additional recruitment maneuvers were performed. Baseline images were obtained at the beginning of experiments except for the Surfactant Depletion group and used as controls.
For the Permissive Atelectasis, Moderate Endotoxemia, and Surfactant Depletion groups, PET images consisted of an interpolated matrix of 128×128×15 voxels of 2.0×2.0×6.5 mm3 each. For these three groups, a 9.7 cm long field of view was previously estimated as representing approximately 70% of total lung volume (27). For the Mild Endotoxemia group, PET images consisted of an interpolated matrix of 128×128×92 voxels of 2.0×2.0×2.3 mm3 each (21.2 cm long field of view). In this last group, the higher resolution CT images were resampled in PET resolution before determining the ROIs.
For all groups except the Surfactant Depletion group, PET or PET-CT scans were acquired at the beginning and end of experiment for:
1) attenuation correction, gas fraction calculation, and delineation of ROIs - In the Permissive Atelectasis, Moderate Endotoxemia, and Surfactant Depletion groups, transmission scans (68Ge) were acquired for 10 minutes and the fraction of gas (Fgas) was determined from voxel tissue density (Fgas=1–regional tissue density) (28). For the Mild Endotoxemia group, CT scans were acquired during two minutes of tidal breathing and Fgas was calculated as voxel Hounsfield units (HU)/−1000 (3).
2) computation of pulmonary 18F-FDG kinetics parameters - 18F-FDG dissolved in 8 mL saline was injected (dose ~40 MBq at the beginning and 75–190 MBq at the end of experiments) in the jugular vein catheter. The scanning protocol was implemented in the following manner: starting at the beginning of 18F-FDG infusion, sequential PET frames spaced by 10–600 seconds were acquired for 75–90 minutes (6,21–23). Pulmonary arterial blood was sampled at 5.5, 9.5, 25.0, 37.0, and 42.5 minutes for measuring plasma activity in a well counter for calibration of the image derived input function (29).
Image analysis
Regional 18F-FDG kinetic parameters were fit to a three-compartment model, consisting of an intravascular, a tissue, and a metabolized compartment (25,30). The tissue compartment represents the 18F-FDG available for phosphorylation as a substrate for hexokinase. The metabolized compartment accounts for the 18F-FDG already phosphorylated by hexokinase. In this analysis, 18F-FDG net uptake rate (Ki), a measure of cellular metabolic activity, is computed as Ki=Fe·k3. Fe is the fractional volume of 18F-FDG distributed in the tissue and not phosphorylated and k3 is the rate of 18F-FDG phosphorylation, proportional to hexokinase activity. The model also allows for the estimation of the regional blood volume fraction (Fb). Considering the difference in tissue density between atelectatic and normally aerated regions, tissue normalized Ki (Kis=Ki/(1-Fgas-Fb)) and Fe (Fes= Fe/(1-Fgas-Fb)) were also estimated.
Voxel selection
Whole lung masks were created by using a gas fraction threshold for aerated regions from transmission or CT scans and manual delineation of atelectatic regions from CT scans for the Mild Endotoxemia group or nitrogen-13 tracer perfusion scans for the other groups (18). Main bronchi and large pulmonary vessels were also manually excluded. After whole lung delineation, atelectatic regions were defined as interconnected voxels with Fgas<0.1 presenting a continuous volume ≥1mL with at least 3 voxels within each slice. Normally aerated regions were defined as contiguous voxels with 0.5≤Fgas<0.7 and the same criteria of continuous volume ≥1mL with at least 3 voxels within each slice. We defined this range of gas fractions as normal aeration instead of the usual 0.5–0.9 because previous studies indicated that the higher ranges of normal could be associated with increased 18F-FDG uptake rate (6).
Steady state activity as an approximation for kinetics parameters
In clinical practice, 18F-FDG-PET scans are acquired as a single late image rather than a dynamic PET scan. In this case, semi-quantitative analysis commonly uses the standardized uptake value (SUV) computed as SUV=tissue 18F-FDG activity (kBq/mL)·body weight (kg)/injected 18F-FDG dose (kBq). In contrast, 18F-FDG kinetic parameters as used in this work require dynamic PET imaging and intermittent blood sampling for the tracer input function. In order to assess whether static measurements could be used as an estimate for dynamic measurements in the study of atelectatic and normally aerated regions, we compared the ratios of SUV in atelectatic (SUVAT) and normally aerated (SUVAE) regions with the corresponding ratios of 18F-FDG kinetic parameters (Ki, k3, and Fe).
Statistical analysis
Data are shown as mean±SD. Global cardiopulmonary variables and lung mass were compared among models with one-way ANOVA. 18F-FDG kinetic parameters were compared among groups and aeration conditions (atelectatic and normally aerated) with two-way ANOVA (R® version 3.5.2 for Mac). Post-hoc multiple comparisons among lung injury groups used Tukey test. Comparison between ratios of SUV and 18F-FDG kinetics parameters was performed with Pearson correlation and Bland-Altman plots (PRISM® version 7.00, GraphPad Software, CA, USA) (22). All statistical tests were two tailed and significance was set at P<0.05.
RESULTS
Global physiological variables
Mean PaO2/FIO2 ratios were consistent with mild or moderate ARDS in all studied lung injury groups (Table 2). Dynamic lung compliance was lower in all lung injury groups than in controls except for the Surfactant Depletion group. The Moderate Endotoxemia and Surfactant Depletion groups had significantly higher pulmonary vascular resistance than controls (Table 2). Mixed venous partial pressures of oxygen (PmvO2) did not differ among groups. Pulmonary capillary wedge pressure (PCWP) and PaO2/FIO2 were lowest in the Permissive Atelectasis group.
TABLE 2.
Global physiological changes in early acute lung injury models
| Variables | Controls | Permissive Atelectasis | Mild Endotoxemia | Moderate Endotoxemia | Surfactant Depletion |
|---|---|---|---|---|---|
| FIO2, % | 33 ± 5 | 51 ± 24 | 38 ± 5 | 80 ± 0 *** | 60 ± 11 *** |
| VT, mL/kg | 8.5 ± 2.0 | 8.8 ± 0.7 | 8.0 ± 1.2 | 7.0 ± 1.0 | 16.7 ± 4.8 *** |
| PEEP, cm H2O | 4 ± 2 | 0 ± 0 ** | 5 ± 0 | 10 ± 3 *** | 11 ± 3 *** |
| Ppeak, cm H2O | 16.4 ± 2.4 | 26.3 ± 8 ** | 20.8 ± 1.3 | 28.2 ± 6.2 ** | 33.7 ± 3.5 *** |
| Pmean, cm H2O | 7.3 ± 2.0 | 5.8 ± 2.1 | 8.6 ± 0.5 | 14.1 ± 3.4 *** | 18.4 ± 3.8 *** |
| Cdyn, mL/kg/cm H2O | 0.70 ± 0.18 | 0.36 ± 0.09 *** | 0.51 ± 0.11 | 0.42 ± 0.14 ** | 0.72 ± 0.11 |
| RR, min−1 | 30 ± 4 | 24 ± 3 * | 33 ± 4 | 34 ± 4 | 23 ± 4 * |
| CI, L/min/m2 | 9.3 ± 2.6 | 7.6 ± 1.1 | 9.6 ± 2.5 | 5.9 ± 2.1 * | 4.7 ± 0.6 * |
| PCWP, mmHg | 7.6 ± 3.9 | 2.5 ± 1.4 * | 10.4 ± 1.3 | 4.0 ± 2.8 | 9.0 ± 2.5 |
| PVR, Wood units | 1.5 ± 0.3 | 3.4 ± 2 | 2.1 ± 0.3 | 3.4 ± 1.2 * | 4.6 ± 1.1 ** |
| Arterial pH | 7.39 ± 0.07 | 7.30 ± 0.10 | 7.30 ± 0.03 | 7.30 ± 0.09 | 7.27 ± 0.06 |
| PaO2, mmHg | 94.2 ± 14.3 | 66.0 ± 11 | 80.9 ± 12.2 | 91.2 ± 20.9 | 125.5 ± 92.6 |
| Arterial Hb, g/dL | 9.4 ± 1.5 | 10.9 ± 1.6 | 8.9 ± 0.3 | 11.3 ± 1.2 | 9.8 ± 1.5 |
| mv pH | 7.37 ± 0.07 | 7.29 ± 0.10 | 7.26 ± 0.03 | 7.26 ± 0.08 | 7.25 ± 0.04 * |
| PmvO2, mmHg | 49.3 ± 6.8 | 46.3 ± 6.4 | 54 ± 11.2 | 52.5 ± 11.8 | 51.8 ± 10.2 |
| mv Hb, g/dL | 9.8 ± 1.5 | 10.1 ± 1.4 | 8.9 ± 0.7 | 11.3 ± 1.2 | 9.6 ± 1.4 |
| PaO2/FIO2, mmHg | 293 ± 54 | 142 ± 68 * | 214 ± 30 | 169 ± 78 | 201 ± 123 |
Variables are expressed as mean ± SD. FIO2=inspired fraction of oxygen; VT=tidal volume; PEEP=positive end-expiratory pressure; Ppeak=peak inspiratory pressure; Pmean=mean airway pressure; Cdyn=dynamic compliance [Cdyn=VT/Ppeak-PEEP]; RR=respiratory rate; CI=cardiac index [CI=CO/BSA; BSA=0.09·BW0.67; CO=cardiac output; BSA=body surface area (m2); BW=body weight (kg)]†; PCWP=pulmonary capillary wedge pressure; PVR=pulmonary vascular resistance; PaO2=arterial partial pressure of oxygen; Hb=hemoglobin; mv=mixed venous; PmvO2=mixed venous partial pressure of oxygen; PaO2/FIO2=ratio between arterial partial pressure of oxygen and fraction of inspired oxygen.
P<0.05;
P<0.01;
P<0.001 (vs. control).
J. W. Bennett: Regional body surface area of sheep. J Agric Sci 1973; 81: 429–432.
Image analysis of lung density and 18F-FDG activity
Atelectatic regions in transmission and CT scans, i.e., regions with Fgas=0–0.1, were predominantly dependent in all injury groups (Fig. 1A and 1B). These regions co-registered with relative high magnitude of 18F-FDG activity in the PET images (Fig. 1A). The mass of atelectatic regions used in all animals for the analysis corresponded to 18.7±14.1% of the total lung mass, while the mass of analyzed normally aerated regions (Fgas=0.5–0.7) represented 23.3±9.9% of the total lung mass (Table 3). The mass fraction of atelectatic regions in the Moderate Endotoxemia group was lowest among injury groups (13.0±8.8%, Table 3) consistent with the high PEEP values used in that group (Table 2).
Figure 1. Transverse sections of atelectatic regions in early acute lung injury models.

(A) Transmission scan section (left) depicting a dorsal region delineated in green of minimum to no gas fraction (Fgas) consistent with atelectasis in a mechanically ventilated sheep. This atelectatic region coregistered high 18F-FDG uptake (right), indicating high metabolic activity. (B) Atelectatic regions of representative cross sections for each studied group delineated in green. Images were either positron emission tomography transmission scans (Permissive Atelectasis, Moderate Endotoxemia, and Surfactant Depletion) or computed tomography scans (Controls and Mild Endotoxemia).
TABLE 3.
Atelectatic and normally aerated lung mass as a fraction of total lung mass in early acute lung injury models
| Controls | Permissive Atelectasis | Mild Endotoxemia | Moderate Endotoxemia | Surfactant Depletion | All Injuries | |
|---|---|---|---|---|---|---|
| Atelectatic Mass, % | 6.5 ± 5.6 | 24.3 ± 13.7 | 31.5 ± 4.2 *** | 13.0 ± 8.8 | 24.6 ± 18.6 * | 18.7 ± 14.1 *** |
| Normally Aerated Mass, % | 32.4 ± 7.9 | 17.8 ± 8.6 * | 15.4 ± 1.6 ** | 24.3 ± 6.6 | 22.4 ± 12.3 | 23.3 ± 0.0 *** |
Variables are expressed as mean±SD.
P<0.05;
P<0.01;
P<0.001 (vs. control).
Atelectatic lung regions
The pulmonary kinetics of intravenous 18F-FDG differed particularly between controls and both endotoxemia groups (Fig. 2A vs. 2B). During control conditions (Fig. 2A), i.e., immediately following the development of atelectasis in an otherwise normal lung, the kinetics of intravenous 18F-FDG in atelectatic regions showed an early peak of activity followed by a continuous and initially rapid decrease (black, Fig. 2). This was consistent with the bolus injection of tracer with an early peak in plasma activity (blue, Fig. 2). The experimental activity-time curve was well matched to the three-compartment estimation (red, Fig. 2). The compartmental analysis indicated the early increase of tracer in the tissue compartment immediately available for phosphorylation (yellow, Fig. 2), which followed the early peak in plasma activity. As 18F-FDG was metabolized, activity in the metabolized compartment increased (pink, Fig. 2), indicative of 18F-FDG phosphorylated by hexokinase and retained within lung parenchyma.
Figure 2. 18F-FDG kinetics of atelectatic regions of normal (A) and endotoxemic (B) lungs.
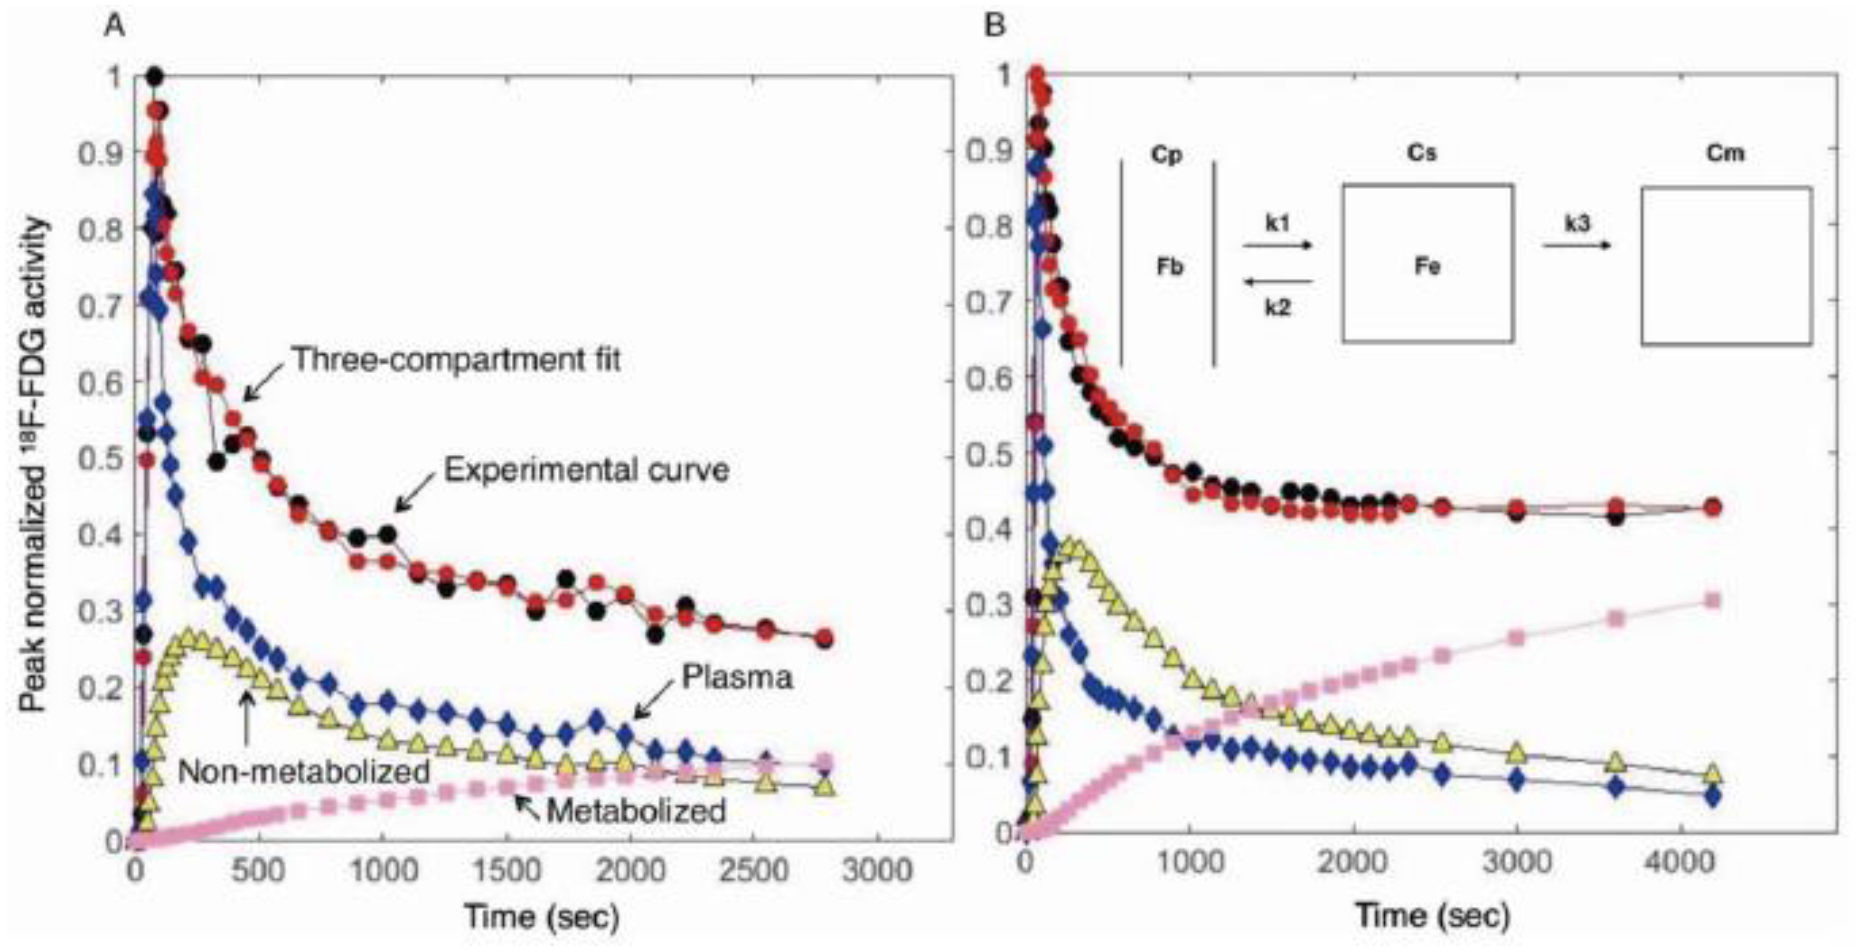
18F-FDG activity-time curves were measured by dynamic PET acquisition. (A) In normal lungs, an early peak of 18F-FDG activity in atelectatic regions (black) was followed by a continuous decrease, never reaching a plateau during the initial 45 minutes of 18F-FDG acquisition. The experimental activity-time curve (black) was well matched to the three-compartment estimate (red). The kinetic model showed that 18F-FDG was rapidly transported from plasma (blue) to tissue compartment (yellow), with lower rates of tracer transport from tissue to plasma and into the 18F-FDG metabolized compartment (pink). Activity in the metabolized compartment (pink) represents 18F-FDG phosphorylation. (B) After 20–24h of endotoxin exposure, the 18F-FDG activity curve in atelectatic regions reached a plateau at the ~25 minutes of 18F-FDG acquisition after the early peak (black), suggestive of higher tracer uptake in endotoxemic than in normal lungs. This was confirmed by the increased tracer activity in the metabolized compartment (pink), which reached values three times larger (30%) than those present in normal lungs (11%). Cp=plasma compartment, Cs=tissue compartment, Cm=metabolized compartment, Fb=fraction of blood volume, Fe=fraction of extravascular volume, k1=transport rate from plasma to tissue, k2=transport rate from tissue to plasma, k3=phosphorylation rate.
In contrast to such observations for the control atelectatic conditions, 18F-FDG activity-time curves of atelectatic regions exposed to endotoxin for 20–24h reached a plateau following the initial decrease of the early peak activity (Fig. 2B), suggestive of larger tracer uptake in lung parenchyma than in control conditions. This was confirmed by the early increased tracer activity in the metabolized compartment, which reached larger values during endotoxemia (30%, pink, Fig. 2B) than during control conditions (11%, pink, Fig. 2A). In control conditions, the peak tracer activity in the non-metabolized substrate compartment (yellow, Fig. 2A) was larger than the maximum activity in the metabolized compartment (pink, Fig. 2A). Instead, following exposure to a moderate endotoxin dose, those maximum activity levels in the metabolized compartment (pink, Fig. 2B) were comparable to peak values in the substrate compartment (yellow, Fig. 2B).
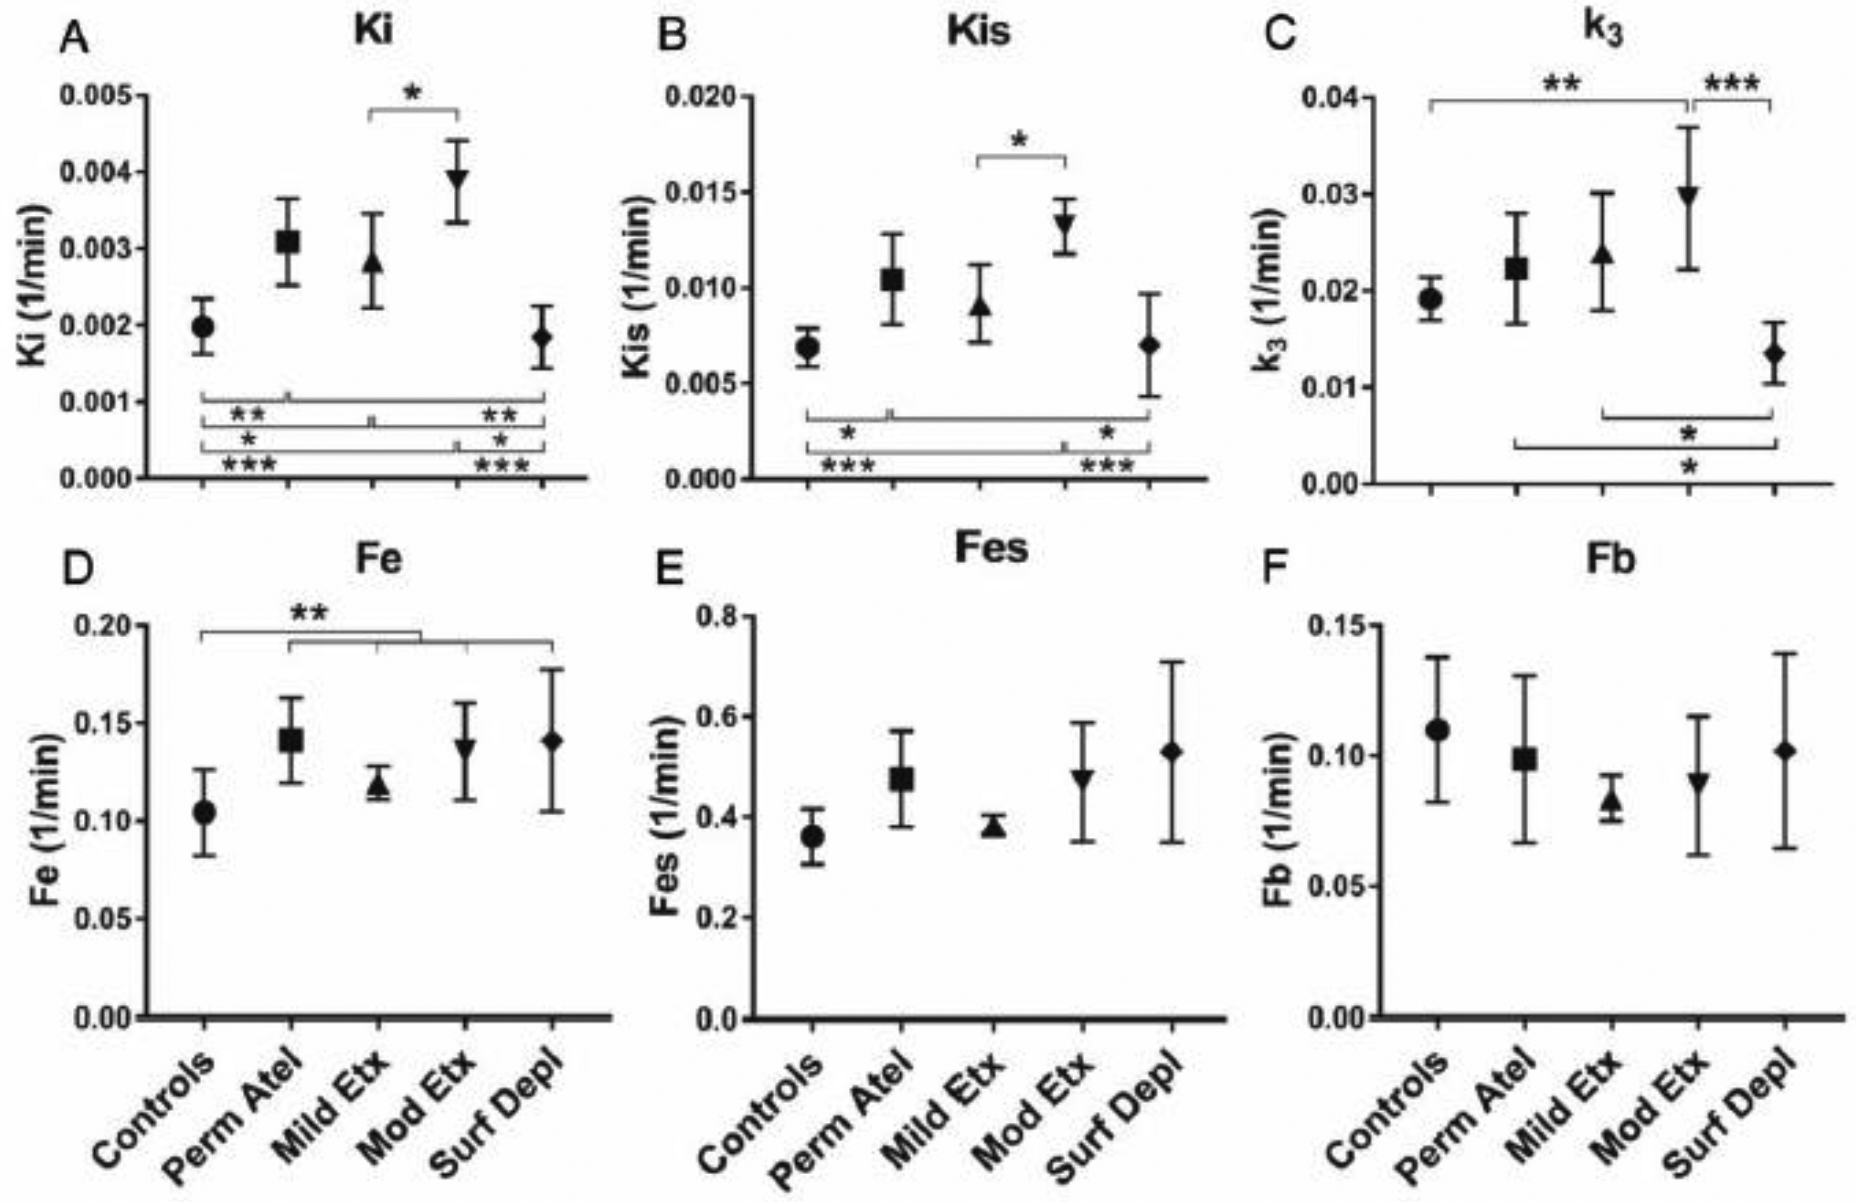
The net uptake rate of 18F-FDG (Ki) in atelectatic lung was 81% larger in moderately endotoxemic animals than in controls (Fig. 3A). Whereas the mean Ki in the Permissive Atelectasis and Mild Endotoxemia groups showed numeric increases, these did not reach significance compared to controls (Fig. 3A). As expected, a similar pattern was observed when Ki was normalized by tissue density (Kis=Ki/(1-Fgas-Fb), Fig. 3B), with Kis in moderately endotoxemic animals 74% larger than in controls.
Figure 3. 18F-FDG kinetic parameters in atelectatic regions of early acute lung injury models.

(A) The net uptake rate of 18F-FDG (Ki) was highest in the Moderate Endotoxemia group. (B) Ki normalized by tissue density (Kis=Ki/(1-Fgas-Fb)) was highest also in the Moderate Endotoxemia group. (C) The phosphorylation rate (k3) in both endotoxemia groups was significantly higher than in controls. (D) No distinction was observed among the groups for the volume of 18F-FDG distribution in tissue (Fe). (E) Fe normalized by tissue density (Fes) was highest in the Surfactant Depletion group, showing higher values than in the Mild Endotoxemia group. (F) The fraction of blood volume (Fb) showed non-significant variation throughout groups. Perm Atel=Permissive Atelectasis, Mild Etx=Mild Endotoxemia, Mod Etx=Moderate Endotoxemia, Surf Depl=Surfactant Depletion. * P<0.05; ** P<0.01; *** P<0.001.
To examine the determinants of these changes in 18F-FDG uptake, we quantified the components of Ki (=k3·Fe). The phosphorylation rate (k3) was 45% higher in both endotoxemia groups when compared to controls (p=0.033, Fig. 3C). Instead, no distinction was observed among the groups for the volume of 18F-FDG tissue distribution (Fe) (Fig. 3D). The distribution volume normalized by tissue density (Fes) of atelectatic regions in the Surfactant Depletion group showed higher Fes values than controls and mildly endotoxemic sheep (Fig. 3E). The fraction of blood volume (Fb) in atelectatic regions showed non-significant variation throughout groups (Fig. 3F).
Normally aerated regions
Ki in normally aerated lung was 56% larger in the Permissive Atelectasis group and 43% larger in the Mild Endotoxemia group than in controls (Fig. 4A). Ki in moderately endotoxemic sheep was highest (95% larger than in controls) among groups, including being 36% larger than in mildly endotoxemic sheep (Fig. 4A). Changes in Kis showed a pattern comparable to Ki with the largest values in the Moderate Endotoxemia group, 92% larger than in controls and 44% larger than in the Mild Endotoxemia group (Fig. 4B). Normally aerated regions during permissive atelectasis also showed larger Kis than in controls (Fig. 4B). Ki and Kis in the Surfactant Depletion group was smaller than those in other injury groups.
Figure 4. 18F-FDG kinetic parameters in normally aerated regions of early acute lung injury models.
(A) The net uptake rate of 18F-FDG (Ki) in the Moderate Endotoxemia group was highest among groups, significantly larger than the Mild Endotoxemia group. (B) Changes in tissue normalized Ki (Kis) were similar to those in Ki. (C) 18F-FDG phosphorylation rate (k3) in the Moderate Endotoxemia group was also highest among groups. The Surfactant Depletion group showed the smallest k3. (D) The volume of 18F-FDG distribution in tissue (Fe) in all lung injury groups combined was higher than in controls. (E, F) The tissue normalized Fe (Fes) and the fraction of blood volume (Fb) were not different among groups. Perm Atel=Permissive Atelectasis, Mild Etx=Mild Endotoxemia, Mod Etx=Moderate Endotoxemia, Surf Depl=Surfactant Depletion. * P<0.05; ** P<0.01; *** P<0.001.
18F-FDG phosphorylation rate (k3) in the Moderate Endotoxemia group was 54% larger than in controls (Fig. 4C). The k3 in Permissive Atelectasis and Mild Endotoxemia groups were numerically higher but not statistically different from controls. The Surfactant Depletion group showed the smallest k3 (Fig. 4C). Fe was higher in all injurious groups combined as compared to controls (p=0.008, Fig. 4D) with the average increase of 29%. Fb did not show any significant differences among groups (Fig. 4E, 4F).
Atelectatic vs. normally aerated regions
When parameters of the 18F-FDG kinetics were compared between atelectatic and normally aerated conditions, Ki, Fb, and Fe were significantly higher in atelectatic than in normally aerated regions for all groups (Suppl Fig. 1). In contrast, k3 and tissue normalized parameters (Kis and Fes) were not significantly different between atelectatic and normally aerated regions, except for larger Fes in normally aerated regions of Controls, Permissive Atelectasis, and Mild Endotoxemia groups (Suppl Fig. 1).
Static vs. dynamic PET imaging
The ratio of Ki in atelectatic to normally aerated regions was correlated with the ratio of SUV between the equivalent regions (Fig. 5A). The mean difference between those ratios was 0.05±0.53, with 94% of animals having a difference in the ratio between the limits of agreement on the Bland-Altman plot (Fig. 5B).
Figure 5. Bland-Altman and regression analyses between 18F-FDG mean standard uptake values (SUV) and tracer kinetic parameters.

(A) The ratio of 18F-FDG net uptake rate (Ki) in atelectatic to aerated regions was correlated with the ratio of SUV between the equivalent regions. (B) The mean difference between those ratios was 0.05±0.53, with 94% of animals having a difference in the ratio within the limits of agreement. (C) The correlation between the ratios of phosphorylation rate (k3) in atelectatic to aerated regions and the equivalent ratio of SUV was lower than that for Ki and the mean difference of ratios was equal to −1.38±0.59. (D) The correlations between the ratio of 18F-FDG tissue distribution fraction (Fe) in atelectatic to aerated regions and the equivalent ratio of SUV was lower than that for Ki and the mean difference of ratios was equal to −0.08±0.75. SUV=tissue 18F-FDG activity (kBq/mL)·body weight (kg)/injected 18F-FDG dose (kBq), AT=atelectatic regions, AE=normally aerated regions.
When considering the components of the 18F-FDG uptake rate (Ki=k3·Fe), the correlations between the SUV ratio and the equivalent regional ratios of k3 and Fe were substantially lower than the corresponding correlation for Ki (Figs. 5C and 5D). The mean difference between SUV and k3 ratios was −1.38±0.59, and between SUV and Fe ratios −0.08±0.75.
DISCUSSION
The main results of this study on 18F-FDG kinetics in four different acute lung injury models are: 1) 18F-FDG uptake rate in atelectatic regions of lungs receiving protective ventilation and exposed to moderate systemic endotoxemia are nearly doubled as compared to immediate postintubation atelectasis (control). These changes are likely due predominantly to changes in cellular phosphorylation rate and secondarily to changes in the volume of distribution of 18F-FDG in tissue; 2) Normally aerated regions showed changes in 18F-FDG uptake rate equivalent to atelectatic regions. Additionally, normally aerated regions during permissive atelectasis and mild endotoxemia also presented larger 18F-FDG uptake rate than normally aerated lung tissue in control conditions; 3) the SUV ratio between atelectatic and normally aerated regions can be a simpler alternative method to estimate the equivalent ratio of Ki obtained from dynamic PET imaging.
In our study, the net uptake rate of 18F-FDG (Ki) in atelectatic regions following 20h of moderate systemic endotoxemia was 81% larger than that of control atelectatic regions. The results of atelectatic regions were reinforced by similar findings with comparisons of tissue normalized Ki (Kis), indicating that the results were not due to mere differences in tissue density. Such increase was present even though protective ventilation principles were used in this group. Endotoxin is known to activate a pulmonary cellular inflammatory response with neutrophilic infiltration and cytokine release from macrophages (31,32). Endotoxin can also lead to translocation of peripheral monocytes into lung tissue, further contributing to increased cellular pulmonary metabolism (33). Because a previous study suggested that the metabolic activity assessed through Ki in acute lung injury conditions is predominantly due to neutrophils and secondarily to macrophages and other resident parenchymal cells (34), we presume that our results indicate primarily the activation of neutrophilic inflammation in atelectatic lungs.
To explore the causes of the increased Ki, we studied its components, k3 and Fe (Ki= k3·Fe). The rate of 18F-FDG phosphorylation (k3) was higher in endotoxemia than in controls, indicating an increased cellular activation in atelectatic regions exposed to systemic endotoxemia. Instead, the tissue volume of 18F-FDG distribution (Fe) which has been associated, at least partially, with the number of inflammatory cells (22,35), was numerically but not significantly higher in those same atelectatic regions during moderate endotoxemia than in controls. This suggests that the observed increase in 18F-FDG uptake rate was predominantly associated with increased individual cellular activation and secondarily with a possible increase in the infiltration of inflammatory cells.
Previous studies indicated an increased activity of dependent lung regions during acute lung injury (23). However, those studies did not discriminate between non (Fgas=0–0.1) and poorly aerated (Fgas=0.1–0.5) regions. Accordingly, they could not specifically identify changes in the collapsed lung. In the present study, we demonstrate explicitly in atelectatic lung regions increased metabolic activity during acute lung injury compared to that observed in controls, i.e., in regions that had equivalent densities immediately after intubation at baseline. Moderate systemic endotoxemia clearly increases activity levels primarily due to increased cellular phosphorylation activity.
In normally aerated regions, 18F-FDG kinetics also showed distinctions in the different studied models of lung injury as compared to controls. Indeed, increased 18F-FDG uptake in normally aerated regions as compared to controls was not only observed during moderate endotoxemia but also in mild endotoxemia and permissive atelectasis. This finding was present for 18F-FDG uptake by itself (Ki) and when Ki was normalized to tissue (Kis). Such results suggest that not only atelectatic but also normally aerated lung is at risk for inflammation in those studied conditions, even when current protective ventilation principles are applied. The increased Ki and Kis with mild and moderate levels of systemic endotoxemia are also consistent with a dose-dependent local parenchymal metabolic response.
A previous study in a porcine model of severe ARDS ventilated with the ARDSNet protocol showed highest tissue normalized 18F-FDG uptake in nondependent and poorly aerated regions (36). Our results starting from initially normal lungs submitted to different clinically relevant conditions indicate that normally aerated regions of such initially normal lungs could also be at risk for inflammation. Yet, in contrast to the findings in that severe ARDS model, the magnitude of the ratio between the normalized 18F-FDG uptake (Kis) in normally aerated and atelectatic regions in our studied models (Permissive Atelectasis=1.21, Mild Endotoxemia=1.23, and Moderate Endotoxemia=1.11) was clearly smaller than that found in that study (=2.67) (36). Such results suggest that regional metabolic and inflammatory effects of protective ventilation along ~24h could be substantially different depending on the underlying initial lung conditions. Further studies will be required to define the regional characteristics of those effects.
We recently indicated that progressive lung collapse during constant tidal volume ventilation results in larger regional strains particularly in the upper aeration range of normally aerated lung (6). Thus, the increase of 18F-FDG uptake observed in normally aerated regions could have resulted from increased local strain in the studied aerated regions with the activation of parenchymal cells or the infiltration of inflammatory cells (34). This is consistent with a remote effect of atelectasis in injuring healthy lung tissue when heterogeneously expanded lungs of size comparable to that of humans are ventilated with protective tidal volumes but allowed to derecruit. Such findings are also in line with previous results in severely injured rat lungs (37). That inflammatory infiltrate would also be expected during mild endotoxemia, when endotoxin would be an additional factor for the infiltration and activation of neutrophil as well as of macrophages (34). As in atelectatic regions, increased Ki in normally aerated regions was predominantly due to the increase in k3 in all lung injury conditions except for surfactant depletion. This reinforced cellular metabolic activation as the most important mechanism of 18F-FDG uptake in normally aerated regions both in the presence and absence of systemic endotoxemia.
Tissue normalized variables (Kis and Fes) were similar in atelectatic and normally aerated regions. This emphasizes the importance of taking density into account when comparing 18F-FDG uptake of differently aerated lung regions to reduce the likelihood of results merely due to different degrees of lung expansion. A previous study quantified SUV in atelectatic regions of patients with lung tumor and reported a difference in 18F-FDG uptake in atelectatic versus normally aerated regions, and a positive correlation between the density of atelectatic regions and the degree of uptake (24). As presented in our results, while this effect of density on 18F-FDG uptake may be informative by itself, it should not lead to the interpretation that they necessarily represent differences in inflammation. Instead, equal degrees of metabolic activity could be present per unit of lung tissue. The use of density independent parameters would be necessary to specifically address metabolic changes per unit of lung tissue as presented here.
Differences of 18F-FDG kinetics parameters in differently aerated regions have been observed or suggested in previous studies when paired statistical analysis allowed increased power for such specific comparisons (23,38). The current study was not powered for such assessments. Appropriately powered clinical or animal investigations will be required to contrast 18F-FDG kinetics in atelectatic vs. normally aerated regions and differentiate the magnitudes of their local effects to the lung parenchyma. For clinical investigations, well-defined causes of acute lung injury should be studied separately, as different etiologies could result in different inflammatory patterns and degrees of 18F-FDG uptake and add to variability of results.
Also, as discussed above, besides the common exposure of atelectatic and aerated regions to circulating inflammatory mediators such as endotoxemia, different injurious mechanisms are likely present in those regions, even if the final 18F-FDG uptake is the same. Given that 18F-FDG uptake does not target a single inflammatory process as 18F-FDG uptake actually represents local glucose transport and metabolism, further studies will be required to determine those mechanistical distinctions. Both human and more immediately animal investigations could quantify in the atelectatic and aerated lung specific inflammatory processes and gene expression patterns, and relate them to corresponding measurements of pulmonary 18F-FDG kinetics (23,39). Of note, previous genomics studies in acute lung injury have indicated that gene expression heterogeneity in those different degrees of aeration can exist even if 18F-FDG uptake differences are not simultaneously present but have occurred at an earlier timepoint (17), implying that mechanisms producing local 18F-FDG uptake are not necessarily simultaneous with gene expression.
The short term (4h) surfactant depleted group showed features clearly distinct from those in the other lung injury groups. The volume of 18F-FDG distribution normalized by tissue was larger in atelectatic regions of surfactant depleted lung than in controls and in mild endotoxemia. In normally aerated regions, 18F-FDG uptake with and without tissue normalization was lower in surfactant depleted lungs than in most of the other lung injury conditions. This was related to lower phosphorylation rate, k3, as there was no difference among injury groups in the volumes of distribution in normally aerated regions. A previous study showed that surfactant depletion did not directly injure the alveolar epithelia (40). Yet, it increased metabolic activity in dependent lung regions (22). We presume our surfactant depletion method, i.e., saline lung lavage, could have led to the presence of residual alveolar saline in dependent atelectatic regions. Such regional residual saline could have produced a relative reduction of cell representation to total tissue density, i.e., a “dilutional” effect of cells in lung density, causing the observed reduction of k3.
SUV is frequently used as a semiquantitative and volumetric measurement of 18F-FDG uptake in the clinical setting to quantify tumor metabolic activity (33). SUV is based on a static image, being consequently easier to obtain than parameters derived from dynamic 18F-FDG. Dynamic acquisition can be more burdensome and impossible in small animal research imaging (42). Our results indicate that the ratio of SUV in normally aerated/atelectatic regions can be used as an alternative to the ratio of Ki in the same regions obtained from dynamic imaging. Such a finding supports the use of this simpler approach with less experimental and technical demand. Notably, differences in density should still be accounted for when interpreting this ratio. The poorer correlations for the individual ratios of the components of Ki, k3, and Fe, with the corresponding SUV ratios, indicate that those SUV ratios cannot be used as surrogates for the ratios of specific components of the 18F-FDG uptake. Dynamic measurements are still required to obtain further information on each of those components producing Ki changes.
Our study has limitations. The smaller size of masks in atelectatic regions, and the difficulty in discriminating lung tissue from neighboring chest wall, mediastinum, and pleural effusion could have caused inaccuracies. These could have led to the larger variability in results of atelectatic regions, limiting the power of the statistical analysis in this case. The PET-CT camera used in the Mild Endotoxemia group was different from that used in the other groups. While the spatial resolution of cameras differed, this is unlikely to have affected our results, given that our results were based on the analyses of ROIs with size significantly larger than that of each camera’s voxel. As 18F-FDG is not a cellular specific tracer, cells other than the neutrophil and macrophage could have contributed to the changes in 18F-FDG kinetics. Future studies will be required to identify cells contributing to regional metabolic activity. These could involve experimental studies determining the relationship among 18F-FDG kinetics, tissue cellular composition and corresponding glucose uptake, and also clinical studies exploring techniques providing cellular samples such as bronchoalveolar lavage to be related to regional 18F-FDG uptake (43).
CONCLUSIONS
Atelectatic regions in the early stages of lung injury due to systemic endotoxemia and mechanical ventilation show increased metabolic activation as compared to normal lung regions immediately after the development of atelectasis despite similar levels of tissue density. Accordingly, density is a poor marker of inflammation in the early stages of lung injury from different causes. Normally aerated regions show increased metabolic activation during permissive atelectasis, suggestive of remote deleterious effects of atelectasis. Graded increased activation in normally aerated lung is present during mild and moderate endotoxemia, consistent with a dose response effect. In all cases, increased phosphorylation rate, representative of cellular phosphorylation activity, was the predominant cause of increased 18F-FDG uptake. The ratio of SUV in atelectatic to normally aerated regions could be a simple alternative to the equivalent ratio of Ki dynamically acquired from 18F-FDG images.
Supplementary Material
ACKNOWLEDGEMENTS
The authors thank Steve Weise and Kira Grogg, Ph.D., Department of Radiology (Nuclear Medicine and Molecular Imaging), Massachusetts General Hospital, Boston, Massachusetts, for the expert technical support with positron emission tomographic imaging acquisition and reconstruction. The authors also thank Hidenobu Shigemitsu, M.D., FCCP, Department of Intensive Care Medicine, Tokyo Medical and Dental University, Tokyo, Japan, for review and critique on the manuscript.
Abbreviations
- 18F-FDG
2-deoxy-2-[(18)F] fluoro-D-glucose
- ARDS
acute respiratory distress syndrome
- Cdyn
dynamic compliance
- CI
cardiac index
- Cm
metabolized compartment
- Cp
plasma compartment
- Cs
tissue compartment
- CT
computed tomography
- Fb
18F-FDG volume fraction in blood
- Fe
18F-FDG volume fraction in extravascular regions (= in tissue)
- Fes
tissue normalized Fe
- Fgas
gas fraction
- FIO2
fraction of inspired oxygen
- Hb
hemoglobin
- HU
Hounsfield units
- I:E
inspiratory-to-expiratory ratio
- k1
18F-FDG transport rate from plasma to tissue
- k2
18F-FDG transport rate from tissue to plasma
- k3
18F-FDG phosphorylation rates
- Ki
18F-FDG net uptake rate
- Kis
tissue normalized Ki
- Mild Etx
Mild Endotoxemia
- Mod Etx
Moderate Endotoxemia
- mv
mixed venous
- SUV
standardized uptake value
- SUVAE
SUV in atelectatic regions
- SUVAT
SUV in normally aerated regions
- PaCO2
arterial carbon dioxide partial pressure
- PaO2
arterial partial pressure of oxygen
- PCWP
pulmonary capillary wedge pressure
- PEEP
positive end-expiratory pressure
- Perm Atel
Permissive Atelectasis
- PET
positron emission tomography
- Pmean
mean airway pressure
- PmvO2
mixed venous partial pressure of oxygen
- Ppeak
peak inspiratory pressure
- PVR
pulmonary vascular resistance
- ROI
region of interest
- RR
respiratory rate
- SpO2
arterial oxygen saturation
- Surf Depl
Surfactant Depletion
- VT
tidal volume
Footnotes
Publisher's Disclaimer: This is a PDF file of an unedited manuscript that has been accepted for publication. As a service to our customers we are providing this early version of the manuscript. The manuscript will undergo copyediting, typesetting, and review of the resulting proof before it is published in its final form. Please note that during the production process errors may be discovered which could affect the content, and all legal disclaimers that apply to the journal pertain.
Declarations of interest: none
REFERENCES
- 1.Marchiori D Clinical Imaging: With Skeletal, Chest, & Abdominal Pattern Differentials, Third edition St Louis: Elsevier Health Sciences; 2013; 1166–1169. [Google Scholar]
- 2.Brismar B, Hedenstierna G, Lundquist H, Strandberg A, Svensson L, Tokics L. Pulmonary densities during anesthesia with muscular relaxation - a proposal of atelectasis. Anesthesiology 1985;62:422–8. [DOI] [PubMed] [Google Scholar]
- 3.Pelosi P, Crotti S, Brazzi L, Gattinoni L. Computed tomography in adult respiratory distress syndrome: what has it taught us? European Respiratory Journal 1996;9:1055–62. doi: 10.1183/09031936.96.09051055. [DOI] [PubMed] [Google Scholar]
- 4.Magnusson L, Zemgulis V, Wicky S, Tyden H, Thelin S, Hedenstierna G. Atelectasis Is a Major Cause of Hypoxemia and Shunt after Cardiopulmonary Bypass. Anesthes 1997;87:1153–63. [DOI] [PubMed] [Google Scholar]
- 5.Passos AMB, Valente BCS, Machado MD, Borges MR, Paula SG, Geraldo L-F, et al. Effect of a Protective-Ventilation Strategy on Mortality in the Acute Respiratory Distress Syndrome. N Engl J Med 1998;338:347–54. doi: 10.1056/NEJM199802053380602. [DOI] [PubMed] [Google Scholar]
- 6.Motta-Ribeiro GC, Hashimoto S, Winkler T, Baron RM, Grogg K, Paula LFSC, et al. Deterioration of Regional Lung Strain and Inflammation during Early Lung Injury. American Journal of Respiratory and Critical Care Medicine 2018;198:891–902. doi: 10.1164/rccm.201710-2038OC. [DOI] [PMC free article] [PubMed] [Google Scholar]
- 7.Gattinoni L, Marini JJ, Pesenti A, Quintel M, Mancebo J, Brochard L. The “baby lung” became an adult. Intensive Care Medicine 2016;42:663–73. doi: 10.1007/s00134-015-4200-8. [DOI] [PubMed] [Google Scholar]
- 8.Kisala JM, Ayala A, Stephan RN, Chaudry IH. A model of pulmonary atelectasis in rats: activation of alveolar macrophage and cytokine release. American Journal of Physiology-Regulatory, Integrative and Comparative Physiology 1993;264:R610–4. doi: 10.1152/ajpregu.1993.264.3.R610. [DOI] [PubMed] [Google Scholar]
- 9.Minamiya Y, Saito H, Takahashi N, Kawai H, Ito M, Hosono Y, et al. Polymorphonuclear leukocytes are activated during atelectasis before lung reexpansion in rat. Shock 2008;30:81–6. doi: 10.1097/SHK.0b013e31815dd221. [DOI] [PubMed] [Google Scholar]
- 10.Retamal J, Bergamini BC, Carvalho AR, Bozza FA, Borzone G, Borges JB, et al. Non-lobar atelectasis generates inflammation and structural alveolar injury in the surrounding healthy tissue during mechanical ventilation. Crit Care 2014;18:505. doi: 10.1186/s13054-014-0505-1. [DOI] [PMC free article] [PubMed] [Google Scholar]
- 11.Goldman SL, Bosque E, McCann E, Lewis K. Pulmonary mechanics in premature infants one month after treatment with synthetic surfactant. The Journal of Pediatrics 1992;120:S25–8. doi: 10.1016/S0022-3476(05)81229-6. [DOI] [PubMed] [Google Scholar]
- 12.van Kaam AH, Lachmann RA, Herting E, De Jaegere A, van Iwaarden F, Noorduyn LA, et al. Reducing atelectasis attenuates bacterial growth and translocation in experimental pneumonia. Am J Respir Crit Care Med 2004;169:1046–53. doi: 10.1164/rccm.200312-1779OC. [DOI] [PubMed] [Google Scholar]
- 13.Shennib H, Mulder DS, Chiu RC. The effects of pulmonary atelectasis and reexpansion on lung cellular immune defenses. Arch Surg 1984;119:274–7. [DOI] [PubMed] [Google Scholar]
- 14.Enjeti S, O’Neill JT, Terry PB, Menkes HA, Traystman RJ. Sublobar atelectasis and regional pulmonary blood flow. J Appl Physiol Respir Environ Exerc Physiol 1979;47:1245–50. doi: 10.1152/jappl.1979.47.6.1245. [DOI] [PubMed] [Google Scholar]
- 15.Schuster DP, Kozlowski J, Hogue L. Imaging lung inflammation in a murine model of Pseudomonas infection: a positron emission tomography study. Exp Lung Res 2003;29:45–57. [DOI] [PubMed] [Google Scholar]
- 16.Rodrigues RS, Bozza FA, Hanrahan CJ, Wang L-M, Wu Q, Hoffman JM, et al. 18 F-fluoro-2-deoxyglucose PET informs neutrophil accumulation and activation in lipopolysaccharide-induced acute lung injury. Nuclear Medicine and Biology 2017;48:52–62. doi: 10.1016/j.nucmedbio.2017.01.005. [DOI] [PMC free article] [PubMed] [Google Scholar]
- 17.Locke LW, Williams MB, Fairchild KD, Zhong M, Kundu BK, Berr SS. FDG-PET Quantification of Lung Inflammation with Image-Derived Blood Input Function in Mice. International Journal of Molecular Imaging 2011;2011:1–6. doi: 10.1155/2011/356730. [DOI] [PMC free article] [PubMed] [Google Scholar]
- 18.Ichiya Y, Kuwabara Y, Sasaki M, Yoshida T, Akashi Y, Murayama S, et al. FDG-PET in infectious lesions: The detection and assessment of lesion activity. Annals of Nuclear Medicine 1996;10:185–91. doi: 10.1007/BF03165391. [DOI] [PubMed] [Google Scholar]
- 19.Bellani G, Guerra L, Musch G, Zanella A, Patroniti N, Mauri T, et al. Lung Regional Metabolic Activity and Gas Volume Changes Induced by Tidal Ventilation in Patients with Acute Lung Injury. Am J Respir Crit Care Med 2011;183:1193–9. doi: 10.1164/rccm.201008-1318OC. [DOI] [PMC free article] [PubMed] [Google Scholar]
- 20.Grecchi E, Veronese M, Moresco RM, Bellani G, Pesenti A, Messa C, et al. Quantification of Dynamic [18F]FDG Pet Studies in Acute Lung Injury. Molecular Imaging and Biology 2015;18:143–52. doi: 10.1007/s11307-015-0871-3. [DOI] [PubMed] [Google Scholar]
- 21.Tucci MR, Costa ELV, Wellman TJ, Musch G, Winkler T, Harris RS, et al. Regional Lung Derecruitment and Inflammation during 16 Hours of Mechanical Ventilation in Supine Healthy Sheep: Anesthesiology 2013;119:156–65. doi: 10.1097/ALN.0b013e31829083b8. [DOI] [PMC free article] [PubMed] [Google Scholar]
- 22.de Prost N, Feng Y, Wellman T, Tucci MR, Costa EL, Musch G, et al. 18F-FDG Kinetics Parameters Depend on the Mechanism of Injury in Early Experimental Acute Respiratory Distress Syndrome. J Nucl Med 2014;55:1871–7. doi: 10.2967/jnumed.114.140962. [DOI] [PMC free article] [PubMed] [Google Scholar]
- 23.Wellman TJ, de Prost N, Tucci M, Winkler T, Baron RM, Filipczak P, et al. Lung Metabolic Activation as an Early Biomarker of Acute Respiratory Distress Syndrome and Local Gene Expression Heterogeneity: Anesthesiology 2016;125:992–1004. doi: 10.1097/ALN.0000000000001334. [DOI] [PMC free article] [PubMed] [Google Scholar]
- 24.Gerbaudo VH, Julius B. Anatomo-metabolic characteristics of atelectasis in F-18 FDG-PET/CT imaging. European Journal of Radiology 2007;64:401–5. doi: 10.1016/j.ejrad.2007.08.013. [DOI] [PubMed] [Google Scholar]
- 25.Schroeder T, Vidal Melo MF, Musch G, Harris RS, Venegas JG, Winkler T. Modeling Pulmonary Kinetics of 2-Deoxy-2-[18F]fluoro-d-glucose During Acute Lung Injury. Academic Radiology 2008;15:763–75. doi: 10.1016/j.acra.2007.12.016. [DOI] [PMC free article] [PubMed] [Google Scholar]
- 26.Schroeder T, Vidal Melo MF, Venegas JG. Analysis of 2-[Fluorine-18]-Fluoro-2-deoxy-D-glucose Uptake Kinetics in PET Studies of Pulmonary Inflammation. Academic Radiology 2011;18:418–23. doi: 10.1016/j.acra.2010.11.019. [DOI] [PMC free article] [PubMed] [Google Scholar]
- 27.Melo MFV, Layfield D, Harris RS, O’Neill K, Musch G, Richter T, et al. Quantification of Regional Ventilation-Perfusion Ratios with PET. J Nucl Med 2003;44:1982–91. [PubMed] [Google Scholar]
- 28.Harris RS, Willey-Courand D-B, Head CA, Galletti GG, Call DM, Venegas JG. Regional Vȧ,Q˙, and Vȧ/Q˙during PLV: effects of nitroprusside and inhaled nitric oxide. Journal of Applied Physiology 2002;92:297–312. doi: 10.1152/jappl.2002.92.1.297. [DOI] [PubMed] [Google Scholar]
- 29.Schroeder T, Melo MFV, Musch G, Harris RS, Venegas JG, Winkler T. Image-Derived Input Function for Assessment of ŝup 18^F-FDG Uptake by the Inflamed Lung. The Journal of Nuclear Medicine; New York 2007;48:1889–96. [DOI] [PMC free article] [PubMed] [Google Scholar]
- 30.de Prost N, Tucci MR, Melo MFV. Assessment of Lung Inflammation With 18F-FDG PET During Acute Lung Injury. American Journal of Roentgenology 2010;195:292–300. doi: 10.2214/AJR.10.4499. [DOI] [PMC free article] [PubMed] [Google Scholar]
- 31.Grommes J, Soehnlein O. Contribution of Neutrophils to Acute Lung Injury. Mol Med 2011;17:293–307. [DOI] [PMC free article] [PubMed] [Google Scholar]
- 32.Welbourn CRB, Young Y. Endotoxin, septic shock and acute lung injury: Neutrophils, macrophages and inflammatory mediators. British Journal of Surgery 1992;79:998–1003. doi: 10.1002/bjs.1800791006. [DOI] [PubMed] [Google Scholar]
- 33.Wilson MR, O’Dea KP, Zhang D, Shearman AD, van Rooijen N, Takata M. Role of Lung-marginated Monocytes in an In Vivo Mouse Model of Ventilator-induced Lung Injury. Am J Respir Crit Care Med 2009;179:914–22. doi: 10.1164/rccm.200806-877OC. [DOI] [PMC free article] [PubMed] [Google Scholar]
- 34.Saha D, Takahashi K, de Prost N, Winkler T, Pinilla-Vera M, Baron RM, et al. Micro-Autoradiographic Assessment of Cell Types Contributing to 2-Deoxy-2-[18F]Fluoro-d-Glucose Uptake During Ventilator-Induced and Endotoxemic Lung Injury. Molecular Imaging and Biology 2013;15:19–27. doi: 10.1007/s11307-012-0575-x. [DOI] [PMC free article] [PubMed] [Google Scholar]
- 35.Musch G, Venegas JG, Bellani G, Winkler T, Schroeder T, Petersen B, et al. Regional gas exchange and cellular metabolic activity in ventilator-induced lung injury. Anesthesiology 2007;106:723–35. doi: 10.1097/01.anes.0000264748.86145.ac. [DOI] [PubMed] [Google Scholar]
- 36.Borges JB, Costa ELV, Bergquist M, Lucchetta L, Widström C, Maripuu E, et al. Lung Inflammation Persists After 27 Hours of Protective Acute Respiratory Distress Syndrome Network Strategy and Is Concentrated in the Nondependent Lung: Critical Care Medicine 2015;43:e123–32. doi: 10.1097/CCM.0000000000000926. [DOI] [PubMed] [Google Scholar]
- 37.Tsuchida S, Engelberts D, Peltekova V, Hopkins N, Frndova H, Babyn P, et al. Atelectasis Causes Alveolar Injury in Nonatelectatic Lung Regions. American Journal of Respiratory and Critical Care Medicine 2006;174:279–89. doi: 10.1164/rccm.200506-1006OC. [DOI] [PubMed] [Google Scholar]
- 38.de Prost N, Costa EL, Wellman T, Musch G, Winkler T, Tucci MR, et al. Effects of surfactant depletion on regional pulmonary metabolic activity during mechanical ventilation. Journal of Applied Physiology 2011;111:1249–58. doi: 10.1152/japplphysiol.00311.2011. [DOI] [PMC free article] [PubMed] [Google Scholar]
- 39.Simon BA, Easley RB, Grigoryev DN, Ma S-F, Ye SQ, Lavoie T, et al. Microarray analysis of regional cellular responses to local mechanical stress in acute lung injury. American Journal of Physiology-Lung Cellular and Molecular Physiology 2006;291:L851–61. doi: 10.1152/ajplung.00463.2005. [DOI] [PubMed] [Google Scholar]
- 40.Wang HM, Bodenstein M, Markstaller K. Overview of the Pathology of Three Widely Used Animal Models of Acute Lung Injury. European Surgical Research 2008;40:305–16. doi: 10.1159/000121471. [DOI] [PubMed] [Google Scholar]
- 41.Ziai P, Hayeri MR, Salei A, Salavati A, Houshmand S, Alavi A, et al. Role of Optimal Quantification of FDG PET Imaging in the Clinical Practice of Radiology. RadioGraphics 2016;36:481–96. doi: 10.1148/rg.2016150102. [DOI] [PubMed] [Google Scholar]
- 42.Chen DL, Mintun MA, Schuster DP. Comparison of Methods to Quantitate 18F-FDG Uptake with PET During Experimental Acute Lung Injury. J Nucl Med 2004;45:1583–90. [PubMed] [Google Scholar]
- 43.Harris RS, Venegas JG, Wongviriyawong C, Winkler T, Kone M, Musch G, et al. 18F-FDG Uptake Rate Is a Biomarker of Eosinophilic Inflammation and Airway Response in Asthma. Journal of Nuclear Medicine 2011;52:1713–20. doi: 10.2967/jnumed.110.086355. [DOI] [PMC free article] [PubMed] [Google Scholar]
Associated Data
This section collects any data citations, data availability statements, or supplementary materials included in this article.