Abstract
Proteins are universally manufactured by ribosomes, which are assembled within major nuclear compartments called nucleoli1,2. Current paradigms suggest that only RNA polymerase I and III (Pol I and Pol III) directly mediate the expression of ribosomal RNA (rRNA) components of ribosomes. Here, we show that RNA polymerase II (Pol II) inside of human nucleoli operates directly near genes encoding rRNA to drive its expression. Pol II, assisted by the neurodegeneration-associated enzyme senataxin, generates an R-loop shield at intergenic spacers flanking nucleolar rRNA genes. The shield prevents Pol I from producing sense intergenic noncoding RNAs (sincRNAs) that can disrupt nucleolar organization and rRNA expression. The disruptive sincRNAs are unleashed by Pol II inhibition, senataxin loss, Ewing sarcoma, or locus-associated R-loop repression via an RNaseH1-EGFP-dCas9 system (denoted ‘red laser’). We reveal a nucleolar Pol II-dependent mechanism driving ribosome biogenesis, identify disease-associated disruption of nucleoli by non-coding RNAs, and establish locus-targeted R-loop modulation. Our findings revise the current schema of labour division between the major RNA polymerases and identify nucleolar Pol II as a major factor in protein synthesis and nuclear organization, with potential implications in health and disease.
Various proteins self-organize via liquid-liquid phase separation (LLPS) into nucleolar subdomains, which are needed for highly stereotyped ribosome assembly1,2. At fibrillar centres in the heart of mammalian nucleoli, the major ribosomal RNA (rRNA) molecules needed to assemble ribosomes are generated by RNA polymerase I (Pol I)-dependent transcription of rRNA genes within ribosomal DNA (rDNA) repeats1,3. Within rDNA, rRNA genes are separated by large intergenic spacers (IGSs) (extended data Fig. 1a). At nucleolar rRNA genes, Pol I synthesizes precursor rRNAs (pre-rRNAs) that are processed into mature 28S, 18S, and 5.8S rRNA molecules as they migrate to the granular component at the nucleolar periphery. Outside of nucleoli, RNA polymerase III (Pol III) synthesizes 5S rRNA molecules that are targeted to nucleoli for processing. Mature rRNAs are packaged into 40S and 60S ribosomal subunits for cytoplasmic export. Traditionally, the nucleolar Pol I and nucleoplasmic Pol III are viewed as the sole mammalian RNA polymerases that directly mediate housekeeping ribosome biogenesis, Interestingly, in the budding yeast Saccharomyces cerevisiae, Pol II is physically enriched at rDNA IGSs, but this phenomenon is deleterious because it drives ageing without affecting rRNA expression3–5. It is unclear whether nucleolar Pol II exists in higher organisms or directly promotes ribosome biogenesis in any species.
Active Pol II at rDNA IGSs
To address whether Pol II exists within human nucleoli, we first used immunofluorescence coupled to super-resolution microscopy. We observed foci corresponding to active Pol II phosphorylated on Serine-2 (pS2) within nucleoli, which are outlined by nucleophosmin (NPM) (Fig. 1a; extended data Fig. 1b,c). Chromatin immunoprecipitation (ChIP) showed that pS2 and another active form of Pol II phosphorylated on Serine-5 (pS5) were enriched across rDNA, with the highest levels at IGS28 and IGS38 being comparable to those at known Pol II-transcribed loci (Fig. 1b; extended data Fig. 1a,d–f). The Pol II activator cyclin-dependent kinase 9 (CDK9) was similarly enriched across IGSs (extended data Fig. 1g). pS2 and CDK9 were also enriched across the IGSs of IMR90 fibroblasts, indicating that enrichments are not limited to tumorigenic cells (extended data Fig. 1h,i). Unlike Pol II and CDK9, Pol I and its initiation factor upstream binding factor 1 (UBF) primarily localized to rRNA genes, although low Pol I levels existed across IGSs (extended data Fig. 1j,k). Notably, Pol II was overrepresented relative to Pol I only within IGSs (extended data Fig. 1l). These data suggest that rDNA loci are cohabited by Pol I and Pol II.
Fig. 1. Pol I and Pol II localize to the rDNA IGS and compete to modulate IGS ncRNA levels.
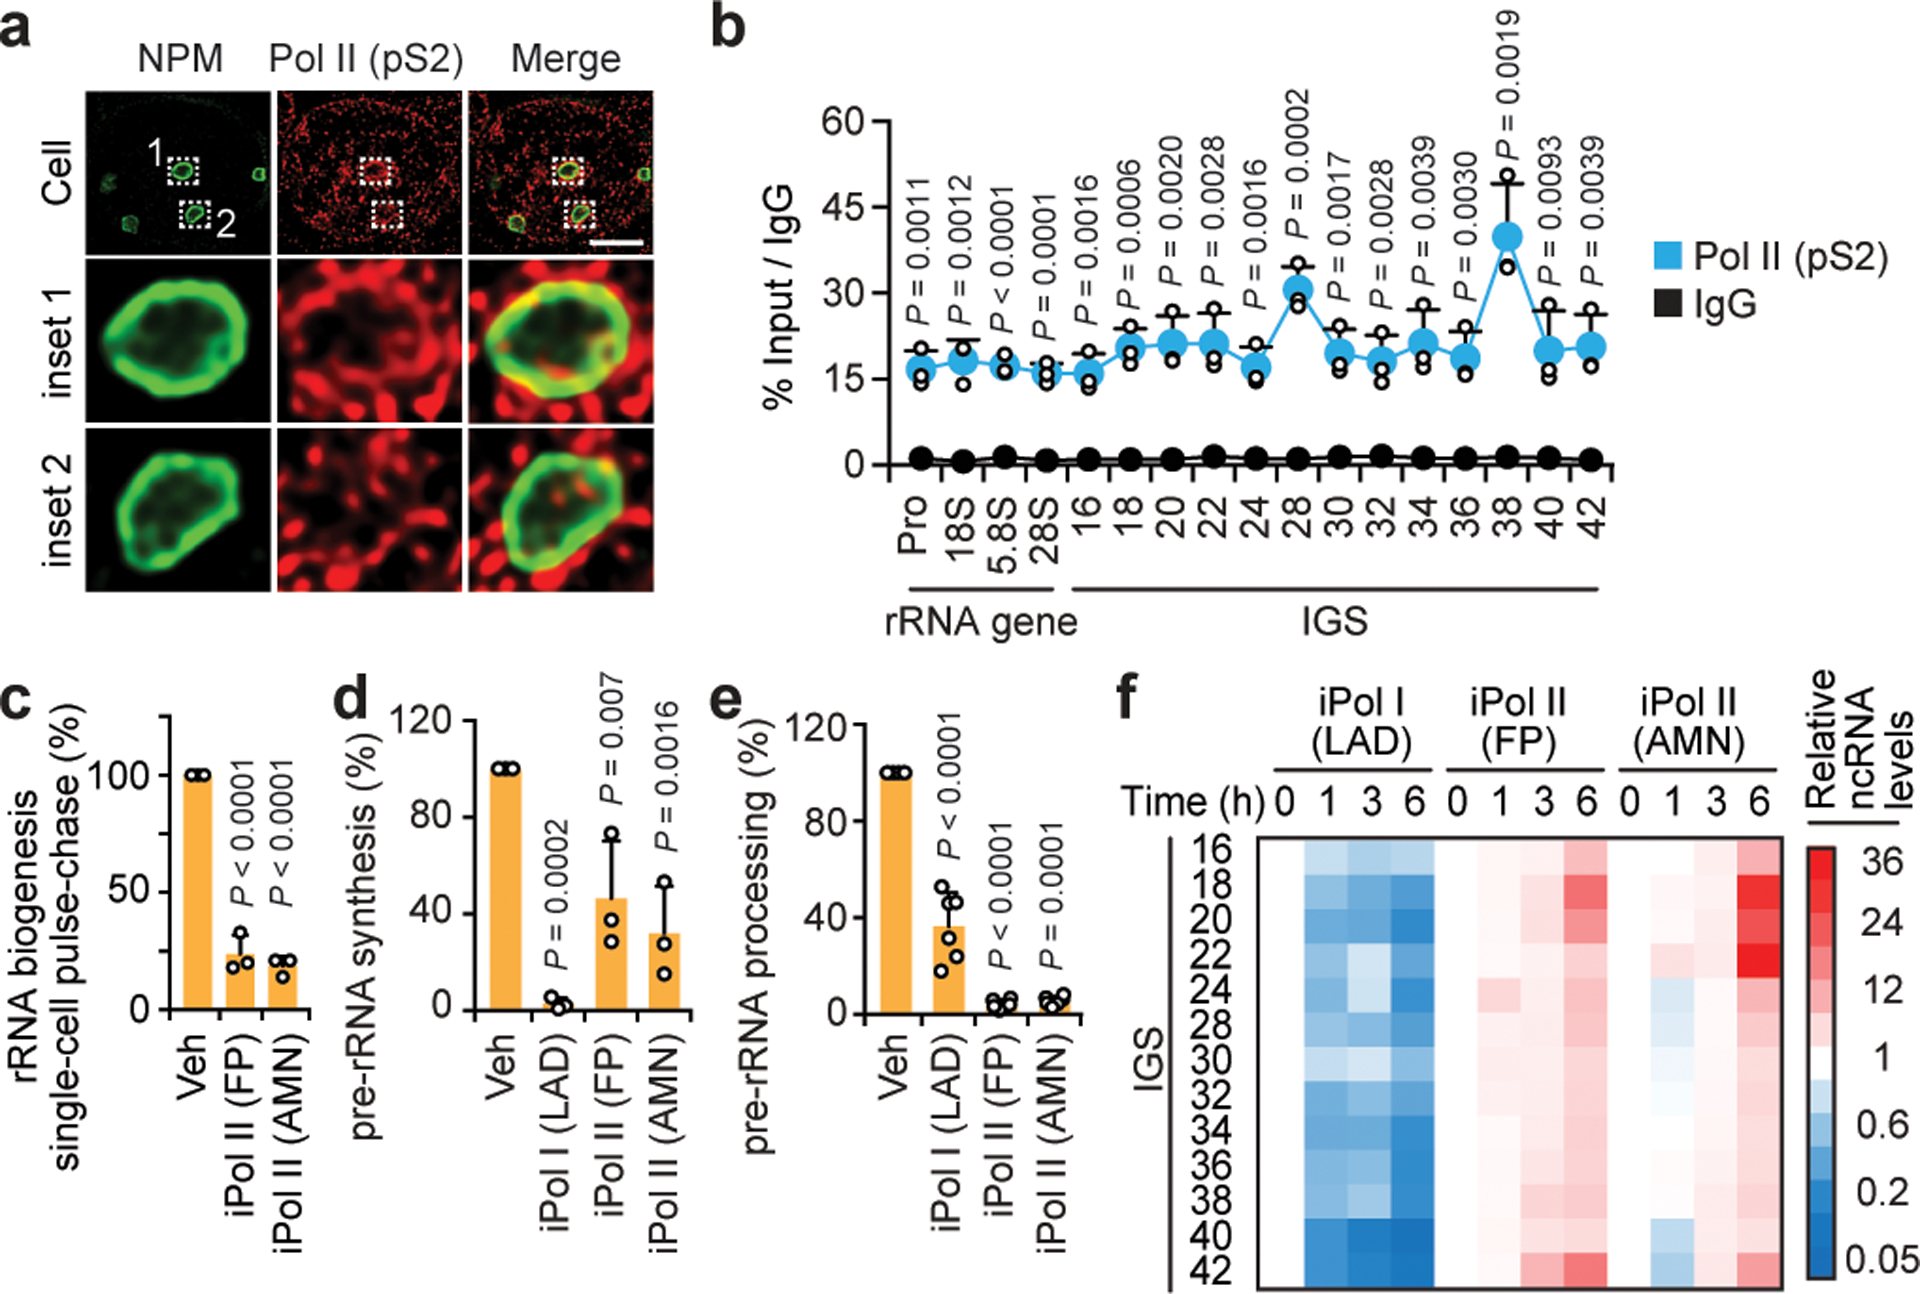
(a) Representative immunofluorescence (IF) and super-resolution microscopy images showing Pol II-pS2 localization within the NPM-indicated nucleoli. Scale bar, 5 μm. (b) Pol II-pS2 enrichments across rDNA as revealed by chromatin immunoprecipitation (ChIP). (c) Effect of a 3 h Pol II inhibition (iPol II) using flavopiridol (FP) or α-amanitin (AMN) on rRNA biogenesis as measured in live single-cell FU-RNA pulse-chase assays. (d-e) Cell population-based RNA pulse-chase assays were used to assess pre-rRNA synthesis (d) and processing (e) following a 3 h inhibition of Pol I or Pol II (iPol I/II). (f) Pol I promotes and Pol II represses IGS ncRNAs, as shown by reverse-transcriptase qPCR (RT). (a-h) HEK293 cells; data are shown as the mean±s.d.; data in (b) and extended data Fig. 1d–f,j–l were from large experimental sets sharing IgG controls; n=3 biologically independent experiments (b-f); two-tailed t-test (b); one-way ANOVA with Dunnett’s multiple comparisons test (c-e); image in (a) is representative of two independent experiments.
To determine if rRNA biogenesis is rapidly impacted following Pol II perturbation, we conducted a three-hour treatment with the Pol II inhibitors -amanitin (AMN) or flavopiridol (FP) in pulse-chase experiments. Pol II inhibition perturbed global ribosome biogenesis (Fig. 1c). Specifically, unlike Pol I inhibition by low-dose actinomycin-D (LAD), Pol II inhibition almost fully abolished pre-rRNA processing (Fig. 1d,e; extended data Fig. 2a–c), indicating a distinct mechanism of ribosome biogenesis arrest. Cell viability and global protein levels were unchanged following Pol II inhibition, arguing against indirect effects (extended data Fig. 2d,e). Furthermore, a 30-minute Pol II inhibition was sufficient to strongly disrupt rRNA processing, suggesting a direct function for Pol II through its enrichment at rDNA (extended data Fig. 2f; Pol II inhibition hereafter is for three hours unless otherwise indicated). These data suggest that Pol II might directly support nucleolar rRNA expression through its association with IGSs.
In different cell types, we detected IGS ncRNAs that decreased in abundance following Pol I inhibition (Fig. 1f; extended data Fig. 2g,h). Strikingly, IGS ncRNAs were markedly induced and found to be de novo transcribed upon Pol II inhibition (Fig. 1f; extended data Fig. 2h,i). Simultaneous inhibition of Pol I abolished the induction of IGS ncRNAs by Pol II inhibition (extended data Fig. 2j,k). Thus, Pol II counters Pol I-dependent synthesis of IGS ncRNAs. Strand-specific transcript analysis of IGSs identified sense intergenic ncRNAs (sincRNAs) and antisense intergenic ncRNAs (asincRNAs) that were transcribed by Pol I and Pol II, respectively (extended data Fig. 2l–n). The sincRNA/asincRNA ratio paralleled Pol I/Pol II enrichment across IGSs (extended data Fig. 2m,o). The data so far indicate that Pol II directly operates across the IGSs where it generates asincRNAs and limits the spurious synthesis of sincRNAs by Pol I.
Pol II maintains nucleoli via sincRNA control
Since nucleolar organization is essential for rRNA synthesis and processing, we characterized disordered proteins at the nucleolar subdomains critical to these functions (extended data Fig. 3a–b). NPM indicates the granular component of the nucleolus, the LLPS of which is required for rRNA processing2,6,7. Pol II inhibition abrogated the phase separation of NPM, which was quickly reorganized into ruffled bodies before undergoing complete mixing with the nucleoplasm (Fig. 2a; extended data Fig. 3c–e). At nucleolar fibrillar centres, the rRNA gene promoter-enriched UBF forms small foci6. Pol II inhibition resulted in UBF relocation to the nucleolar periphery, where UBF formed large spheres, rings, or crescent-shaped bodies exhibiting wetting behaviour (Fig. 2b; extended data Fig. 3f–h). Changes in NPM and UBF coincided with global nucleolar disorganization (extended data Fig. 3i) and matched sincRNA induction kinetics (Fig. 1f). UBF bodies generated upon Pol II inhibition exhibited greater fluorescence recovery after photobleaching (FRAP; extended data Fig. 3j)6, suggesting decreased UBF-rDNA interactions or rDNA relocation to less viscous environments. Notably, the former nucleolar space that became surrounded with UBF signals following Pol II inhibition showed positive Congo Red staining (extended data Fig. 3k), which indicates stress-induced, solid-like nucleolar amyloid bodies8,9. The data suggest that Pol II inhibition partly and strongly disrupts the organization of rRNA synthesis and processing sites, respectively. Under these conditions, aberrant liquid-to-solid phase transitions occur within the remnant nucleolar space.
Fig. 2. Pol II represses sincRNAs to maintain nucleolar structure and function.
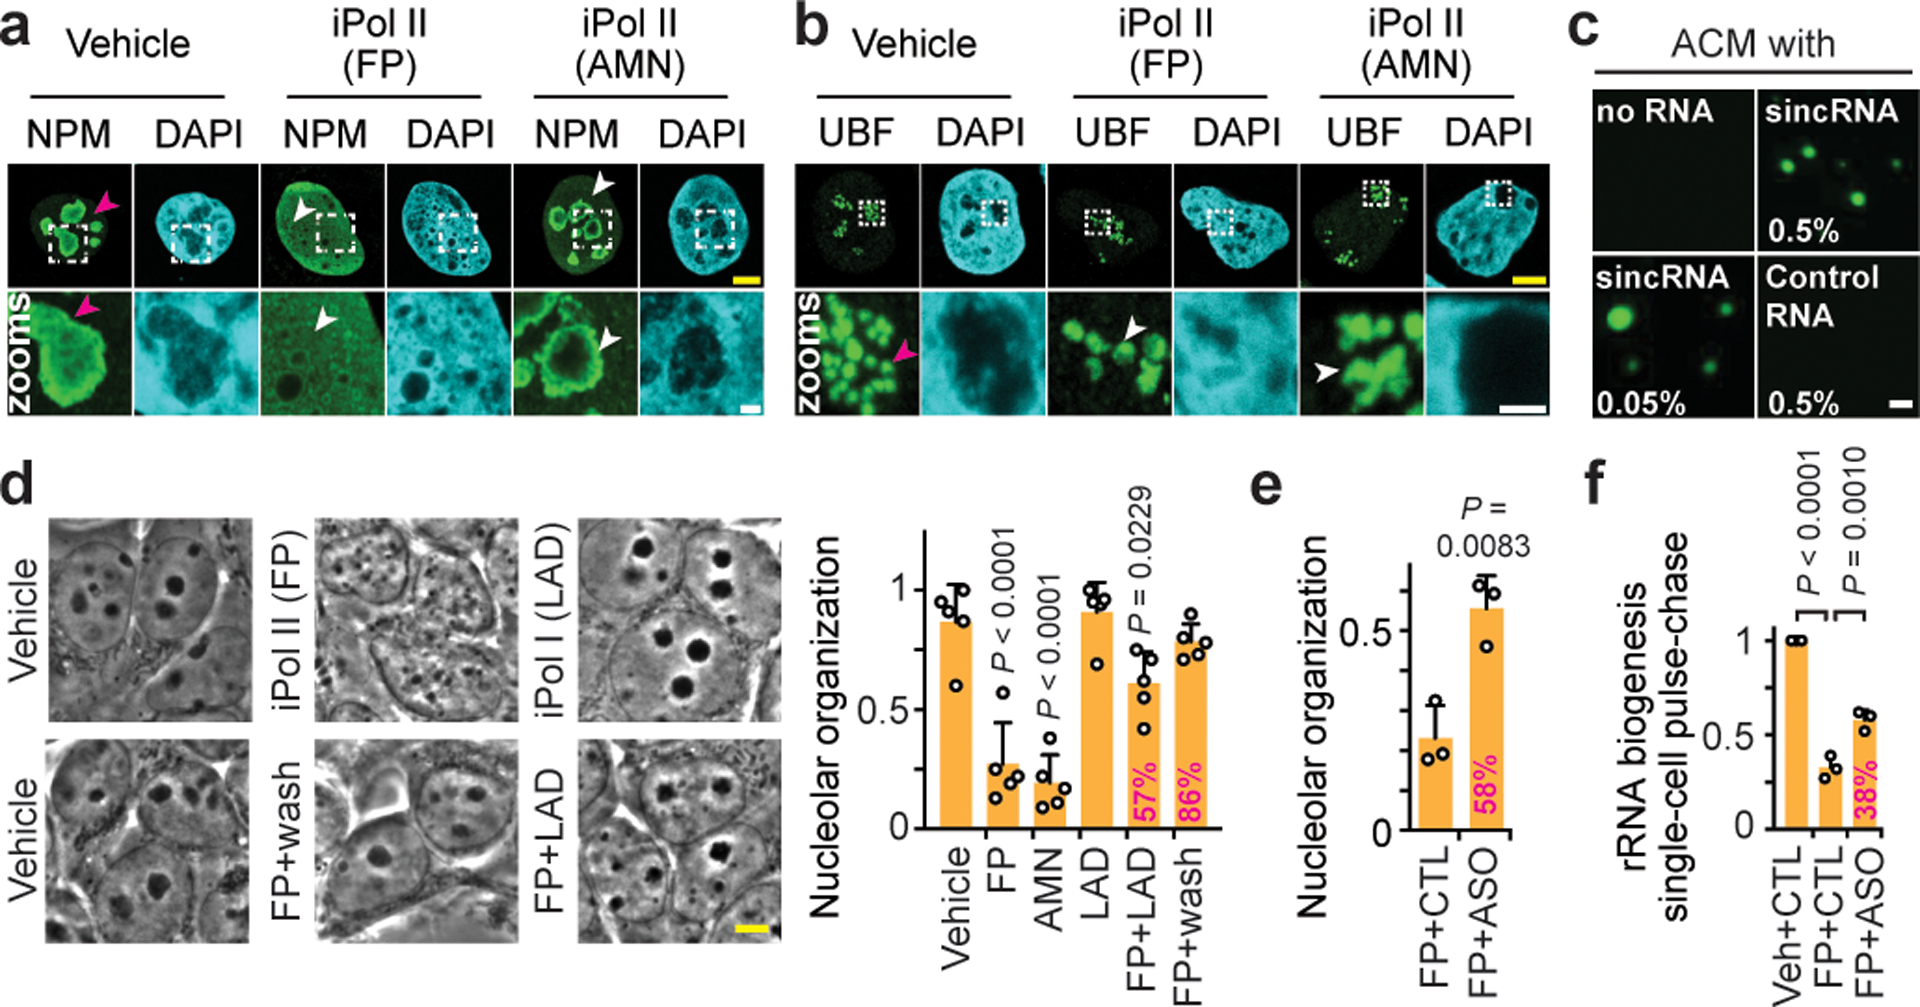
(a-b) Effects of 3 h Pol II inhibition on NPM (a) and UBF (b) localization shown by immunofluorescence microscopy. Examples of normal and defective phenotypes are respectively marked by magenta and white arrowheads. (c) Low-complexity sincRNA, not high-complexity control RNA, promoted liquid droplets in the presence of amyloid-converting motif (ACM) peptides. RNA percent concentrations are shown. (d-f) Nucleolar organization was restored by Pol I co-inhibition (d), FP removal (d), or treatment with sincRNA-repressing ASO (e), which also restored rRNA biogenesis as indicated by live single-cell FU-RNA pulse-chase assays (f). Percentages indicating phenotypic rescue relative to FP-treated cells are shown onto graph bars where applicable. (a-f) HEK293 cells; data are shown as the mean±s.d.; one-way ANOVA with Dunnett’s multiple comparisons test (d,f), two-tailed t-test (e), n=5 biologically independent experiments (d), n=3 biologically independent experiments (e,f); images in (a-c) are representative of two independent experiments; scale bars, 5 μm (yellow) or 1 μm (white).
Nucleolar amyloid bodies usually emerge following environmental stresses such as heat shock6,8,9. Specifically, heat shock causes proteins with the amyloid-converting motif (ACM) to form nucleolar liquid droplets, which undergo phase transition into solid-like amyloid bodies (extended data Fig. 4a–b). Knockdown of different sincRNAs prevented heat shock-induced and ACM-containing nucleolar liquid droplet formation in vivo (extended data Fig. 4c). In a cell-free in vitro system, incubating ACM peptides with a sincRNA segment induced liquid droplet formation (Fig. 2c; extended data Fig. 4d)9. Moreover, strand-specific RNA sequencing (ss-RNA-seq) revealed that heat shock induced sincRNA and repressed asincRNA levels at IGSs (extended data Fig. 4e). Thus, environmental stress represses asincRNA levels and promotes sincRNA-dependent nucleolar remodelling. The results also show that sincRNAs induce liquid droplets in vitro and promote liquid droplets and consequent solid-like amyloid bodies in vivo.
Next, we assessed whether sincRNA repression restores nucleolar organization and function in live cells subjected to Pol II inhibition. Nucleolar organization was restored after Pol II inhibitor wash-off, Pol I co-inhibition, or direct repression of sincRNA levels with antisense oligonucleotides (ASO) (Fig. 2d,e; extended data Fig. 5a). ASO also partly restored rRNA biogenesis (Fig. 2f). An overexpressed sincRNA localized to nucleoli without decreasing rRNA biogenesis (extended data Fig. 5b–d), indicating that nucleolar disruption may depend on specific combinations of sincRNAs or that endogenous sincRNAs have distinctive modifications or interactors. However, cell types with naturally elevated sincRNA levels exhibited more NPM-marked nucleoli (extended data Fig. 2g, 5e). Of note, long-term Pol II inhibition may compromise nucleoli indirectly, by limiting the ability of Pol II to synthesize U8 snoRNA or Alu RNA molecules10–12. However, following our short-term Pol II inhibition, nucleolar disruption coincided with sincRNA induction in the absence of changes in U8 or Alu levels (extended data Fig. 6a,b). Additionally, in contrast to Pol II inhibitors, pharmacological agents2,12 disrupting nucleolar organization or global protein translation failed to induce sincRNA levels (extended data Fig. 6c–e). Thus, sincRNA accumulation drives nucleolar disorganization, and not vice-versa. Together, these results show that Pol II constitutively represses different Pol I-dependent sincRNAs to prevent unscheduled stress-mimicking nucleolar phase transitions and maintain endogenous nucleolar condensates critical for rRNA biogenesis.
Pol II sets an R-loop shield for Pol I
Nucleoli are naturally enriched in R-loops, which are triplex nucleic acid structures harbouring a DNA-RNA hybrid and single-stranded DNA13. Therefore, we postulated that baseline R-loop levels across IGSs may have beneficial effects through the modulation of Pol I-Pol II crosstalk. DNA-RNA hybrid immunofluorescence (DRIF) revealed nucleolar R-loops that were partly repressed by Pol II inhibition (Fig. 3a) or the recombinant DNA-RNA hybrid repressor RNase H1 (extended data Fig. 7a–c). DNA-RNA hybrid immunoprecipitation (DRIP) revealed that several IGS sites exhibited R-loop signals, which peaked at the rRNA gene-IGS junction and were sensitive to RNase H1 (Fig. 3b; extended data Fig. 7d)14. Despite markedly higher transcription of rRNA genes relative to IGSs, negative GC skews may be one of different factors favouring antisense IGS R-loops (extended data Fig. 7e)15. Notably, R-loop repression by RNase H1 overexpression partly mimicked Pol II inhibition, increasing sincRNA expression at most IGS sites tested (extended data Fig. 7f,g). Together, these findings suggest that R-loops are important molecular mediators of sincRNA repression by Pol II.
Fig. 3. Repression of an IGS R-loop shield disrupts nucleoli.
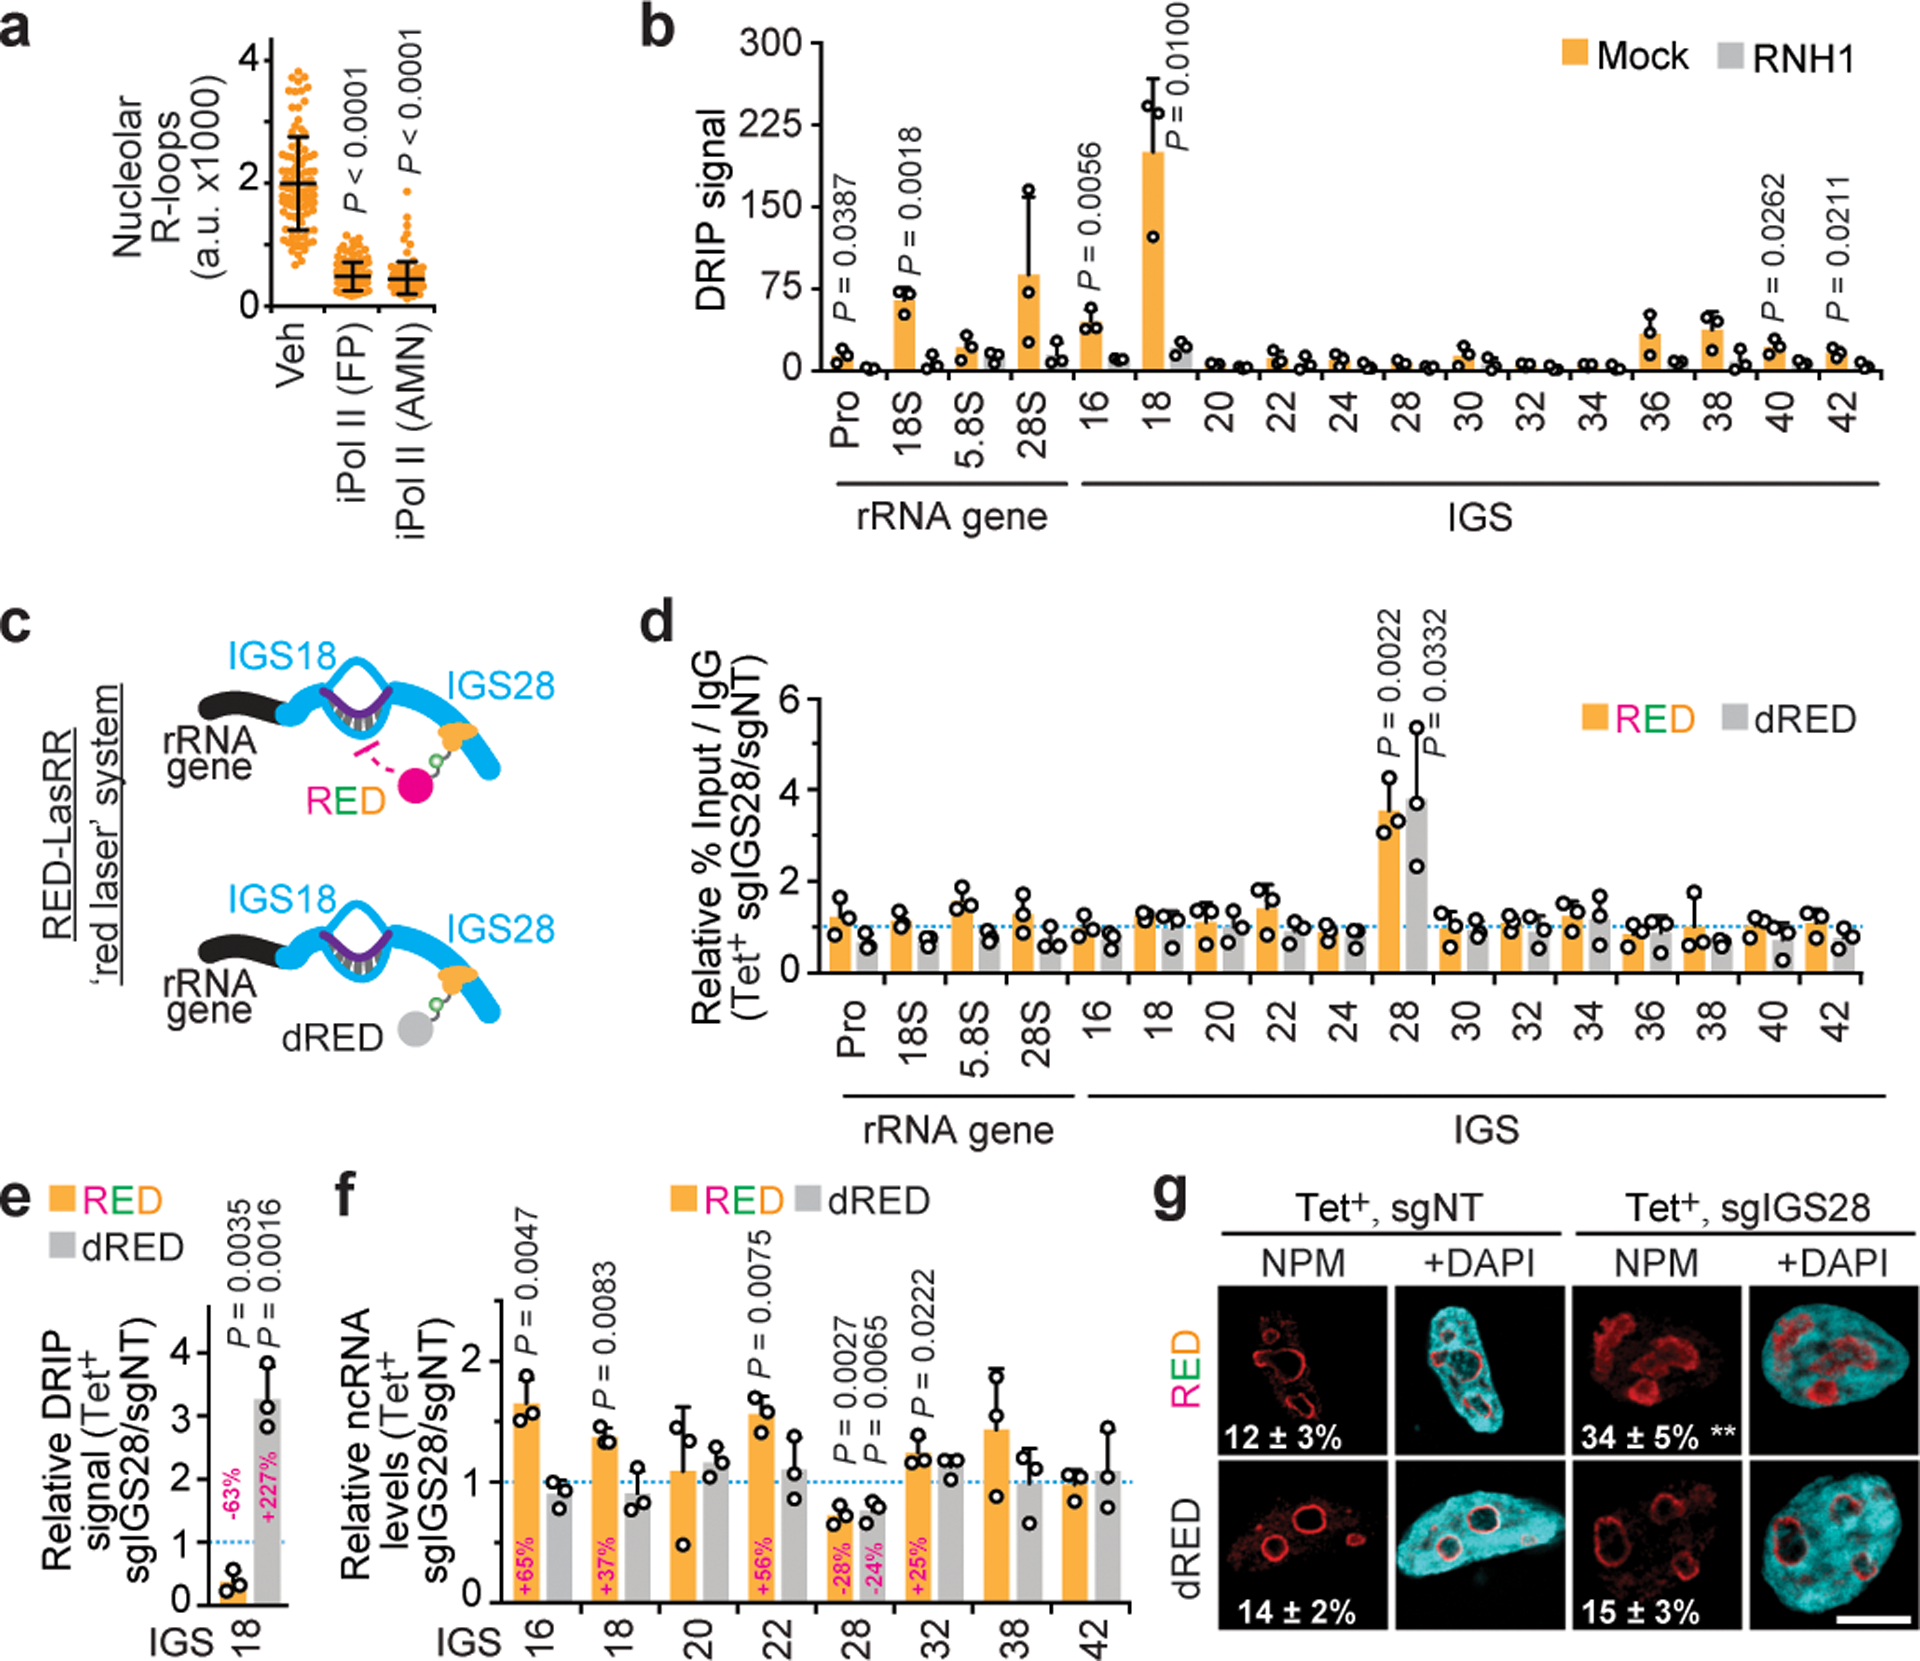
(a) Pol II inhibition repressed nucleolar R-loops. (b) DRIP showing RNase H1-sensitive R-loop peaks at rDNA. (c) The RED-LasRR system created to achieve inducible locus-associated R-loop repression. (d) The short guide RNA for IGS28 (sgIGS28) enriched RED or dRED at IGS28 in anti-GFP ChIP. Enrichments are normalized to a non-targeting control (sgNT). RED and dRED data were from different experiments but are shown on the same graph as a space-saving measure. (e) Using RED or dRED together with sgIGS28 decreased and increased R-loop levels at IGS18, respectively. (f,g) RED sgIGS28 induced ncRNA levels (f) and disrupted NPM localization (g). The percentage of cells exhibiting ruffled NPM localization is indicated on images (g). (a-g) HEK293 cells; data are shown as the mean±s.d.; two-tailed Mann-Whitney U test, n=100 cells (a), or two-tailed t-test, n=3 biologically independent experiments (b, d-f); scale bar, 5 μm. Percent changes relative to respective sgNT samples are indicated above or onto bars (e-f).
RNase H1 overexpression remains the gold-standard method to interrogate R-loop function13. However, with this approach, RNase H1 is often not enriched at the studied loci, where the observed phenotypic changes may also be due to R-loop repression elsewhere. To specifically interrogate the function of IGS-associated R-loops, we created a tetracycline-inducible RNase H1-EGFP-dCas9 (RED) fusion protein to achieve locus-associated R-loop repression (denoted RED-LasRR or ‘red laser’; Fig. 3c, extended data Fig. 7h). As control, this system employs a similar chimeric protein with catalytically dead RNase H1 (denoted dRED). Similar to the RNase H1 protein16, RED and dRED displayed nucleolar and nucleoplasmic localization in the absence of short guide RNAs (sgRNAs) (extended data Fig. 7i,j). Within the IGS, constitutive chromatin looping juxtaposes the IGS27/28 sites with IGS16/18 sites17,18. Therefore, we asked if a pool of three sgRNAs targeting IGS28 (sgIGS28) can enrich RED at IGS28 and repress the strong R-loop peaks at IGS16/18. ChIP confirmed successful targeting and similar enrichment of RED and dRED at the IGS28 site upon co-expression of sgIGS28 (Fig. 3d). Targeting RED, but not dRED, to IGS28 repressed only the strong R-loop peak at IGS18, while inducing a subset of sincRNAs across the IGSs (Fig. 3e–f; extended data Fig. 7k). Using RED with sgIGS38, which is spatially distal to the IGS18 site17,18, failed to alter R-loop or ncRNA levels at IGS18 (extended data Fig. 7l,m). Targeting dRED to IGS28 stabilized R-loops without decreasing sincRNA levels at IGS18, suggesting that maximal function of IGS18 R-loops is already achieved endogenously (Fig. 3e,f). Of note, ncRNA levels were similarly decreased at the IGS28 site to which RED or dRED were targeted without affecting Pol II enrichments (Fig. 3f; extended data Fig. 7n) and the RED-LasRR system can be used to target the fusion proteins to a single-copy locus outside of rDNA (extended data Fig. 7o). Using the gRNAs targeting RED to IGS28, individually, failed to achieve R-loop repression at the IGSs (extended data Fig. 7p). This argues against the possibility that targeting of RED to non-rDNA sites via any single gRNA or the RNase H1 moiety of the fusion protein indirectly represses IGS R-loops. Although the RED/sgIGS28-dependent lowering of R-loops only partially induces sincRNAs, this still mimicked early Pol II inhibition as evidenced by the perturbation of NPM architecture into indistinct, ruffled bodies (Fig. 3f,g,). This highlights the disruptive impact that even small increases in sincRNA levels can exert onto nucleoli. The data show that asincRNAs generated by Pol II form an antisense R-loop shield that limits the synthesis of Pol I-dependent sincRNAs, which can abrogate nucleolar organization and function. The RED-LasRR system will support studies on the numerous roles of R-loops in genome expression and stability.
Senataxin supports the R-loop shield
We next set out to identify additional factors that may regulate nucleolar Pol II. Senataxin (SETX) is a human neurodegeneration-linked helicase19. SETX or its yeast ortholog Sen1 exert several transcription-modulatory roles including Pol II loading and R-loop repression20–22. Sen1 associates with rDNA IGSs to promote Pol I transcription termination and silence lifespan-shortening IGS ncRNAs16,23,24. We found that SETX was enriched across human IGSs, especially at IGS28, and exhibited nucleolar localization (extended data Fig. 8a,b). The IGS28 SETX peak overlapped one Pol II peak and the intergenic promoter marks H3K27ac, H3K9ac, and H3K4me3 in ENCODE ChIP-seq data (extended data Fig. 8c). ChIP-re-ChIP revealed that SETX was preferentially co-enriched with Pol II compared to Pol I at IGS28 (Fig. 4a). Thus, SETX is co-enriched with Pol II at IGSs, especially at a putative intergenic promoter at IGS28.
Fig. 4. Nucleolar Pol II reinforcement by SETX and nucleolus-disrupting sincRNAs in cancer.
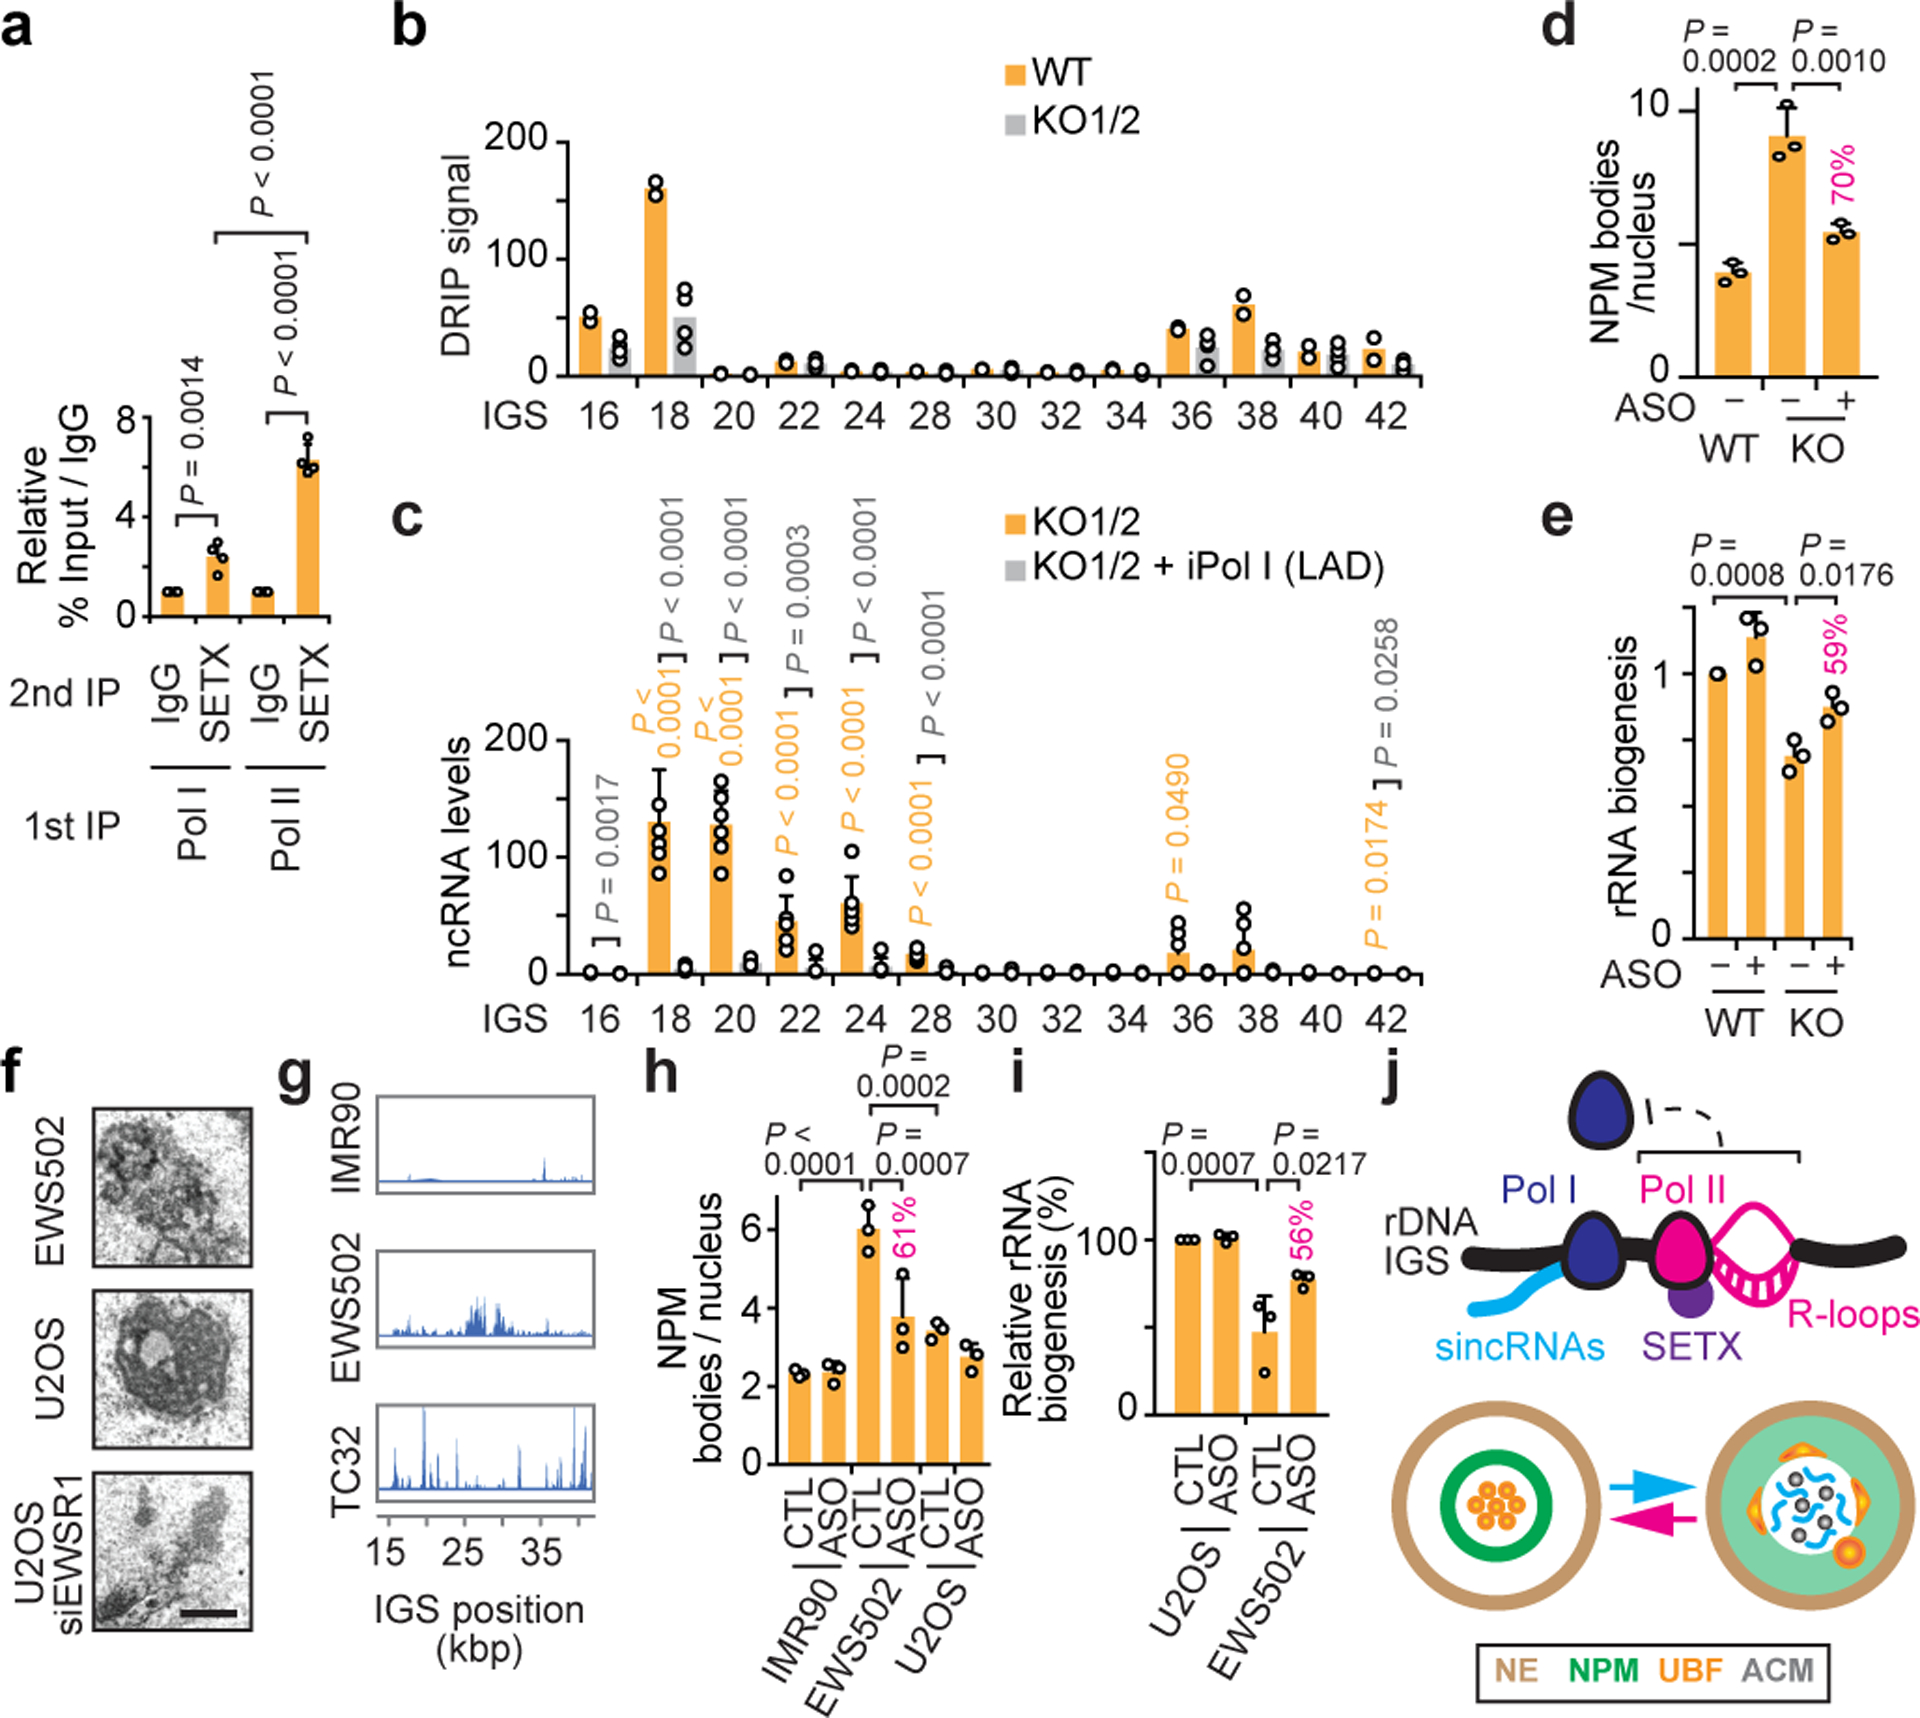
(a) Sequential immunoprecipitations (IPs) revealed preferential SETX co-enrichment with Pol II at IGSs. (b-c) SETX KO in two clones decreased R-loops (b) and induced IGS ncRNAs (c). (d-e) In SETX KO cells, single cell analysis showed that ASO-mediated repression of Pol I-dependent sincRNAs partly rescues nucleolar organization (d) and pre-rRNA processing (e). Percentages indicating the magnitude of ASO-mediated phenotypic rescue are shown above graph bars where applicable. (f-g) Ewing sarcoma (EWS502, TC32) cells showed both disrupted nucleoli by electron microscopy (f) and increased ncRNA levels across IGSs (g). (h,i) Single-cell analysis showed that sincRNA knockdown partly restores nucleolar organization (h) and pre-rRNA processing (i) in EWS502 cells. (j) Model showing Pol II-dependent R-loop shield limiting Pol I-dependent sincRNAs, which compromise nucleolar organization and function. NE, nuclear envelope; ACM, amyloid-converting motif. (a-i) HEK293 cells; data are shown as the mean±s.d.; one-way ANOVA with Dunnett’s multiple comparisons test (a, d-e, h-i) and one-way ANOVA with Tukey’s multiple comparisons test (c); n=4 biologically independent experiments (a), n=2 biologically independent experiments (b, duplicates for each of WT, KO1, and KO2), n=6 biologically independent experiments (c, triplicates for each KO), n=3 biologically independent experiments (d-e,h-i); images in (f-g) are representatives of two independent experiments, scale bar, 1 μm.
Notably, SETX knockout (KO) decreased the intergenic enrichment of Pol II and its R-loops (Fig. 4b; extended data Fig. 8d,e). This change was accompanied by increased intergenic Pol I enrichment (extended data Fig. 8f), elevated sincRNA synthesis (Fig. 4c; extended data Fig. 8g), and decreased Pol I localization at rRNA genes (extended data Fig. 8h). Unlike SETX KO, the forced release of Pol I from rRNA gene promoters via knockdown of Transcription Initiation Factor 1A (TIF1A) decreased pre-rRNA levels without inducing sincRNA levels (extended data Fig. 8i,j). This suggests that SETX loss prevents Pol II from shielding the IGSs from de novo Pol I loading. In addition, Northern blotting did not show increases in pre-rRNA length upon Pol II or SETX disruption arguing against rRNA gene read-through as the basis for increased IGS transcription by Pol I (extended data Fig. 8k). Thus, IGS R-loops act more as a shield that prevents Pol I recruitment rather than a barrier that limits read-through transcription. Increases in sincRNA levels in SETX KO cells were associated with nucleolar disorganization and pre-rRNA processing defects, which were partly countered by sincRNA knockdown (Fig. 4d,e; extended data Fig. 8l–n). That SETX loss partly mimicked Pol II inhibition, likely reflects the partial co-enrichment of SETX and Pol II at IGSs. Additionally, SETX KO did not lower IGS epigenetic silencing marks (extended data Fig. 8o), suggesting that SETX loss does not promote sincRNA levels by abrogating epigenetic silencing. In fact, SETX KO slightly increased silencing marks, possibly reflecting epigenetic compensation constraining the magnitude of sincRNA induction. The data indicate that SETX is co-enriched with IGS Pol II and supports it in repressing a subset of Pol I-dependent sincRNAs that can disrupt nucleolar organization and function. SETX may achieve this effect by promoting the efficient loading and release of Pol II at an IGS28 intergenic promoter.
sincRNAs can disrupt nucleoli in cancer
We then aimed to identify a setting in which naturally elevated sincRNA levels may compromise nucleolar structure and function. Nucleolar organization, which is intimately related to cellular growth and viability, may be an adjunct in the diagnosis and treatment of some cancers25. In fact, nucleolar disruption upon Pol II inhibition is similar to the constitutive disorganization of nucleoli in human Ewing sarcoma (EWS) tumours, related patient-derived EWS502 or TC32 cells, and U2OS osteosarcoma cells with EWS Breakpoint Region 1 (EWSR1) depletion (Fig. 4f; extended data Fig. 9a,b)26. To determine if alterations in sincRNA levels may underlie this phenotype, we re-analysed RNA-seq and DRIP-seq data from EWS and healthy IMR90 control cells to include rDNA17,26. EWS cells exhibited increased ncRNA and R-loop levels across IGSs (Fig. 4g; extended data Fig. 9c–e). Strikingly, in EWS cells, nucleolar disorganization and an rRNA biogenesis defect were countered by sincRNA knockdown (Fig. 4h,i; extended data Fig. 9f). These findings indicate that natural increases in sincRNA levels can explain aberrant nucleolar morphologies that are commonly observed in cancer25. R-loop increases in this setting may reflect selection for cells that have compensated for the increased sincRNA levels.
Discussion
Our findings indicate that antisense transcription by nucleolar Pol II generates an R-loop shield at rDNA IGSs to block Pol I-dependent sense intergenic transcripts, which can compromise nucleolar condensates underlying rRNA expression (Fig. 4j; extended data Fig. 10). Processes restraining R-loops at human IGSs likely exist, as unrestricted IGS R-loops destabilize yeast rDNA4,16,27. However, our findings differ from those in yeast, where IGS transcription does not regulate rRNA28,29 and Sen1 limits deleterious IGS ncRNAs by enforcing epigenetic silencing and transcript turnover21,23. At the IGS of human cells under stress8, protective sense RNAs are likely induced via local repression of antisense RNA and R-loops. Nucleolar Pol II at IGSs may also crosstalk with cellular differentiation, which is partly driven by promoter-associated transcripts that are dependent on Pol I or Pol II30–33. Future work should explore the potential use of sincRNAs and nucleolar disorganization as cancer biomarkers and whether tumours exhibiting such features are hypersensitive to Pol II-inhibiting drugs34. Overall, we identify nucleolar Pol II as a new master regulator of ribosome biogenesis, with broad implications in health and disease.
METHODS
Cell culture and general materials.
Human HEK293T, HeLa, HAP1, and osteosarcoma (U2OS) cells were cultured in Dulbecco’s Modified Eagle Medium (DMEM; WISENT) with 10% fetal bovine serum (FBS; WISENT). HEK293T T-REx™ cells (ThermoFisher Scientific) were cultured in DMEM supplemented with 10% tetracycline-free FBS and 1% penicillin/streptomycin. EWS502 and IMR90 cells were cultured in Roswell Park Memorial Institute (RPMI) medium supplemented with 10% FBS. All cell lines were cultured in the presence of 1% (v/v) penicillin/streptomycin (WISENT) at 37°C in a humidified atmosphere with 5% CO2. Transfection of cultured cells was achieved using Lipofectamine3000 (Invitrogen; L3000008), Lipofectamine RNAiMAX (Invitrogen; cat# 13778150), and Polyjet DNA transfection reagent (SignaGen Laboratories; SL100688). For transfections with plasmids encoding GFP-UBF1 or RNaseH1, 70% confluent cells were transfected with 1–3 μg of plasmid/well of a 6-well plate. pcDNA3 served as control for RNaseH1 overexpression. For Pol II inhibition, cells were either treated with the reversible inhibitor flavopiridol (FP, 2 μM, inhibits Pol II pS2, Santa Cruz Cat# sc-202157) or the irreversible inhibitor α-amanitin (AMN, 50 μg/mL, inhibits translocation, Abcam Cat# ab144512). Other drug treatments were LAD (50 ng/mL), MG132 (10 μM), doxorubicin (Dox, 300 nM), camptothecin (CPT, 10 μM), cycloheximide (CHX, 100 μM), or 1,6-hexanediol (HEX, 0.1% v/v). Antibodies, primers, guide RNAs, and Northern probes are listed in supplementary information (Supplementary Tables 1–4). For Ewing sarcoma analyses, the Ewing sarcoma cell line TC32 was procured from the Children’s Oncology group and EWS502 was a kind gift from Dr. Stephen Lessnick (Nationwide Children’s Hospital, Ohio). Both cell lines were grown in RPMI (Corning). The control cell lines IMR90, a primary fibroblast cell line and U2OS, a human osteosarcoma cell line were both purchased from ATCC and grown in DMEM (Corning). Media was supplemented with 10% heat inactivated FBS (Atlanta Biologicals). Cells were maintained at 37°C in a humidified atmosphere with 5% CO2, confirmed using STR profiling and tested for mycoplasma contamination. All siRNA transfections were conducted using Lipofectamine RNAimax (ThermoFisher Scientific) following manufacturer’s protocols.
Chromatin immunoprecipitation (ChIP).
Cells were grown to 80% confluence in 15 cm plates and crosslinked with the addition of 1% (v/v) Formaldehyde at room temperature for 10 min. The reaction was quenched with 125 mM glycine for 5 min at room temperature. Cells were washed twice with cold Phosphate Buffer Saline (PBS), lysed with 10 mL lysis buffer (5 mM PIPES, 85 mM KCl, 0.5% (v/v) NP-40, Complete protease inhibitor cocktail (Roche)), scraped into tubes, and incubated for 10 min on ice. Cells were then pelleted at 1,000 RPM for 10 min at 4°C and resuspended in 500 μL of nuclear lysis buffer (50 mM Tris-HCl, 10 mM EDTA, 10% (w/v) SDS, complete protease inhibitor cocktail) and incubated on ice for 10 min. Lysates were sonicated 8 times for 20 sec at 40% amplitude at 4°C with intermittent incubations on ice. Centrifugation at 12,500 x g for 10 min at 4°C clarified lysates. 10 μL of sheared chromatin was set aside for each sample as input. 50μl of chromatin was diluted 1/10 in immunoprecipitation (IP) dilution buffer (16.7 mM Tris-HCl pH 8.0, 0.01% (w/v) SDS, 167 mM NaCl, 1.2 mM EDTA, 1.1% (v/v) Triton-X100, complete protease inhibitor) and incubated with 5 μg of antibody on a rotator overnight at 4°C. Samples were then incubated at constant rotation with 25 μL of pre-washed Dynabeads Protein G (Life Technology, cat# 10004D) for 2 h at 4°C. Beads were washed once with a low salt wash buffer (20 mM Tris-HCl, 0.1% (w/v) SDS, 1% (v/v) Triton X-100, 2 mM EDTA, 150 mM NaCl), once with high salt wash buffer (20 mM Tris-HCl, 0.1% SDS, 1% Triton X-100, 2 mM EDTA, 500 mM NaCl), once with LiCl wash buffer (10 mM Tris-HCl, 1% (v/v) NP-40, 1% (w/v) sodium deoxycholate, 1 mM EDTA, 250 mM LiCl), and twice with TE buffer (10 mM Tris-HCl pH 8.0, 1 mM EDTA) before two rounds of incubation with 100 μL of elution buffer (1% SDS, 100 mM NaHCO3) for 15 min at room temperature. The eluates were incubated with 8 μl of 5 M NaCl on a rotator at 65°C overnight. 3 μL of 10 mg/mL RNase A (ThermoFisher Scientific, Cat# EN0531) was added and incubated at room temperature for 30 min, followed by incubation with 4 μL of 0.5 M EDTA, 8 μL of 1 M Tris-HCl, and 1 μL proteinase K (Roche; cat# 03115887001) at 45°C for 2 h. DNA was purified using the Gel/PCR DNA Fragment Extraction (Geneaid, Cat# DF300) and diluted with 150 μL of TE. Primers are listed in the reagents table included within supplementary information. Following ChIP-qPCR analysis, ChIP enrichments accounting for typical background fluctuations across repetitive DNA loci were calculated as (%Input/IgG) = (%Input for Protein IP) / (%Input for Mock IgG IP). The mean IgG background is also shown on ChIP graphs.
Sequential chromatin immunoprecipitation (ChIP-re-ChIP).
Similar to regular ChIP, cells were grown to 80% confluence, crosslinked, and lysed. For the first round of immunoprecipitation, IP samples were diluted 1/10 in IP dilution buffer (100 μL chromatin + 900 μL IP dilution buffer) and incubated with 5 μg of anti-Pol I (RPA135 subunit) or Pol II (C-Terminal Domain (CTD)) on a rotator overnight at 4°C. Samples were then incubated at constant rotation with 25 μL of pre-washed Dynabeads for 2 h at 4°C. Similar to regular ChIP (see above), beads were washed once with low salt wash buffer, once with high salt wash buffer, once with LiCl wash buffer, and twice with TE buffer before one 30 min incubation with 50 μL elution buffer containing 10 mM DTT. Eluates from each of the first IP tubes corresponding to the same antibody were combined, diluted 20-fold in cold IP dilution buffer and incubated overnight at 4°C with 5 μg of anti-senataxin (SETX) antibody. Once again, beads were incubated at constant rotation with 25 uL of pre-washed Dynabeads for 2 h at 4oC, washed once with low salt wash buffer, once with high salt wash buffer, once with LiCl wash buffer, and twice with TE buffer before two rounds of incubation with 100 μL of elution buffer for 15 min at room temperature, and overnight incubation at 65°C with 8 μL of 5 M NaCl. Similar to regular ChIP, the samples were treated with RNase A/Proteinase K (Roche; Cat# 03115887001), then purified, and qPCR performed.
Quantitative PCR (qPCR).
Quantitative real-time PCR was performed using the Bio-Rad CFX Connect Real-Time. Ten microliters qPCR reactions contained SensiFAST SYBR No-ROX qPCR (FroggaBio; Cat# BIO-98050), 200 nM of each of the forward and reverse primers, and 1 μL of diluted cDNA, diluted input, diluted IP ChIP or diluted DRIP DNA depending on the experiment. PCR was 1 cycle of 95°C for 5 min, 60°C for 30 sec, followed by 39 cycles of 95°C for 5 sec, 60°C for 30 sec, and a final melt curve of 65°C to 95°C in 0.5°C steps at 5 sec per step.
RNA extraction.
Cells grown to 70–80% confluence were washed with RNase-free PBS prior to RNA isolation using Qiagen RNeasy mini Kit (cat# 74104).
Reverse transcription.
For regular reverse transcription (RT), 1 μg of total RNA was treated with 1 μL of 10X DNase-I reaction buffer, 1 μL of DNase I Amp grade (1 U/μL; ThermoFisher; cat# 18068015) and incubated for 15 min at room temperature. The reaction was quenched with 1 μL of 25 mM EDTA and incubated for 10 min at 65°C. Ten microliter RT reactions were carried out using 10 mM dNTPs, 50 μM random nonamers (Sigma, cat# R7647), 500 ng total RNA, 5X First-Strand Buffer, 100 mM DTT, 40 U/μL RNaseOUT (Invitrogen; cat# 10777019) and 200 U/μL M-MLV reverse transcriptase (Invitrogen; cat# 28025013) at 25°C for 10 min, 37°C for 60 min, and 70°C for 15 min. For pre-rRNA pulse chase, an additional 5 min at 85°C step was added to release the RNA from beads. The RT reaction was diluted 1:5 and 4 μL were used in qPCR amplification. For strand-specific RT-qPCR (ss-RT), 30 μg of total RNA was DNase I-treated (10 U DNase I in a 100 μL reaction) for 30 min at 37°C. The reaction was stopped by adding 2 μL of 250 mM EDTA pH 8.0 and incubating at 75°C for 10 min. RNA was precipitated with 25 μL RNA precipitation solution (0.8 M trisodium citrate, 1.2 M NaCl) and 50 μL isopropanol. Samples were incubated 10 min at room temperature, 20 min at −20°C, and then centrifuged at 7,500 x g for 20 min at 4°C. Supernatants were aspirated and pellets were air dried for 10 min. Pellets were resuspended in 30 μL ddDEPC H2O and incubated at 65°C for 5 min. Concentrations of purified RNA were measured using NanoDrop. Strand-specific primers were designed to allow for the detection of sense and antisense transcripts at the same locus as described35. Briefly, ~18 bp primer was designed to recognize the strand of interest (e.g. reverse primer to detect sense transcripts, forward primer to detect antisense transcripts). A non-sense sequence (CGAGGATCATGGTGGCGAATAA) was added to tag the 5’ end of each strand-specific IGS primer. As a control within each reverse-transcription reaction, a reverse primer was generated to detect 7SK sense transcripts (a T7 sequence was added to the 5’ end of this primer to distinguish it from IGS primers). Separate reverse-transcription reactions were carried out for each transcript of interest. Each 10 μL reverse-transcription reaction had 200 ng of purified RNA, 5 μM strand-specific tagged primer (~18 bp specific to transcript of interest with nonsense sequence “CGAGGATCATGGTGGCGAATAA” added to 5’ end), 5 μM control sense primer (e.g. 7SK), 1mM dNTPs, 1X first-strand buffer, 10 mM DTT, 40 U RNaseOUT and 200 U of M-MLV-RT. False-prime reactions were also carried out for each RNA sample and were conducted by replacing the transcript of interest primers with DEPC ddH2O. Reactions were incubated at 25°C for 10 min, 37°C for 60 min, and 70°C for 15 min. Resulting cDNA was diluted 1 in 10. Each cDNA sample represents one strand-specific transcript of interest and 7SK sense transcripts as a control. Each cDNA sample was amplified using primers directed at the strand-specific transcript of interest (using ss_Tag and hIGS_F primers for sense transcripts or ss_Tag and hIGS_R primers for antisense transcripts), as well as 7SK (using T7 and 7SK F primers). False-primed cDNA was amplified using all primer sets. qPCR reactions were performed at 95°C for 5 min, 60°C for 30 sec, followed by 39 cycles of 95°C for 5 sec and 60°C for 30 sec. Results were analyzed using the following formula: ΔΔCt = 2^-(ΔCtMutant-ΔCtWT), where ΔCt = Ct(transcript of interest) - Ct(control). Values were normalized to those of false-prime reactions.
Population-level pre-rRNA pulse-chase.
Click-iT Nascent RNA capture (Invitrogen; Cat# C10365) was used. Cells were seeded in 6-well dishes at 500,000 cells/well and allowed to grow to 40–50% confluence. 24 h later, cells were incubated with 0.15 mM ethyl uridine (EU) for 1 h, followed by 2.5 h incubation with EU-free media. Total RNA was extracted using Qiagen RNeasy kit (Qiagen; Cat# 74104), and 1 μg of extracted RNA was incubated with 25 μL Click-iT EU buffer, 4 μL CuSO4, 1.25 μL Biotin azide, 1.25 μL Click-iT reaction buffer additive #1 for 3 min before addition of 1.25 μL Click-iT reaction buffer additive #2 and incubation for 30 min. The reaction mix was then incubated with 1 μL of UltraPure Glycogen (Roche; cat#10901393001), 50 μL of 7.5 M ammonium acetate, and 700 μL of chilled 100% ethanol at −80°C overnight. RNA was then pelleted using centrifugation at 13,000 x g for 20 min at 4°C and two rounds of washes with 700 μL of 75% ethanol. 1 μg of the RNA was then treated with 31 μL Click-iT RNA binding buffer, 2 μL RNaseOUT and incubated for 5 min at 68–70°C. The heated RNA binding reaction mix was incubated with 12 μL of washed beads suspension at room temperature for 30 min. The beads were washed five times with Click-iT reaction wash buffer #1 and five times with Click-iT reaction wash buffer #2. The beads were then resuspended with 12 μL of Click-iT reaction wash buffer #2 and incubated at 68–70°C for 5 min before proceeding with reverse transcription and qPCR. Processing was measured by qPCR assessing the levels of unprocessed pre-rRNA containing the 5’ETS to the total levels of mature rRNA.
Single cell rRNA biogenesis assay.
On the day prior to the assay, cells from different experimental conditions were harvested and seeded onto Poly-L-lysine (PLL)-coated coverslips in 24 well plates. On the day of the assay, live cells were pulse-labeled with 1 mM 5 fluorouracil (5-FU; Sigma; cat# F5130) for 15 min, gently washed with unlabeled media, and then chased for 30 min. Cells were then fixed and immunostained as described in the endogenous protein immunofluorescence section. Double immunofluorescence labeling of nucleolar fibrillar centres and 5-FU labeled RNA was performed using an anti-ATXN2 or anti-BrdU antibody, respectively. Random single cells were imaged captured at 100X using a Nikon C2+ Confocal microscope coupled to NIS-elements AR (Nikon). Images were equally and evenly contrasted and ribosome biogenesis was measured as the ratio of ATXN2-marked nucleolar fibrillar centers with surrounding rRNA rings over the total number of nuclear ATXN2 foci.
Nuclear run-on (NRO).
Click-iT Nascent RNA capture (Invitrogen; Cat# C10365) was used. Setup was similar to population-level pulse-chase labeling above with the exception that the total RNA was extracted after a 1 h incubation with 0.15 mM EU. Similar to pulse-chase labeling, the extracted RNA was biotinylated, precipitated, washed using Dynabeads, and reverse transcribed. qPCR was performed to measure nascent sincRNA synthesis.
DNA-RNA hybrid immunoprecipitation (DRIP).
For DNA-RNA hybrid immunoprecipitation experiments, cells were first seeded in 60 mm plates at 2.5×10⁶ cells/mL and allowed to grow to 70% confluence. Cells were then washed twice with ice-cold PBS, scraped, and centrifuged at 253 x g for 5 min. Cell pellets were resuspended in 1.6 mL TE and incubated with 41.5 μL 20% SDS and 5 μL proteinase K overnight at 37°C. Then, 1.6 mL of phenol-chloroform was added to cells before centrifugation at 466 x g for 5 min at room temperature. The aqueous layer was then transferred and the addition of phenol-chloroform was repeated. The DNA was then precipitated by adding 1/10 volume of 3 M NaOAc pH 5.2 and 2.4 volumes of 100% ethanol to the aqueous layer. The DNA fiber was washed five times with 70% ethanol, resuspended in TE and incubated with 3.5 μL spermidine (Bioshop; cat# SPR070), 35 μL buffer 2.1 (NEB), 5 μL HindIII (NEB; R01045), 10 μL EcoRI (Thermo Fisher; ERO271), 10 μL BsrGI (NEB; R05755), 5 μL XbaI (NEB; R01455), and 2 μL SspI (NEB; R0132). 40 μL of 3 M NaOAc pH 5.2 and 1 volume of phenol-chloroform was added to the digested DNA, which was then centrifuged at maximum speed for 5 min. The aqueous layer was transferred, and addition of phenol-chloroform was repeated. To precipitate the DNA, 2.4 volumes of cold 100% ethanol was added to the aqueous layer and incubated at −20°C for 15 min followed by centrifugation at max speed for 30 min at 4°C. The DNA pellet was washed with 70% ethanol and spun at max speed for 5 min at 4°C. The dry pellet was resuspended in 50 μL TE, and 4.4 μg of the DNA was incubated with 350 μL TE buffer, 50 μL 10X binding buffer ( 100 mM NaPO4 pH 7.0, 1.4 M NaCl, 0.5% (v/v) Triton X-100) and 10 μg of either mouse IgG or S9.6 antibody at 4°C overnight. IP samples were incubated with previously washed Dynabeads for 2 h at 4°C. Samples were then washed three times with 1X binding buffer and eluted off the beads by incubating with DRIP elution buffer (50 mM Tris-HCl pH 8.0, 10 mM EDTA, 0.5% (w/v) SDS) and proteinase K for 45 min at 55°C. The DNA was then purified using Gel/PCR DNA Fragment Extraction (Geneaid, Cat# DF300) and qPCR of purified DNA was performed. The specificity of the S9.6 antibody for RNA-DNA hybrids was confirmed by in vitro treatment with RNase H1 in all experiments. We also screen all antibodies for specificity by ensuring that signals do not exhbit any statistically significant changes following treatment with RNase III (NEB, Cat# M0245S). Following ChIP-qPCR analysis, background IgG mock signal was subtracted from S9.6 IP signal to generate a DRIP signal, which was then plotted as raw DRIP signal or as relative DRIP signal when normalized to a given site or condition.
Fluorescence recovery after photobleaching (FRAP).
HEK293T cells were transfected with a GFP-UBF1 plasmid 24 h before cell passaging to 2 cm glass-bottom live microscopy dishes. Next day, the ~75% confluent cells were treated with either flavopiridol to a final concentration of 2 μM or DMSO as control. Cells were incubated for 3.5 h and subjected to FRAP microscopy. Confocal microscopy was executed using a 100X/1.47 n.a. oil immersion lens on a Leica DMi8 motorized inverted microscope (Leica Microsystems) coupled to VT-iSIM multipoint scanner (VisiTech International) and detected with a Flash 4.0,v3 sCMOS camera (Hamamatsu). FRAP was performed utilizing the iLas FRAP system (Gattaca Systems). Design of the acquisition journals and system integration was by Quorum Technologies. Images were acquired with a 488 nm excitation wavelength laser at 15% intensity. Cells were initially imaged 20 times and the point of interest was subsequently bleached with a 405 nm laser for 36 ms at a laser intensity of 26%. Cells were then imaged repeatedly for approximately 1 min post-bleach to capture recovery. Signal intensity was measured using MetaMorph analysis software. For analysis, the intensity of the region of interest was normalized to a nucleoplasmic background region at every time point. These background-adjusted values were then normalized to the intensity value from the first time point. The bleach time points (6–6.3 sec) display saturated fluorescence as the bleached region of interest and were therefore not included in any quantification. Control focus intensity values post-bleach greater than 1 are a result of bleach-induced decreases in nucleoplasmic background.
RED LasRR system creation and use.
Full length human RNase H1 was fused to EGFP and the deactivated Streptococcus pyogenes Cas9 (with D10A and H840A mutations). The 5844 nucleotide RNaseH1-SV40NLS-EGFP-SV40NLS-dCas9 gene was synthesized and cloned into pcDNA4/TO (Invitrogen) using NotI and XbaI restriction sites. To ensure protein flexibility, a (GGGS)4 linker was inserted between RNase H1 and SV40NLS, and another between EGFP and SV40NLS. GGS linkers were also inserted between SV40NLS and EGFP, and between SV40NLS and dCas9. dCas9-EGFP-dRNaseH was generated by introducing the point mutation D210N to RNase H using the Q5® Site-Directed Mutagenesis Kit (NEB Cat# E055450) according to the manufacturer’s protocol, with a modification of a 15 min instead of 5 min incubation with the KLD Enzyme Mix at RT. The oligo sequences for PCR amplification are 5’-gttctgtatacaaacagtatgttt −3’ and 5’-cagtttattgatgttttgagtctt −3’. The resulting RNaseH1-SV40NLS-EGFP-SV40NLS-dCas9 (RED) or its RNase H1-dead version (dRED) was then integrated into the T-REx™ (ThermoFisher Scientific) tetracycline-controlled expression system. Inducible expression of the fusion proteins is thus based on the binding of tetracycline to Tet repressor, thereby derepressing the promoter controlling expression of the RED and dRED fusion protein. To achieve locus specific RED and dRED-LasRR enrichment, cells were allowed to reach 70% confluence over a period of ~24 h. For the inducible condition, cells were incubated with media containing Tetracycline (1 μg/mL) and for the uninduced condition, cells were incubated with tetracycline-free medium. All cells were transfected with 3 μg of RNH1-EGFP-dCas9 and dRED-LasRR plasmid per 60 mm plate by using Lipofectamine3000 (ThermoFisher) as per the manufacturer’s instructions. Induced cells were then co-transfected using RNAiMAX (ThermoFisher) as manufacturer’s instructions with either 4.5 μL of 10 pmol/μL of non-targeting sgRNA, 1.5 μL of 10 pmol/μL for each of three sgRNAs for IGS18, 1.5 μL of 10 pmol/μL for each of three sgRNAs for IGS28, 1.5 μL of 10 pmol/μL for each of three sgRNAs for IGS38, or 1.5 μL of 10 pmol/μL for each of three sgRNAs for Actin 5’ Pause. The cells were incubated for 36 h before further experiments were performed.
CRISPR-mediated genome editing.
For CRISPR-mediated gene knock-out of SETX, CRISPR/Cas9 plasmids (pCMV-Cas9-GFP) were purchased from Sigma-Aldrich to express with the scrambled guide RNA and guide RNA for SETX (first intron). The transfections of the plasmids into the Flp-In™ 293 T-REx™ cell lines were performed with FuGENE Transfection Reagent (Roche, Cat # E269A). 2 μg of the plasmid were transfected into HEK293 cells, and 1 day after transfection, cells were sorted by BD FACSAriaTM flow cytometry (Donnelly Centre, University of Toronto) and single GFP-positive cells were plated into 96-well plates. To confirm SETX KO, the expression level of SETX in each clone were detected by qPCR.
Northern Blotting.
RNA was DNase I treated and precipitated prior to Northern Blotting (see the section “Reverse Transcription” above or DNase I treatment conditions and RNA precipitation procedures). 3.5 μg of RNA was electrophoresized. DNA probe for Northern blot was DIG-labeled using DIG-High Prime DNA Labeling and Detection Starter Kit I as per manufacturer’s protocol (Roche; Cat# 11745832910). Northern blots were performed using DIG Northern Starter Kit as per manufacturer’s protocol (Roche; Cat# 12039672910) with the following modification: Electrophoresis was conducted at 15V for 24 h at room temperature; RNA was UV crosslinked (2400 kJ for 1 min) to a positively charged nylon membrane; gels were blotted by capillary transfer with 20X SSC buffer (3M NaCl, 0.3M sodium citrate) overnight; a hybridization temperature of 50°C was used; blots were hybridized overnight; and 200 μL of NBT/BCIP solution in 10 ml of detection buffer (0.1 M Tris-HCl pH 9.5, 0.1 M NaCl), was used for blot development.
DNA-RNA hybrid immunofluorescence (DRIF).
60,000 to 80,000 cells were seeded per PLL- coated coverslip and allowed to adhere for 24–36 h. Cells were fixed using 1% (v/v) formaldehyde for 15 min at RT, washed three times with 1x PBS for 5 min each, permeabilized with 500 μL of 0.3% (v/v) Triton-X100 for 5 min at RT, and washed again three times with PBS. Coverslips were blocked using 500 μL of 5% bovine serum albumin (BSA) for 1 h at room temperature and transferred to humidified chambers and incubated with 60 μL of primary antibody (1:500 of S9.6 antibody, 1% (w/v) BSA, 1X PBS) for 1 h at room temperature. After washing with PBS, cells were incubated with 60 μL of secondary antibody (1% BSA, 1:250 of Goat anti-mouse 488 or 1:250 of Goat anti-mouse 568) for 1 h at room temperature. The cells were washed again with PBS and incubated with 100 μL of DAPI (0.5 μL of DAPI per mL of PBS) for 2–4 min. The coverslips were then mounted onto microscope slides using DAKO mounting reagent, sealed with nail polish, and allowed to dry for 30 min. Images were acquired using a C2+ Confocal microscope with a Plan-Apochromat TIRF ×100 oil objective (NA 1.45) and NIS-Elements AR software (Nikon). The specificity of the S9.6 antibody for RNA-DNA hybrids was confirmed by in vitro treatment with RNase H1 (NEB; Cat# M0297S) under the same experimental conditions. Signals were also confirmed to differ from those yielded by immunofluorescence employing the anti-dsRNA J2 antibody.
A-body staining with Congo Red.
40,000 cells were seeded on PLL-coated coverslips and allowed to adhere for 24–36 h. Cells were fixed using 1% (v/v) formaldehyde and incubated for 15 min at room temperature, washed three times with 1X PBS for 5 min each, and permeabilized with 500 μL of 0.3% (v/v) Triton-X100 for 5 min at room temperature. The coverslips were then immersed in 250 μL of 0.05% (v/v) Congo Red (Sigma; Cat# C6277) solution for 15 min, followed by four cycles of 2 min rinsing with 500 μL of ddH2O. The coverslips were then transferred to humidified chambers and nuclear counterstained with 100 μL DAPI, incubated for 4 min, and mounted on microscope slides using DAKO mounting reagent. Images were acquired using a C2+ Confocal microscope with a Plan-Apochromat TIRF ×100 oil objective (NA 1.45) and NIS-Elements AR software (Nikon).
Endogenous protein immunofluorescence.
40,000 cells were seeded onto PLL-coated coverslips. Cells were fixed using 1% formaldehyde for 15 min at room temperature, washed with 1X PBS three times (5 min each wash), permeabilized with 500 μL of 0.3% Triton-X100 for 5 min at room temperature, and washed again three times with 1X PBS. Coverslips were blocked using 500 μL of 5% BSA for 1 h at room temperature and transferred to humidified chambers and incubated with 60 μL of primary antibody (1% BSA and anti-UBF or anti-NPM antibodies) for 1 h at room temperature. After washing with PBS, cells were incubated with 60 μL of secondary antibody (1% BSA, 1:250 of goat anti-mouse 488, 1:250 of goat anti-rabbit 568) for 1 h at room temperature. Coverslips were washed again with PBS, incubated with 100 μL DAPI for 2 min, mounted onto microscope slides using DAKO mounting reagent, and allowed to dry for 30 min. Images were captured at 100X or 60X using a Nikon C2+ Confocal microscope coupled to NIS-elements AR (Nikon). For MeOH/Acetone fixation-based immunofluorescence, the protocol was similar except that cells were fixed using ice cold methanol for 15 min at room temperature, washed once with cold acetone, and washed with 1X PBS (3 × 5 min) before blocking with 5% BSA.
Stress-induced nucleolar droplets and amyloid bodies.
The amyloid-converting motif (ACM)-containing VHL protein was transfected as pFLAG-VHL-GFP using Lipofectamine 3000 according to the manufacturer’s protocol and treated/visualized 24h post-transfection. For siRNAs (100 pmol), cells were transfected using RNAiMAX (ThermoFisher Scientific) at 90% confluency, split next day into fresh plates at 70% confluency to allow for subsequent GFP transfection with Lipofectamine 3000 and treated/harvested 48h post-transfection. The siRNAs (ThermoFischer Scientific) used were siControl (Cat#4390843), si-sincRNA16 (Cat#4399666) and si-sincRNA22 (Cat#4390828). For live-cell imaging of the ACM-containing and GFP-tagged VHL protein, cells were seeded in 145 μm thick 35 mm glass-bottom plates. Live-cell images were captured by confocal microscopy (Leica TCS SP5; Leica Microsystems, Mannheim, Germany), fitted with a variable temperature and 5% CO2 environmental chamber (Okolab), using a 63x Plan-Apochromat/1.4 NA oil immersion objective. Images were uniformly adjusted to increase brightness/contrast in Photoshop (Adobe).
In vitro droplet formation.
Peptides were custom synthesized by GenScript (New Jersey, USA) at >95% purity. Peptide stock solutions were kept at 50 mM in nuclease-free-water. 5’-FAM labelled RNA were synthesized by Integrated DNA Technologies (IDT, Coralville IA) and resuspended in 50 mM NaCl to 100 μM. 1 μM low or high complexity ncRNA were mixed with indicated peptide concentrations in 150 mM NaCl. Droplets were placed on a 1.5 coverslip and imaged after a 10 min incubation on a Zeiss AxioObserver D1 microscope using a 63x Plan-Apochromat/1.4 NA objective.
LNA ASO Knockdown of sincRNAs.
Custom designed LNA ASO GapmeRs were custom ordered from Qiagen. 975 to 1000 BP sequences corresponding to IGS regions were entered into Qiagen’s custom antisense LNA GapmeR design page. The top ranked ASO based on Qiagen’s optimal design score were selected for each of the following regions: IGS18, IGS20, IGS22 and IGS24 with standard desalting purification, phosphorothioate backbone modifications, with NO label/ready-to-label design specifications. ASO transfection was performed using RNAiMAX (ThermoFisher Scientific) according to the manufacturer’s protocols. ASOs were as follows: Antisense LNA GapmeR control Negative Control B (Cat# 339515 LG0000001-DDA; gctcccttcaatccaa), IGS18 (Cat#339511 LG00210930-DDA; agtgtgctctgtgaac), IGS20 (Cat#339511 LG00210936-DDA; acgcaagaaaggaaga), IGS22 (Cat#339511 LG00210956-DDA; acgtgaccgagagaaa), and IGS24 (Cat#339511 LG00210966-DDA; gtgacgtgtagagatt).
Subcellular fractionation by sucrose gradient.
Cells were trypsinized, centrifuged at 1,000 rpm for 4 min at 4°C, washed with PBS and recentrifuged. The pellet was resuspended in osmotic buffer (10 mM Hepes pH7.9, 1.5 mM MgCl2, 10 mM KCl, 0.5 mM DTT). The cells were then lysed using 10 strokes of tight pestle in a dounce homogenizer. Dounced cells were centrifuged at 1000 rpm for 5 min at 4°C. The supernatant was retained as the cytosolic fraction. The pellet was resuspended in a 0.25 M Sucrose and 10 mM MgCl2 solution, and deposited over a 0.35 M Sucorse, 0.5 mM MgCl2 layer. The sample was centrifuged at 1,000 rpm for 5 min at 4°C. The sample was then resuspended in a 0.25 M Sucrose, 10 mM MgCl2 solution then sonicated at 25% power six times for 10 sec with intermittent periods of 10 sec rest on ice. The sample was deposited over a 0.88 M Sucrose, 0.5 mM MgCl2 layer and centrifuged at 3,500 rpm for 10 min at 4°C. The supernatant was retained as the nucleoplasmic fraction. The pellet was resuspended in a 0.35 M Sucrose, 0.5 mM MgCl2 solution and centrifuged at 3,500 rpm for 5 min at 4°C. The pellet was the nucleolar fraction. GAPDH transcripts, which are most abundant in the cytosolic fraction and are depleted from the nucleolar fraction, served as control.
Pipeline for aligning sequencing reads to human rDNA IGS.
First, a version of the human genome build hg19 with rDNA sequence is built using the Bowtie package. The newly built genome assembly is called “hg19_plus_rDNA”. The human rDNA sequence FASTA file is obtained as is from NCBI. U13369.1 is the GenBank Accession ID and refers to the “Human ribosomal DNA complete repeating unit” as can be seen on NCBI. This FASTA file along with those from Chr 1–22, X, Y & M from hg19 obtained from UCSC are used to build the new assembly. Next, for testing, HeLa Pol II reads are aligned to this new genome assembly using the Bowtie package aligner. The reads from two replicates are obtained from ENCODE and concatenated. Duplicate reads are removed with the package BBmap and its clumpify tool. Then, the alignment is performed with the parameter “-m 1” that instructs bowtie to refrain from reporting any alignments for reads having more than 1 reportable alignment. This ensures that only uniquely aligning reads are reported. The alignments are processed further with Samtools to retain only the reads aligning to the rDNA sequence, and to compute the depth/number of reads at each position in the rDNA coordinates. These depths are plotted with an R script.
GC skew calculation.
Using the ~43K bp rDNA sequence obtained from the rDNA sequence FASTA file, GC skew, CG observed/expected ratio and GC% were assessed using (1 bp-at-a-time) sliding windows of size 50, 500 or 1000 bp. Definitions: GC skew = (number of Gs - number of Cs)/(number of Gs + number of Cs); CG observed/expected ratio = sliding window length * number of CpGs / (number of Cs X number of Gs); GC % = 100*(number of Gs + number of Cs)/sliding window length. To obtain an overall value/quantification and statistic to compare coding and IGS region, the mean GC skews for the coding and IGS regions with window size 1000 were obtained. In the coding region, the mean GC skew is 0.02346459 and in IGS it is −0.1541796. Doing a Welch t-test on the GC skews from these two regions gives a p-value < 2.2×10⁻¹⁶. Script for all above analyses is called getGCskewEtc_rRDNA.R and is available upon request.
Sequencing.
For Ewing- and osteosarcoma-related analyses, sample preparation and sequencing were done as described26. RNA-sequencing and DRIP-sequencing data sets have been deposited at Gene Expression Omnibus (GEO) with accession code GSE68847. Identification of rDNA IGS peaks from RNA-seq and DRIP-seq were conducted as per the above described pipeline including a normalization of called peaks to the total number of reads per sample. To assess signals at non-rDNA loci, aligned .bam files were depth normalized and binned using bamCoverage from deepTools36. The resulting bigWig files were loaded into Integrated Genome Viewer37 and the depicted regions were saved. For RNA-seq with/without heat shock, sequencing was performed on a non-ribosomal RNA depleted cDNA library of total RNA using stranded paired-end reads. After discarding reads mapped to the rRNA gene (including 5’ETS, IRS1/2, and 3’ETS), the remaining reads were mapped to GRCh38. BAM files were separated into forward and reverse strand files (bash script). The remaining reads aligned to supercontig GL000220.1 that is within the latest human genome assembly that contains a 43 kb ribosomal DNA cassette. Signals are normalized to an internal non-stress responsive control site at IGS35. To calculate changes in sincRNA and asincRNA levels following heat shock, the IGS was binned into 5000 bp bins, and the change in absolute read counts was calculated for each bin. The average of these changes was calculated to obtain a global percent change across the entire IGS. The sequencing data are available at GEO with the accession code GSE115731. ChIP-seq enrichments were generated by ENCODE Project Broad Institute for H3K27ac, H3K9ac, H3K4me3 and H3K36me3 and ENCODE Project SYDH for RNA pol II ChIP-seq. Briefly, bedGraph files previously generated38 by mapping ChIP-seq and input data from Encode Project Consortium 2012 to the human rDNA sequence from BAC clone GL000220.1, were used to generate IGV genome tracks. We note that qPCR and sequencing analyses of repetitive DNA loci reveal an average profile for the studied repeats and should not be interpreted as an absolute enrichment for any given unit within the repeats.
Transmission Electron Microscopy.
Cell pellets were fixed in Phosphate Buffered 4% Formaldehyde - 1% Glutaraldehyde Fixative for at least 2 hours. Samples were subsequently rinsed in 0.1 M Phosphate buffer for 5 min and then fixed in 1% Zetterqvist’s buffered Osmium Tetroxide for 1 hour. After a short rinse in Zetterqvist’s buffer for 1 min, the samples were dehydrated in increasing concentrations of alcohol (70%, 95%, 100%) for 10 min followed by Propylene oxide. Finally, pellets were embedded in epoxy resin. Ultrathin sections were contrasted with uranyl acetate and Reynold’s lead citrate and observed with a JEOL 1230 TEM equipped with an AMT (Advanced Microscopy Techniques) camera system.
Images of human tumour sections.
H&E-stained tumour section images were obtained through Sinai Health System (Toronto) without any identifiable personal health information and without personal information, following institutional Research Ethics Board approval (Sinai Heath Systems, 17–0103-E).
Statistical analysis.
GraphPad Prism-based calculations of P values via the t-test, the one-way ANOVA (with Dunnett’s or Tukey’s multiple comparison test), or the Mann-Whitney U test. Unless otherwise indicated, replicate information is as follows. All data from pulldowns, RT, and viability markers were generated using the indicated number of biological replicates. For blots, images are representative of data obtained from two independent biological replicates. For microscopy, images are representative of phenotypes observed in at least two independent biological replicates and quantifications were based on at least 100 cells from two technical replicate cultures.
Code availability.
All scripts used to analyse data are available upon request.
Reporting summary.
Further information on research design is available in the Nature Research Reporting Summary linked to this paper.
Extended Data
Extended data Fig. 1 |. Additional characterization of Pol I and Pol II occupancies at rDNA IGSs.
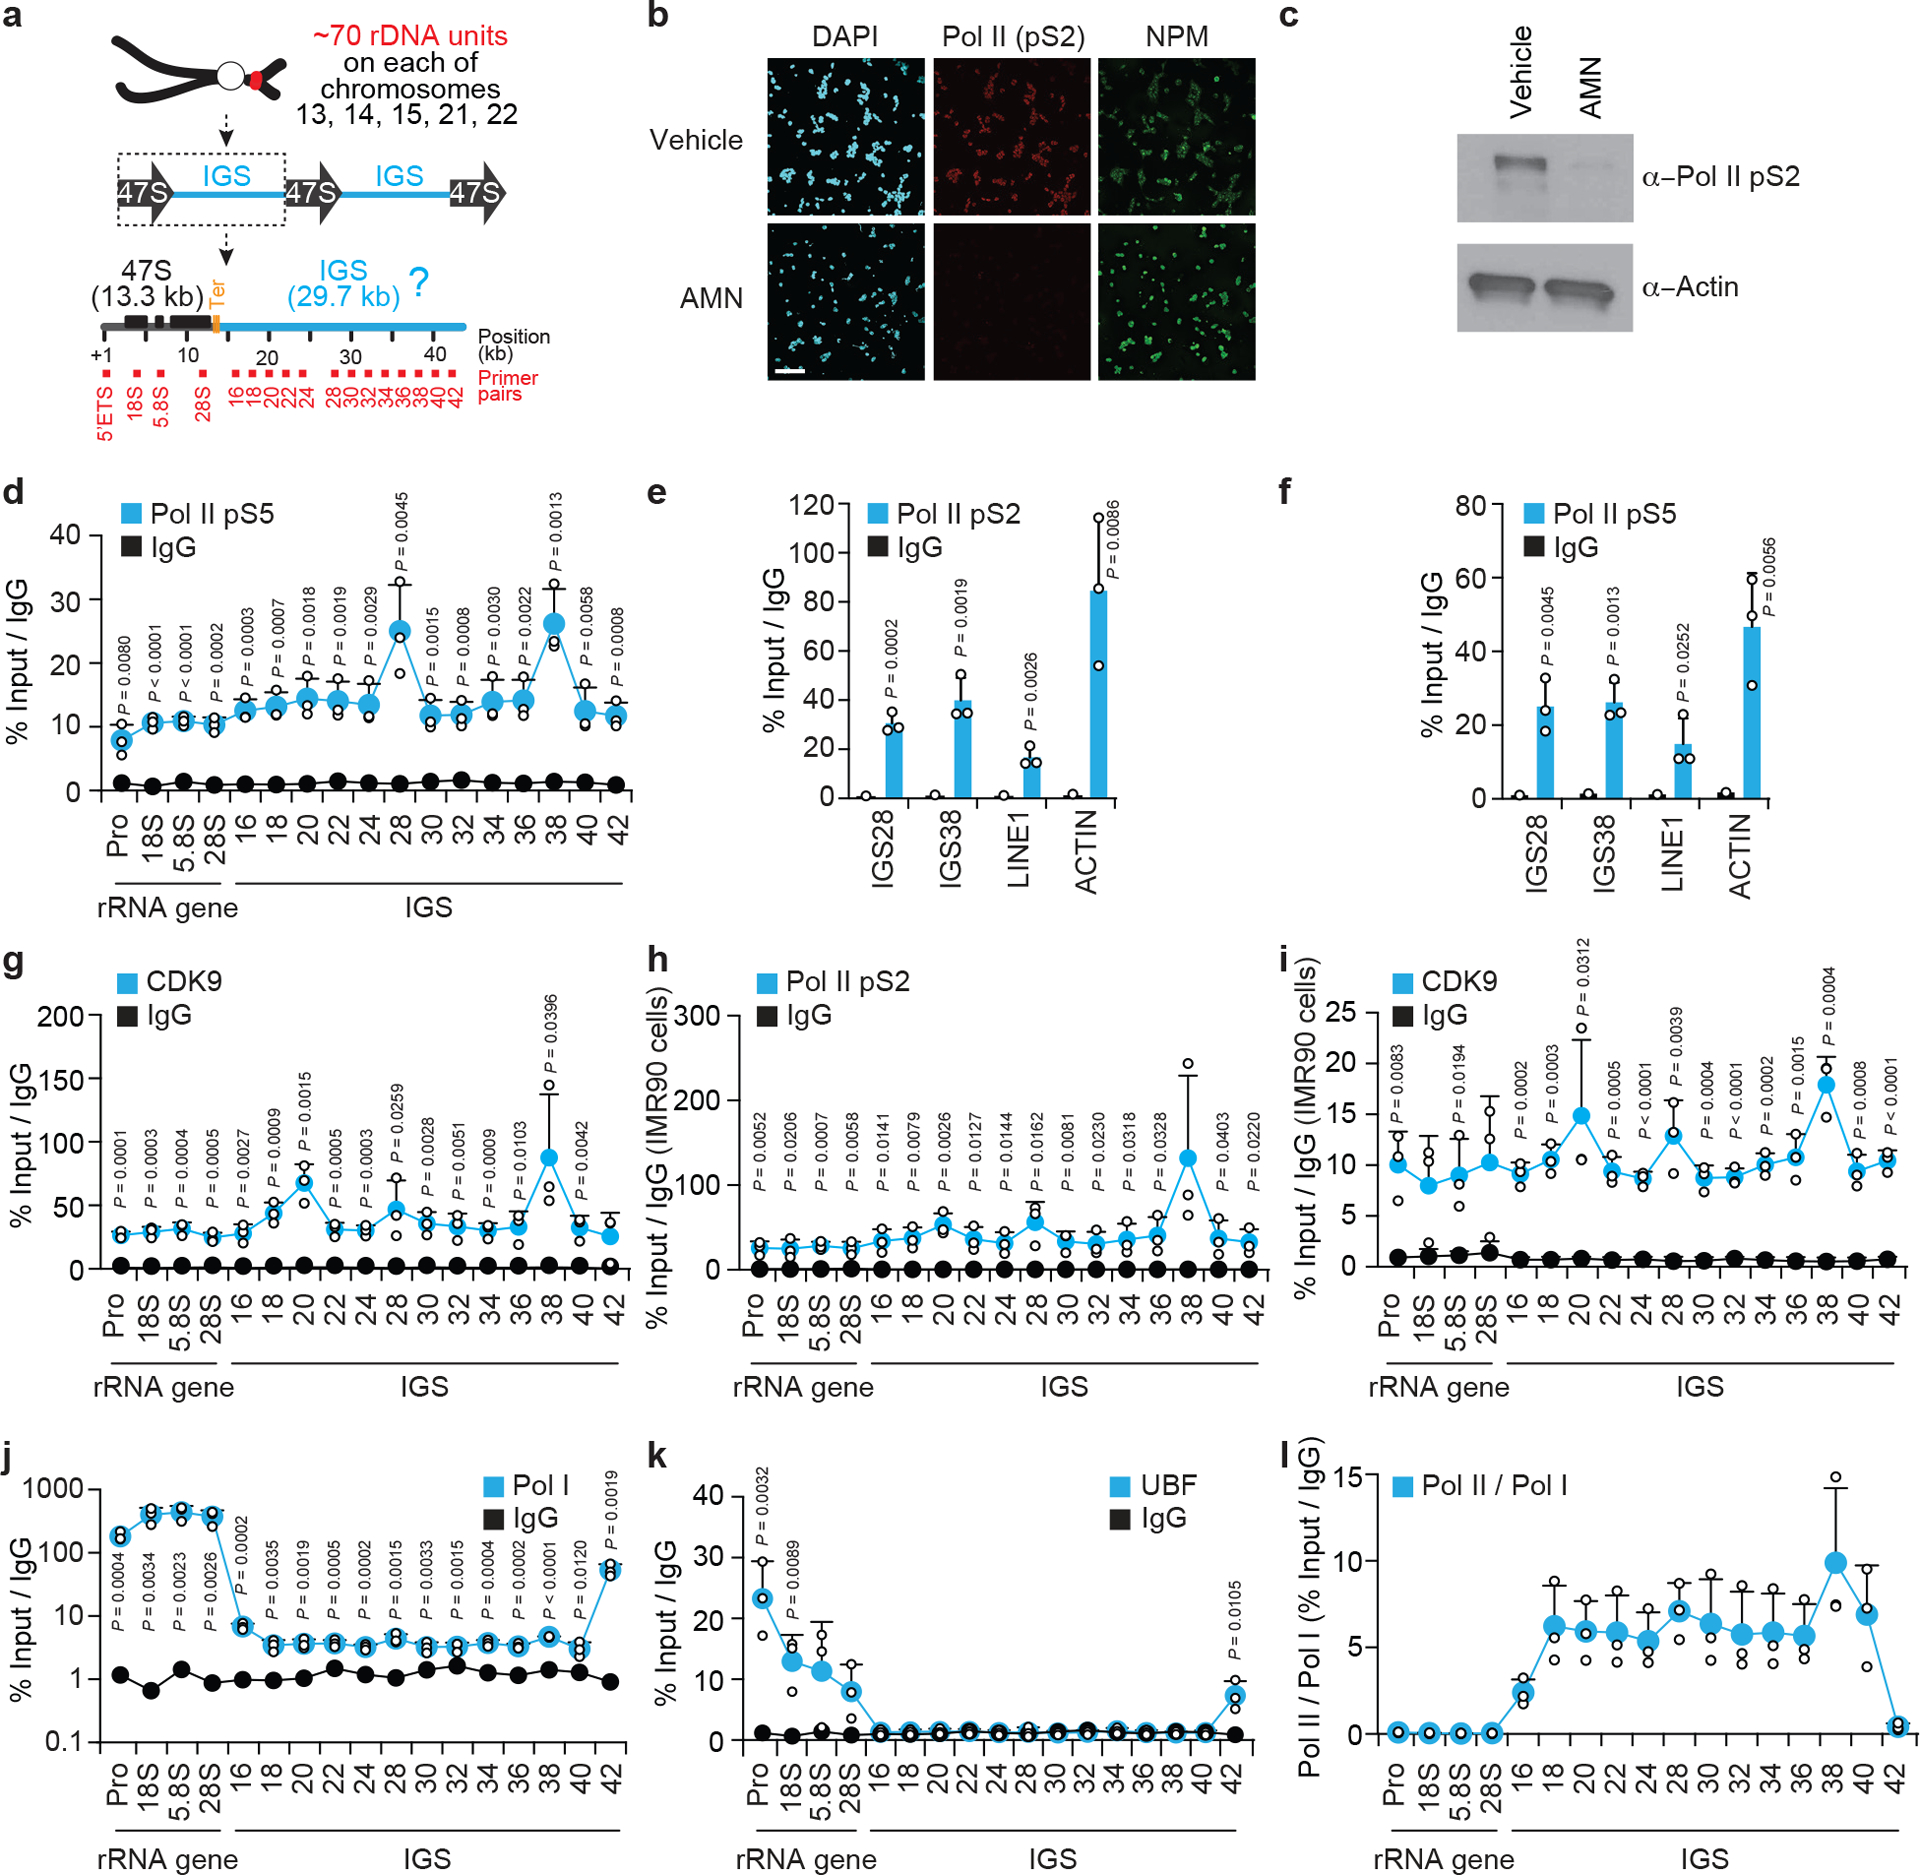
(a) Organization of human rDNA repeats. At each rDNA unit, Pol I transcribes an rRNA gene encoding a 47S pre-rRNA that is processed to remove transcribed spacers, such as the 5’ ETS, and generate 18S, 5.8S, and 28S rRNA molecules. The IGS constitutes the bulk of each rDNA unit. (b-c) Specificity controls indicating that targeting Pol II for degradation with a 12 h α-amanitin treatment does lower anti-Pol II (pS2) signals in both immunofluorescence (b) and immunoblotting (c). For gel source data, see Supplementary Figure 1. (d) ChIP showing Pol II-pS5 enrichment across rDNA. (e-f) The enrichment of active Pol II forms at rDNA IGS sites is higher than at LINE1 but lower than at β-ACTIN. (g-k) ChIP experiments showing the enrichment of indicated proteins across rDNA. (l) Comparison of the enrichment of RNA Pol II and Pol I across rDNA reveals the relative overrepresentation of Pol II across IGSs only. (b-l) HEK293 (b-g,j-l) or IMR90 (h,i) cells were used; data are shown as the mean±s.d.; two-tailed t-test, n=3 biologically independent experiments (d-l); images in (b-c) are representative of two independent experiments. Data in (d-f,j-l) and Fig. 1b were from large experimental sets sharing IgG controls. Data in (h,i) were from large experimental sets sharing IgG controls.
Extended data Fig. 2 |. Impact of Pol I and Pol II on IGS ncRNA levels in various cell types.
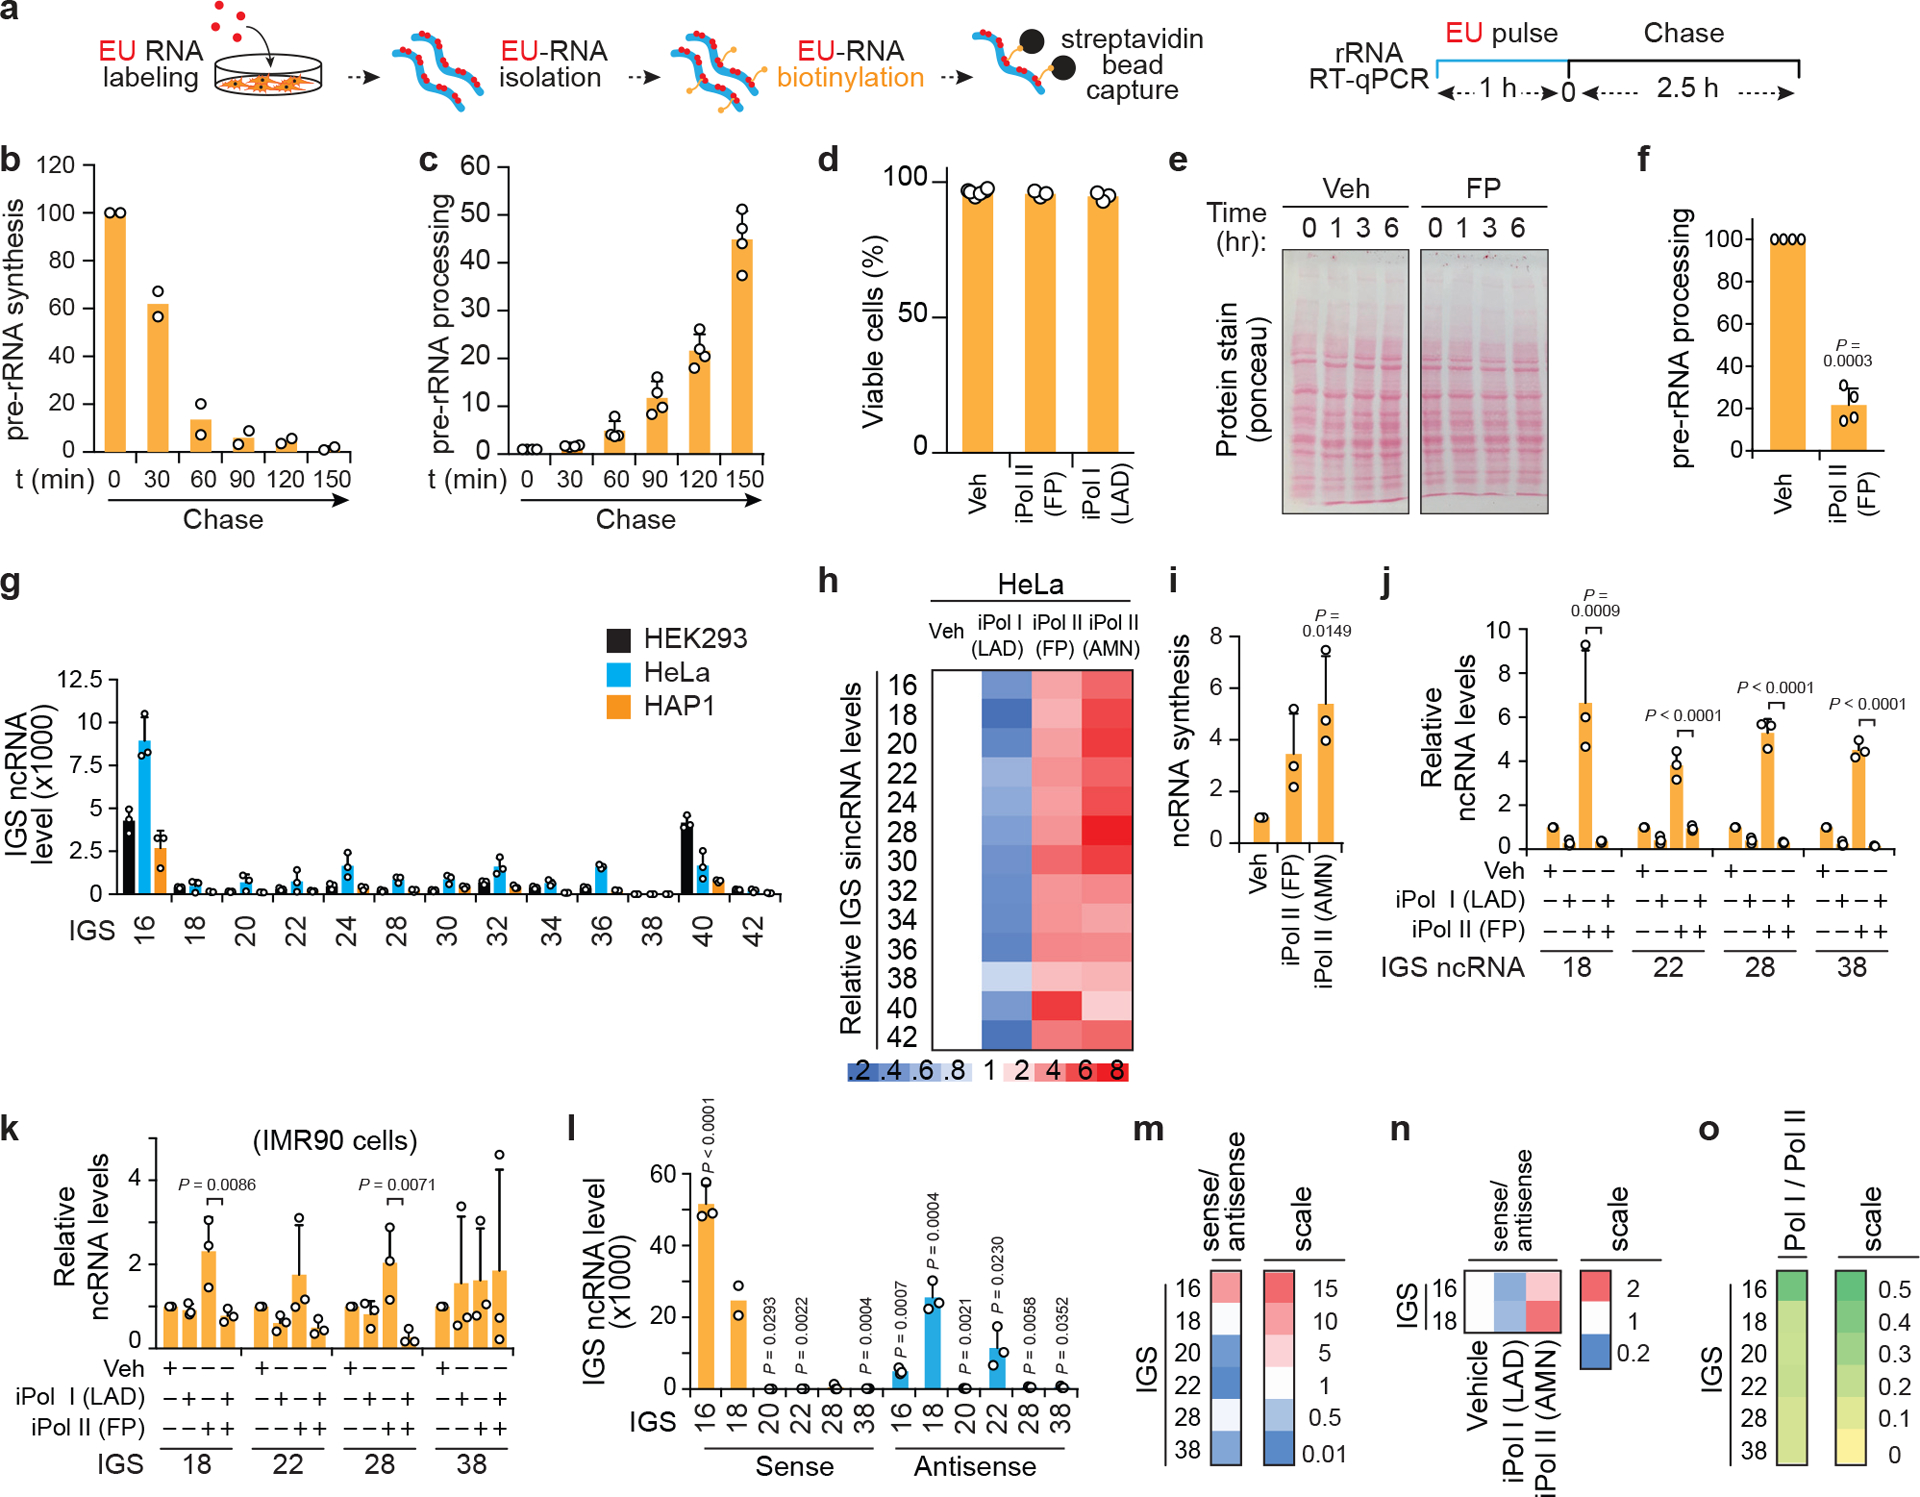
(a) Cell population-based RNA pulse-chase assay used to assess pre-rRNA synthesis and processing. (b-c) Confirmation of the detection of pre-rRNA synthesis and processing by EU-RNA pulse-chase assays as shown in Fig. 1e,f. (d) Trypan blue exclusion assay confirms that our 3 h long Pol II inhibition regimens used in functional assays do not compromise cell viability. (e) Ponceau stain shows stable protein levels following Pol II inhibition. (f) Treatment with the fast-acting RNA Pol II inhibitor flavopiridol (FP) for 30 min is sufficient to abrogate pre-rRNA processing. (g) Human IGS ncRNAs are also detected across the IGSs of diploid HeLa cells and haploid HAP1 cells. (h) Pol I promotes and Pol II represses IGS ncRNAs in HeLa cells. (i) Nuclear run-on assay showing Pol II inhibition-mediated de novo IGS ncRNA synthesis. (j,k) RT showing the effect of combining Pol I and Pol II inhibition on IGS ncRNAs in HEK293 cells (j) and IMR90 cells (k). (l-m) Strand-specific RT-qPCR (ss-RT) showing the levels of sense and antisense intergenic ncRNAs (l) and their derived sense/antisense ratio (m) at various IGS sites. (n) ss-RT shows that Pol I inhibition decreases and Pol II inhibition increases the sense/antisense ratio of the most abundant IGS ncRNAs. (o) Despite the preferential enrichment of Pol II over Pol I across IGSs, Pol II is the least overrepresented relative to Pol I closer to IGS16 compared to all other IGSs tested. (a-o) HEK293 cells unless otherwise indicated; data are shown as the mean±s.d.; two-tailed t-test (b-d,f) or one-way ANOVA with Dunnett’s multiple comparison test (g,i-k); n=2 biologically independent experiments (b), n=4 biologically independent experiments (c,f), and n=3 biologically independent experiments (d, g-o) except sense IGS18 for which n=2 biologically independent samples (l,m); image in (e) is representative of two independent experiments.
Extended data Fig. 3 |. Characteristics of nucleoli and nucleolar proteins in the presence or absence of Pol II inhibition.
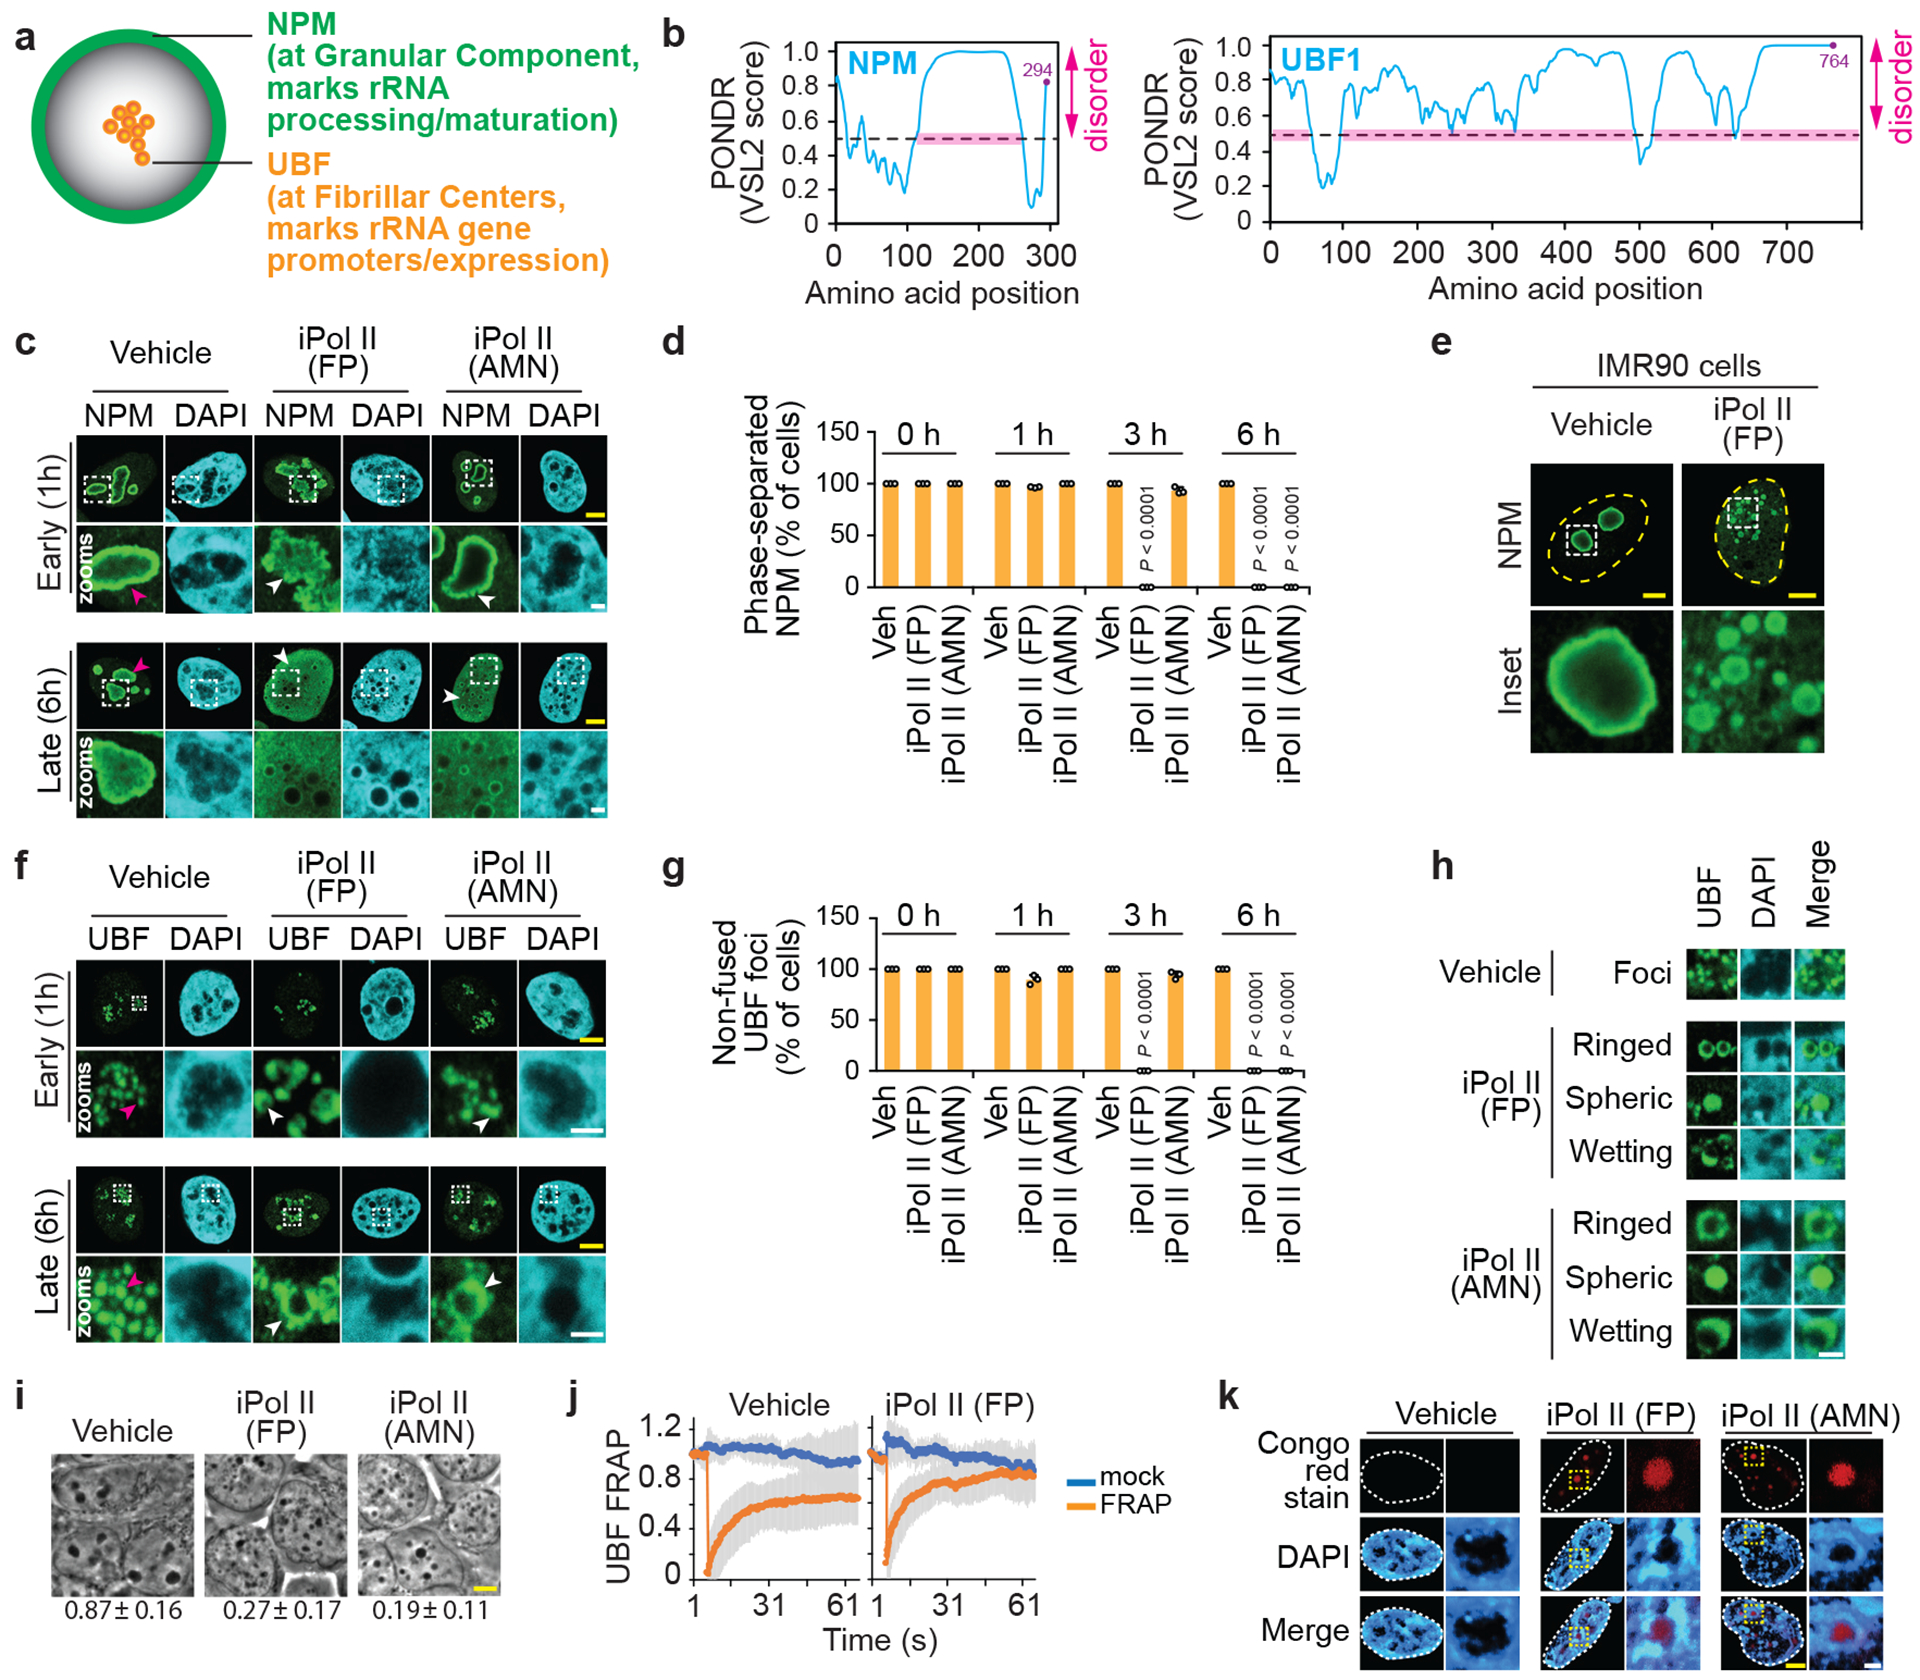
(a-b) Schematic of a nucleolus illustrating the localization of liquid-liquid phase-separated nucleolar subcompartments marked by the resident proteins NPM and UBF (a), which are highly disordered as revealed using the predictor of natural disordered regions (PONDR) algorithm (b). (c) Effects of Pol II inhibition on NPM localization shown by immunofluorescence microscopy. Examples of normal and defective phenotypes are respectively marked by magenta and white arrowheads. (d) Quantification of the percentage of cells that have any NPM phase-separated body revealed that the fast-acting Pol II inhibitor flavopiridol (FP) completely disrupts nucleoli before the slower-acting Pol II inhibitor α-amanitin (AMN). Not depicted on the graph, is the percentage of cells with perturbed nucleolar architecture as evidenced by NPM1 ruffling, which increased from 0.6±4.6% to 63.3±5.7% following the 1 h FP treatment. (e) Pol II inhibition also disrupts NPM localization in IMR90 cells. (f) Effects of Pol II inhibition on UBF localization shown by immunofluorescence microscopy. Examples of normal and defective phenotypes are respectively marked by magenta and white arrowheads. (g) Quantification of the percentage of cells that have any punctate UBF localization confirmed that the fast-acting FP completely disrupts nucleoli before the slower-acting AMN. (h) Pol II inhibition triggers various aberrant UBF localization phenotypes as shown in representative images. (i) Global nucleolar disruption following Pol II inhibition as revealed by phase contrast microscopy. The fraction of the cells with more than three black nucleolar bodies is indicated. (j) Live-cell UBF fluorescence recovery after photobleaching (FRAP). Mock control cells were continuously imaged without a photobleaching step. FRAP FP/Vehicle rate constant ratio = 2.3. (k) Formerly nucleolar space became Congo Red positive after Pol II inhibition. (c-k) HEK293 cells were used unless otherwise indicated; data are shown as the mean±s.d.; one-way ANOVA with Dunnett’s multiple comparisons test, n=3 biologically independent experiments (d, g) or n=5 biologically independent experiments (i); For (j), vehicle FRAP cells n=30, vehicle control cells n=4, FP FRAP cells n=15, and FP control cells n=6; images in (e,h,k) are representative of two independent experiments. Scale bars, 5 μm (yellow) or 1 μm (white).
Extended data Fig. 4 |. Heat shock limits asincRNAs and triggers sincRNA-dependent nucleolar phase transitions.
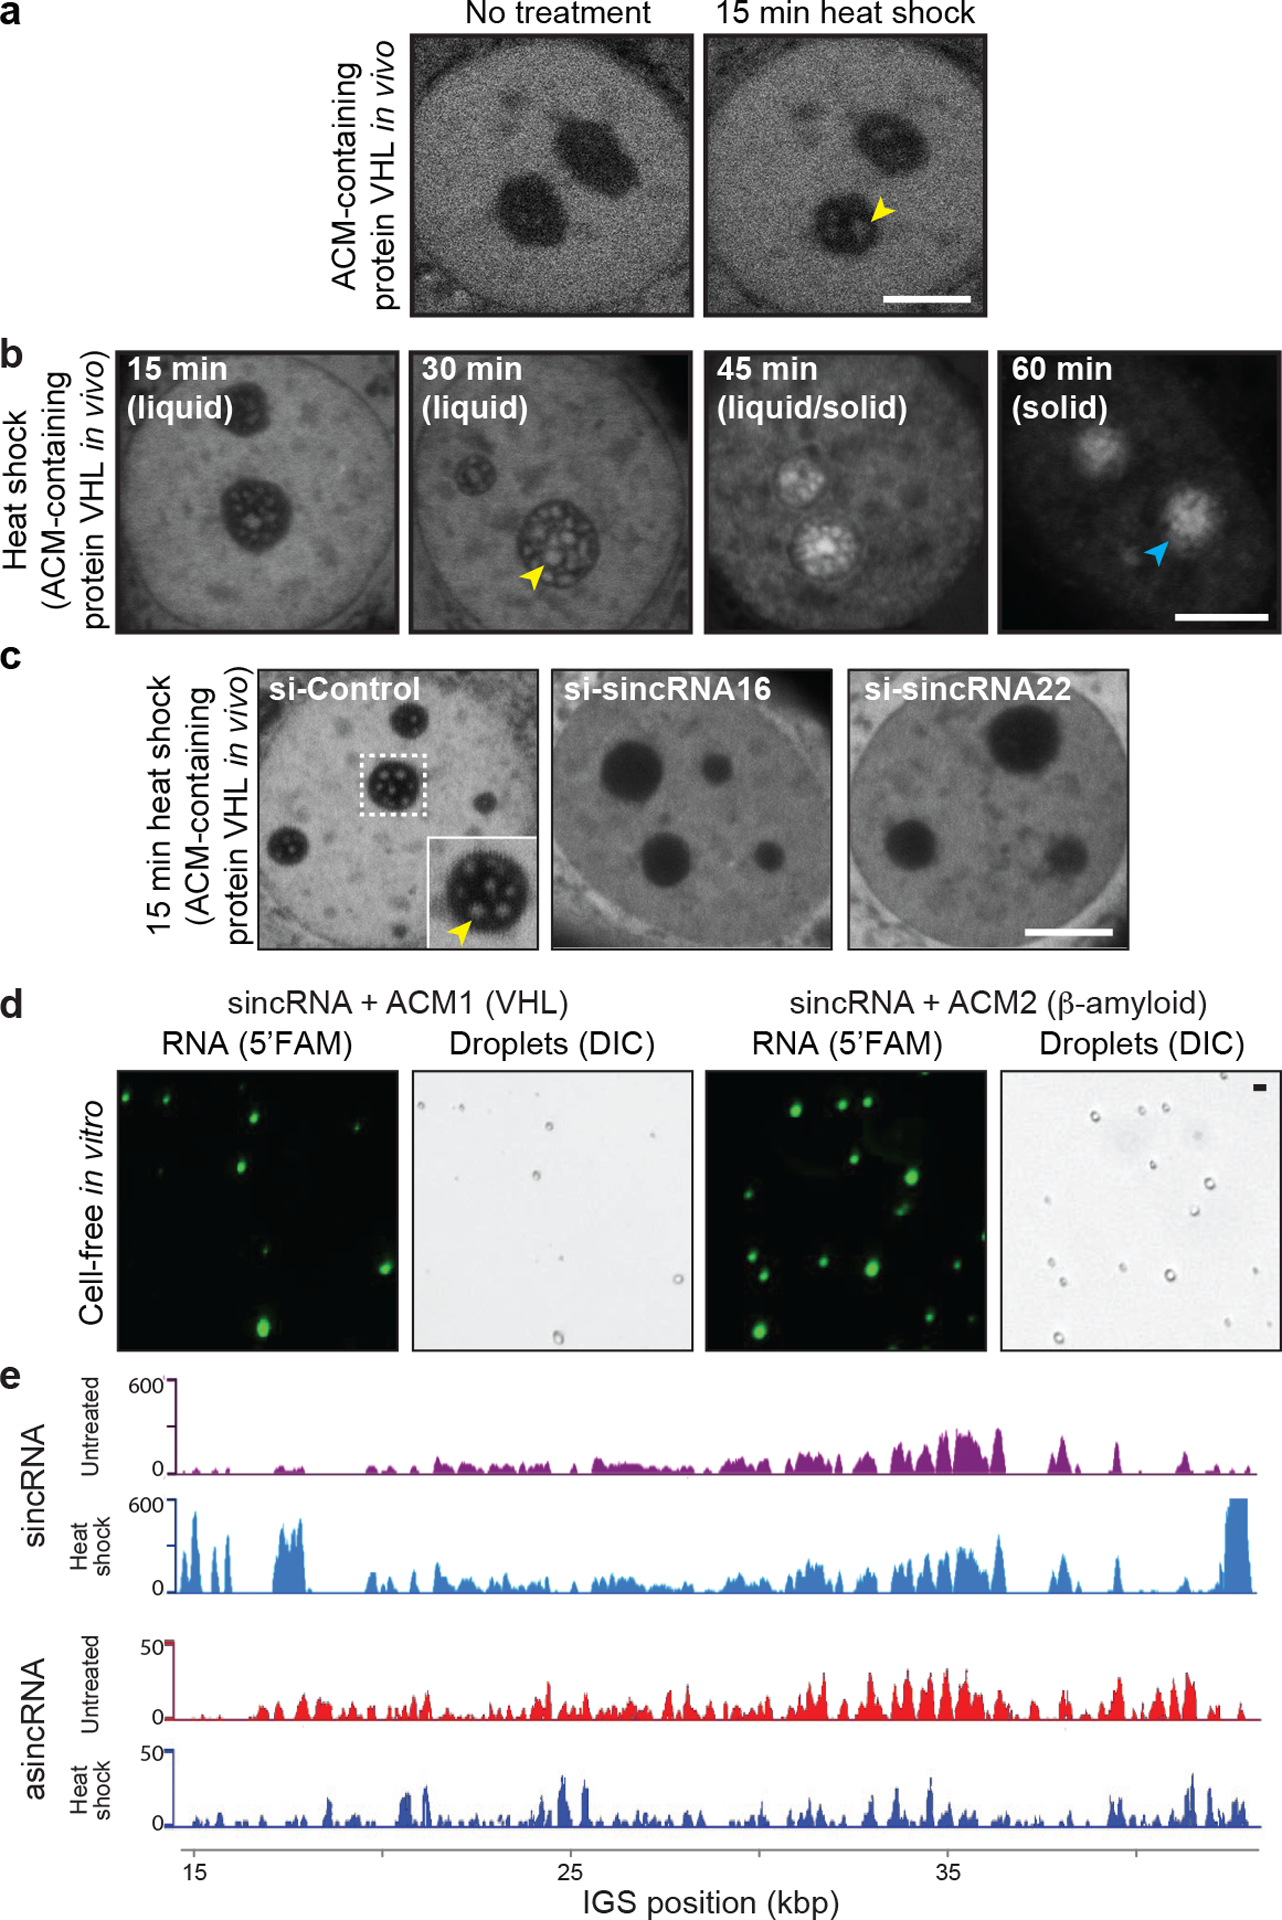
(a) Heat shock (43°C) rapidly induces the formation of intranucleolar liquid droplets harbouring the amyloid-converting protein motif (ACM)-containing VHL protein. (b) Gradual amyloid body (A-body) formation. The stress-induced, mobile, and spherical liquid-like foci (yellow arrowhead) gradually transition into irregularly shaped solid-like amyloid bodies (cyan arrowhead) in cells subjected to heat shock (43°C)19. (c) The appearance of early stage ACM-marked liquid-like foci18,19 in cells subjected to a 15 min heat shock treatment is abrogated upon siRNA-mediated knockdown of either sincRNA16 or sincRNA22. (d) In a cell-free in vitro system, the low-complexity sincRNA forms liquid droplets when mixed with the ACM of human VHL or β-amyloid proteins. Droplets were detected using fluorescently labelled RNA (5’FAM) and differential interference contrast (DIC). (e) Strand-specific RNA-seq (ss-RNA-seq) reveals that sincRNA levels increase while asincRNA levels decrease across the IGS following a 30 min heat shock. Heat shock increases sincRNA levels by 607% and decreases asincRNA levels by 38%. (a-e) Nucleolar stress hyper-responsive MCF7 cells were used where applicable; images are representative of two independent experiments; scale bars, 5 μm.
Extended data Fig. 5 |. Artificial and natural modulation of sincRNA levels.
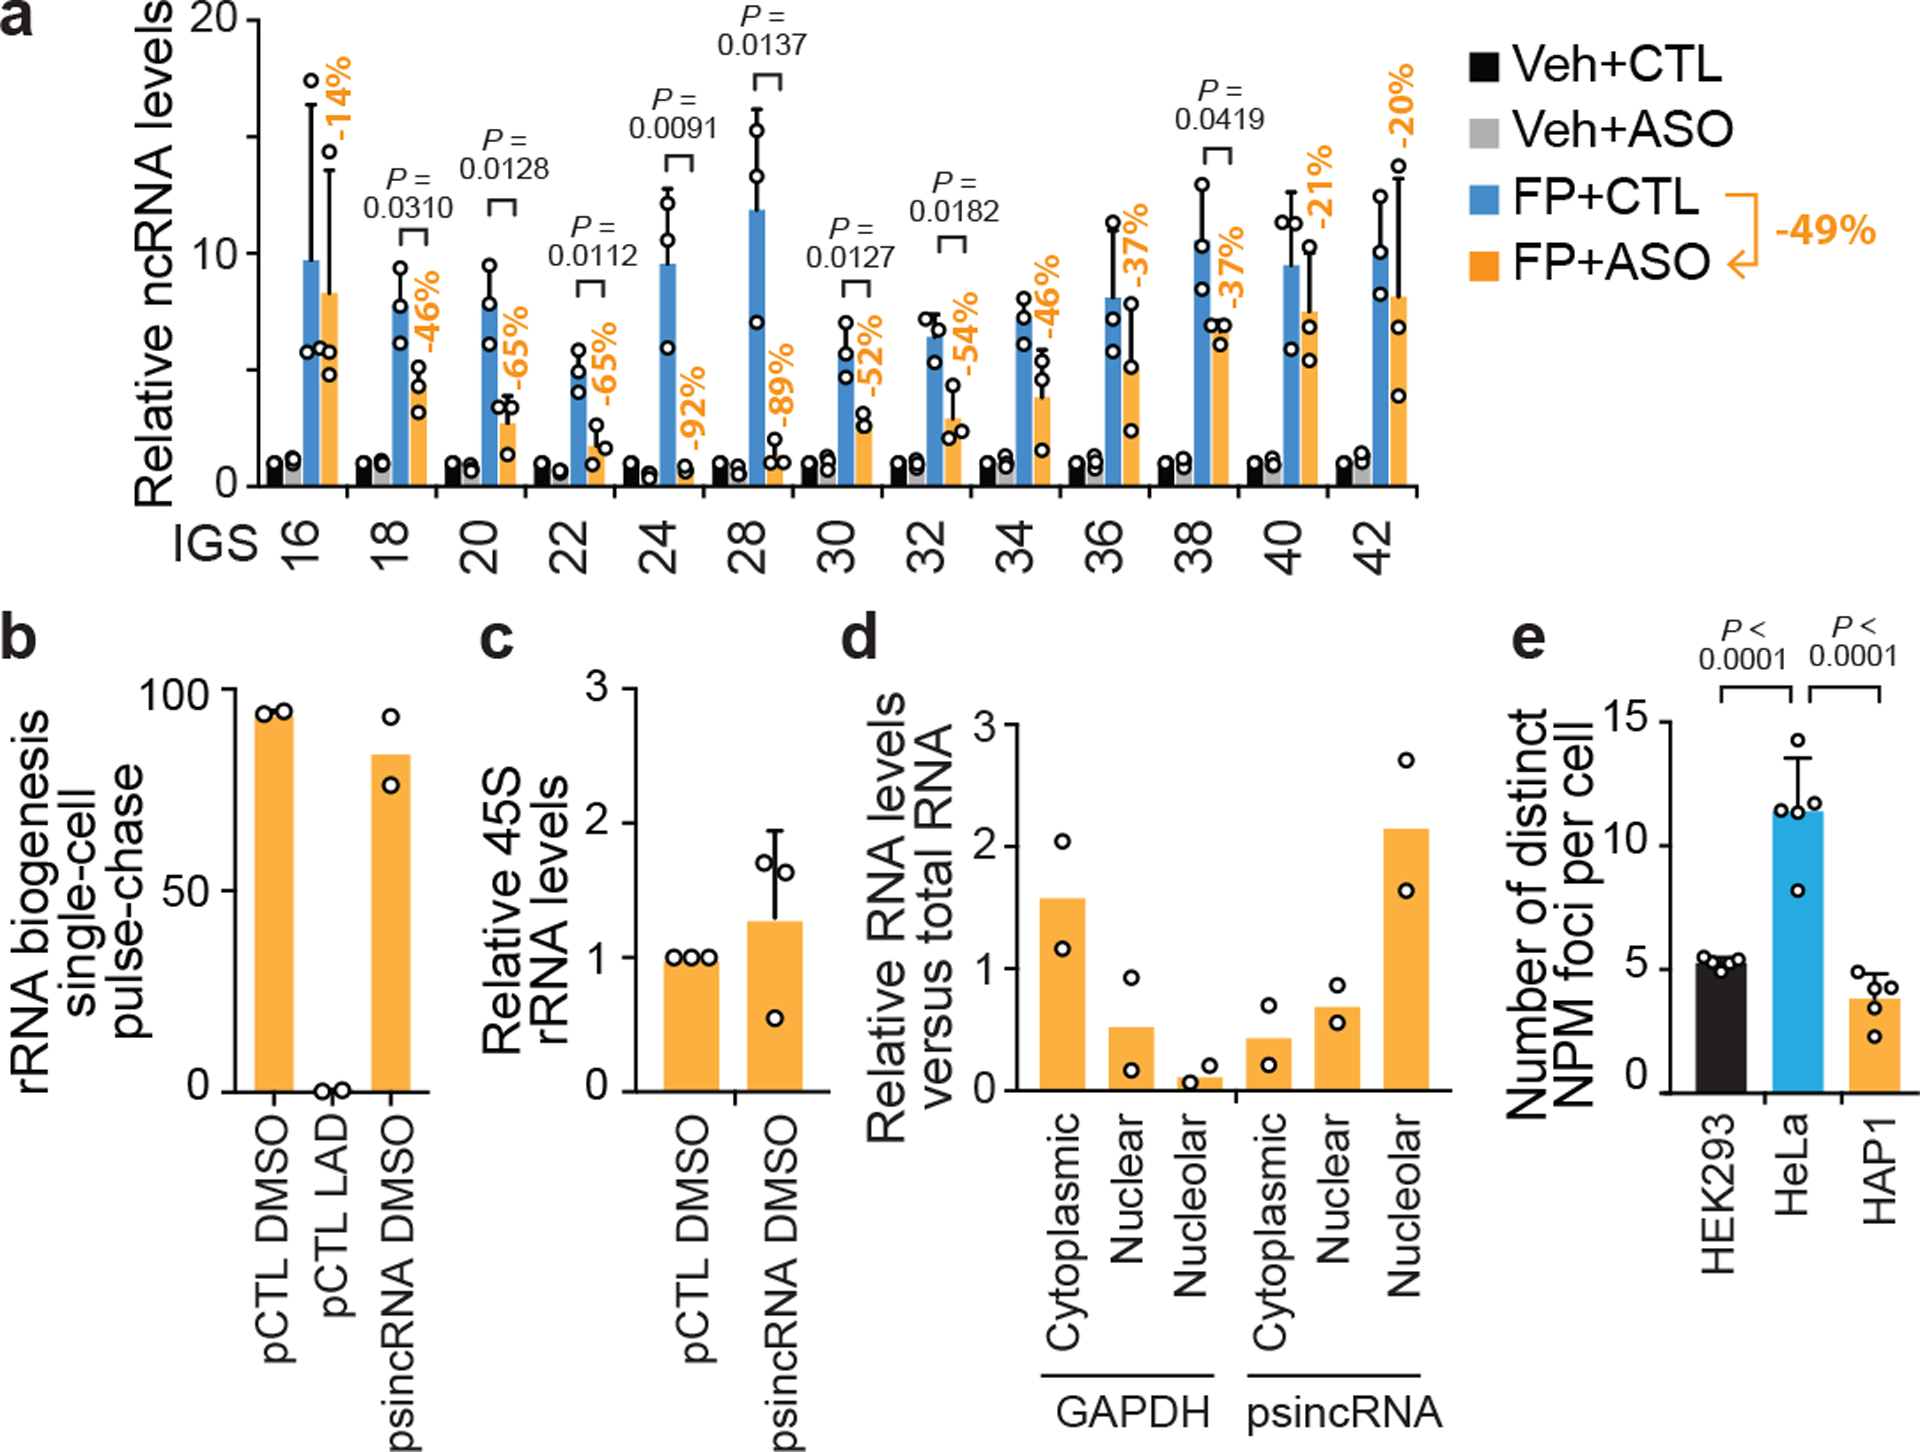
(a) In HEK293 cells treated with the Pol II inhibitor flavopirodol (FP), introduction of antisense oligonucleotides (ASO) targeting sincRNAs does lower IGS ncRNA levels relative to ASO control-treated cells (CTL). ASO-dependent percent decreases in sincRNA levels are indicated for each IGS site and the average decrease in total sincRNA levels is 49%. Data are shown as the mean±s.d.; two-tailed t-test, n=3 biologically independent experiments. (b-d) In the absence of heat shock, artificial overexpression of sincRNA22 (psincRNA) in the nucleolar stress hyper-responsive MCF7 cells failed to repress rRNA biogenesis (b) or rRNA levels (c) despite the enrichment of the sincRNA22 in the nucleolar fraction (d). Plasmid (pCTL), iPol I (LAD), vehicle (DMSO), and GAPDH cell fractionation controls were included. Data are shown as the mean±s.d.; n=2 biologically independent experiments (b, d); two-tailed t-test, n=3 biologically independent experiments (c); (e) Quantification of the number of distinct NPM foci per cell in different cell types. Data are shown as the mean±s.d.; one-way ANOVA with Tukey’s multiple comparisons test, n=5 biologically independent experiments.
Extended data Fig. 6 |. Controls related to the disruption of nucleolar structure following Pol II inhibition.
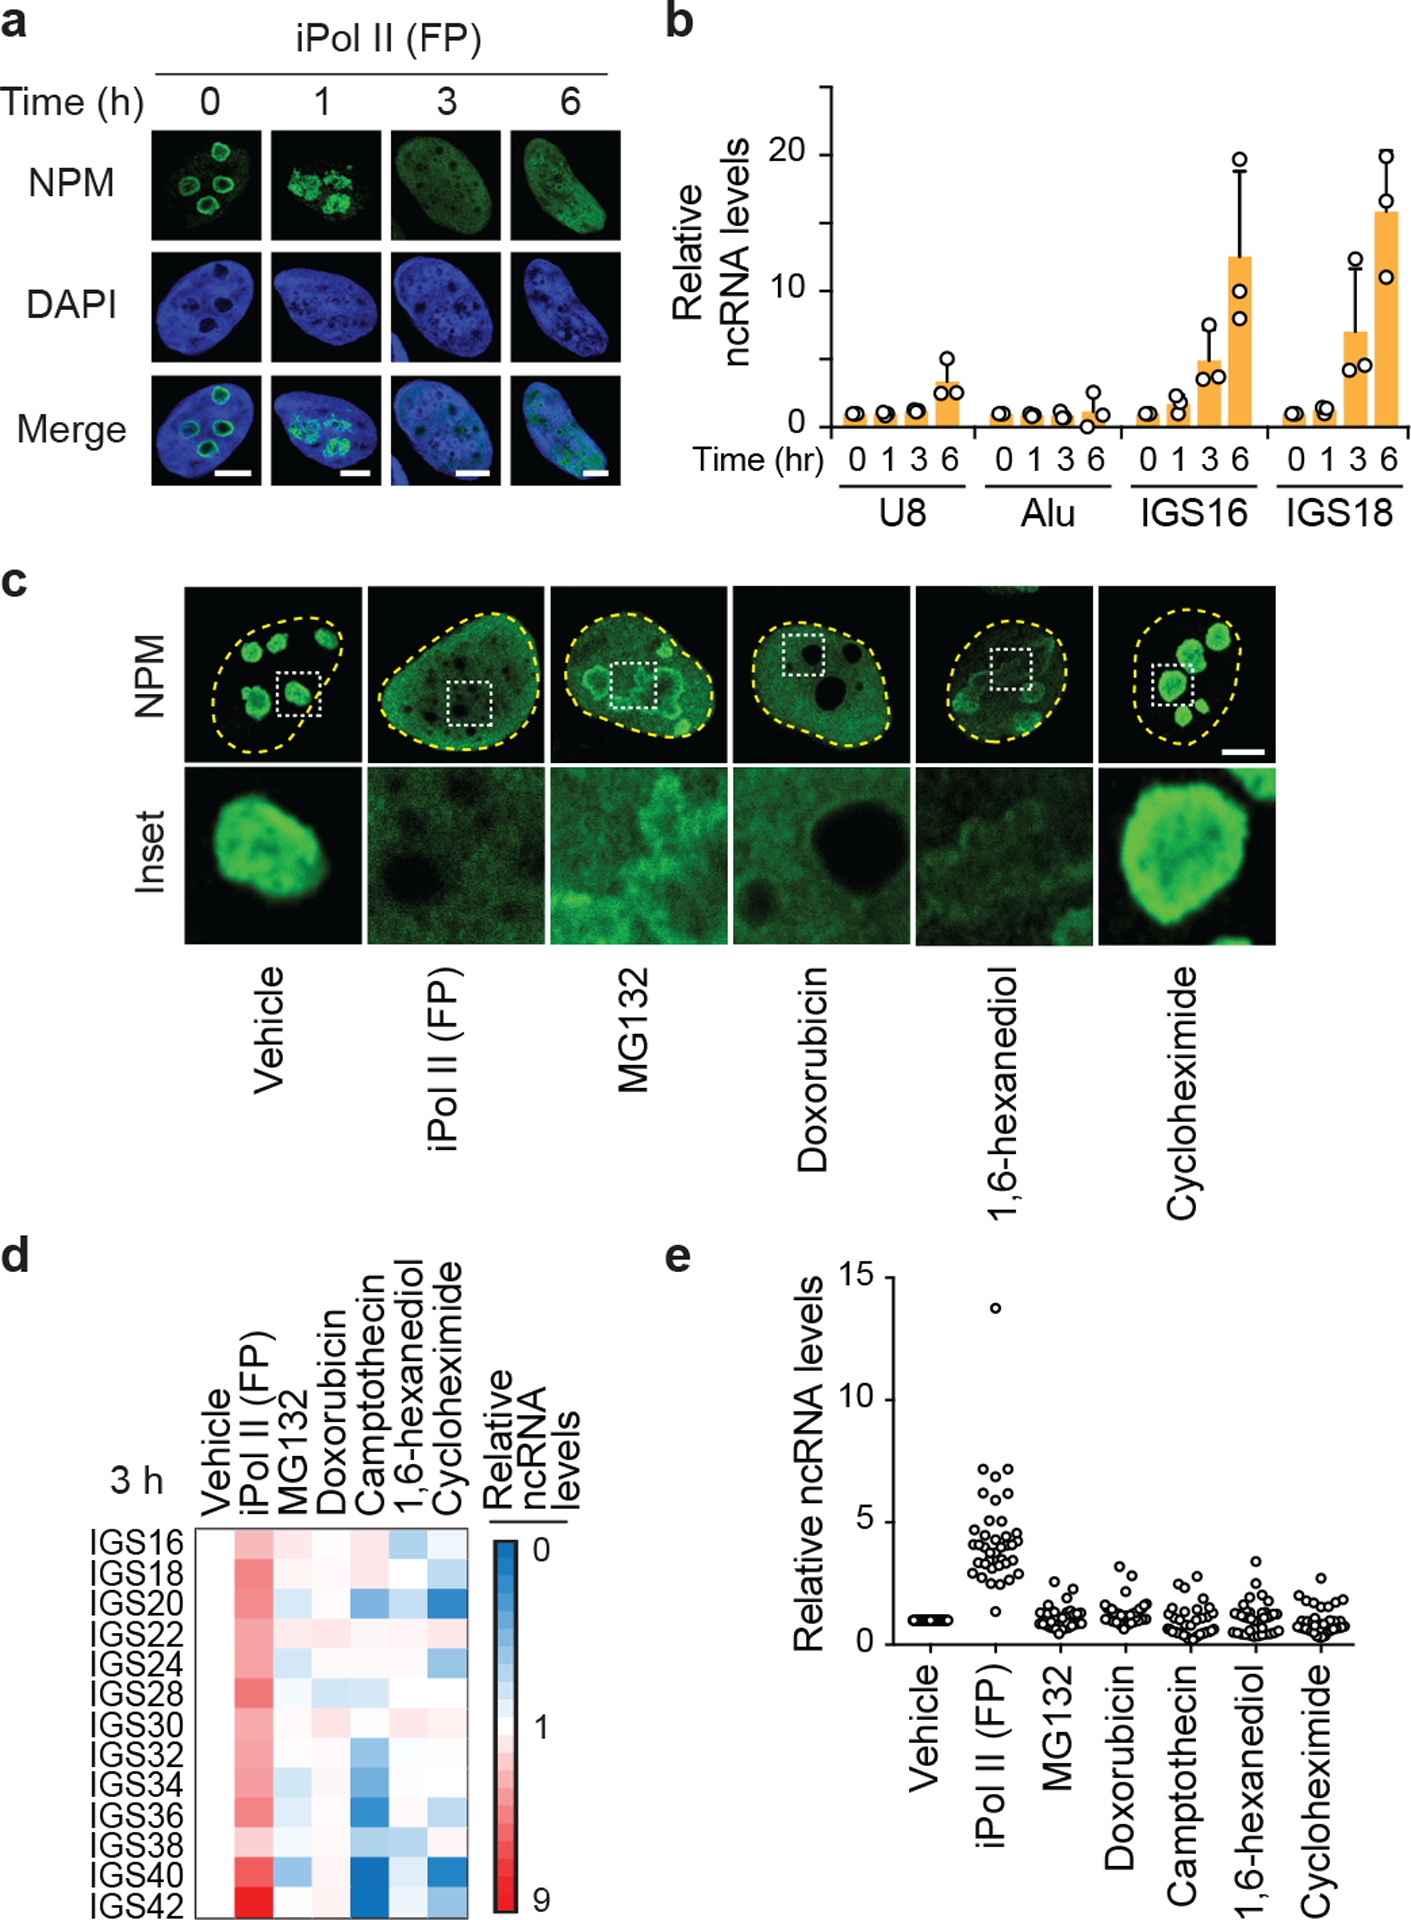
(a,b) The disruption of NPM phase separation following Pol II inhibition (a) coincide with time points at which the levels of IGS ncRNAs greatly increased (b; mean±s.d., n=3 biologically independent experiments). At these time points, no reductions in the levels of the snoRNA U8 or Alu RNA were observed. (c-e) Treating cells with the Pol II inhibitor flavopiridol (FP), with various drugs that disrupt nucleolar morphology through unclear mechanisms (MG132, Doxorubicin), with the LLPS/nucleolus disruptor 1,6-hexanediol, or with the global translation inhibitor (Cycloheximide) revealed that only Pol II inhibition simultaneously disrupted NPM phase separation (c) and induced IGS ncRNA levels (d,e). Shown are representative anti-NPM immunofluorescence images (c) and two different visual representations of ncRNA levels as detected by RT-qPCR (d,e); n=3 biologically independent experiments). In the scatter plot (e), each circle represents the value of one IGS site from one of the three biological replicates. Scale bars, 5 μm.
Extended data Fig. 7 |. Nucleolar R-loops and their modulation.
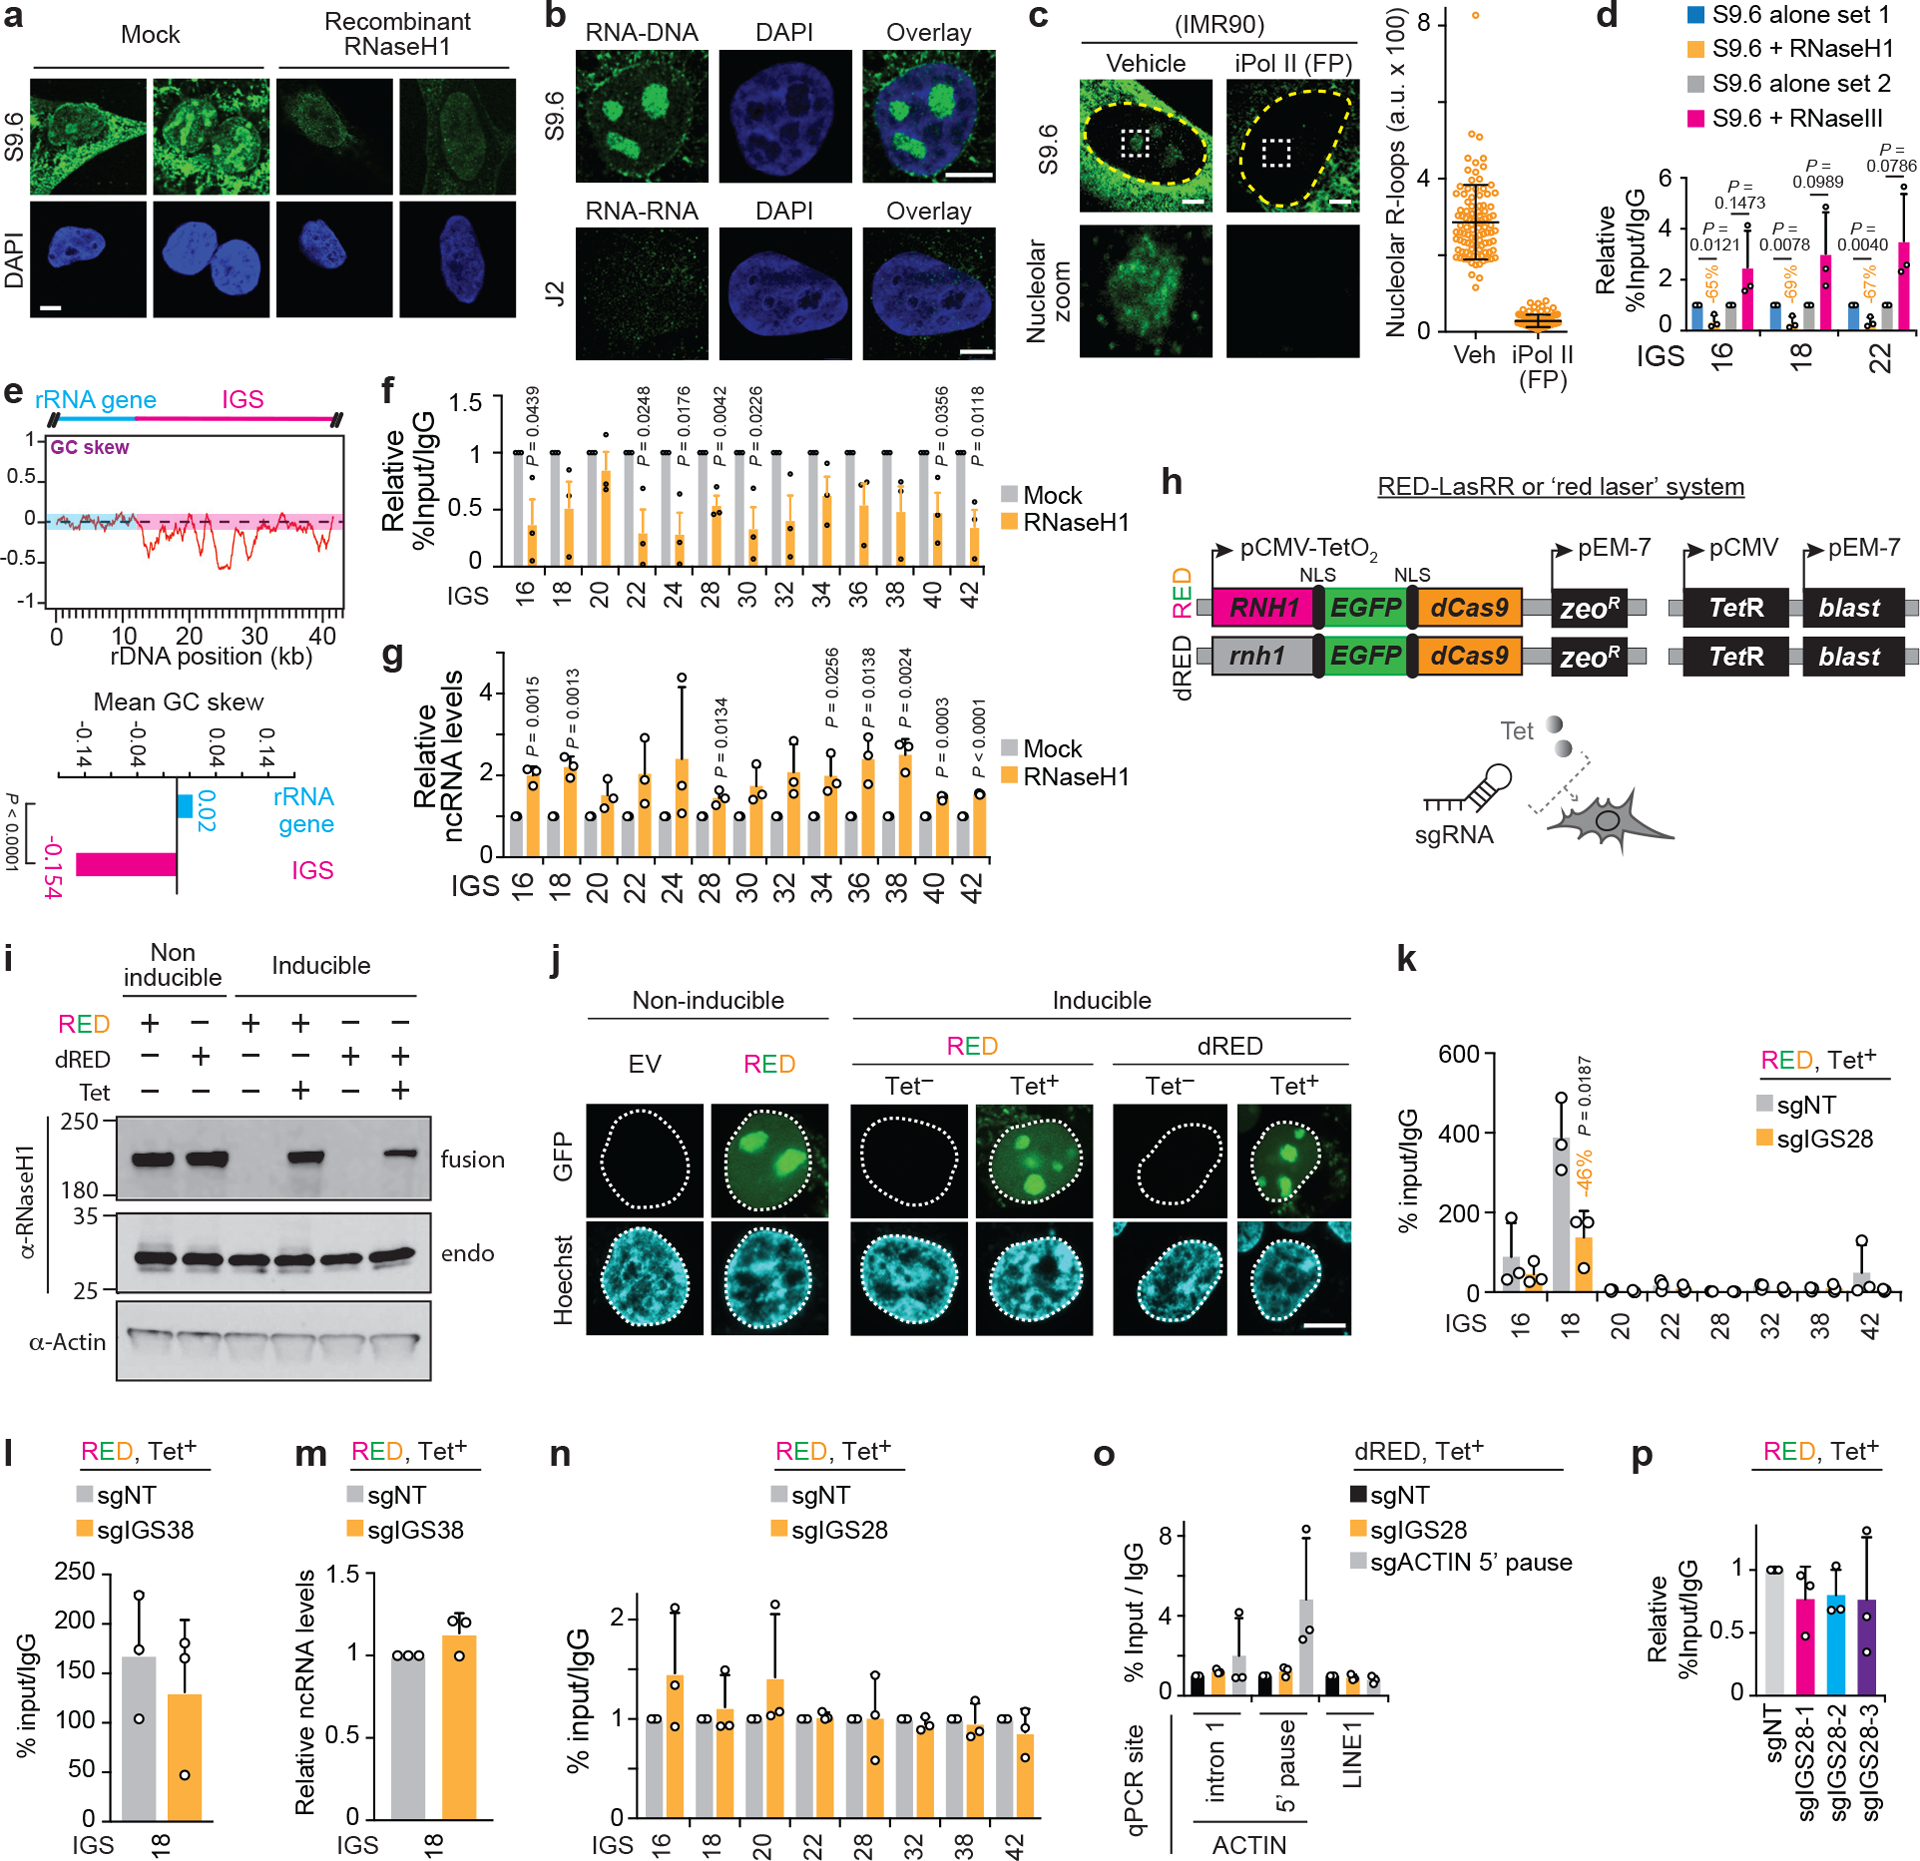
(a) In vitro treatment with recombinant RNase H1 greatly decreases nuclear immunofluorescence signals obtained with the anti-DNA-RNA hybrid S9.6 antibody. Signals remaining following RNase H1 treatment may reflect resistant hybrid structures or other nucleic acid structures. (b) Immunofluorescence employing the anti-RNA-DNA hybrid antibody S9.6, but not the anti-dsRNA antibody J2, revealed nucleolar signal under standard cell culture conditions. (c) Anti-RNA-DNA hybrid immunofluorescence employing the S9.6 antibody and IMR90 cells also showed nucleolar signals that were repressed upon Pol II inhibition (n=100 cells). (d) In our DRIP assays, in vitro treatment with RNase H1, but not RNase III, consistently lowers DRIP signals. (e) Bioinformatic analysis of the rDNA GC skew distribution and mean showed that the IGSs, but not rRNA genes, displayed a strongly negative GC skew, Welch’s two-tailed t-test, n=14 (rRNA gene) and n=30 (IGS) (f-g) RNase H1 overexpression partly lowers R-loop levels (f) and increases ncRNA levels (g) at the IGS. (h) Design details of the RED/dRED-LaSRR systems created to achieve inducible locus-associated R-loop repression. (i,j) Validation of non-inducible and tetracycline RED and dRED protein expression using immunoblotting (i) and microscopy (j). For gel source data, see Supplementary Figure 1. (k) Using RED together with sgIGS28 decreased R-loop levels at IGS18. (l-m) Using RED together with sgIGS38 fails to alter R-loop (l) or ncRNA levels (m) at IGS18. (n) Using RED together with sgIGS28 does not alter Pol II enrichments across the IGS. (o) The fusion protein system can be used to preferentially enrich the dRED fusion protein at the 5’ pause site of the ACTIN locus. (p) Use of the non-overlapping sgRNAs targeting IGS28, individually instead of as a pool, failed to significantly repress R-loop levels at IGS18, arguing against non-specific effects related to the RNase H1 moiety of RED or any of the gRNAs used. (a-p) HEK293 cells were used. Data are presented as the mean±s.d.; one-way ANOVA with Dunnett’s multiple comparisons test (p, n=3 biologically independent experiments) or two-tailed t-test (d, f-g, k, l-n; n=3 biologically independent experiments); n=3 biologically independent experiments (o); images in (a-b,i-j) are representatives of two independent experiments. Scale bars, 5 μm.
Extended data Fig. 8 |. Nucleolar and IGS features of wild-type and SETX KO cells.
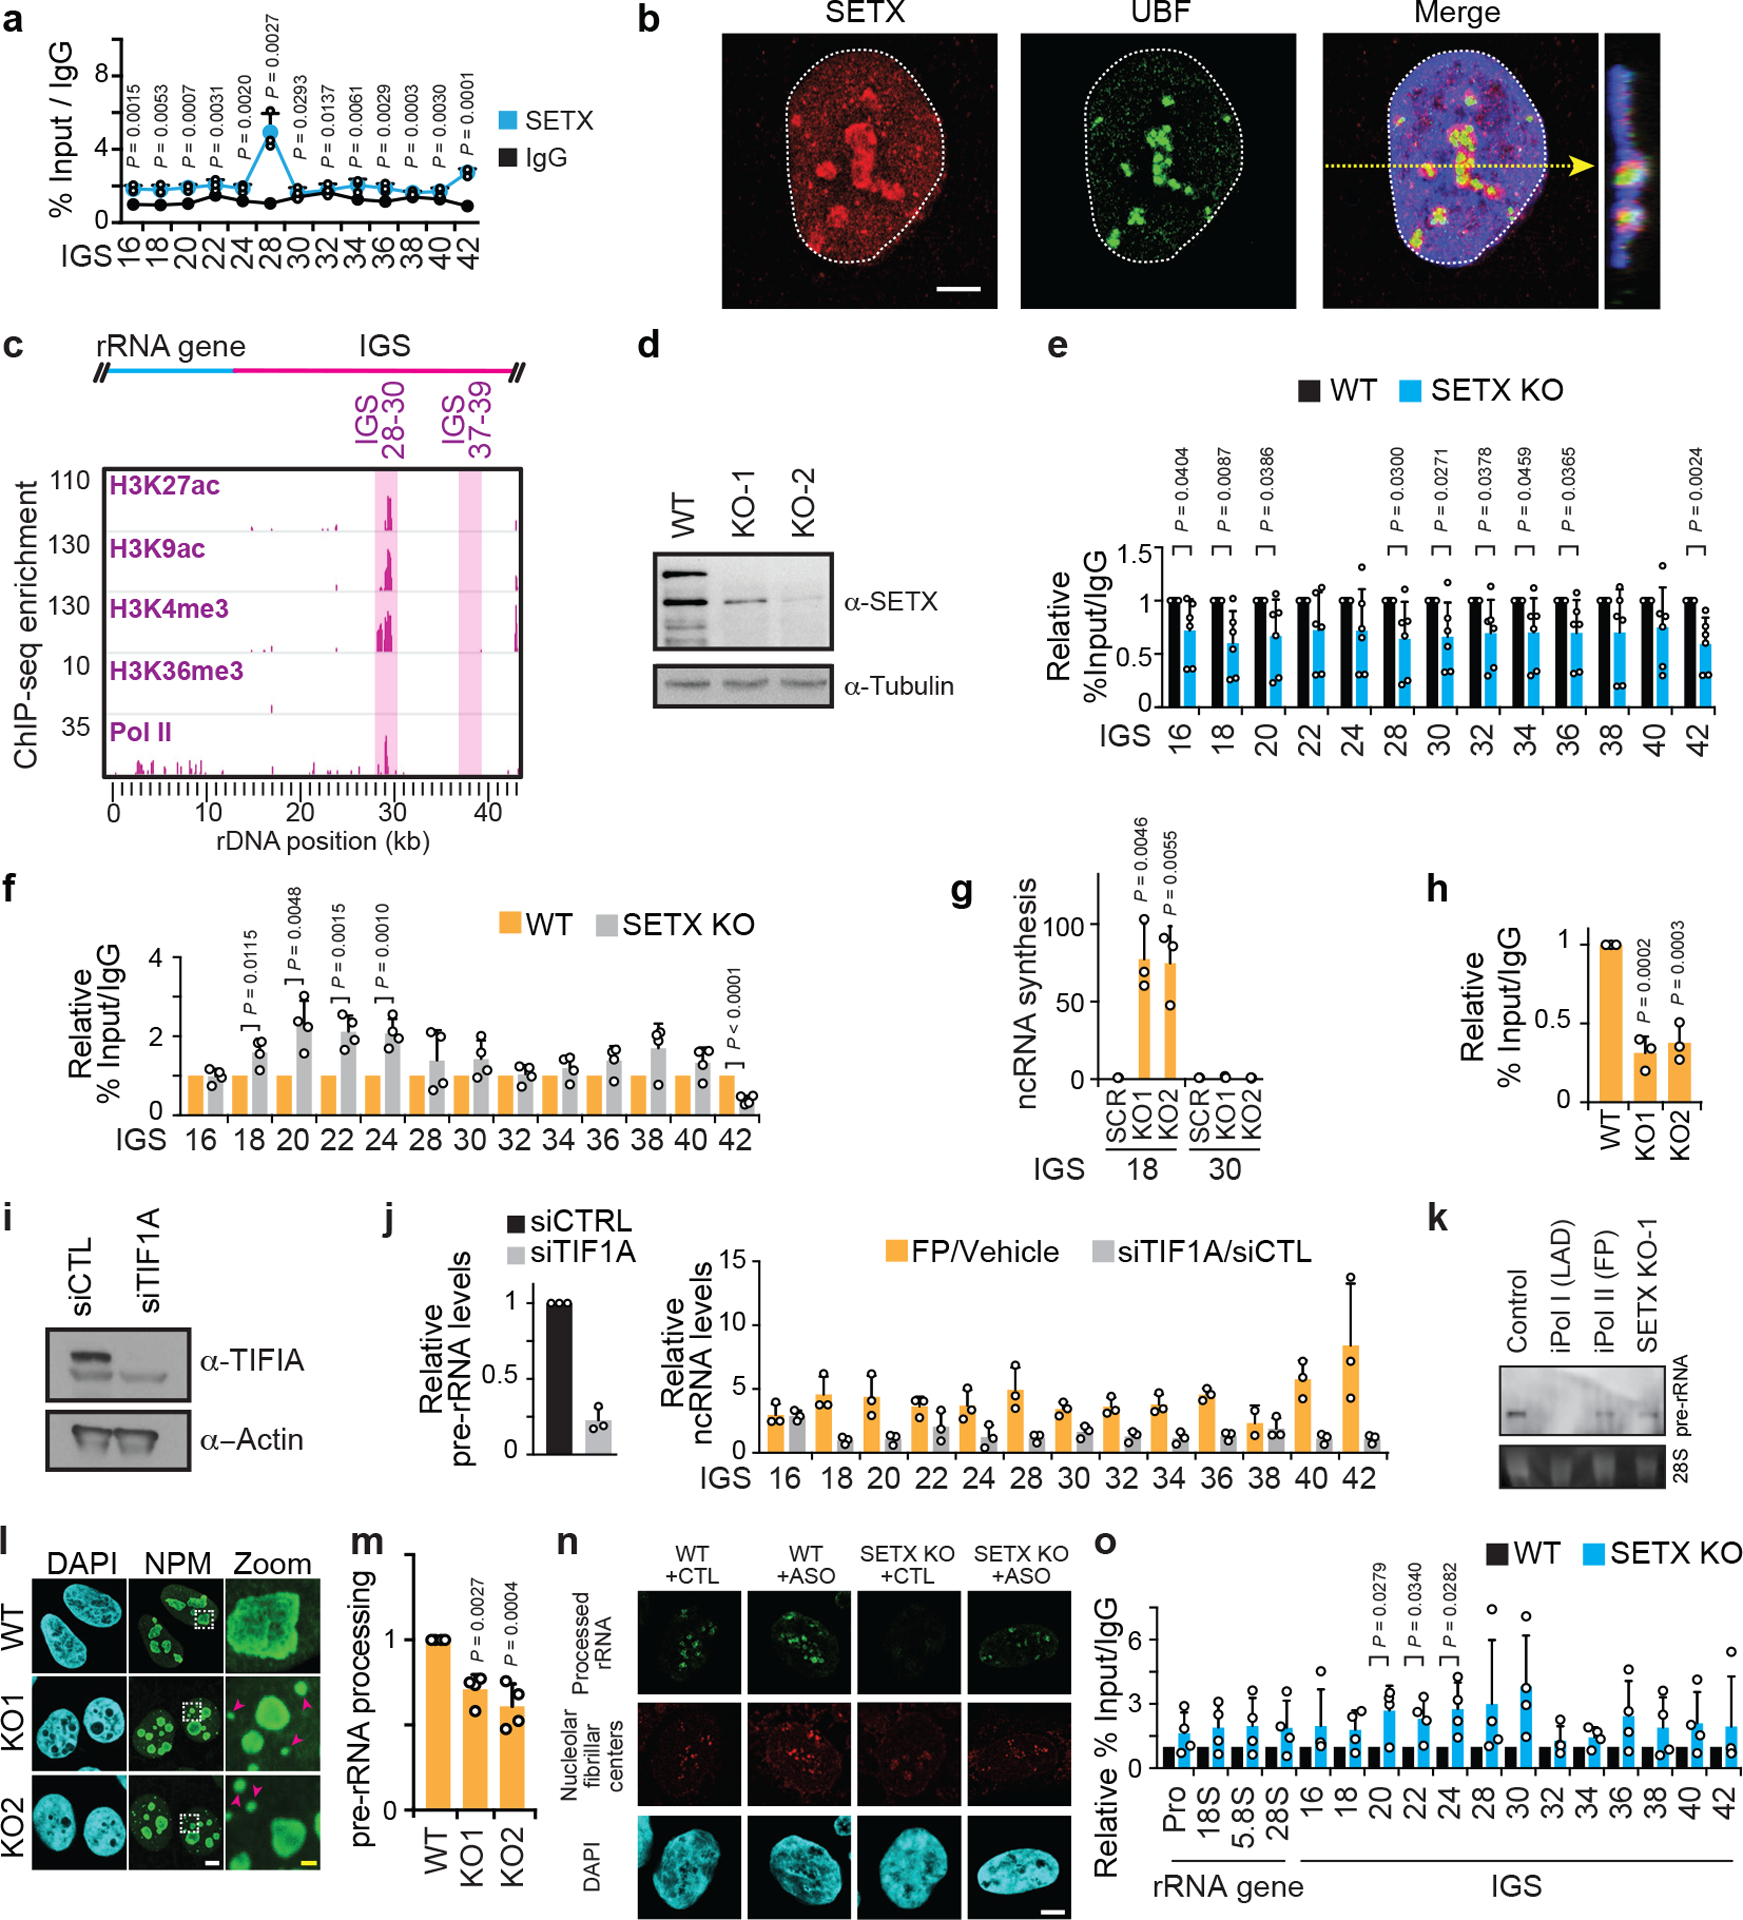
(a) ChIP showing SETX enrichment at the IGS. (b) SETX had a nucleolar/nucleoplasmic localization. (c) Bioinformatic analysis of ENCODE-K562 data showing co-enrichment of epigenetic marks consistent with transcriptional activation near IGS28. (d) Immunoblot showing CRISPR/Cas9-mediated SETX KO. (e) ChIP showing Pol II enrichment across rDNA in wild-type and SETX KO cells. (f) ChIP reveals that SETX KO, in two clones, enriched RNA Pol I at the IGSs. (g-h) SETX KO induced IGS ncRNA synthesis (g) and decreased Pol I enrichment at the rRNA gene (5’ETS region) (h). (i-j) siRNA-mediated knockdown of TIF1A lowered Pol I-dependent pre-rRNA levels but failed to induce IGS ncRNAs. For experimental design differences, FP/Vehicle data (j) were from a different experiment (extended data Fig. 6d) but are shown here on the same graph for better visual comparison. (k) Northern blotting revealed that Pol II or SETX disruption did not induce rRNA gene read-through transcripts. Probe for the 5’-ETS of pre-rRNA was used. (l-m) SETX KO disrupted nucleolar organization as indicated by NPM immunofluorescence (e) and decreased pre-rRNA processing in pulse-chase assays (f). (n) ASO-mediated knockdown of sincRNAs increases rRNA biogenesis, as indicated by single cell rRNA biogenesis assays. Shown are nucleolar fibrillar centre-associated RNA rings revealed by single-cell FU-RNA pulse-chase immunofluorescence. Quantification shown in Fig. 4e. (o) ChIP showing H3K9me2 enrichment across rDNA in wild-type and SETX KO cells. (a-o) HEK293 cells were used unless otherwise indicated. Data in (e,o) were from large experimental sets sharing IgG controls. Data are shown as the mean±s.d.; two-tailed t-test, n=3 biologically independent experiments (a, j), n=6 biologically independent experiments (e), and n=4 biologically independent experiments (f, o); one-way ANOVA with Dunnett’s multiple comparisons test, n=3 biologically independent experiments (g,h) and n=4 biologically independent experiments (m); images in (b-d,k) are representative of two independent experiments. Scale bars, 5 μm. For gel source data (d, i, k), see Supplementary Figure 1.
Extended data Fig. 9 |. Additional nucleolar organization and sequencing analyses related to Ewing sarcoma.
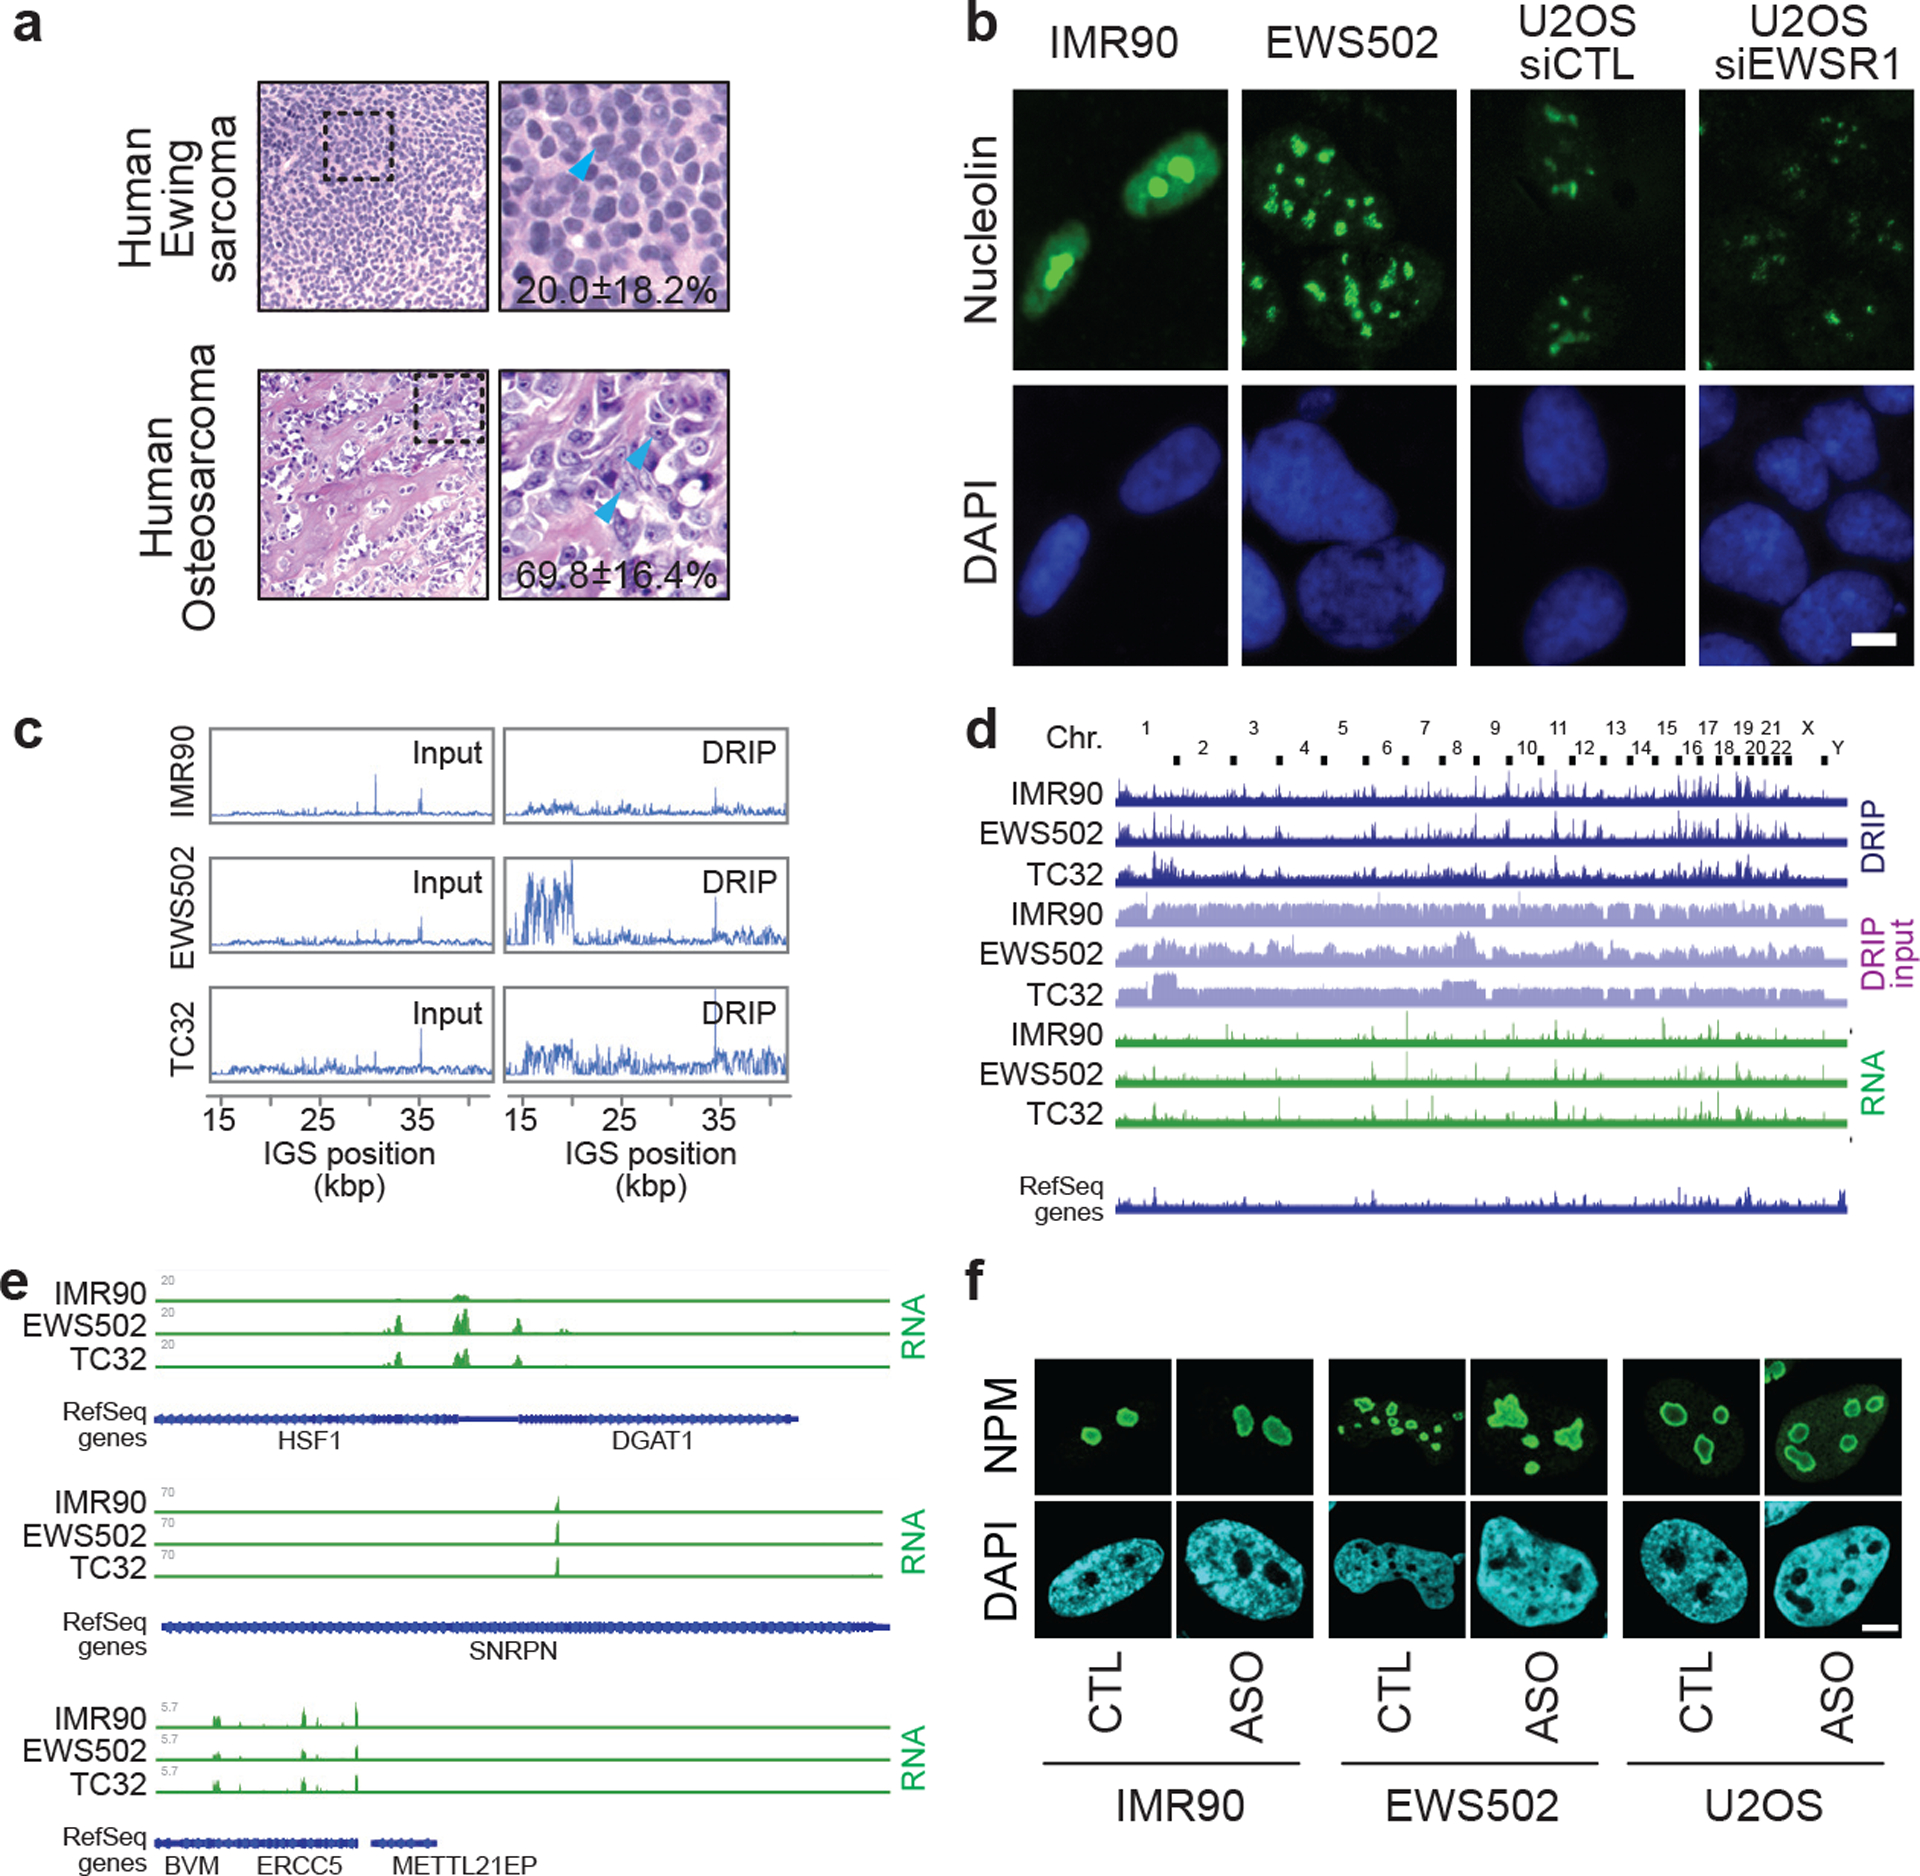
(a) Representative tissue sections of human Ewing sarcoma and osteosarcoma (haematoxylin and eosin, x400). Materials were obtained following Institutional Research Ethics Board approval (Sinai Heath Systems, 17–0103-E). The percentage of cells with one or two distinct nucleoli per nucleus is shown. Data are shown as the mean±s.d.; per cancer type, n=5 cases (100 cells each); two-tailed t-test P=0.0019. (b) Ewing sarcoma cells (EWS502), and U2OS cells with siEWSR1 display disrupted nucleoli, as indicated by the nucleolin protein, compared to their respective control IMR90 and U2OS siControl (siCTL) cells. Scale bar, 5 μm. (c) Ewing sarcoma (EWS502, TC32) cells showed increased R-loop levels across IGSs in DRIP-seq. (d) Genome-wide view of sequence read alignments for DRIP-seq and RNA-seq. Chr., chromosome. (e) IMR90, EWS502, and TC32 cells can exhibit similarities and differences at non-rDNA loci in sequencing read alignments from RNA-seq. (f) ASO targeting sincRNAs ameliorates nucleolar organization. Shown are representative images related to quantifications in Fig. 4d. Images are representative of two independent experiments. Scale bar, 5 μm.
Extended data Fig. 10 |. Detailed model illustrating how nucleolar RNA Pol II-dependent R-loops shield the IGS from sincRNA synthesis by Pol I.
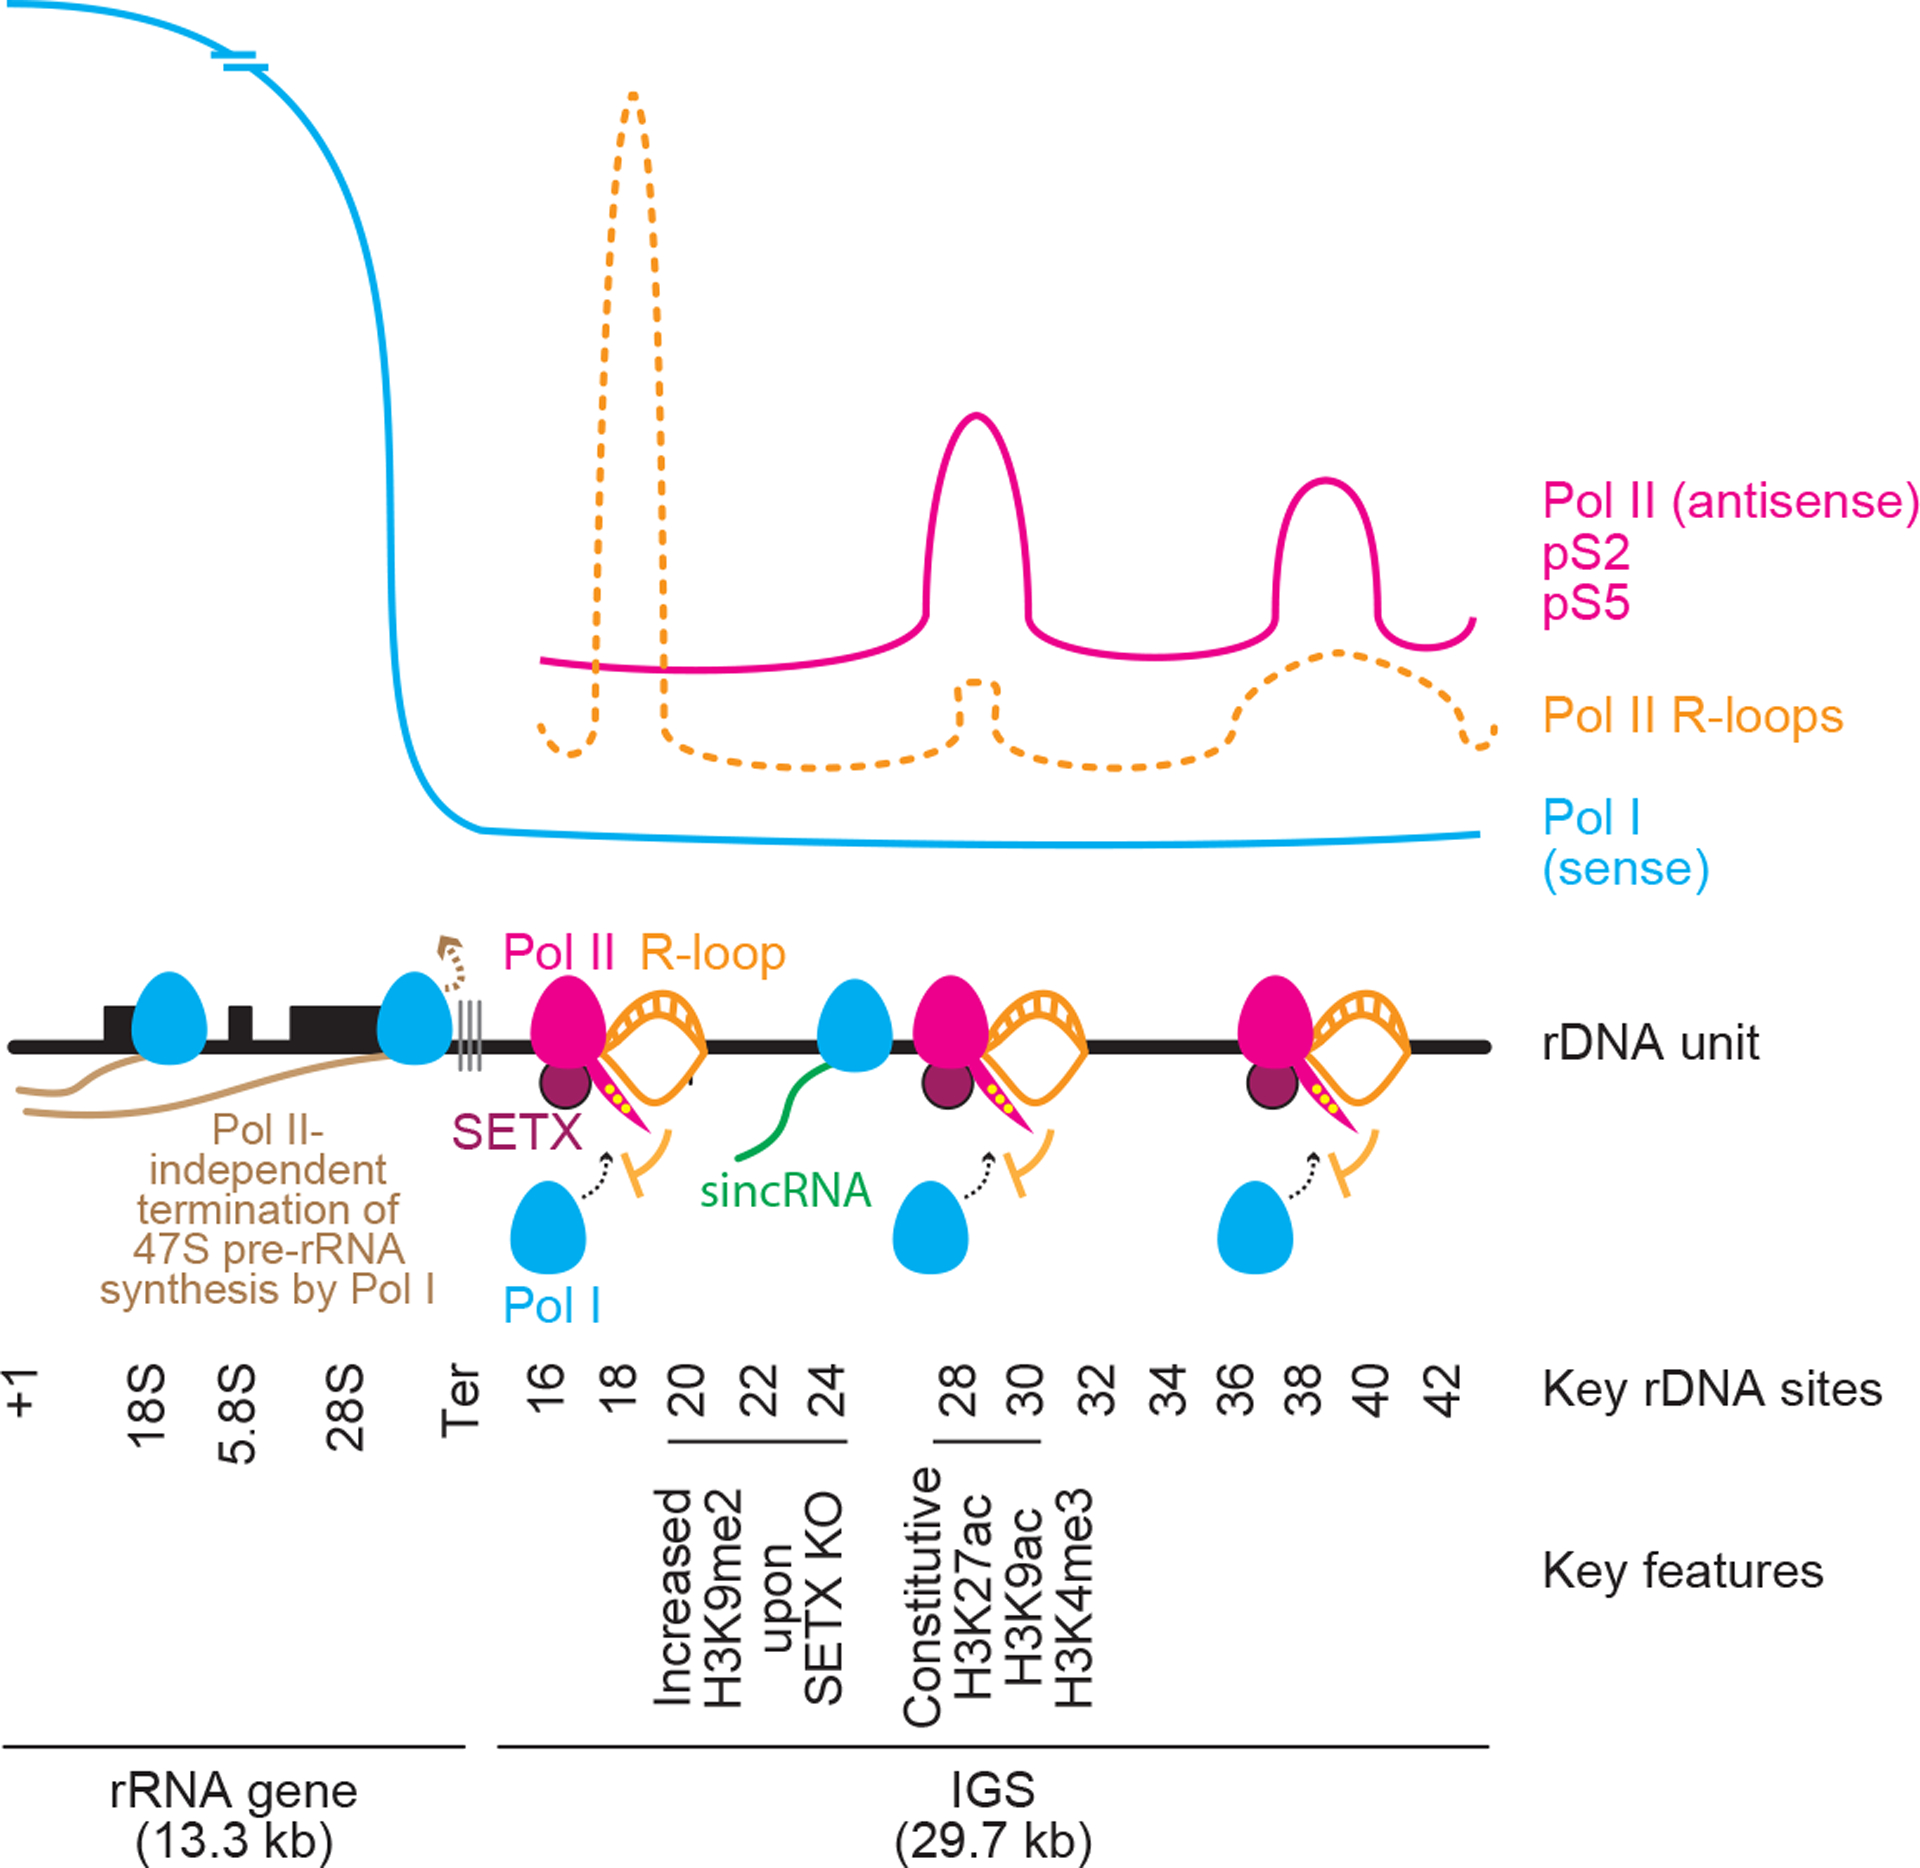
RNA Pol II at rDNA intergenic spacers (IGSs) synthesizes antisense intergenic ncRNAs (asincRNAs) that constitutively engage in DNA-RNA hybrid-containing R-loops. Nucleolar RNA Pol II function is promoted by the neurodegeneration-linked SETX. Disruption of nucleolar Pol II enables the recruitment of RNA Pol I to the IGS. There, Pol I synthesizes sense intergenic ncRNAs (sincRNAs) that mimic environmental stress, disrupting nucleolar liquid-liquid phase separation and triggering aberrant nucleolar liquid-to-solid phase transition. This unscheduled activation of nucleolar stress responses compromises the natural organization of nucleoli, leading to defects in pre-rRNA biogenesis, especially at the processing level. Nucleolar sincRNA levels are naturally elevated in Ewing sarcoma cells, explaining the indistinct nucleoli often seen in this cancer. In the context of Pol II inhibition, SETX loss, or Ewing sarcoma, sincRNA repression ameliorates nucleolar organization and rRNA biogenesis.
Supplementary Material
Acknowledgments
We thank D. Durocher and H.O. Lee for critical reading of the manuscript, A. F. Palazzo for technical assistance with phase-contrast microscopy, R. Kandel for technical tumour imaging, and F. Chédin for technical assistance with DRIP. K.J.A. is funded by a Canadian Institutes of Health Research (CIHR) Vanier Doctoral Scholarship, Ruggles Innovation Award, and Adel S. Sedra Award. N.K. is supported by CIHR and Ontario Graduate Scholarship (OGS) awards. L.A.O. is funded by OGS. R.O. is funded by an NSERC Doctoral Scholarship. This work was also supported by funds from the National Institutes of Health (NIH, K22ES012264, 1R01CA152063, 1R01CA241554), Voelcker Fund Young Investigator Award and CPRIT (RP150445) to A.J.R.B., from CPRIT (RP101491), NCI T32 postdoctoral training grant (T32CA148724), and NCATS TL1 (TL1TR002647) to A.G., and NCI funding (P30CA054174) to sequencing facility. Funds were also to S.L. from the National Institute of General Medical Sciences (R01GM115342) and the National Cancer Institute (R01CA200676) of the NIH, and the Sylvester Comprehensive Cancer Center. This work was mainly supported by grants to K.M. from the CIHR (388041, 399687), Canada Research Chairs Program (CRC; 950-230661), and the Ontario Ministry of Research and Innovation (MRI-ERA; ER13-09-111).
Footnotes
Competing interests Authors declare no competing interests.
Data availability
Data are in the Article, Supplementary Fig. 1 (uncropped blots), and the Source Data files related to Figs. 1–4 and extended data Figs. 1–3 and 5–8. RNA-sequencing and DRIP-sequencing data sets were previously deposited at Gene Expression Omnibus (GEO) with accession codes GSE115731 and GSE68847. All data and materials are available upon reasonable request. In light of the pandemic, shipping of reagents and materials may be slighted delayed.
References
- 1.Boisvert FM, van Koningsbruggen S, Navascues J & Lamond AI The multifunctional nucleolus. Nat Rev Mol Cell Biol 8, 574–85 (2007). [DOI] [PubMed] [Google Scholar]
- 2.Feric M et al. Coexisting Liquid Phases Underlie Nucleolar Subcompartments. Cell 165, 1686–97 (2016). [DOI] [PMC free article] [PubMed] [Google Scholar]
- 3.Mekhail K & Moazed D The nuclear envelope in genome organization, expression and stability. Nat Rev Mol Cell Biol 11, 317–28 (2010). [DOI] [PMC free article] [PubMed] [Google Scholar]
- 4.Kobayashi T & Ganley AR Recombination regulation by transcription-induced cohesin dissociation in rDNA repeats. Science 309, 1581–4 (2005). [DOI] [PubMed] [Google Scholar]
- 5.Kaeberlein M, McVey M & Guarente L The SIR2/3/4 complex and SIR2 alone promote longevity in Saccharomyces cerevisiae by two different mechanisms. Genes Dev 13, 2570–80 (1999). [DOI] [PMC free article] [PubMed] [Google Scholar]
- 6.Mekhail K et al. Regulation of ubiquitin ligase dynamics by the nucleolus. J Cell Biol 170, 733–44 (2005). [DOI] [PMC free article] [PubMed] [Google Scholar]
- 7.Mitrea DM et al. Self-interaction of NPM1 modulates multiple mechanisms of liquid-liquid phase separation. Nat Commun 9, 842 (2018). [DOI] [PMC free article] [PubMed] [Google Scholar]
- 8.Audas TE et al. Adaptation to Stressors by Systemic Protein Amyloidogenesis. Dev Cell 39, 155–68 (2016). [DOI] [PMC free article] [PubMed] [Google Scholar]
- 9.Wang M et al. Stress-Induced Low Complexity RNA Activates Physiological Amyloidogenesis. Cell Rep 24, 1713–21 e4 (2018). [DOI] [PMC free article] [PubMed] [Google Scholar]
- 10.Caudron-Herger M et al. Alu element-containing RNAs maintain nucleolar structure and function. EMBO J 34, 2758–74 (2015). [DOI] [PMC free article] [PubMed] [Google Scholar]
- 11.Burger K et al. Cyclin-dependent kinase 9 links RNA polymerase II transcription to processing of ribosomal RNA. J Biol Chem 288, 21173–83 (2013). [DOI] [PMC free article] [PubMed] [Google Scholar]
- 12.Burger K et al. Chemotherapeutic drugs inhibit ribosome biogenesis at various levels. J Biol Chem 285, 12416–25 (2010). [DOI] [PMC free article] [PubMed] [Google Scholar]
- 13.Santos-Pereira JM & Aguilera A R loops: new modulators of genome dynamics and function. Nat Rev Genet 16, 583–97 (2015). [DOI] [PubMed] [Google Scholar]
- 14.Bhatia V et al. BRCA2 prevents R-loop accumulation and associates with TREX-2 mRNA export factor PCID2. Nature 511, 362–5 (2014). [DOI] [PubMed] [Google Scholar]
- 15.Sanz LA et al. Prevalent, Dynamic, and Conserved R-Loop Structures Associate with Specific Epigenomic Signatures in Mammals. Mol Cell 63, 167–78 (2016). [DOI] [PMC free article] [PubMed] [Google Scholar]
- 16.Abraham KJ et al. Intersection of calorie restriction and magnesium in the suppression of genome-destabilizing RNA-DNA hybrids. Nucleic Acids Res 44, 8870–84 (2016). [DOI] [PMC free article] [PubMed] [Google Scholar]
- 17.Zentner GE, Saiakhova A, Manaenkov P, Adams MD & Scacheri PC Integrative genomic analysis of human ribosomal DNA. Nucleic Acids Res 39, 4949–60 (2011). [DOI] [PMC free article] [PubMed] [Google Scholar]
- 18.Shiue CN, Nematollahi-Mahani A & Wright AP Myc-induced anchorage of the rDNA IGS region to nucleolar matrix modulates growth-stimulated changes in higher-order rDNA architecture. Nucleic Acids Res 42, 5505–17 (2014). [DOI] [PMC free article] [PubMed] [Google Scholar]
- 19.Groh M, Albulescu LO, Cristini A & Gromak N Senataxin: Genome Guardian at the Interface of Transcription and Neurodegeneration. J Mol Biol 429, 3181–95 (2017). [DOI] [PubMed] [Google Scholar]
- 20.Skourti-Stathaki K, Proudfoot NJ & Gromak N Human senataxin resolves RNA/DNA hybrids formed at transcriptional pause sites to promote Xrn2-dependent termination. Mol Cell 42, 794–805 (2011). [DOI] [PMC free article] [PubMed] [Google Scholar]
- 21.Steinmetz EJ et al. Genome-wide distribution of yeast RNA polymerase II and its control by Sen1 helicase. Mol Cell 24, 735–46 (2006). [DOI] [PubMed] [Google Scholar]
- 22.Suraweera A et al. Functional role for senataxin, defective in ataxia oculomotor apraxia type 2, in transcriptional regulation. Hum Mol Genet 18, 3384–96 (2009). [DOI] [PubMed] [Google Scholar]
- 23.Vasiljeva L, Kim M, Terzi N, Soares LM & Buratowski S Transcription termination and RNA degradation contribute to silencing of RNA polymerase II transcription within heterochromatin. Mol Cell 29, 313–23 (2008). [DOI] [PubMed] [Google Scholar]
- 24.Mischo HE et al. Yeast Sen1 helicase protects the genome from transcription-associated instability. Mol Cell 41, 21–32 (2011). [DOI] [PMC free article] [PubMed] [Google Scholar]
- 25.Stamatopoulou V, Parisot P, De Vleeschouwer C & Lafontaine DLJ Use of the iNo score to discriminate normal from altered nucleolar morphology, with applications in basic cell biology and potential in human disease diagnostics. Nat Protoc 13, 2387–406 (2018). [DOI] [PubMed] [Google Scholar]
- 26.Gorthi A et al. EWS-FLI1 increases transcription to cause R-loops and block BRCA1 repair in Ewing sarcoma. Nature 555, 387–91 (2018). [DOI] [PMC free article] [PubMed] [Google Scholar]
- 27.El Hage A, French SL, Beyer AL & Tollervey D Loss of Topoisomerase I leads to R-loop-mediated transcriptional blocks during ribosomal RNA synthesis. Genes Dev 24, 1546–58 (2010). [DOI] [PMC free article] [PubMed] [Google Scholar]
- 28.Kawauchi J, Mischo H, Braglia P, Rondon A & Proudfoot NJ Budding yeast RNA polymerases I and II employ parallel mechanisms of transcriptional termination. Genes Dev 22, 1082–92 (2008). [DOI] [PMC free article] [PubMed] [Google Scholar]
- 29.Salvi JS et al. Roles for Pbp1 and caloric restriction in genome and lifespan maintenance via suppression of RNA-DNA hybrids. Dev Cell 30, 177–91 (2014). [DOI] [PubMed] [Google Scholar]
- 30.Bierhoff H et al. Quiescence-induced LncRNAs trigger H4K20 trimethylation and transcriptional silencing. Mol Cell 54, 675–82 (2014). [DOI] [PubMed] [Google Scholar]
- 31.Savic N et al. lncRNA maturation to initiate heterochromatin formation in the nucleolus is required for exit from pluripotency in ESCs. Cell Stem Cell 15, 720–34 (2014). [DOI] [PubMed] [Google Scholar]
- 32.Mayer C, Schmitz KM, Li J, Grummt I & Santoro R Intergenic transcripts regulate the epigenetic state of rRNA genes. Mol Cell 22, 351–61 (2006). [DOI] [PubMed] [Google Scholar]
- 33.Zhao Z, Senturk N, Song C & Grummt I lncRNA PAPAS tethered to the rDNA enhancer recruits hypophosphorylated CHD4/NuRD to repress rRNA synthesis at elevated temperatures. Genes Dev 32, 836–48 (2018). [DOI] [PMC free article] [PubMed] [Google Scholar]
- 34.Zhang H et al. Targeting CDK9 Reactivates Epigenetically Silenced Genes in Cancer. Cell 175, 1244–58 e26 (2018). [DOI] [PMC free article] [PubMed] [Google Scholar]
- 35.Ho EC, Donaldson ME & Saville BJ Detection of antisense RNA transcripts by strand-specific RT-PCR. Methods Mol Biol 630, 125–38 (2010). [DOI] [PubMed] [Google Scholar]
- 36.Ramirez F et al. deepTools2: a next generation web server for deep-sequencing data analysis. Nucleic Acids Res 44, W160–5 (2016). [DOI] [PMC free article] [PubMed] [Google Scholar]
- 37.Robinson JT et al. Integrative genomics viewer. Nat Biotechnol 29, 24–6 (2011). [DOI] [PMC free article] [PubMed] [Google Scholar]
- 38.Agrawal S & Ganley ARD The conservation landscape of the human ribosomal RNA gene repeats. PLoS One 13, e0207531 (2018). [DOI] [PMC free article] [PubMed] [Google Scholar]
Associated Data
This section collects any data citations, data availability statements, or supplementary materials included in this article.


