

Abstract
The mitochondrial electron transport chain (ETC) is necessary for tumor growth1–6 and its inhibition has demonstrated efficacy in combination with immuno-, antiangiogenic, or oncogene targeted-therapies7–9. Furthermore, brain and lung human tumors display robust glucose oxidation by mitochondria10,11. However, it is not fully understood why a functional ETC is necessary for tumor growth in vivo. ETC function is coupled to the generation of ATP, i.e. oxidative phosphorylation (OXPHOS) and the production of TCA cycle metabolites. Mitochondrial complex I and II donate electrons to ubiquinone resulting in the generation of ubiquinol. This allows regeneration of NAD+ and FAD, necessary cofactors for oxidative TCA cycle flux. Mitochondrial complex III oxidizes ubiquinol back to ubiquinone to allow complexes I and II to function. The ubiquinone generated by complex III is also used as an electron acceptor by the only mitochondrial enzyme essential for de novo pyrimidine synthesis, dihydroorotate dehydrogenase (DHODH). We observed impaired tumor growth in cancer cells lacking mitochondrial complex III. This phenotype was rescued by ectopic expression of Ciona intestinalis alternative oxidase (AOX) 12 that also oxidizes ubiquinol to ubiquinone. Loss of mitochondrial complex I, II, or DHODH diminished the tumor growth of AOX expressing cancer cells deficient in mitochondrial complex III, highlighting the necessity of ubiquinone as an electron acceptor for tumor growth. Cancer cells that lack mitochondrial complex III but can regenerate NAD+ by expression of the NADH oxidase from Lactobacillus brevis (LbNOX) 13 targeted to the mitochondria or cytosol still failed to grow tumors. This suggests that NAD+ regeneration is not sufficient to drive tumor growth in vivo. Collectively, our findings indicate that tumor growth requires the ETC to oxidize ubiquinol which is essential to drive oxidative TCA cycle and DHODH activity.
To genetically decipher the mechanism underlying the necessity of the ETC for tumor growth, we utilized 143B osteosarcoma cells that are deficient in mitochondrial complex III. These cells contain a 4-base pair deletion of the cytochrome b gene (143B-Cytb-Δ), encoding an essential component of complex III. The loss of complex III function results in dysfunctional ETC, oxidative phosphorylation (OXPHOS), and DHODH activities (Extended Fig. 1a and 1b). These cells maintain their mitochondrial membrane potential by reversing mitochondrial complex V (ATP synthase) activity14. 143B-Cytb-Δ cells have a negligible oxygen consumption rate (OCR) (Fig. 1a) and OXPHOS (i.e. coupled OCR) (Extended Fig. 1c). 143B-Cytb-Δ cells are auxotrophic for pyruvate and uridine in vitro2. In addition, they require pyruvate to maintain aspartate levels, a key metabolite for tumor growth in vivo, by maintaining the NAD+/NADH ratio15–18 and uridine to maintain pyrimidine synthesis in the absence of DHODH activity due to loss of complex III function19. Indeed,143B-Cytb-Δ fail to maintain aspartate synthesis or proliferate in the absence of cell permeable methyl pyruvate (MP) or uridine (Extended Fig. 1d–f). As expected, the whole cell NAD+/NADH ratio (which is the average of the cytosolic and mitochondrial pools) was significantly lower in 143B-Cytb-Δ cells in the absence of MP and uridine (Extended Fig. 1g). Regardless of the availability of pyruvate and uridine, 143B-Cytb-Δ cells display significant differences in metabolite levels compared to WT 143B cells (Extended Fig. 1h,i). Our previous studies have demonstrated that 143B-Cytb-Δ cells in vitro can sustain anchorage independent growth in the presence of pyruvate and uridine through glutamine-dependent reductive carboxylation2,20. Yet, 143B-Cytb-Δ cells failed to grow tumors in vivo, highlighting different growth phenotypes between in vitro and in vivo environments (Fig. 1b and Extended Fig. 1j). To further confirm the necessity of complex III for tumor growth in immunocompetent mice, we used CRISPR/Cas9 gene editing to knock out Uqcrq, encoding the QPC subunit of complex III, in KrasG12D/+ p53−/− (KP) cells isolated from murine lung tumors (Fig. 1c). Loss of QPC in KP cells diminished basal and coupled OCR (Fig. 1d and Extended Fig. 1k), and significantly reduced tumor growth upon orthotopic mouse lung transplantation (Fig. 1e). Mice injected with KP-NT cells had significantly worse survival than mice injected with KP-QPC_KO cells (Fig. 1f). Additionally, we explored the effect of complex III loss in T cell acute lymphoblastic leukemia (T-ALL) in vivo (Extended Figure 2a). Hematopoietic stem cells (HSCs) from donor mice with loxP-flanked (Uqcrqflox/−) or wild-type (Uqcrqwt/−) Uqcrc alleles and tamoxifen-inducible UBC-CreERT2 were transformed and adoptively transferred into immunocompetent mice. Upon establishment of T-ALL detectable in the peripheral blood of the recipients, tamoxifen was administered to induce loss (QPC-KO) or maintenance (QPC-WT) of complex III function in T-ALL cells (Extended Fig. 2a). Analysis of GFP+ T-ALL cell contents in the spleen and bone marrow revealed that only QPC-WT cells were able to establish significant T-ALL burden (Extended Fig. 2b–e). Accordindly, the spleens of mice containing QPC-WT T-ALL cells were significantly enlarged compared to those with QPC-KO (Extended Fig. 2f) and mice containing leukemic cells with functional mitochondria (QPC-WT) had significantly worse survival (Extended Fig. 2g). Collectively, these data indicate that mitochondrial complex III is required for tumor growth in vivo.
Figure 1: Complex III is necessary for tumor growth.
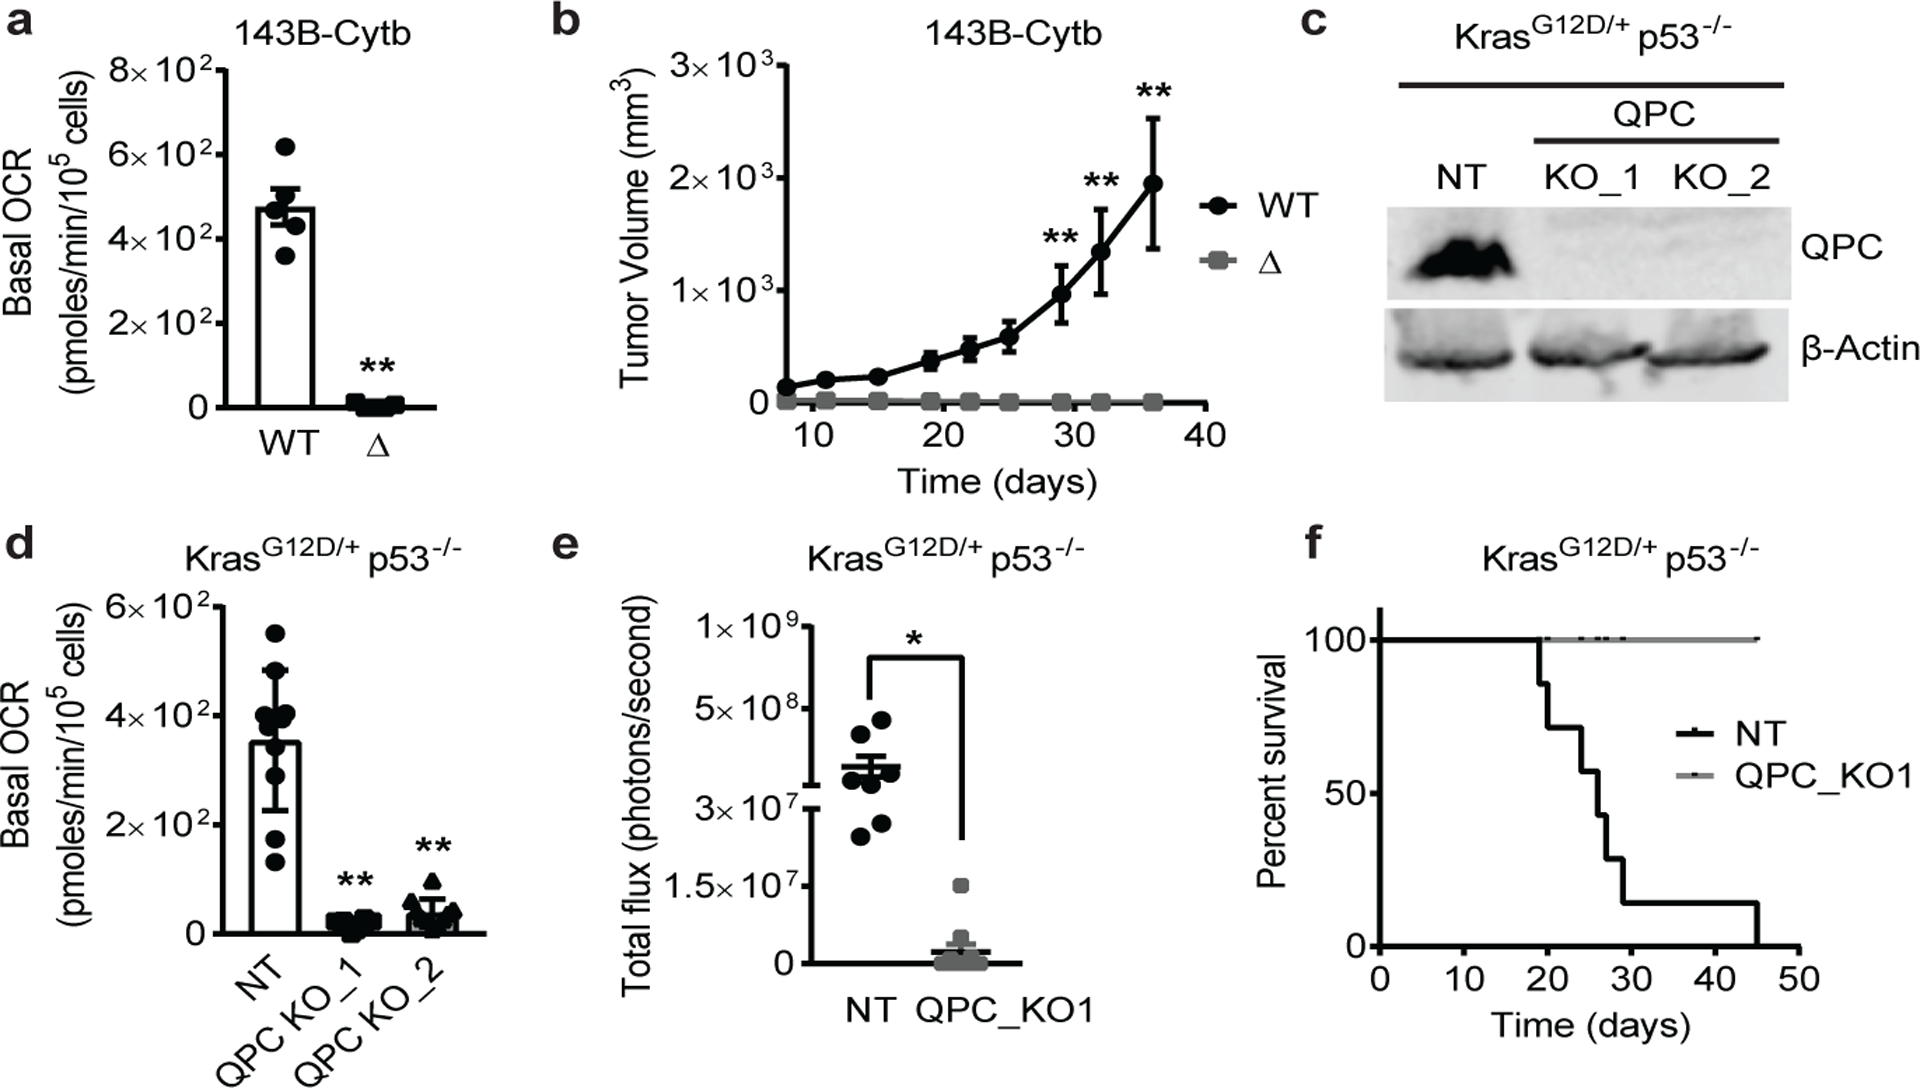
a, Basal OCR of 143B-Cytb-WT and 143B-Cytb-Δ cells (n=5 biologically independent experiments). b, Average tumor volume of xenografts from 143B-Cytb-WT and 143B-Cytb-Δ cells (n=10 mice). c, Western blot analysis of QPC in KP-non targeting (NT) and knockout (KO) clones. β-Actin used as a loading control. d, Basal OCR of KP-NT and KP-QPC_KOs cells (n=10 replicates from two independent experiments). e, Luminescence values from the tumors. Values between day 19 and day 33 post-implantation with KP-NT cells (n=7 mice), or day 33 post-implantation with KP-QPC_KO cells (n=10 mice). f, Survival of mice implanted with KP-NT (n=7) and QPC_KO cells (n=10). Data represent mean ± s.e.m. (a, b, e) or mean ± s.d. (d). Statistical significance was determined using two-tailed t-tests (a,e), 2-way ANOVA (b) with a Bonferroni test for multiple comparisons and 1-way ANOVA (d) with a Bonferroni test for multiple comparisons (*p < 0.05; **p < 0.01, exact P values in Source Data). Survival curves were compared using the log-rank test (p<0.0001). Tumor studies are from two independent cohorts. For gel source data, see Supplemental Figure 1.
Ubiquinol oxidation is an essential activity of mitochondrial complex III that allows complex I, II, and DHODH to function. We ectopically and stably expressed GFP or Ciona intestinalis alternative oxidase (AOX) in 143B-Cytb-Δ cells to restore ubiquinol oxidation14 (Extended Fig. 3a). AOX transports electrons from ubiquinol directly to oxygen, bypassing ETC complex III and IV activities12. As a result, AOX restored basal OCR in 143B-Cytb-Δ cells (Fig. 2a). AOX conducts electron flux but not proton pumping thus it does not directly contribute to the proton-motive force for ATP synthesis. However, ubiquinol oxidation by AOX allows complex I to proton pump, consequently restoring OXPHOS (Extended Fig. 3b). AOX expression in 143B-Cytb-Δ cells alleviated their auxotrophy for pyruvate and uridine (Fig. 2b), restored the NAD+/NADH ratio (Fig. 2c), aspartate levels (Fig. 2d), and partially rescued TCA cycle metabolite levels in the absence of MP and uridine (Extended Fig. 1h). Importantly, AOX expression in 143B-Cytb-Δ cells rescued tumor growth in vivo (Fig. 2e and Extended Fig. 3c). Similarly, AOX expression in KP-QPC_KO cells rescued basal and coupled OCR (Fig. 2f and Extended. Fig. 3d), and in vivo lung tumor growth (Fig. 2g). Mice transplanted with KP-QPC_KO-AOX cells had significantly worse survival than mice transplanted with KP-QPC_KO-GFP cells (Fig. 2h). Our results indicate that the essential function of mitochondrial complex III for tumor growth is ubiquinol oxidation and not its ability to proton pump or donate electrons to the downstream electron carrier cytochrome c.
Figure 2: Ubiquinol oxidation by complex III is necessary for tumor growth.
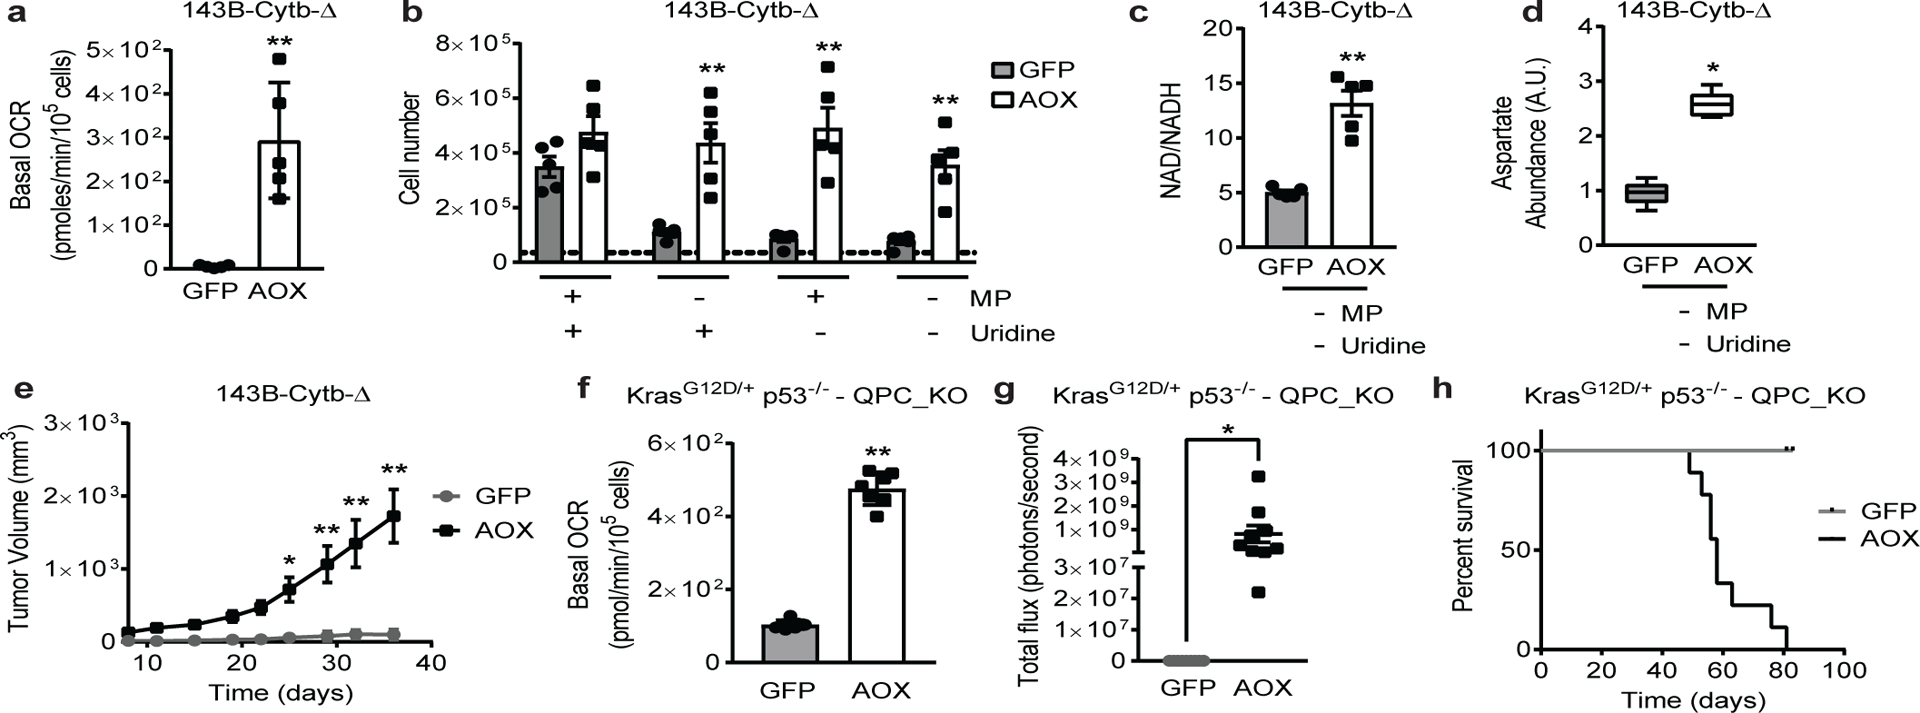
a, Basal OCR of 143B-Cytb-Δ-GFP and 143B-Cytb-Δ-AOX cells (n=5 biologically independent experiments). b, 143B-Cytb-Δ-GFP and 143B-Cytb-Δ-AOX cells were grown in the presence or absence of methyl pyruvate and/or uridine and cell number was assessed after 72h (n=5 biologically independent experiments). c,d, Intracellular NAD+/NADH ratio (c) and aspartate levels (d) of 143B-Cytb-Δ-GFP and 143B-Cytb-Δ-AOX cells in the absence of methyl pyruvate and uridine (n=5 biologically independent experiments). e, Average tumor volume of xenografts from 143B-Cytb-Δ-GFP and 143B-Cytb-Δ-AOX cells (n=9 mice). f, Basal OCR of KP-QPC_KO-GFP and KP-QPC_KO-AOX cells (n=7 technical replicates; representative of five biologically independent experiments). g, Luminescence values from the tumors. Values prior to euthanasia between day 49 and day 83 post-implantation with KP-QPC_KO-AOX, or day 81 or 83 post-implantation with KP-QPC_KO-GFP cells (n=9 mice). h, Survival of mice implanted with KP-QPC_KO-GFP and KP-QPC_KO-AOX cells. (n=9 mice). Data represent mean ± s.e.m. (a-e, g) or mean ± s.d. (f). Statistical significance was determined using two-tailed t-tests (a, c, f, g) or 2-way ANOVA (b, e) with a Bonferroni test for multiple comparisons (*p < 0.05; **p < 0.01, exact P values in Source Data). Survival curves were compared using the log-rank test (p<0.0001). Aspartate levels (d) were analyzed with multiple one-way ANOVA using an FDR of 0.1 and Fisher’s least significant difference test post-hoc analyses Q=10%. (*Q<.1 0.001, exact Q values in Source Data). Tumor studies are from two independent cohorts.
Ubiquinol oxidation supports DHODH function (Extended Fig. 3a). Similar to the genetic inactivation of cytochrome b, treatment with the complex III inhibitor Antimycin A rendered 143B-Cytb-WT cells auxotrophic for pyruvate and uridine (Extended Fig. 3e). However, the complex I inhibitor Piericidin A made the cells auxotrophic for pyruvate but not uridine (Extended Fig. 3e). Importantly, the dihydroorate to orotate ratio increased in 143B-Cytb-WT cells treated with Antimycin A, but not with Piericidin A (Extended Fig. 3f). These results indicate that the availability of the Q pool, which is only compromised when complex III function is inhibited, is the key factor for the maintenance of de novo pyrimidine synthesis. We tested the necessity of the de novo pyrimidine synthesis pathway through CRISPR/Cas9-mediated inactivation of DHODH in AOX expressing 143B-Cytb-Δ cells (Extended Fig. 4a). Loss of DHODH caused uridine auxotrophy and reduced tumor growth in vivo (Extended Fig. 4b–e), while reconstituting its cDNA restored those phenotypes (Extended Fig. 4f–i).
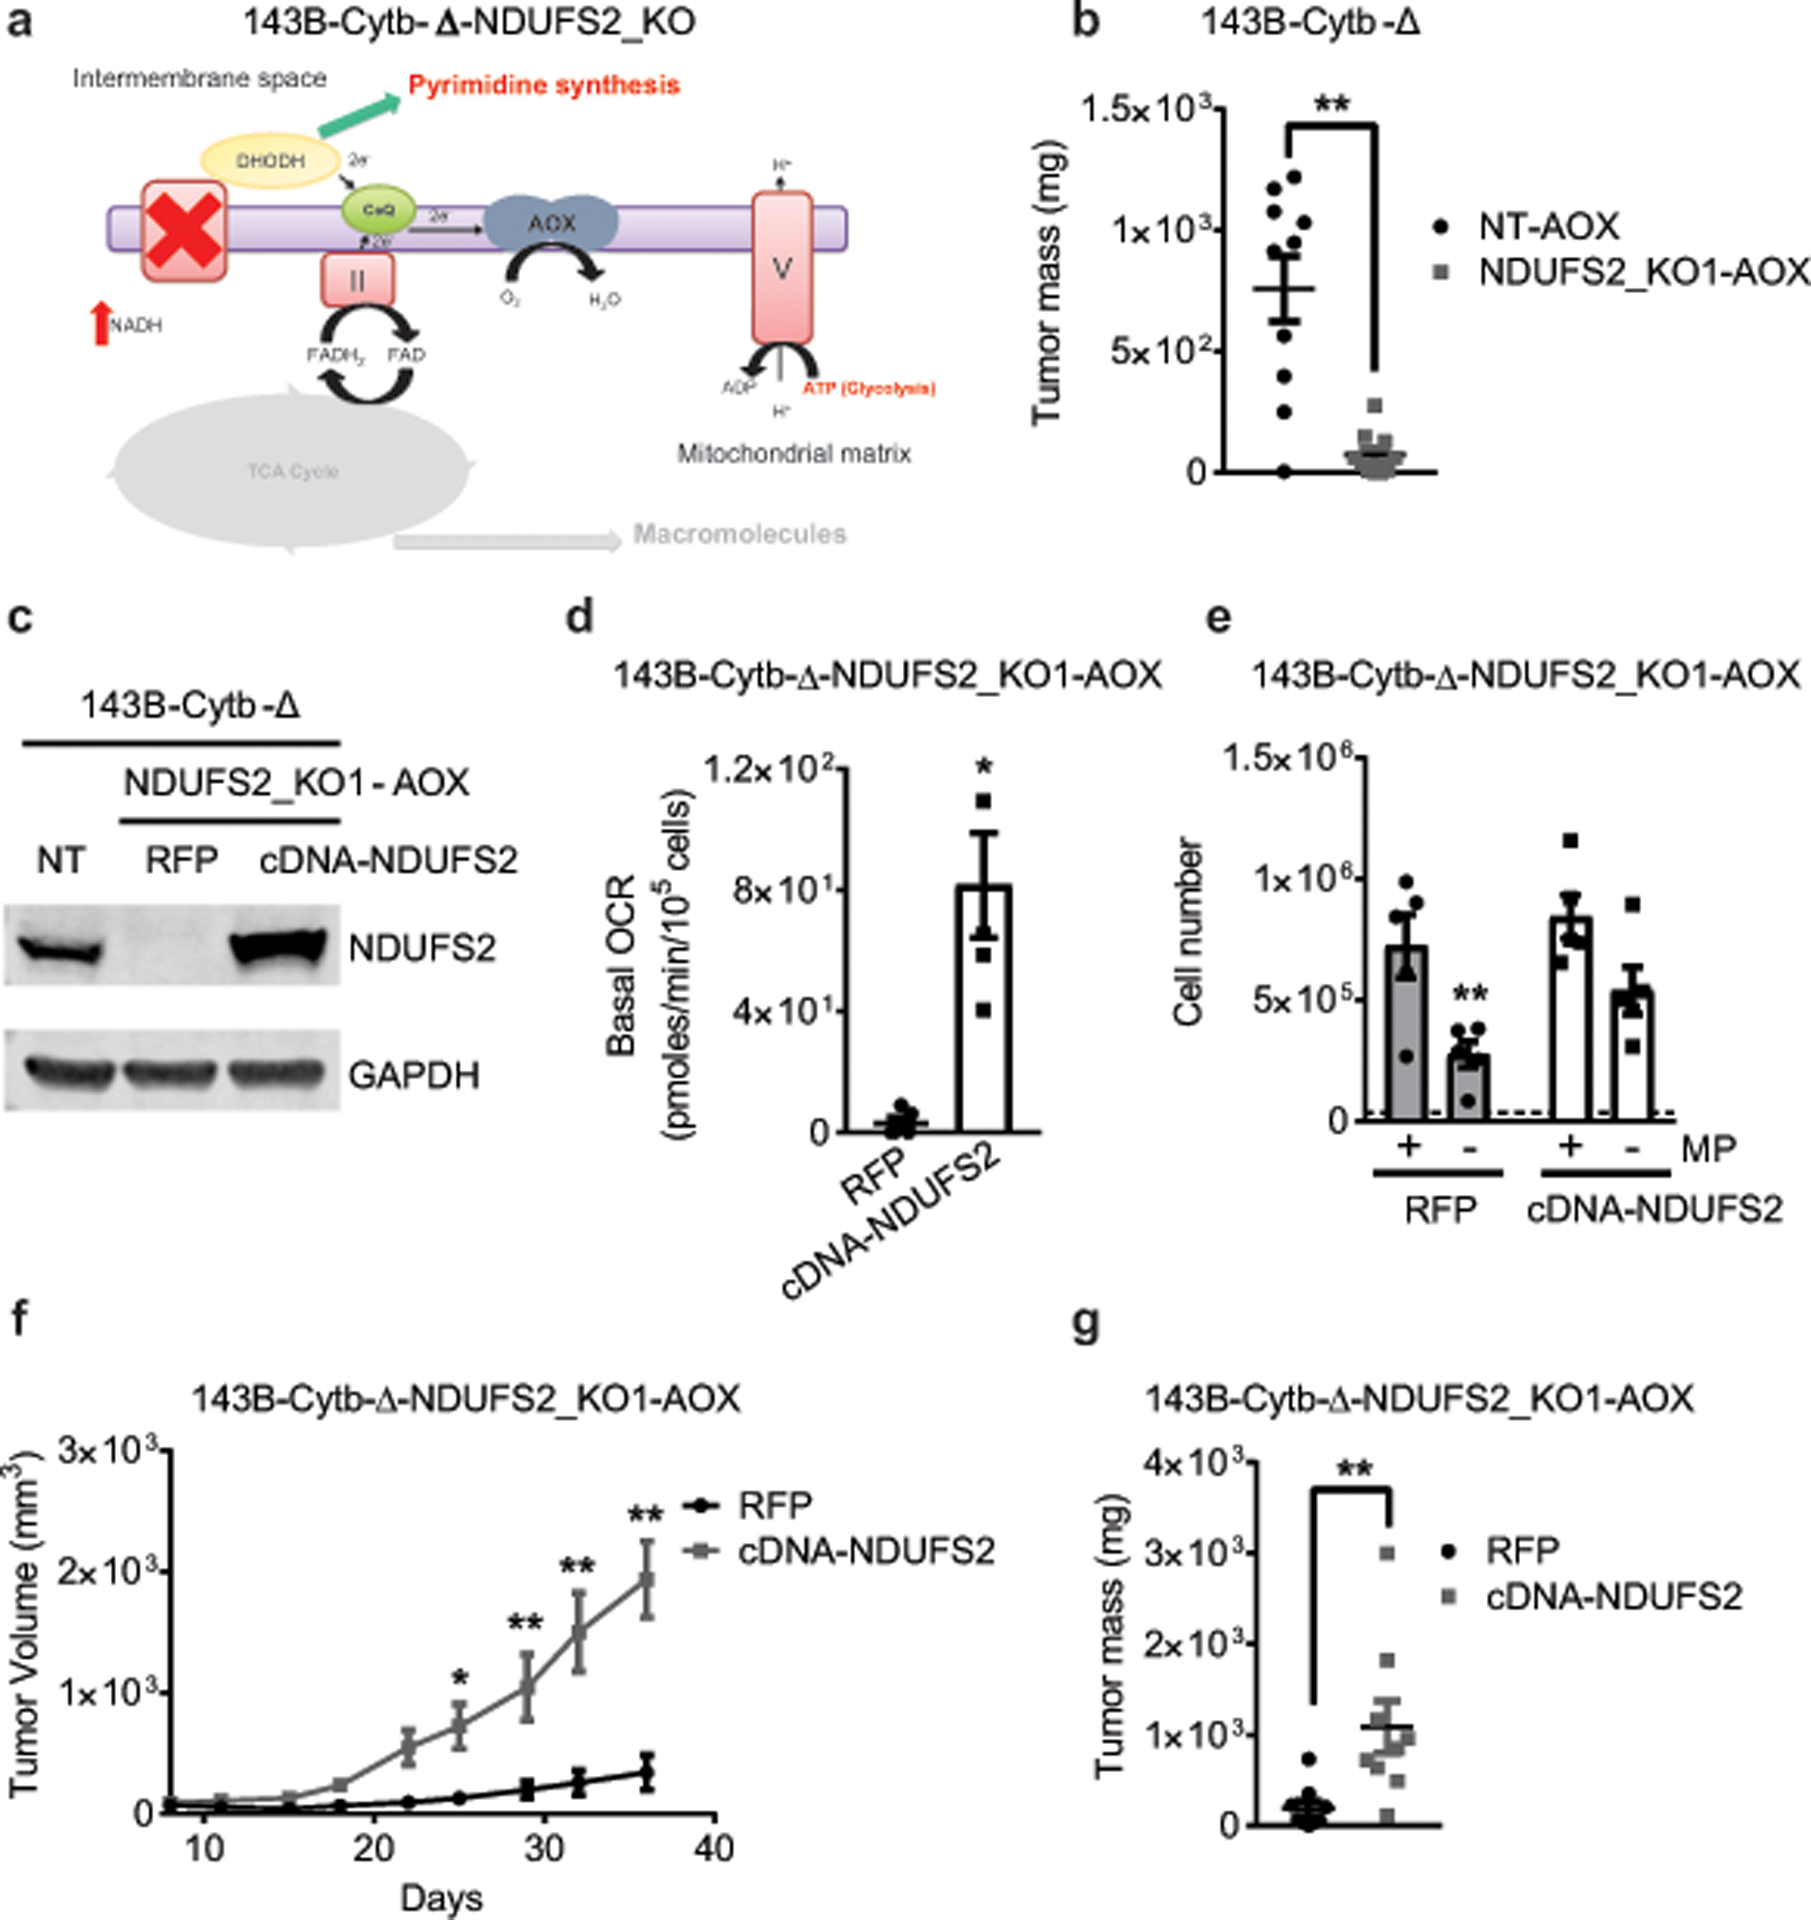
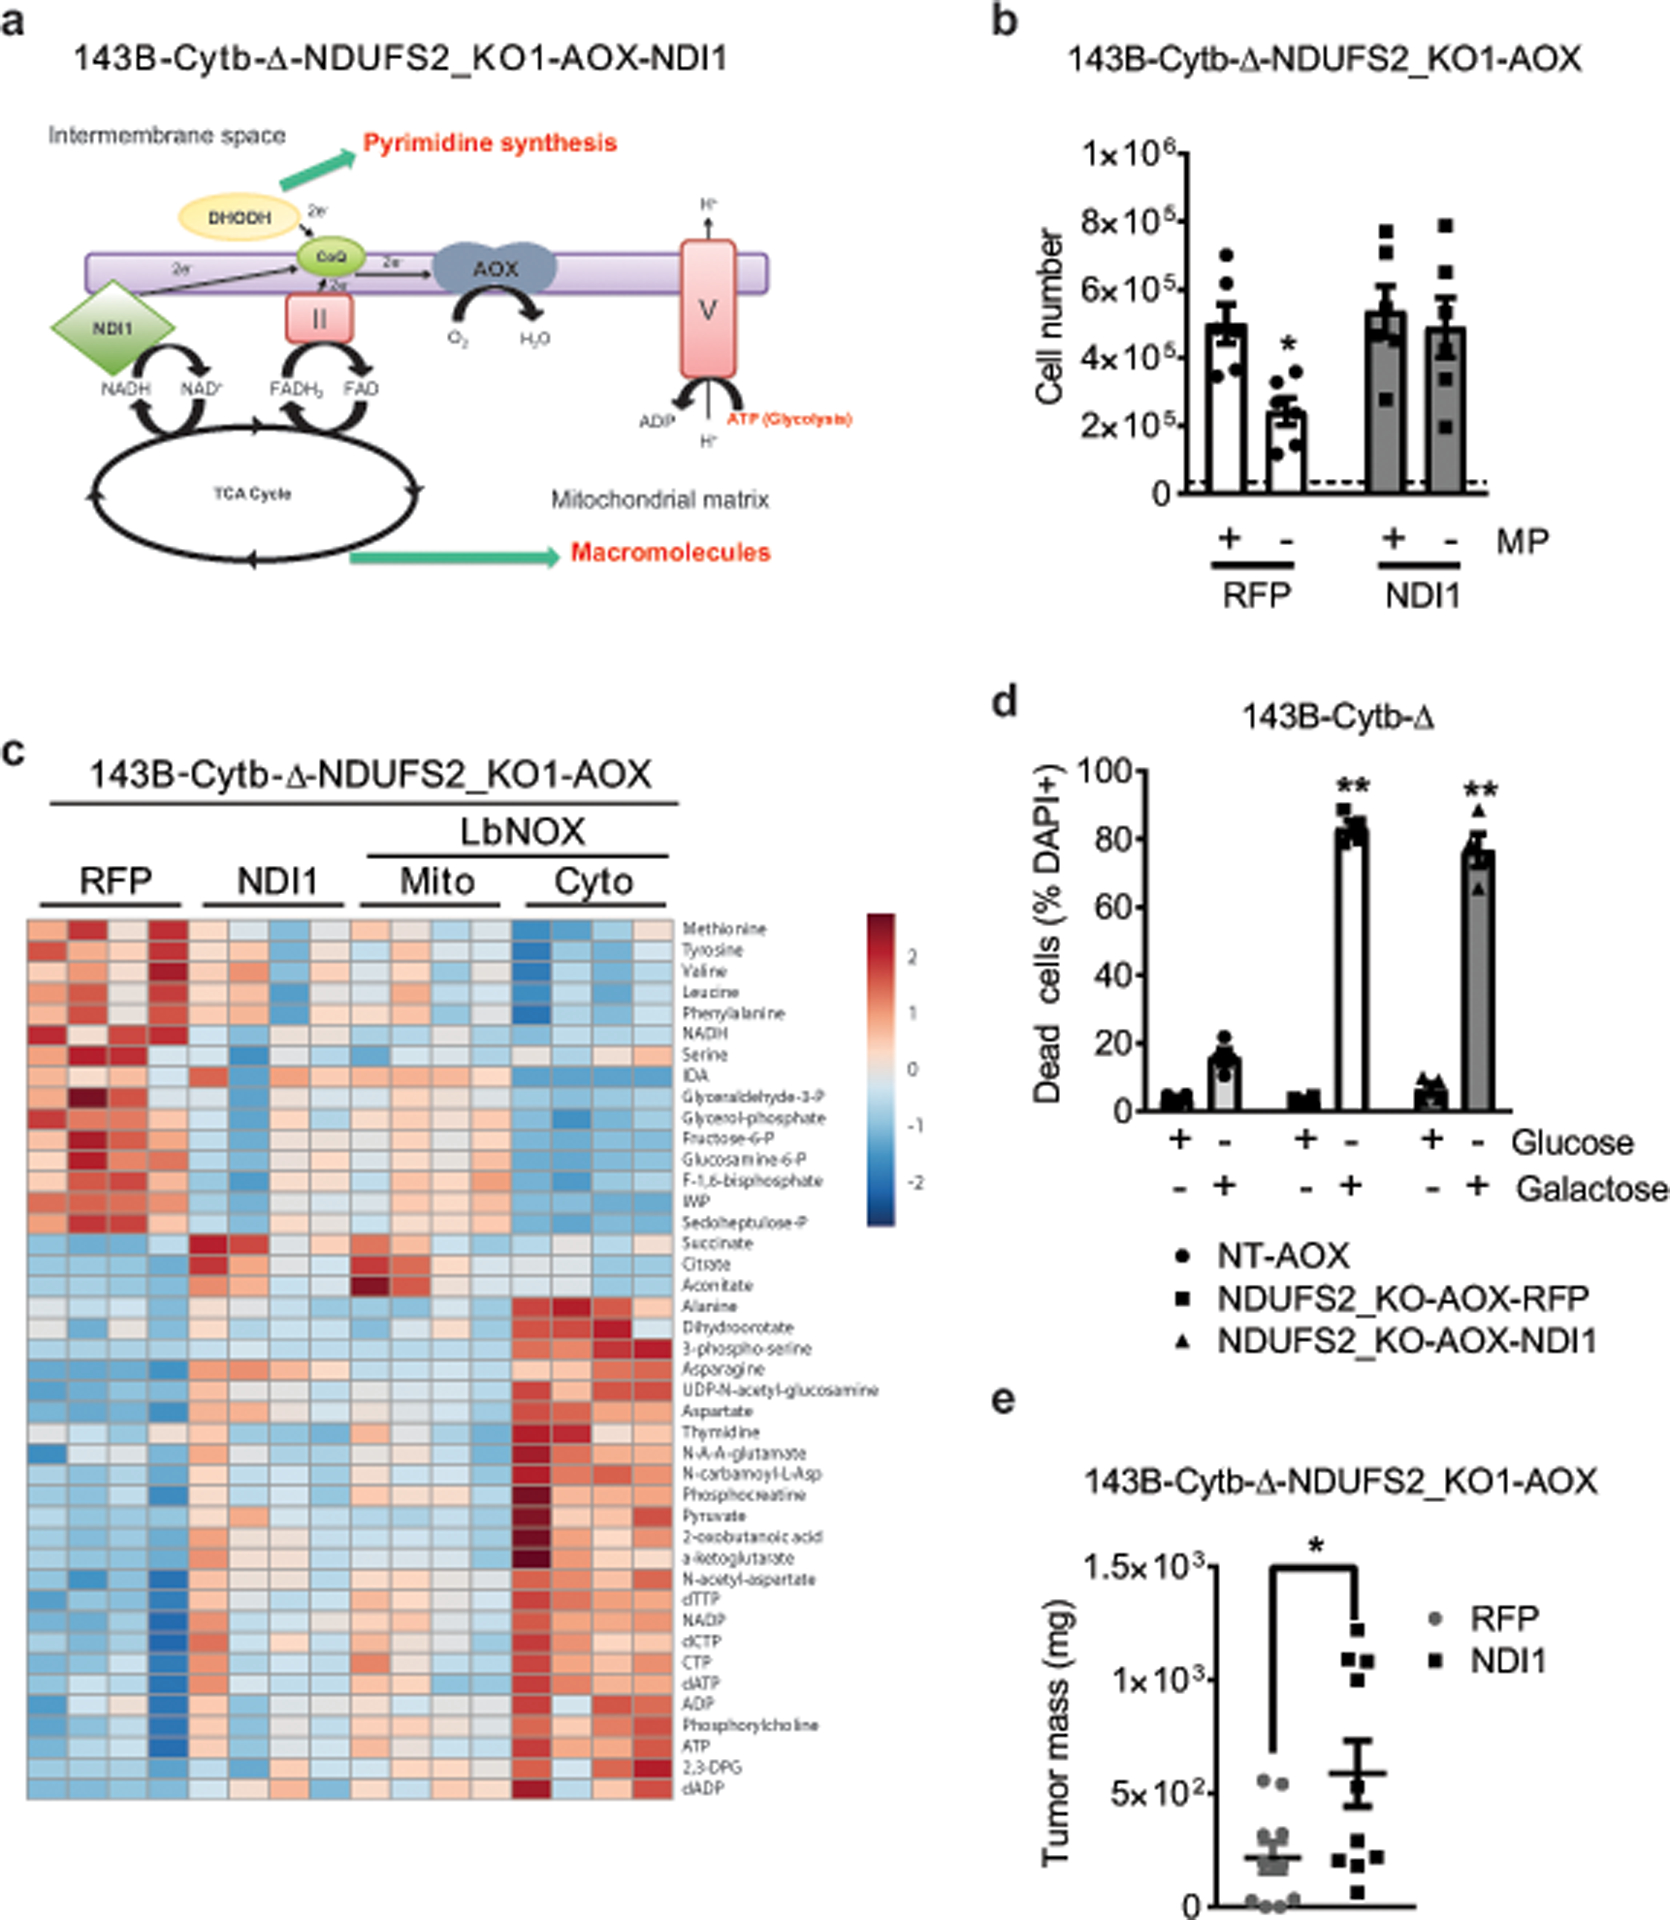
Ubiquinol oxidation is required for mitochondrial complex I function. Therefore, we tested the necessity of complex I in AOX expressing 143B-Cytb-Δ cells by inactivating NDUFS2, which encodes an essential subunit of complex I (Fig. 3a and Extended Fig. 5a). The loss of NDUFS2 made AOX expressing 143B-Cytb-Δ cells auxotrophic for pyruvate in vitro (Fig. 3b), and ablated their in vivo tumor growth (Fig. 3c and Extended Figure 5b). Reconstitution of NDUFS2 cDNA restored the OCR, pyruvate prototrophy, and in vivo tumor growth (Extended Fig. 5c–g). Mitochondrial complex I has two key functions: (1) donating electrons from NADH to ubiquinone resulting in generation of NAD+, which allows the oxidative TCA cycle to function, and (2) proton-pumping, which contributes to the generation of ATP through OXPHOS. To investigate if the proton-pumping activity of complex I is necessary for tumor growth, we ectopically expressed control RFP or the Saccharomyces cerevisiae alternative NADH dehydrogenase (NDI1) in the AOX expressing 143B-Cytb-Δ-NDUFS2_KO cells (Extended Fig. 6a). NDI1 can oxidize NADH to NAD+ by donating electrons to ubiquinone without generating proton-motive force14. Therefore, NDI1 restored mitochondrial NADH oxidation, alleviated pyruvate auxotrophy, and changed the metabolome of the AOX expressing 143B-Cytb-Δ-NDUFS2_KO cells (Fig. 3d, and Extended Fig. 6b,c). Oligomycin, an ETC complex V inhibitor, did not decrease OCR indicating that these cells are unable to conduct OXPHOS (Fig. 3e). Moreover, NDI1 and AOX expressing 143B-Cytb-Δ-NDUFS2 KO cells underwent cell death when glucose was replaced by galactose, which forces cells to rely on mitochondrial ATP for survival (Extended Fig. 6d). Interestingly, NDI1 increased tumor growth of AOX expressing 143B-Cytb-Δ-NDUFS2 KO cells (Fig. 3f and Extended Fig. 6e), indicating that OXPHOS is not necessary to support tumor growth.
Figure 3: Complex I is necessary for tumor growth.
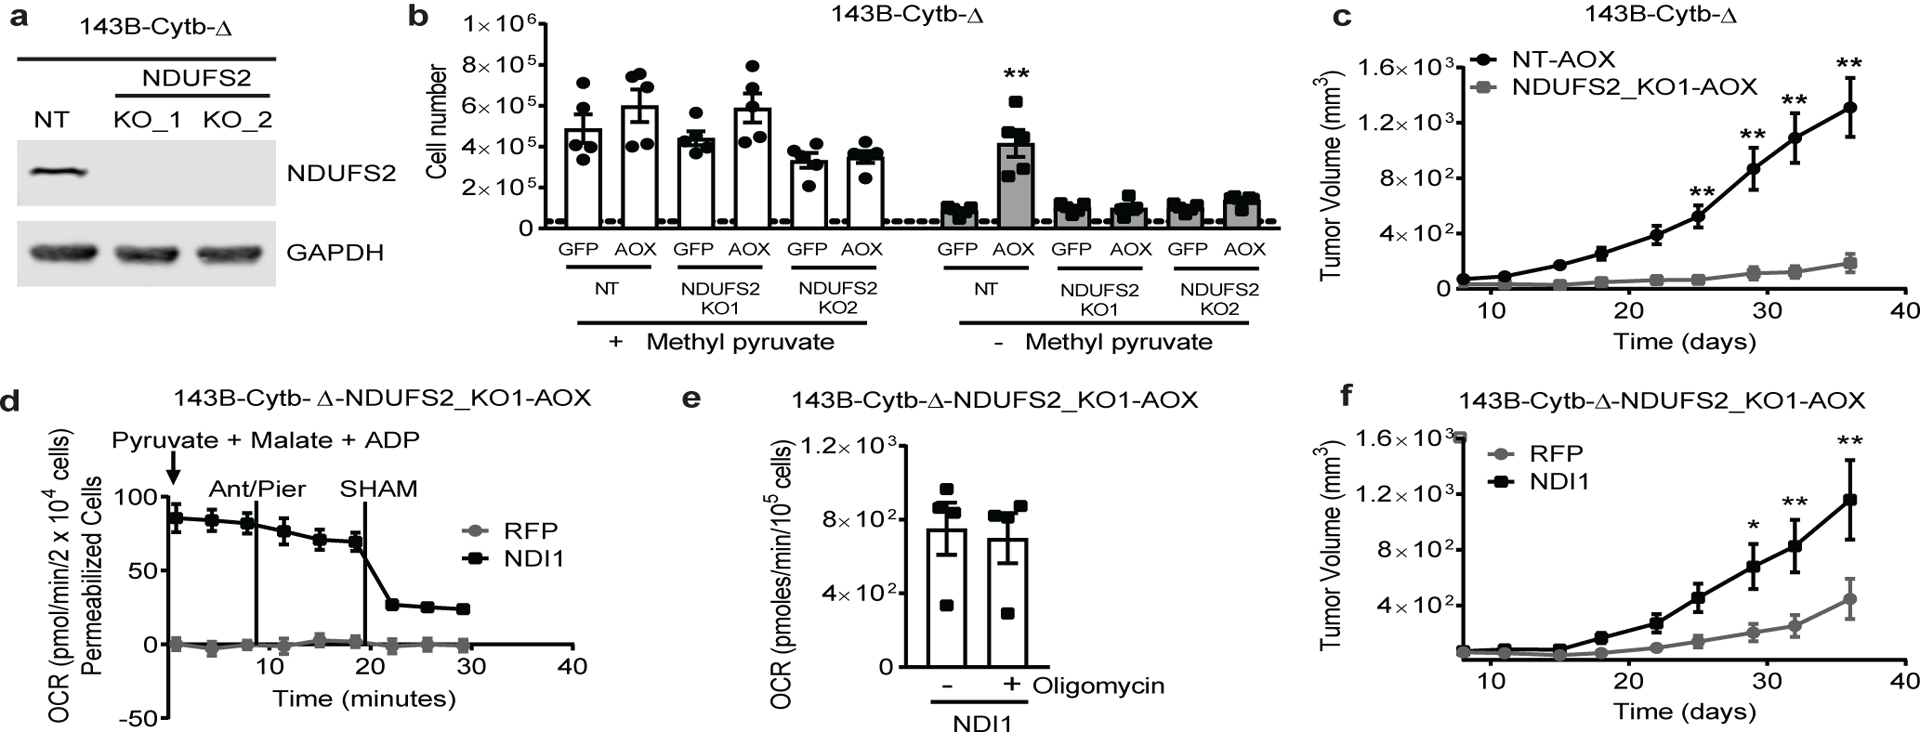
a, Western blot analysis of NDUFS2 protein levels in 143B-Cytb-Δ non targeting (NT) and 143B-Cytb-Δ-NDUFS2_KOs cells. GAPDH used as a loading control. Representative of two independent experiments. b, 143B-Cytb-Δ-NT and 143B-Cytb-Δ-NDUFS2_KOs cells expressing either GFP or AOX were grown in media containing uridine and in the presence or absence of methyl pyruvate and cell number was assessed after 72h. (n=5 biologically independent experiments). c, Average tumor volume of xenografts from 143B-Cytb-Δ-NT-AOX and 143B-Cytb-Δ-NDUFS2_KO1-AOX cells (n=10 mice). d, Complex I driven oxygen consumption rate of permeabilized 143B-Cytb-Δ-NDUFS2_KO1 cells expressing AOX and either RFP or NDI1. Piericidin A (1 μM) and Antimycin A (1 μM) were used to inhibit complex I and III respectively. SHAM (2 mM) was used to inhibit AOX activity (n=6 biologically independent experiments). e, OCR in the presence or absence of oligomycin in 143B-Cytb-Δ-NDUFS2_KO1 cells expressing AOX and NDI1 (n=4 biologically independent experiments). f, Average tumor volume of xenografts from 143B-Cytb-Δ-NDUFS2_KO1 cells expressing AOX and either RFP or NDI1 (n=10 mice). Data represent mean ± s.e.m. (b-f). Statistical significance was determined using two-tailed t-tests (e) or 2-way ANOVA (b, c, f) with a Bonferroni test for multiple comparisons (*p < 0.05; **p < 0.01, exact P values in Source Data). For gel source data, see Supplemental Figure 2. Tumor studies are from two independent cohorts.
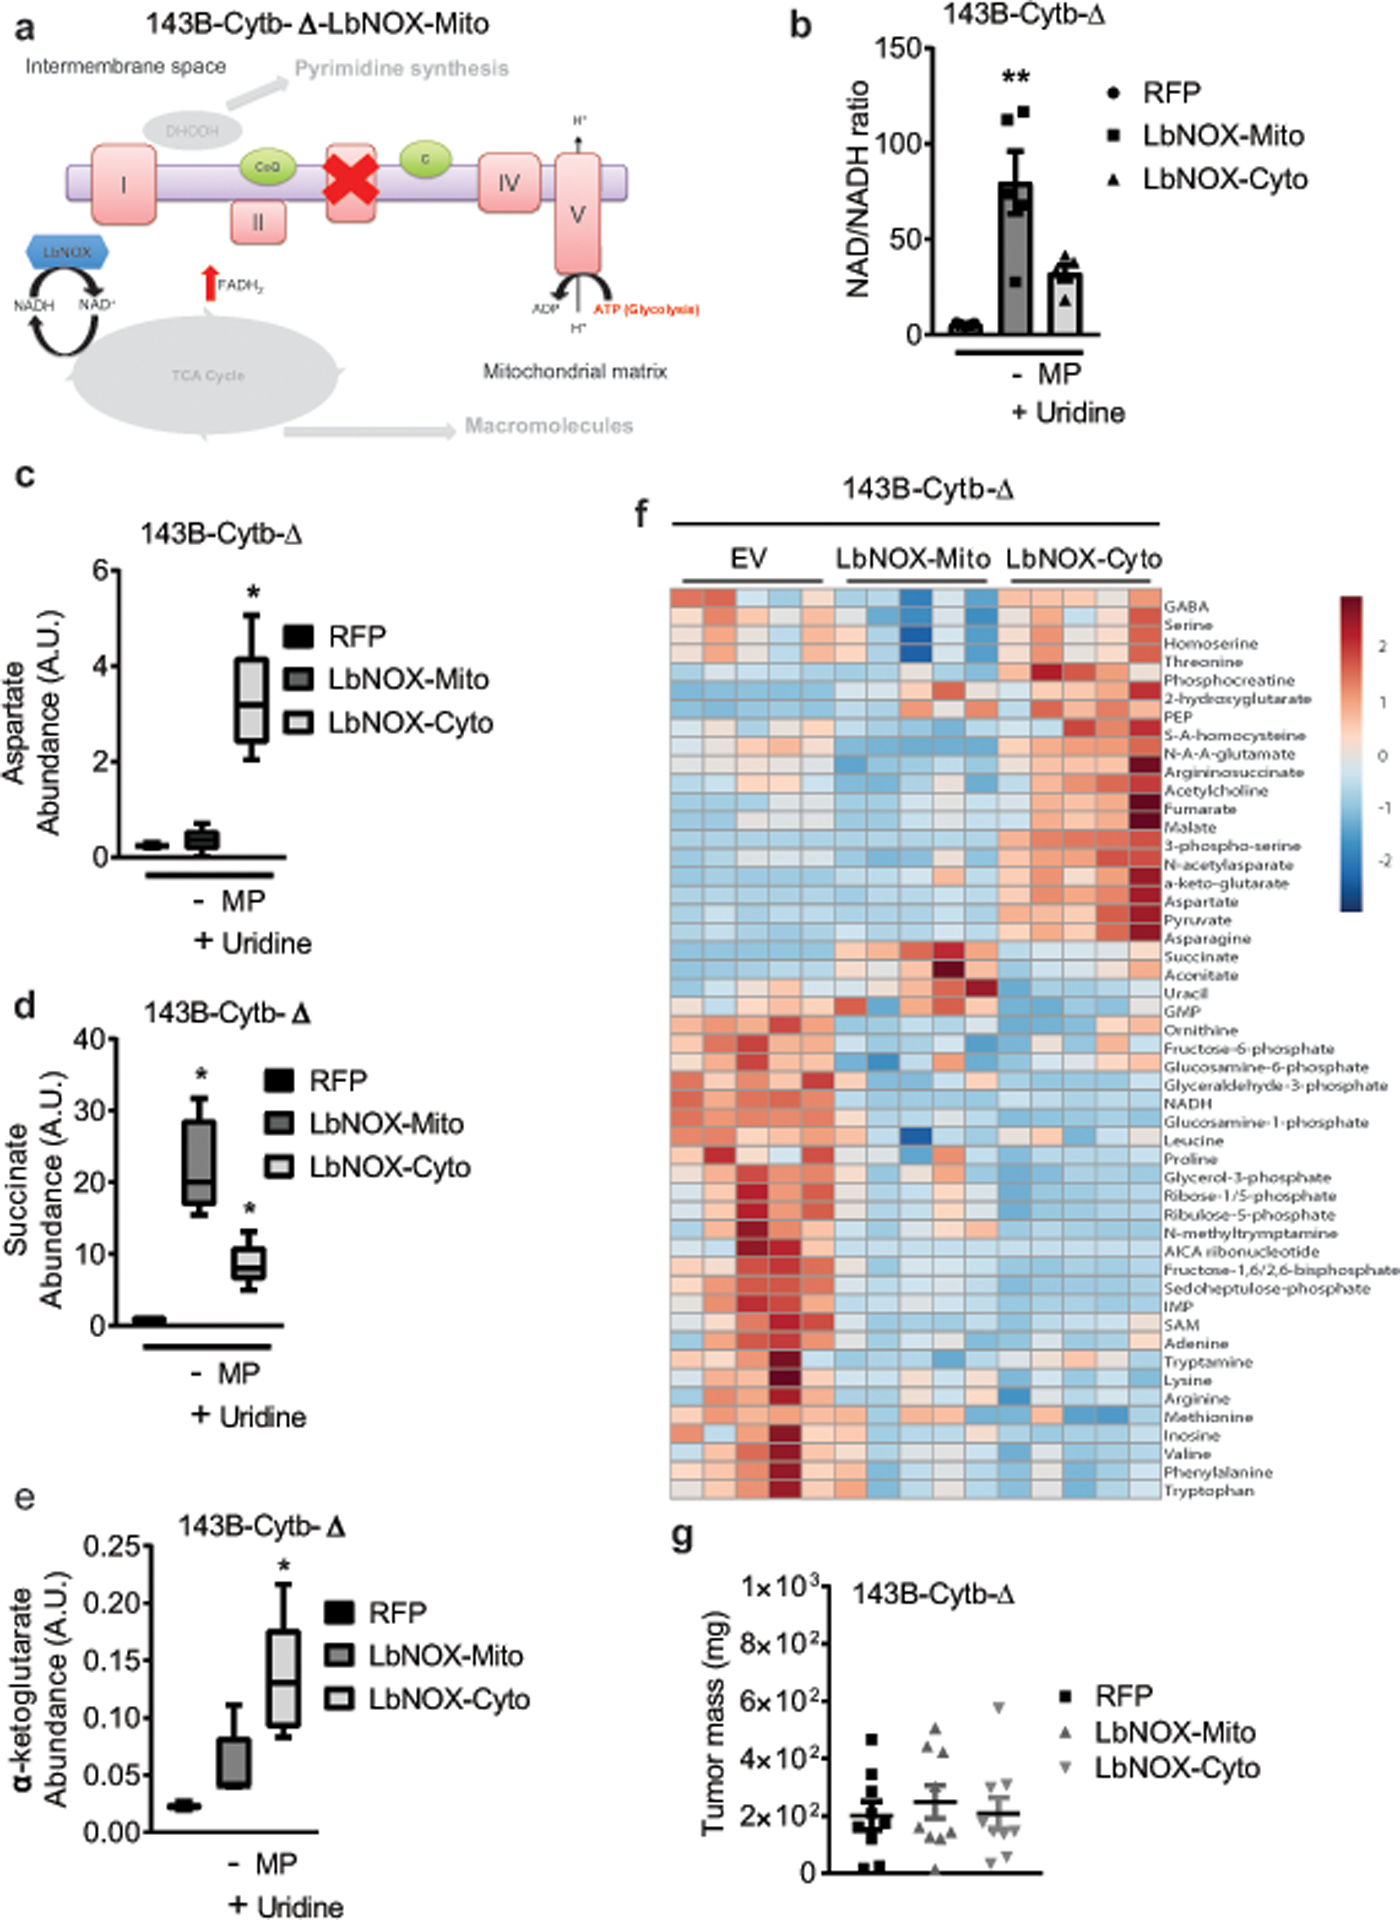
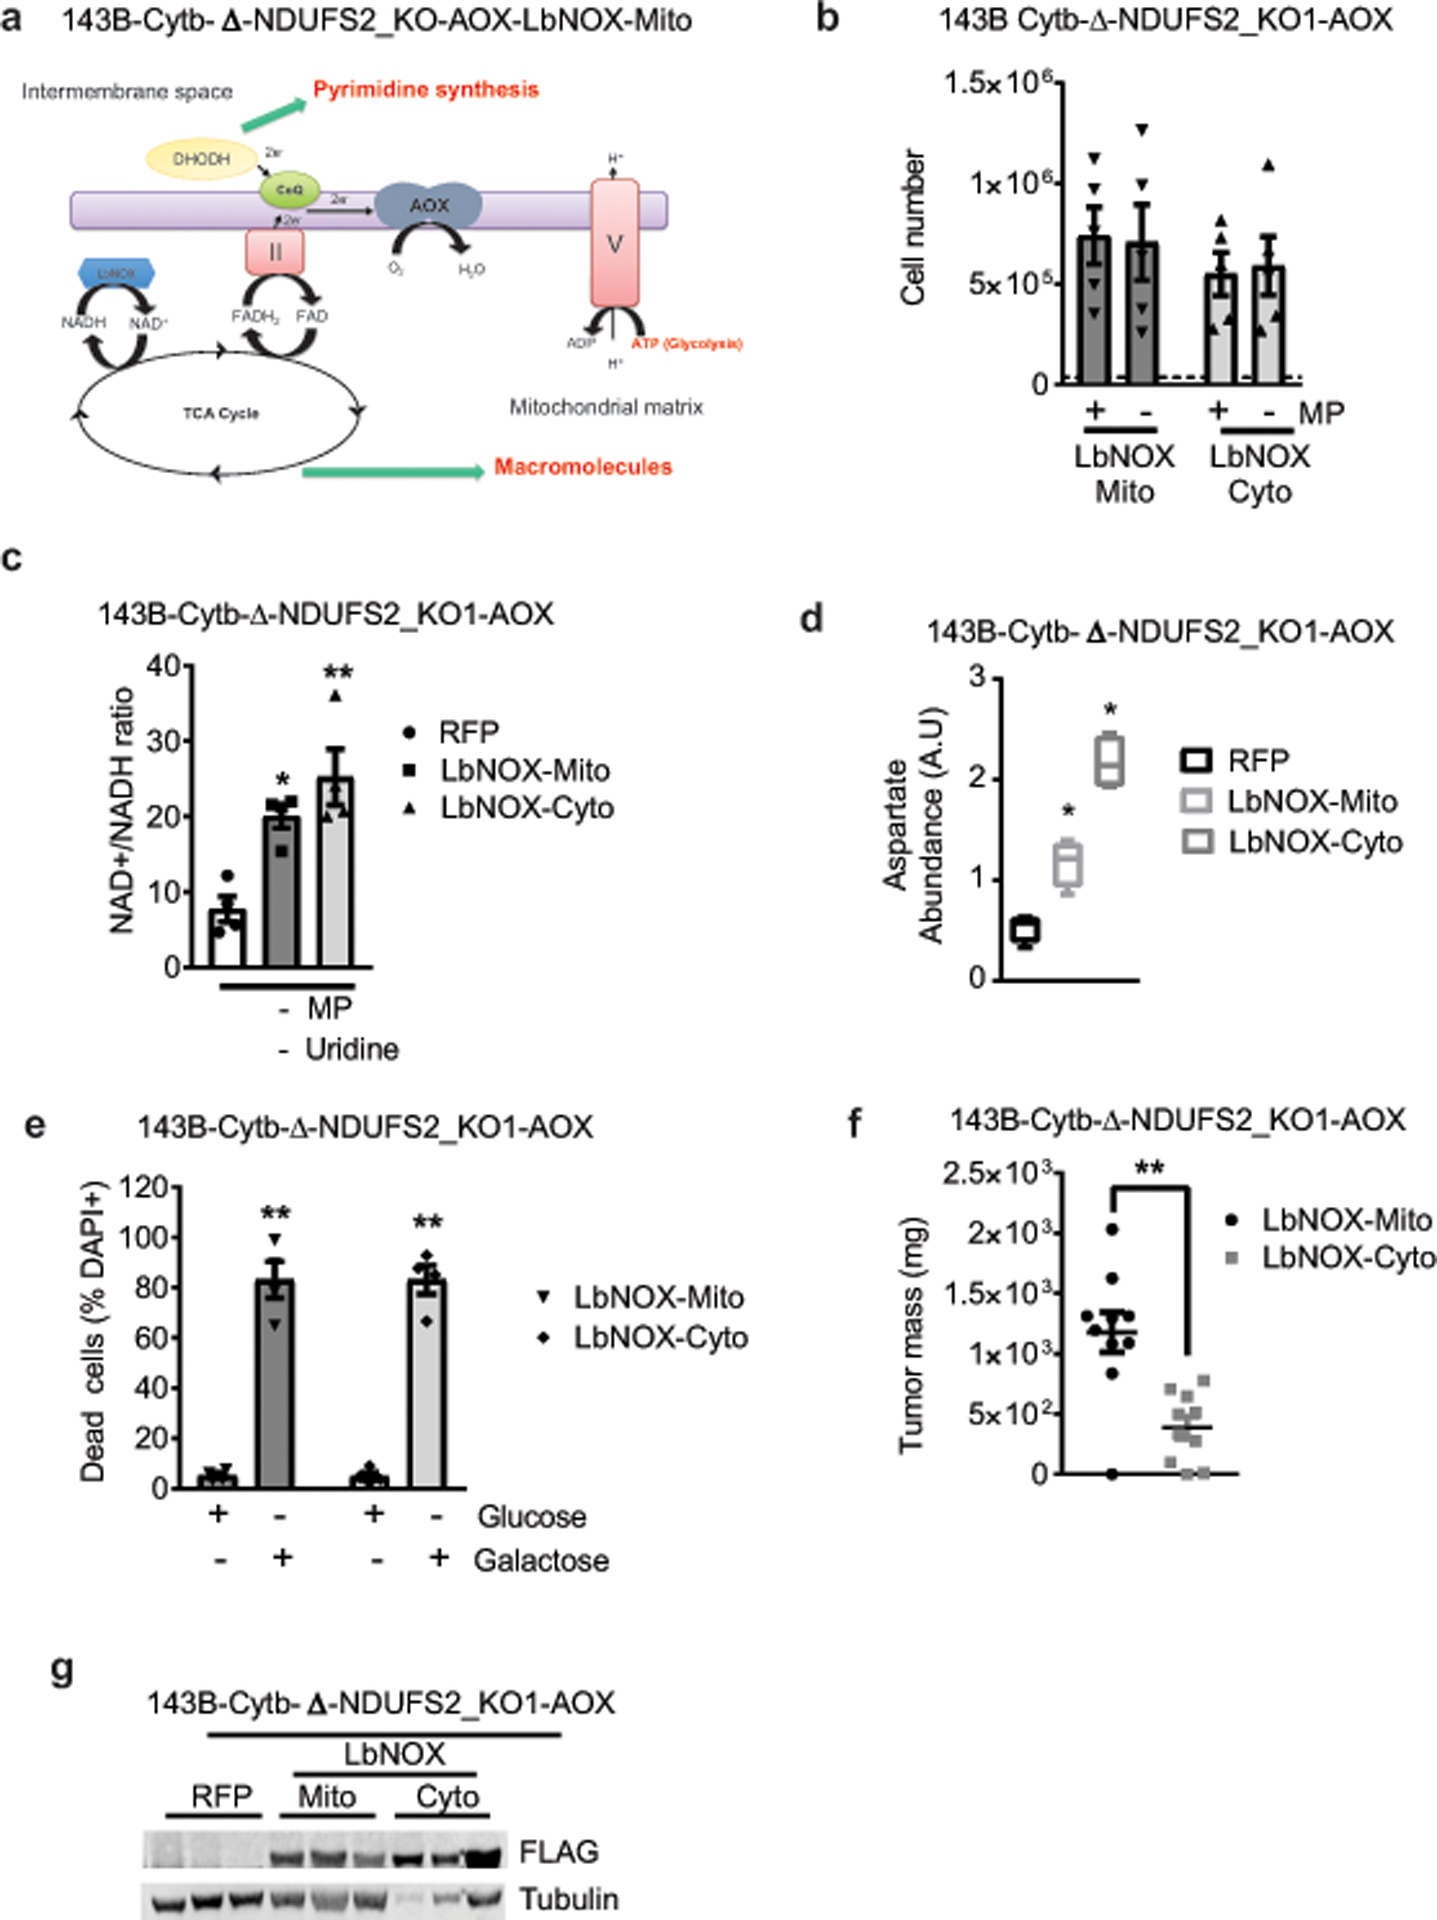
To test whether mitochondrial NAD+ regeneration is necessary and sufficient for tumor growth, we utilized the water-forming NADH oxidase from Lactobacillus brevis (LbNOX) targeted to mitochondrial matrix or cytosol13. Expression of the LbNOX increases NAD+/NADH ratios in the respective compartments, and importantly, restores proliferative defects caused by ETC inhibition in vitro13. To investigate mitochondrial NAD+ sufficiency for tumor growth, we first expressed the mitochondrial or cytosolic LbNOX in 143B-Cytb-Δ cells (Fig. 4a and Extended Fig. 7a). Both cytosolic and mitochondrial LbNOX alleviated pyruvate auxotrophy by increasing the NAD+/NADH ratio the NAD+/NADH ratio, TCA cycle metabolite levels, and cell proliferation in vitro (Fig. 4b and Extended Fig. 7b–f). However, neither cytosolic nor mitochondrial LbNOX expression was sufficient to rescue in vivo tumor growth (Fig. 4c and Extended Fig. 7g). To further test whether NAD+ regeneration is necessary for tumor growth, we expressed the mitochondrial or cytosolic LbNOX in AOX expressing 143B-Cytb-Δ-NDUFS2 KO cells (Extended Fig. 8a). Expression of either LbNOX relieved the cells’ pyruvate auxotrophy, increased NAD+/NADH ratio and aspartate levels of these cells in vitro (Extended Fig. 8b–d). Both LbNOXs changed the metabolome of the cells in vitro (Extended Fig. 6c). Due to the inability of these cells to perform OXPHOS, cell death was observed when glucose in the growth medium was replaced by galactose (Extended Fig. 8e). Interestingly, only mitochondrial LbNOX supported significant tumor growth in vivo (Fig. 4d and Extended Fig. 8f). Importantly, the expression of both LbNOXs inside the in vivo tumors was confirmed (Extended Fig. 8g). A potential difference between cells with mitochondrial versus cytosolic LbNOX is the ability of the former to conduct oxidative TCA metabolism while the latter can only perform reductive TCA metabolism (Extended Fig. 9a). It is likely that oxidative TCA cycle flux generates metabolites more efficiently than reductive TCA cycle flux to support macromolecule synthesis for tumor growth. Indeed, mitochondrial LbNOX supported oxidative TCA cycle flux in the presence of pyruvate, as identified by the elevated levels of M+2 and M+4 mass isotopomer of citrate from U-13C glucose and U-13C glutamine, respectively (Fig. 4e, f). By contrast, cytosolic LbNOX supported reductive metabolism in the presence of pyruvate, as the levels of M+5 mass isotopomer of citrate, and M+3 mass isotopomers of fumarate, aspartate, and malate from U-13C glutamine were significantly increased (Fig. 4f, and Extended Fig. 9b–d). Importantly, the same results were observed in the absence of pyruvate when cells were labeled with U-13C glutamine (Extended Fig. 9e–h). Collectively, our results indicate that although cytosolic NAD+ regeneration can better rescue the metabolic phenotype of complex I deficient cells in vitro (Extended Fig. 6c), mitochondrial NAD+ regeneration, likely due to its unique ability to restore oxidative TCA cycle flux, is more efficient at supporting tumor growth in vivo. These results further support the limitation of in vitro systems in reflecting the metabolic needs of tumors in vivo.
Figure 4: Mitochondrial NAD+ regeneration is necessary but not sufficient for tumor growth in vivo.
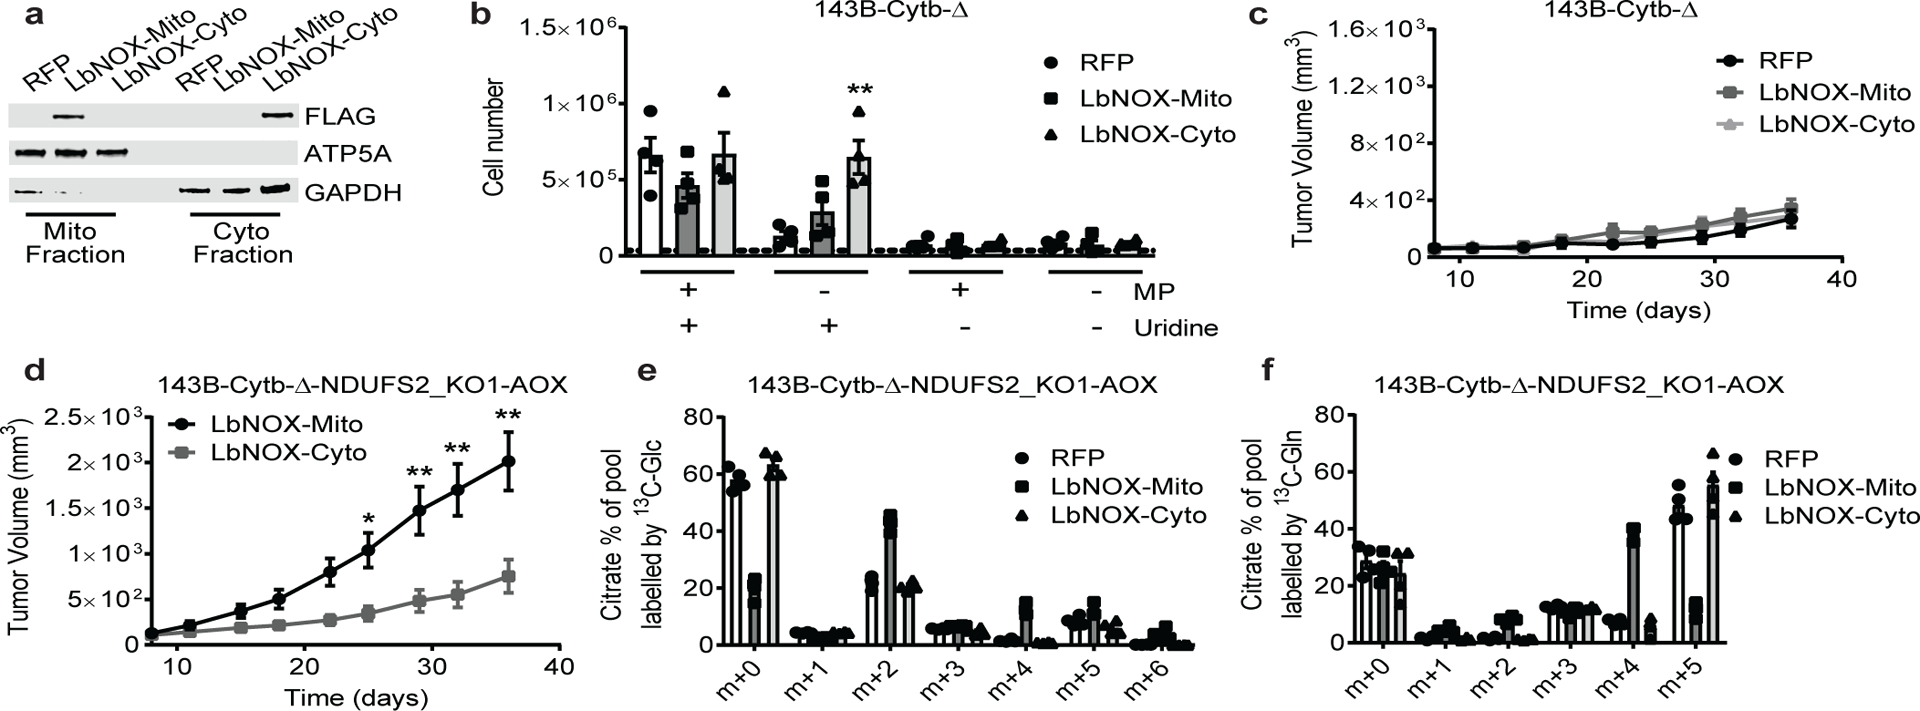
a, Subcellular localization of LbNOX in 143B-Cytb-Δ cells determined by cell fractionation. ATP5A is a mitochondrial marker and GAPDH is a cytosolic marker. Representative of three independent experiments. b, 143B-Cytb-Δ-RFP, 143B-Cytb-Δ-LbNOX-Mito and 143B-Cytb-Δ-LbNOX-Cyto were grown in the presence or absence of methyl pyruvate and/or uridine and cell number was assessed after 72h (n=4 biologically independent experiments). c, Average tumor volume of xenografts from 143B-Cytb-Δ-RFP, 143B-Cytb-Δ-LbNOX-Mito, and 143B-Cytb-Δ-LbNOX-Cyto cells (n=9 mice). d, Average tumor volume of xenografts from 143B-Cytb-Δ-NDUFS2_KO1 cells expressing AOX and either LbNOX-Mito or Cyto (n=10 mice). e,f, 143B-Cytb-Δ-NDUFS2_KO1-AOX cells expressing either RFP or LbNOX in mitochondria or cytosol were labeled for 6h with [U-13C]glucose (e) or [U-13C]glutamine (f) in the presence of methyl pyruvate, and percentage of labeled citrate pools was examined. m+0 pools represent unlabeled fractions (n=4 biologically independent experiments) . Data represent mean ± s.e.m. (b-f). Statistical significance was determined using 2-way ANOVA (b, c, d) with a Bonferroni test for multiple comparisons (*p < 0.05; **p < 0.01, exact P values in Source Data). For gel source data, see Supplemental Figure 3. Tumor studies are from two independent cohorts.
Ubiquinol oxidation is also required for mitochondrial complex II function. We tested whether complex II is essential for tumor growth by genetically inactivating SDHA, which encodes an essential subunit of complex II, in AOX expressing 143B-Cytb-Δ cells (Extended Fig. 10a,b). Previous studies have demonstrated that loss of complex II in cancer cells causes pyruvate auxotrophy for aspartate synthesis21,22. Indeed, loss of SDHA in AOX expressing 143B-Cytb-Δ cells diminished complex II activity, induced pyruvate auxotrophy, and suppressed tumor growth in vivo (Extended Fig. 10c–f). Reconstitution of SDHA cDNA in the cells rescued those phenotypes (Extended Fig. 11a–e). It is important to note that there are rare cancers that exhibit mutations in SDH subunits as well as the TCA cycle enzyme fumarate hydratase (FH) to generate high levels of succinate and fumarate as oncometabolites1 . However, these cancer cells are able to conduct reductive TCA cycle metabolism to generate the necessary metabolites for proliferation1,20–22.
Our results indicate that mitochondrial complex III function is required for tumor growth. Complex III is necessary for ubiquinol oxidation which is essential for complex I and II function and for the de novo pyrimidine synthesis pathway. Our findings indicate that the necessity of complexes I and II for tumor growth is for the regeneration of mitochondrial NAD+ and FAD, which enables oxidative TCA cycle flux. Indeed, cancer cells utilize various mechanisms including glutaminolysis and autophagy to replenish TCA cycle metabolites23. As a result, inhibition of glutaminolysis or autophagy in certain cancers diminishes tumor growth24,25. Recently, a study used positron emission tomography (PET) imaging of a radiotracer, 4-[18F]fluorobenzyl triphenylphosphonium (18FBnTP), to non-invasively measure mitochondrial membrane potential of lung tumors in vivo, which was predictive of their response to complex I inhibitors26. Going forward, it will be of high interest to determine whether complex I inhibitors27 or mitochondrial TCA cycle inhibitors28 are efficacious in ongoing phase 3 clinical trials, and to develop safe but potent chemotherapeutic strategies targeting mitochondrial metabolism in combination with upcoming technologies that profile metabolic states of human cancers.
Methods
Cell culture and drug treatment.
143B-Cytb-WT and 143B-Cytb-Δ cells were previously described29. Mouse KrasG12D/+ p53−/− (KP) lung tumor cells expressing luciferase were generously provided by Dr. Thales Papagiannakopoulos. Cells were grown in Dulbecco’s Modified Eagle’s Medium containing 4.5 g/L glucose, 4 mM L-glutamine (Gibco; 11965-126) supplemented with 10% Nu-serum IV (Corning), 1 mM methyl pyruvate, 400 μM uridine, 1% HEPES and 1% antibiotic-antimycotic (Gibco) at 37°C with 5% CO2. 600 μg/mL Hygromycin was used to select luciferase expressing KP cells. 143B-Cytb-WT were treated with: 500 nM Antimycin A (Sigma) and 500 nM Piericidin A (Sigma). pWPI-EF1-GFP vectors with AOX and NDI1 were a kind gift of Dr. Eric Dufour. The full-length coding sequences of NDI1, NDUFS2, SDHA, DHODH, LbNOX-Mito (Addgene; 74448; Dr. Vamsi Mootha lab), and LbNOX-Cyto (Addgene; 75285; Dr. Vamsi Mootha lab) were subcloned into the pLV-EF1-RFP vector (VectorBuilder). The resultant NDI1, NDUFS2, SDHA, DHODH, LbNOX-Mito, and LbNOX-Cyto vectors, as well as their empty vector control, pLV-EF1-RFP, were transfected into 293T cells (ATTC) along with pMD2.G and psPAX2 packaging vectors using jetPRIME transfection reagent (Polyplus) to produce Control-RFP, NDI1-RFP, NDUFS2-RFP, SDHA-RFP, DHODH-RFP, LbNOX-Mito-RFP and LbNOX-Cyto-RFP lentivirus. Likewise, AOX vector and its empty vector control, pWPI-EF1-GFP, were transfected into 293T to generate Control-GFP and AOX-GFP lentivirus. 3 days post-transduction with the indicated virus, GFP or RFP-positive cells were sorted using a BD FACSAria cell sorter. The cells were periodically sorted to maintain high levels of protein expressions. To generate 143B-Cytb-Δ-NDUFS2_KO, 143B-Cytb-Δ-SDHA_KO, 143B-Cytb-Δ-DHODH_KO and KP-QPC_KO cell lines, gene-specific RNA guides (sgRNAs) listed in supplemental table 1 were cloned into pSpCas9(BB)-2A-GFP (PX458) plasmid (Addgene; 48138; Dr. Fang Zhang lab). These sgRNA–Cas9–GFP vectors were transfected into 143B-Cytb-Δ or KP cells using the jetPRIME (Polyplus). 2 days post-transfection, the GFP-positive cells were single-cell sorted into a 96-well plate using a BD FACSAria cell sorter. The cells were grown for 2–3 weeks, and the resultant clonal cell lines were expanded. Immunoblotting was used to confirm knockout of the targeted gene. Cells have not been authenticated. Cells tested negative for mycoplasma contamination.
Cellular fractionation and immunoblot analysis.
Mitochondria were isolated with the human mitochondria isolation kit (Miltenyi Biotec) using 7–9 × 10⁶ cells, following the manufacturer’s instructions. Purified mitochondria were then lysed using the 1x cell lysis buffer (Cell Signaling) containing the Halt protease inhibitor cocktail (Thermo Scientific). The cytosolic fraction was prepared by differential centrifugation using cells from one 10 cm dish. Cells were resuspended in 0.5 ml of PBS with the Halt protease inhibitor cocktail, and lysed by passing through a 27.5-guage needle 12 times. Intact cells and nuclei were removed by centrifugation for 10 min at 800 x g at 4 °C. The supernatant was transferred to a new Eppendorf tube and centrifuged for 10 min at 8000 x g at 4 °C. The resultant supernatant was the cytosolic fraction. Whole cell lysate extracts were prepared from the indicated cell lines by harvesting and lysing cells in 1x cell lysis buffer containing the Halt protease inhibitor cocktail. The Pierce BCA Protein Assay kit (Thermo Scientific) was used to quantify the protein concentrations. 50–100 μg of lysate was resolved on a SDS-PAGE gel (Bio-Rad) and transferred to a nitrocellulose membrane using the Trans-Blot Turbo Transfer System (Bio-Rad). Membranes were first blocked in 5% milk for 1 h, then incubated in the primary antibody overnight. Primary antibodies used were: anti-NDUFS2 (Abcam; #ab103024; 1:500 dilution), anti-QPC (Abcam; #ab136679; 1:500 dilution), anti-SDHA (MitoScience; #MS204; clone 2E3GC12FB2AE2; 1:500 dilution), anti-DHODH (Santa Cruz; #sc-166348; clone E-8; 1:500 dilution), anti-FLAG (Sigma; #F1804; clone M2; 1:1000 dilution), anti-GAPDH (Santa Cruz; #sc-32233; clone 6C5, and Sigma; #G9545; 1:2000 dilution), anti-ATP5A (Mitosciences; #MS507; clone 15H4C4; 1:1000 dilution), anti-Tubulin (Cell Signaling; #2144; 1:1000 dilution) and anti-β-Actin (Sigma; # A2228-100UL; clone AC-74,). IRDye 800CW goat anti-rabbit (LI-COR; #926-32211) and IRDye 680RD goat anti-mouse (LI-COR; #926-68070) were used as secondary antibodies. Image Studio Lite version 3.1 (LI-COR) was used for the analysis of protein levels.
Mouse models and tumor studies.
Uqcrq (QPC) floxed (Fx), wildtype (WT) and null (−) alleles were genotyped using the following primers: QPC-F- CTTCCGCTCCTCCCGGAAGT; QPC-R- TTCCCAAACTCGCGGCCCATG and QPC-null- CAATTCCAGCCAACAGTCCC. Ubc-CreERT2 mice were obtained from the Jackson Laboratory. UqcrqFx/Fx, Uqcrqwt/−, and Ubc-CreERT2 mice were crossed to generate T-ALL donors containing UBC-CreERT2 alleles with floxed/null Uqcrq (Uqcrqflox/−;UBC-CreERT2), or wild-type/null Uqcrq (Uqcrqwt/−;UBC-CreERT2) as control. 8 to 12 weeks old mice of both sexes were used for experiments. Animals were not randomized to experimental groups, but were age-matched, sex-matched, and littermates when possible. For xenograft tumor studies, 4 × 10⁶ cells were subcutaneously injected into male J:Nu mice (8 to 12 weeks). Tumors were measured twice a week and tumor volume was calculated using the following equation: (4/3) * (π) * (arithmetic mean of 2 caliper measurements)/2)^3. At the completion of the study, mice were euthanized and the tumors were extracted and weighed. Mice were euthanized before the endpoint was reached if tumors reached 2 cm diameter, developed ulcerations or mice enhibited distress. For the orthotopic lung tumor model, 2.5 × 10⁵ KP cells in 50–75uL of PBS + 2.5mM EDTA were intratracheally instilled in C57BL/6J mice as previously described30. In vivo luciferase was imaged on IVIS or LAGO system to monitor tumor growth. The fur on the chest was first removed using Nair hair removal cream. Subsequently, 150ul of RediJect D-Luciferin Ultra Bioluminescent Substrate (PerkinElmer) was i.p. injected, and images were taken after 10 minutes. Images were processed using the Living Image or Aura softwares to measure the background-corrected bioluminescence signal from the tumors. Mice were euthanized by 20 weeks after tumor administration, or upon losing 15–20% initial weight or displaying overt distress. All animals were housed in the Northwestern University animal vivarium and we have complied with all relevant ethical regulations in accordance with Northwestern University Institutional Animal Care and Use Committee (IACUC).
Bone marrow isolation and leukemic transformation.
Platinum E-retroviral packaging cells and MIGR1- Notch1ΔE-GFP vector were a kind gift from Dr. Panagiotis Ntziachristos. Platinum-E cells were transfected with MIGR1-Notch1ΔE-GFP plasmid using jetPRIME (Polyplus) in order to generate the Notch1ΔE-GFP retrovirus. Bone marrow cells were harvested from Uqcrqflox/−;UBC-CreERT2 and Uqcrqwt/−;UBC-CreERT2 donor mice by grinding the pelvis, femur, and tibia bones with a mortar and a pestle. From the bone marrow cells, hematopoietic stem cells (HSCs) were isolated by a CD117+ positive selection magnetic bead isolation kit (StemCell). Subsequently, HSCs were transduced with the Notch1ΔE-GFP retrovirus by centrifugation in 25 °C at 1500 x g for 90 min, followed by incubation in 37 °C overnight. The virus was removed the next day morning, after which cells were allowed to rest for 2 days. The transduction and culturing of HSCs were performed in Opti-MEM (Thermo Fisher) supplemented with 10 ng/mL IL-3 (PeproTech), 10 ng/mL IL-7 (PeproTech), 50 ng/mL SCF (PeproTech), 50 ng/mL Flt3L (PeproTech), and 20 ng/mL IL-6 (PeproTech). Approximately 24h prior to adoptive transfer, wild-type C57Bl/6J recipients were lethally irradiated at approximately 1000 rad. On the day of the transfer, lineage (CD4, CD8a, B220, CD11b, Gr-1, NK1.1, Ter-119)-negative and GFP-positive cells were sorted on BD FACS Aria systems. Antibodies used were: anti-Mouse Ter-119 (eBioscience; #48-5921-80; clone TER-119), anti-Mouse NK1.1 (eBioscience; #48-5941-80; clone PK136,), anti-Human/Mouse CD45R (B220) (eBioscience; #48-0452-80; clone RA3-6B2), anti-Mouse CD8a (eBioscience; #48-0081-82; clone 53–6.7), anti-Mouse CD11b (eBioscience; #48-0112-80; clone M1/70,), anti-Mouse Ly-6G (Gr-1) (eBioscience; #48-5931-80; clone RB6-8C5,), anti-Mouse CD4 (Tonbo Biosciences; #75-0041-U100; clone GK1.5). 50,000–100,000 GFP-positive HSCs, along with 500,000 support bone marrow cells isolated from wild-type C57Bl/6J mice, were injected via i.v. into the recipient mice. At 3 and 4 weeks post-transfer, peripheral blood from the recipients was analyzed to assess the presence of circulating GFP-positive T-ALL cells. Once the % GFP-positive cells in the peripheral blood reached approximately 5–10%, the recipients were oral gavaged with 320mg/kg tamoxifen suspended in corn oil for 4 times, once every 2 days. For up to 25 weeks post-tamoxifen administration, the recipients were closely monitored for any signs of malignancy, including weight-loss, hunched posture and lethargy. The recipients were euthanized upon displaying 15–20% weight loss, or at up to 30 weeks post-transfer. Cell from spleen and bone marrow (from one set of pelvis, femur, and tibia) were harvested from each recipient, and stained with Ghost Dye Red 780 (Tonbo Bioscience). The cells were resuspended in FACS buffer (DPBS with 10% NuSerum IV) with PKH reference microbeads (Sigma). The number and % of GFP-positive T-ALL cells were analyzed on BD FACSymphony and FlowJo software version 10.4.2.
Proliferation and cell viability analysis.
3.5 × 10⁴ cells were plated on 6-well plates. Cells were expanded in the presence or absence of methyl-pyruvate and/or uridine for 72h. To assess proliferation, cells were counted using AccuCount Fluorescent Particles (Spherotech) by flow cytometry. Cell viability was determined by measuring % DAPI-positive population by flow cytometry. All flow cytometry assays were performed on BD FACSymphony or BD Fortessa analyzers, and data were analyzed with the FlowJo software 10.4.2.
Mitochondrial activity studies.
Oxygen consumption rate (OCR) was measured in a XF96 extracellular flux analyzer (Seahorse Bioscience). Basal mitochondrial respiration was assessed by subtracting the non-mitochondrial OCR, measured with 1 μM Antimycin A and 1 μM Piericidin A, from baseline OCR. Coupled respiration was determined by subtracting the OCR in the presence of 1uM oligomycin A (Sigma) from the basal mitochondrial respiration. To determine mitochondrial complex I activity, growth medium was replaced with mitochondrial assay buffer (70 mM sucrose, 220 mM mannitol, 10 mM KH2PO4, 5 mM MgCl2, 2 mM HEPES, 1 mM EGTA, 0.2% (wt/vol) fatty acid free BSA, pH 7.2) supplemented with 1 nM Seahorse XF Plasma Membrane Permeabilizer and 10 mM ADP, as well as 2.5 mM malate and 10 mM pyruvate (complex I substrates). To assess mitochondrial complex II activity, growth medium was replaced with the mitochondrial assay buffer containing membrane permeabilizer and ADP, along with 10 mM succinate (complex II substrate) and 1uM Piericidin A, which inhibits the complex I contribution to OCR. The increase in OCR was measured immediately after addition of substrates. Where indicated, Piericidin A and Antimycin A were injected to inhibit complex I and III, respectively. Salicylhydroxamic acid (SHAM; Sigma), was injected to inhibit AOX.
Metabolomics.
Subconfluent culture dishes were incubated for 2, 8, or 24 h in DMEM (Gibco; A1443001) supplemented with 15 mM glucose, 2 mM glutamine, and 10% dialyzed FBS (PEAK Serum), in the presence or absence of 1 mM methyl pyruvate and/or 400 μM uridine. Following the incubation, cells were washed with ice-cold 0.9% NaCl, and overlaid with ultra-cold HPLC grade-methanol/water (80/20, v/v). The plates were incubated at −80 °C for 20 min, after which cells were scraped and collected. The cell suspensions were then centrifuged at 16,000 x g for 15 min at 4 °C. The supernatant was transferred to a new tube and evaporated to dryness using a SpeedVac concentrator (Thermo Savant). Metabolites were reconstituted in 50% acetonitrile in analytical-grade water, vortex-mixed, and centrifuged to remove debris. Samples were analyzed by High-Performance Liquid Chromatography and High-Resolution Mass Spectrometry and Tandem Mass Spectrometry (HPLC-MS/MS). Specifically, system consisted of a Thermo Q-Exactive in line with an electrospray source and an Ultimate3000 (Thermo) series HPLC consisting of a binary pump, degasser, and auto-sampler outfitted with a Xbridge Amide column (Waters; dimensions of 4.6 mm × 100 mm and a 3.5 μm particle size). Mobile phase A contained 95% (v/v) water, 5% (v/v) acetonitrile, 10 mM ammonium hydroxide, 10 mM ammonium acetate, pH = 9.0; and mobile phase B was 100% Acetonitrile. The gradient was as follows: 0 min, 15% A; 2.5 min, 30% A; 7 min, 43% A; 16 min, 62% A; 16.1–18 min, 75% A; 18–25 min, 15% A with a flow rate of 400 μL/min. The capillary of the ESI source was set to 275 °C, with sheath gas at 45 arbitrary units, auxiliary gas at 5 arbitrary units and the spray voltage at 4.0 kV. In positive/negative polarity switching mode, an m/z scan range from 70 to 850 was chosen and MS1 data was collected at a resolution of 70,000. The automatic gain control (AGC) target was set at 1 × 10⁶ and the maximum injection time was 200 ms. The top 5 precursor ions were subsequently fragmented, in a data-dependent manner, using the higher energy collisional dissociation (HCD) cell set to 30% normalized collision energy in MS2 at a resolution power of 17,500. Sample volumes of 10 μl were injected. Data acquisition and analysis were carried out by Xcalibur 4.1 software and Tracefinder 4.1 software, respectively (both from Thermo Fisher Scientific). The peak area for each detected metabolite was normalized by the total ion current, which was determined by integration of all of the recorded peaks within the acquisition window. For carbon labeling, isotopic labeling was performed in DMEM (Gibco; A1443001) supplemented with 10% dialyzed FBS, and 2 mM L-[U-13C]glutamine or 10 mM D-[U-13C]glucose, in the presence or absence of 1 mM methyl pyruvate. After 6 h of labeling, metabolites were extracted with ultra-cold HPLC grade-methanol/water (80/20, v/v) and analyzed as previously described31. Metabolite analysis were carried out in MetaboAnalyst 4.0. Peak intensities normalized to total ion current in tables were loaded. Missing and 0 values were replaced with half the minimum positive values in the original data assuming to be the detection limit. For 2-group heatmap, t-tests with an FDR cutoff of 0.1 were used to identify significantly changed metabolites. For more than two group heatmaps, one-way ANOVA with Fisher’s LSD post-hoc analyses and an FDR cutoff of 0.1 w used to generate a list of significantly changed metabolites among groups. This list was then plotted as a heatmap with euclidean distance measures and ward.D clustering algorithm of metabolites/rows. Within row, z-scores for each metabolite were plotted.
Measurement of dihydroorotate and orotate ratio.
For the measurement of dihydroorotate (DHO) and orotate, 5 × 10⁶ cells were seeded in a 100 mm cell culture dish, and incubated with DMEM (Gibco; A1443001) supplemented with 15 mM glucose, 2 mM glutamine, 10% dialyzed FBS, 1% HEPES and 1% antibiotic-antimycotic. After 24 h, metabolites were extracted. Cells were washed twice with DPBS, and lysed with 600 μL of HPLC grade-methanol/chloroform (67/33, v/v). The cell lysates were collected, vortexed for 30 s, and incubated in liquid nitrogen for 60 s. Samples were then thawed at room temperature, after which 400 μL of a HPLC grade-chloroform/water (50/50, v/v) was added. The lysates with metabolites were centrifuged at 15,000 x g for 30 min at 4 °C. The supernatant was transferred to a new tube and evaporated to dryness using a SpeedVac concentrator (Thermo Savant). Samples were analyzed by High-Performance Liquid Chromatography and High-Resolution Mass Spectrometry and Tandem Mass Spectrometry (HPLC-MS/MS) as described above using targeted selected ion monitoring (tSIM) mode.
Statistical analysis.
P values were calculated as described in each individual figure legend using Graphpad Prism 7 (Graphpad Software) and MetaboAnalyst 4.032. Data are presented as mean ± s.e.m unless stated otherwise. Numbers of biological replicates are indicated in the figure legends. The investigators were not blinded during experiments and outcome assessments. No statistical method was used to predetermine sample size, and experiments were not randomized.
Extended Data
Extended Figure 1: Metabolite changes in complex III deficient cells in the presence or absence of pyruvate and uridine.
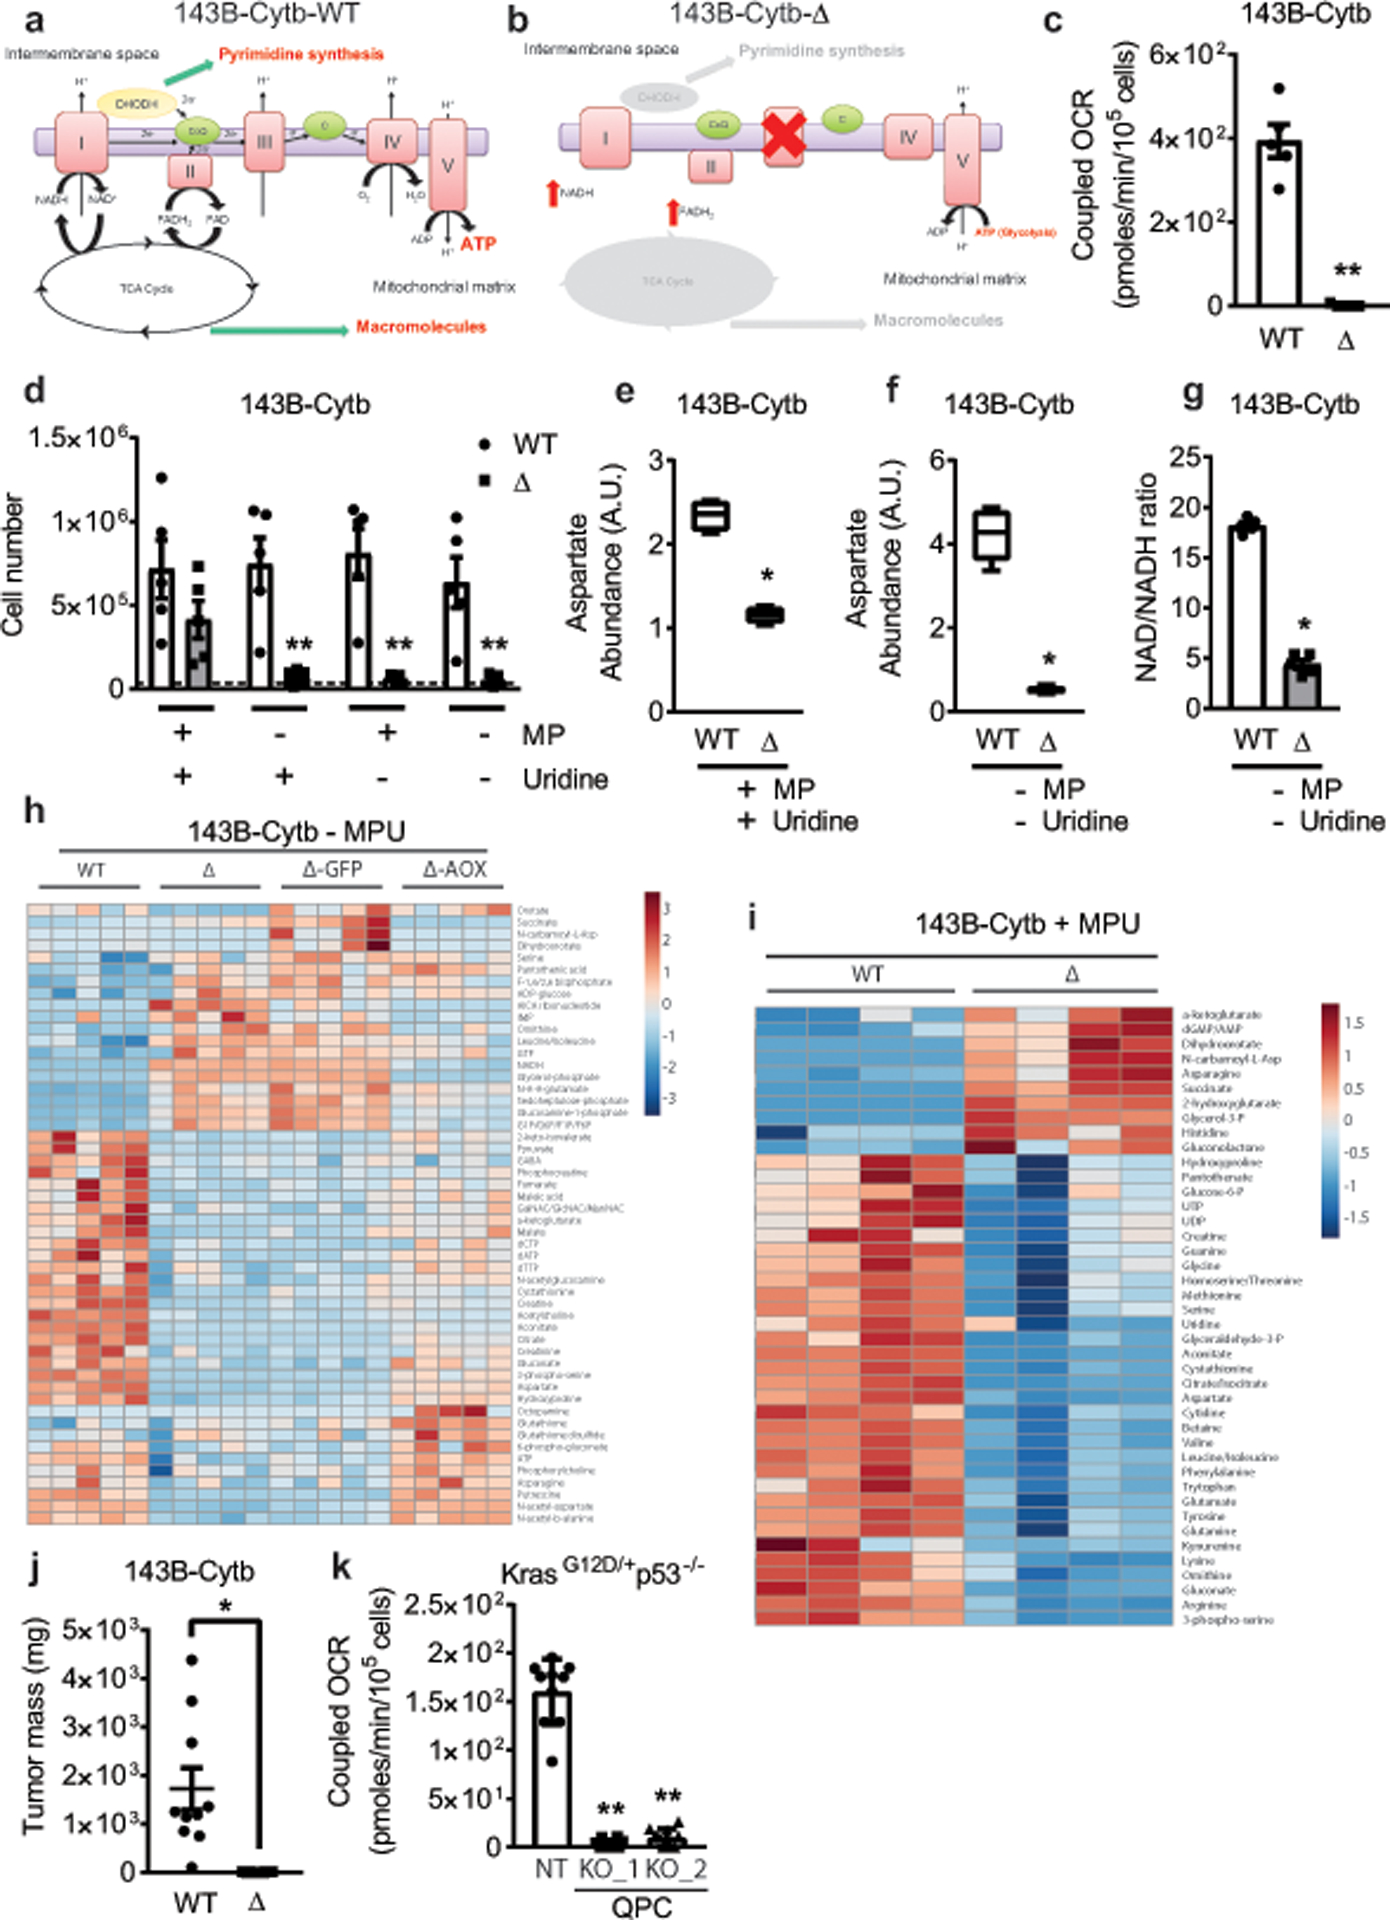
a,b, Schematic representation of the ETC in 143B-Cytb-WT (a) and 143B-Cytb-Δ cells (b). c, Coupled OCR of 143B-Cytb-WT and 143B-Cytb-Δ cells (n=5 biologically independent experiments). d, 143B-Cytb-WT and 143B-Cytb-Δ cells were grown in the presence or absence of methyl pyruvate and/or uridine and cell number was assessed after 72h (n=5 biologically independent experiments). e, Intracellular aspartate levels in the presence of methyl pyruvate and uridine in 143B-Cytb-WT and 143B-Cytb-Δ cells (n=4 biologically independent experiments). f, Intracellular aspartate levels in the absence of methyl pyruvate and uridine in 143B-Cytb-WT and 143B-Cytb-Δ cells (n=5 biologically independent experiments). g, Intracellular NAD+/NADH ratio in the absence of methyl pyruvate and uridine of 143B-Cytb-WT and 143B-Cytb-Δ cells (n=5 biologically independent experiments). h, The heat map displays the relative abundance of significantly changed metabolites in 143B-Cytb-WT, 143B-Cytb-Δ cells and in 143B-Cytb-Δ cells expressing either GFP or AOX in the absence of methyl pyruvate and uridine. A red-blue color scale depicts the abundance of the metabolites (Red: high, Blue: low), (n=5 biologically independent experiments). i, The heat map displays the relative abundance of significantly changed metabolites in 143B-Cytb-WT and 143B-Cytb-Δ cells in the presence of methyl pyruvate and uridine (n=4 biologically independent experiments). j, Tumor mass of xenografts from 143B-Cytb-WT and 143B-Cytb-Δ cells (n=10 mice per group from two independent cohorts). k, Coupled OCR of KP-NT and KP-QPC_KOs cells (n=10 technical replicates from two independent experiments). Data represent mean ± s.e.m. (c-g, j) or mean ± s.d. (k). Statistical significance was determined using two-tailed t-tests (c, g, j), 2-way ANOVA (d) with a Bonferroni test for multiple comparisons or 1-way ANOVA (k) with a Bonferroni test for multiple comparisons (*p < 0.05; **p < 0.01, exact P values in Source Data). Metabolites levels were analyzed with multiple one-way ANOVA using an FDR of 0.1 and Fisher’s least significant difference test post-hoc analyses Q=10%. For 2-group heatmap, t-tests with an FDR cutoff of 0.1 were used to identify significantly changed metabolites. Each row was analyzed individually. (*Q<.1, exact Q values in Source Data).
Extended Figure 2: Mitochondrial complex III is required for T-ALL growth in vivo.
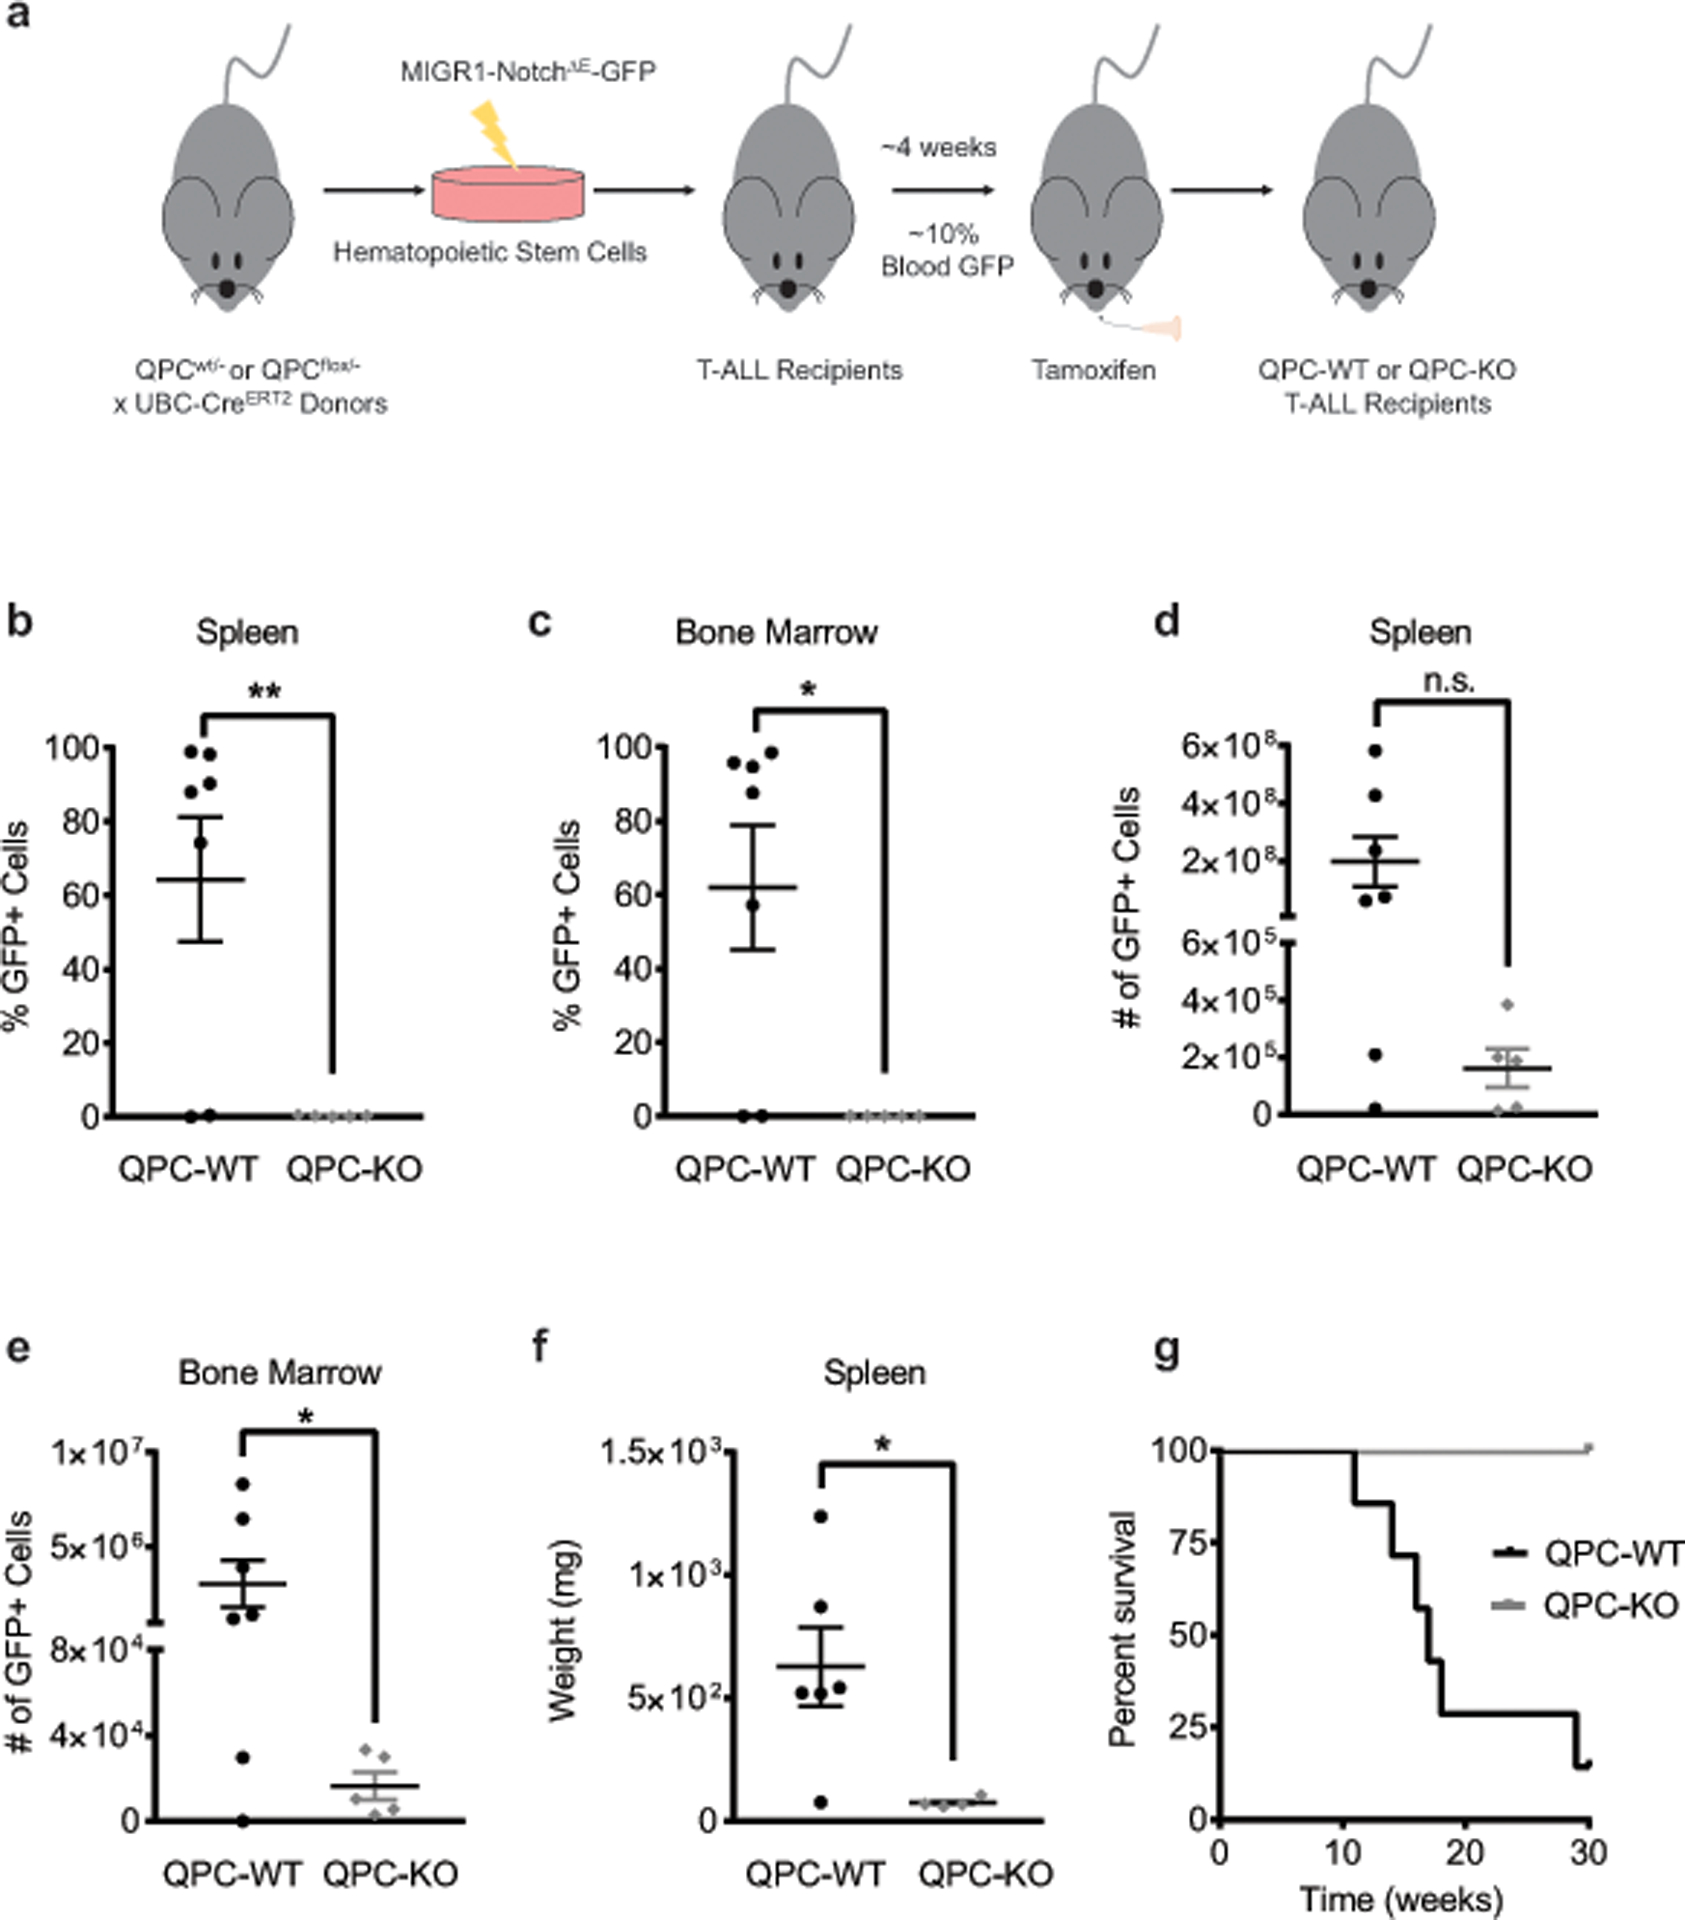
a, Schematic representation of the T-ALL experiments. b, c, Percentage of GFP+ T-ALL cells from the spleen (b) or bone marrow (c) of QPC-WT and QPC-KO recipients (WT: n = 7; KO: n = 5 mice). d, e, The absolute number of GFP+ T-ALL cells from the spleen (d) or bone marrow (e) of QPC-WT and QPC-KO recipients (WT: n = 7; KO: n = 5 mice). f, Weight of spleens from QPC-WT and QPC-KO recipients (WT: n = 6; KO: n = 4 mice). g, Survival of mice injected with QPC-WT or QPC-KO T-ALL cells (WT: n = 7; KO: n = 4 mice). Data represent mean ± s.e.m from three independent experiments. Statistical significance was determined using two-tailed t-tests with a Welch’s correction (*p < 0.05; **p < 0.01 exact P values in Source Data). Survival curves were compared using the log-rank test (p<0.0001).
Extended Figure 3: Complex III deficient cells are auxotrophic for uridine.
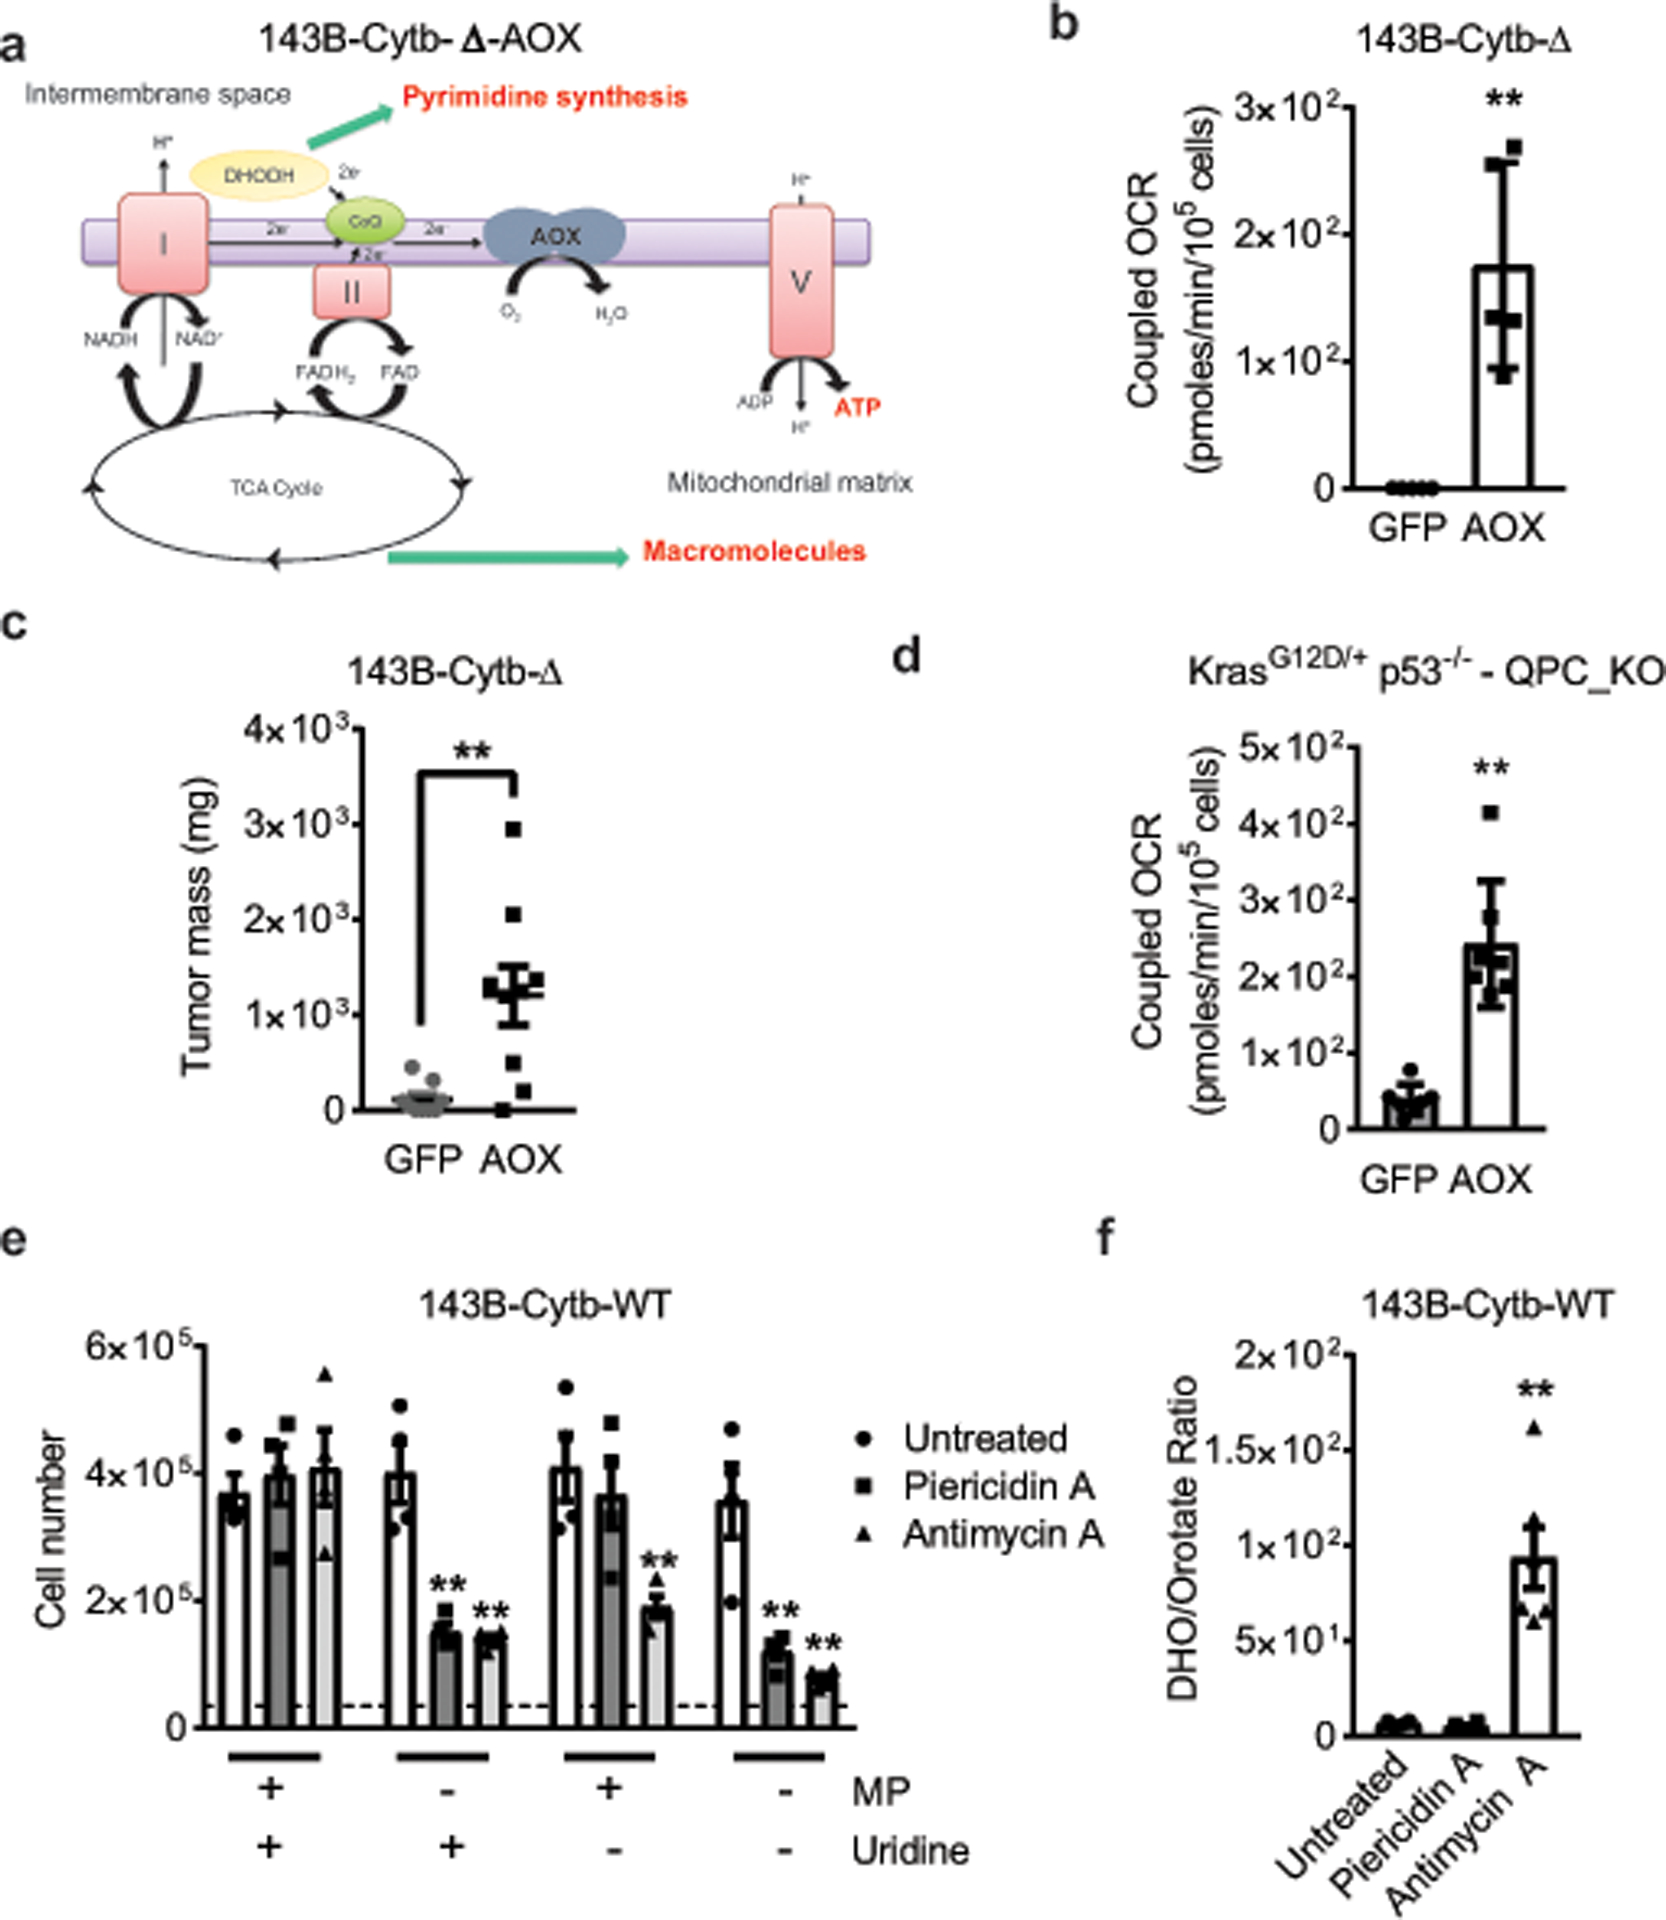
a, Schematic representation of the ETC in AOX expressing 143B-Cytb-Δ cells. b, Coupled OCR of 143B-Cytb-Δ-GFP and 143B-Cytb-Δ-AOX cells (n=5 biologically independent experiments). c, Tumor mass of xenografts from 143B-Cytb-Δ-GFP and 143B-Cytb-Δ-AOX cells (n=9 mice per group from two independent cohorts). d, Coupled OCR of KP-QPC_KO-GFP and KP-QPC_KO-AOX cells (n=7 replicates from one representative of 5 biologically independent experiments). e, 143B-Cytb-WT treated or untreated with Piericidin A (0.5 μM) or Antimycin A (0.5 μM) were grown in the presence or absence of methyl pyruvate and/or uridine and cell number was assessed after 72h (n=4 biologically independent experiments). f, The dihydroorotate to orotate ratio was assessed in 143B-Cytb-WT treated or untreated with Piericidin A (0.5 μM) or Antimycin A (0.5 μM) (n=6 biologically independent experiments). Data represent mean ± s.e.m. (b, c, e, f) or mean ± s.d. (d). Statistical significance was determined using two-tailed t-tests (b, c, d), 2-way ANOVA (e) with a Bonferroni test for multiple comparisons or 1-way ANOVA (f) with a Bonferroni test for multiple comparisons (*p < 0.05; **p < 0.01, exact P values in Source Data).
Extended Figure 4: De novo pyrimidine synthesis is necessesary for tumor growth.
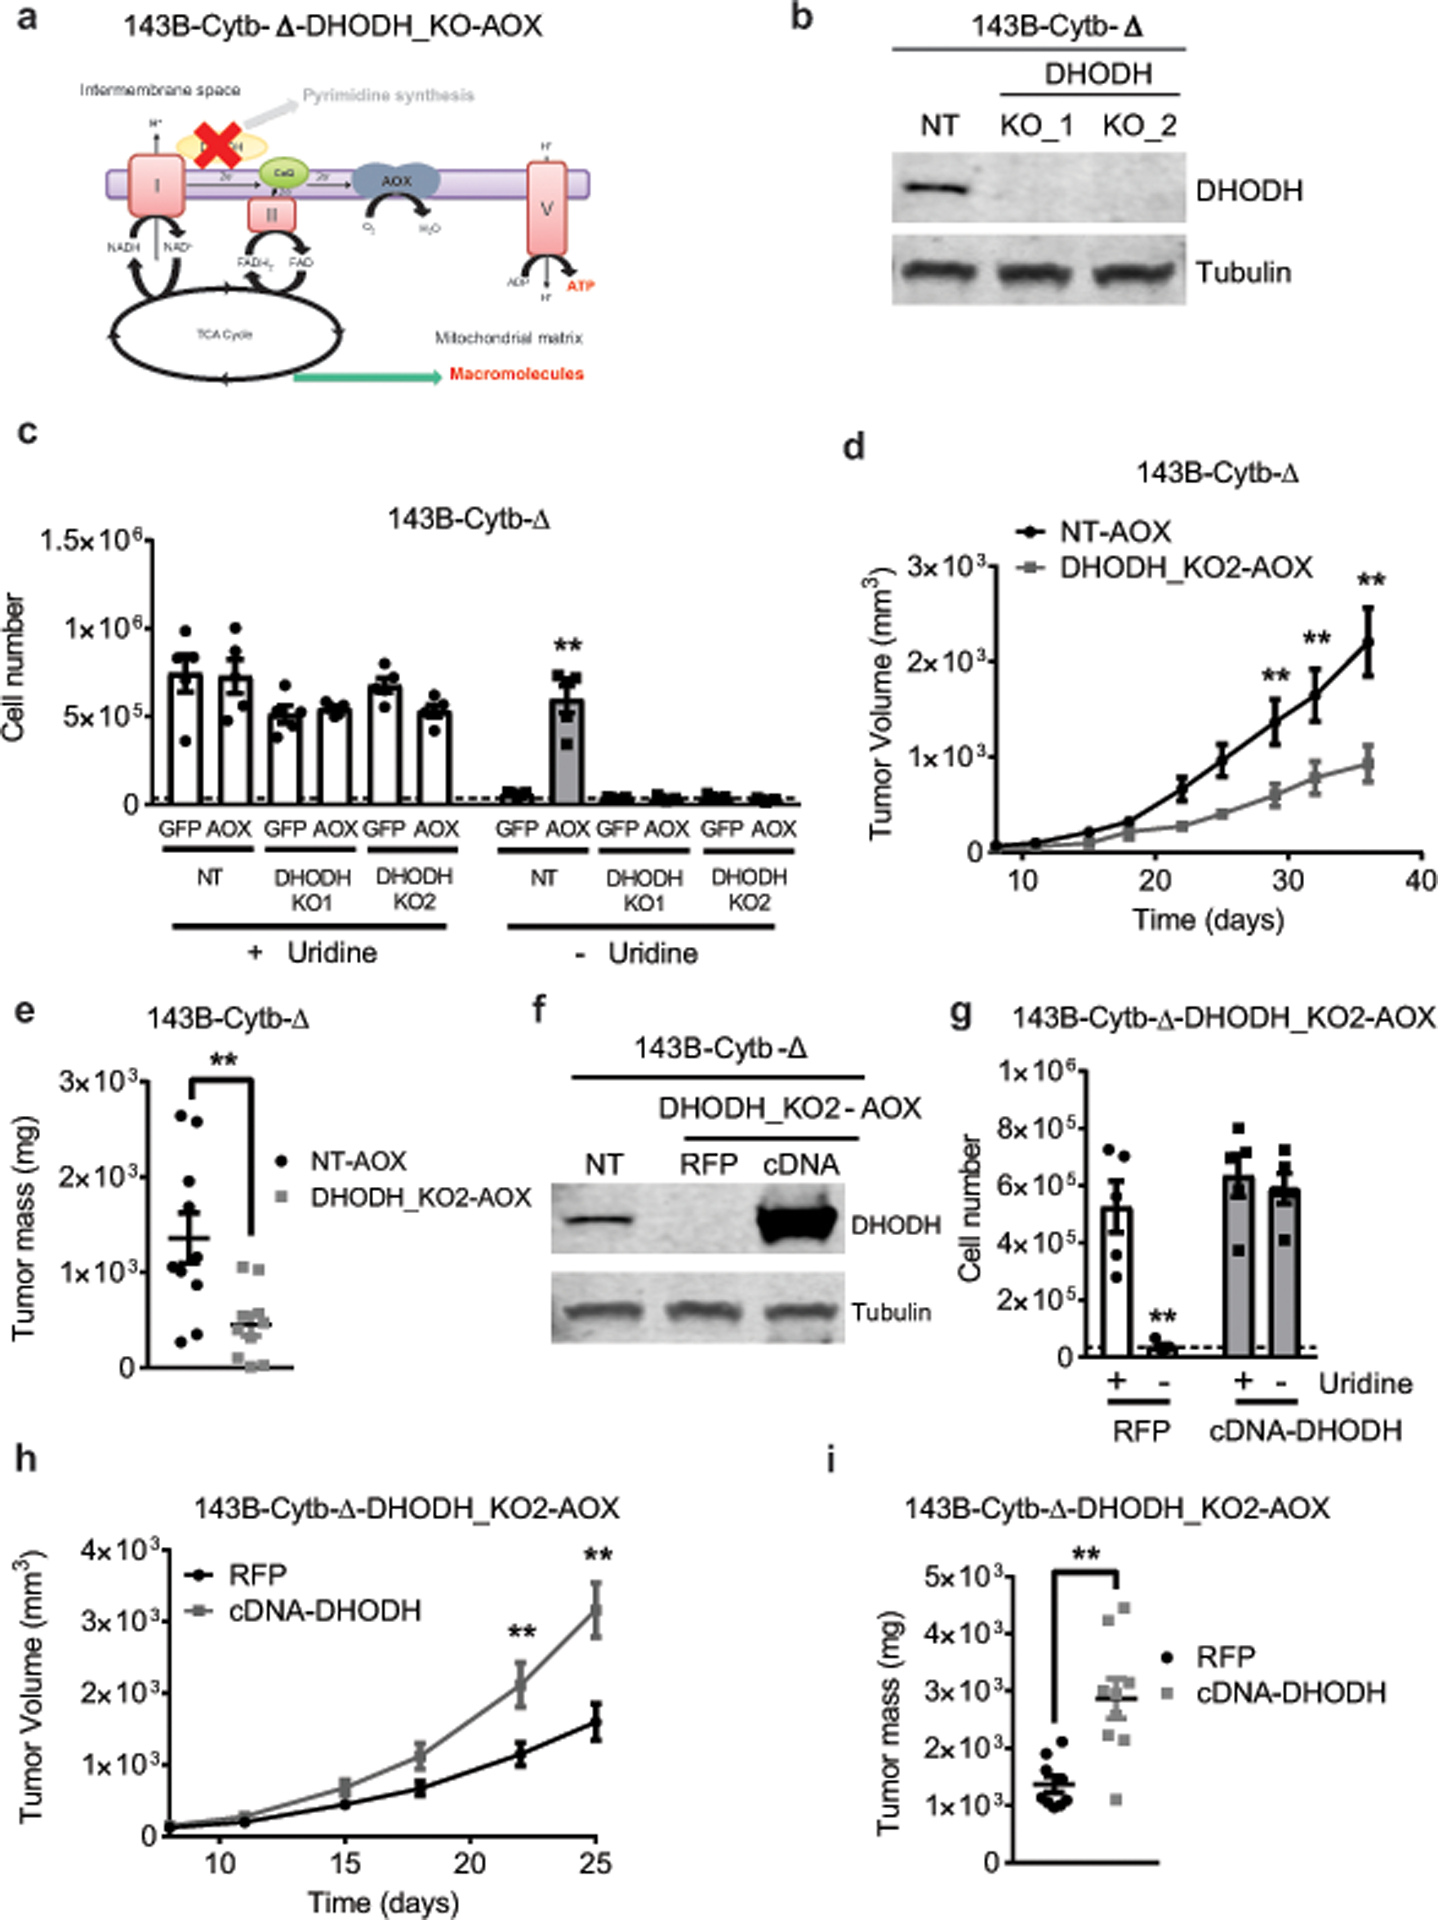
a, Schematic representation of the ETC in 143B-Cytb-Δ-AOX-DHODH_KO cells. b, Western blot analysis of DHODH in 143B-Cytb-Δ non targeting (NT) and 143B-Cytb-Δ-DHODH_KOs cells. Tubulin was used as a loading control. Data representative of two independent experiments. c, 143B-Cytb-Δ-NT or 143B-Cytb-Δ-DHODH-KOs expressing GFP or AOX were grown in the presence or absence of uridine and cell number was assessed after 72h (n=5 biologically independent experiments). d,e, Average tumor volume (d) and tumor mass (e) of xenografts from 143B-Cytb-Δ-NT-AOX and 143B-Cytb-Δ-DHODH_KO2-AOX cells (n=10 mice per group from two independent cohorts). f, Western blot analysis of DHODH protein levels in 143B-Cytb-Δ-NT, 143B-Cytb-Δ-DHODH_KO2-AOX-RFP and 143B-Cytb-Δ-DHODH_KO2-AOX-cDNA DHODH cells. Data representative of three independent experiments. g, 143B-Cytb-Δ-DHODH_KO2-AOX-RFP and 143B-Cytb-Δ-DHODH_KO2-AOX-cDNA DHODH cells were grown in the presence or absence of uridine and cell number was assessed after 72h (n=5 biologically independent experiments). h,i, Average tumor volume (h) and tumor mass (i) of xenografts from 143B-Cytb-Δ-DHODH_KO2-AOX-RFP and 143B-Cytb-Δ-DHODH_KO2-AOX-cDNA DHODH cells (n=9 mice per group from two independent cohorts). Data represent mean ± s.e.m. (c-e, g-i) Statistical significance was determined using two-tailed t-tests (e, i) or 2-way ANOVA (c,d,g,h) with a Bonferroni test for multiple comparisons (*p < 0.05; **p < 0.01, exact P values in Source Data). For gel source data, see Supplemental Figure 4.
Extended Figure 5: Restoration of complex I by ectopic expression of NDUFS2 cDNA rescues tumor growth.
a, Schematic representation of the ETC in complex I deficient 143B-Cytb-Δ-NDUFS2_KO-AOX cells. b, Tumor mass of xenografts from 143B-Cytb-Δ-NT-AOX and 143B-Cytb-Δ-NDUFS2_KO1-AOX cells (n=10 mice per group from two independent cohorts). c, Western blot analysis of NDUFS2 protein levels in 143B-Cytb-Δ-NT, and in AOX expressing 143B-Cytb-Δ-NDUFS2_KO1 clone transduced with either RFP or human NDUFS2 cDNA. GAPDH was used as a loading control. Data representative of two independent experiments. d, Basal oxygen consumption rate of AOX expressing 143B-Cytb-Δ-NDUFS2_KO1 cells transduced with either RFP or human NDUFS2 cDNA. e,143B-Cytb-Δ-NDUFS2_KO1-AOX-RFP and 143B-Cytb-Δ-NDUFS2_KO1-AOX-cDNA NDUFS2 cells were grown in the presence or absence of methyl pyruvate and cell number was assessed after 72h (n=5 biologically independent experiments). f,g, Average tumor volume (f) and tumor mass (g) of xenografts from AOX expressing 143B-Cytb-Δ-NDUFS2_KO1 cells transduced with either RFP or human NDUFS2 cDNA (n=9 mice per group from two independent cohorts). Data represent mean ± s.e.m. (b,d-g). Statistical significance was determined using two-tailed t-tests (b,d,g) or 2-way ANOVA (e,f) with a Bonferroni test for multiple comparisons (*p < 0.05; **p < 0.01, exact P values in Source Data). For gel source data, see Supplemental Figure 2.
Extended Figure 6: NDI1 expression in complex I deficient cells rescues electron transfer but not ATP production.
a, Schematic representation of the ETC in complex I deficient 143B-Cytb-Δ-NDUFS2_KO-AOX cells expressing NDI1. b, 143B-Cytb-Δ-NDUFS2_KO1-AOX-RFP and 143B-Cytb-Δ-NDUFS2_KO1-AOX-NDI1 cells were grown in the presence or absence of methyl pyruvate and cell number was assessed after 72h (n=6 biologically independent experiments). c, The heat map displays the relative abundance of significantly changed metabolites in 143B-Cytb-Δ-NDUFS2-KO1 cells expressing RFP, NDI1 or LbNOX in either mitochondria or cytosol (n=4 biologically independent experiments). A red-blue color scale depicts the abundance of the metabolites (Red: high, Blue: low). Metabolites levels were analyzed with multiple one-way ANOVA using an FDR of 0.1 and Fisher’s least significant difference test post-hoc analyses Q=10%. Each row was analyzed individually. (*Q<.1, exact Q values in Source Data). d, 143B-Cytb-Δ-NT-AOX, 143B-Cytb-Δ-NDUFS2_KO1-AOX-RFP and 143B-Cytb-Δ-NDUFS2_KO1-AOX-NDI1 cells were grown in media containing 10 mM glucose or 10 mM galactose for 48 hr and assessed for cell death (n=4 biologically independent experiments). e, Tumor mass of xenografts from 143B-Cytb-Δ-NDUFS2_KO1 cells expressing AOX and either RFP or NDI1 (n=10 mice per group from two independent cohorts). Data represent mean ± s.e.m. (b, d, e). Statistical significance was determined using two-tailed t-tests (e) or 2-way ANOVA (b,d) with a Bonferroni test for multiple comparisons (*p < 0.05; **p < 0.01, exact P values in Source Data).
Extended Figure 7: LbNOX expression in mitochondria or cytosol promotes major changes in the metabolome of complex III deficient cells.
a, Schematic representation of the ETC in 143B-Cytb-Δ cells expressing LbNOX in mitochondria. b, Intracellular NAD+/NADH ratio in 143B-Cytb-Δ-RFP, 143B-Cytb-Δ-LbNOX-Mito and 143B-Cytb-Δ-LbNOX-Cyto cells in the absence of methyl pyruvate (n=5 biologically independent experiments). c,d,e, Intracellular aspartate (c), succinate (d) and α-ketoglutarate levels (e) in 143B-Cytb-Δ-RFP, 143B-Cytb-Δ-LbNOX-Mito and 143B-Cytb-Δ-LbNOX-Cyto cells in the absence of methyl pyruvate (n=5 biologically independent experiments). f, The heat map displays the relative abundance of significantly changed metabolites in 143B-Cytb-Δ-RFP, 143B-Cytb-Δ-LbNOX-Mito and 143B-Cytb-Δ-LbNOX-Cyto cells in the absence of methyl pyruvate (n=5 biologically independent experiments). A red-blue color scale depicts the abundance of the metabolites (Red: high, Blue: low). g, Tumor mass of xenografts from 143B-Cytb-Δ-RFP, 143B-Cytb-Δ-LbNOX-Mito, and 143B-Cytb-Δ-LbNOX-Cyto cells (n=9 mice per group from two independent cohorts). Data represent mean ± s.e.m. (b-e, g); statistical significance was determined using 1-way ANOVA (b,g) with a Bonferroni test for multiple comparisons (*p < 0.05; **p < 0.01, exact P values in Source Data). Metabolites levels (c,d,e,f) were analyzed with multiple one-way ANOVA using an FDR of 0.1 and Fisher’s least significant difference test post-hoc analyses Q=10%. Each row was analyzed individually. (*Q<.1, exact Q values in Source Data).
Extended Figure 8: LbNOX expression in mitochondria or cytosol promotes major changes in the metabolome of complex I deficient cells.
a, Schematic representation of the ETC in 143B-Cytb-Δ-NDUFS2_KO-AOX cells expressing LbNOX in mitochondria. b, 143B-Cytb-Δ-NDUFS2_KO1-AOX-LbNOX-Mito and 143B-Cytb-Δ-NDUFS2_KO1-AOX-LbNOX-Cyto were grown in the presence or absence of methyl pyruvate and cell number was assessed after 72h (n=5 biologically independent experiments). c, Intracellular NAD+/NADH ratio of 143B-Cytb-Δ-NDUFS2_KO1-AOX-RFP, 143B-Cytb-Δ-NDUFS2_KO1-AOX-LbNOX-Mito, and 143B-Cytb-Δ-NDUFS2_KO1-AOX-LbNOX-Cyto cells in the absence of methyl pyruvate and uridine (n=4 biologically independent experiments). d, Intracellular aspartate levels of 143B-Cytb-Δ-NDUFS2_KO1-AOX-RFP, 143B-Cytb-Δ-NDUFS2_KO1-AOX-LbNOX-Mito and 143B-Cytb-Δ-NDUFS2_KO1-AOX-LbNOX-Cyto cells in the absence of methyl pyruvate and uridine (n=4 biologically independent experiments). e, 143B-Cytb-Δ-NDUFS2_KO1-AOX-LbNOX-Mito and 143B-Cytb-Δ-NDUFS2_KO1-AOX-LbNOX-Cyto cells were grown in media containing 10 mM glucose or 10 mM galactose for 48 hr and assessed for cell death (n=4 biologically independent experiments). f, Tumor mass of xenografts from 143B-Cytb-Δ-NDUFS2_KO1-AOX cells expressing LbNOX in either mitochondria or cytosol (n=10 mice per group from two independent cohorts). g, Western blot analysis (data representative of two independent experiments) of LbNOX expression in xenograft tumors from 143B-Cytb-Δ-NDUFS2_KO1-AOX-RFP, 143B-Cytb-Δ-NDUFS2_KO1-AOX-LbNOX-Mito and 143B-Cytb-Δ-NDUFS2_KO1-AOX-LbNOX-Cyto cells. Tubulin was used as a loading control. Data represent mean ± s.e.m. (b-f). Statistical significance was determined using two-tailed t-tests (f), 1-way ANOVA (c) with a Bonferroni test for multiple comparisons or a 2-way ANOVA (b, e) with a Bonferroni test for multiple comparisons (*p < 0.05; **p < 0.01, exact P values in Source Data). Metabolites levels (d) were analyzed with multiple one-way ANOVA using an FDR of 0.1 and Fisher’s least significant difference test post-hoc analyses Q=10%. Each row was analyzed individually. (*Q<.1, exact Q values in Source Data). For gel source data, see Supplemental Figure 5.
Extended Figure 9: Complex I deficient cells expressing LbNOX in the cytosol perform glutamine reductive carboxylation.
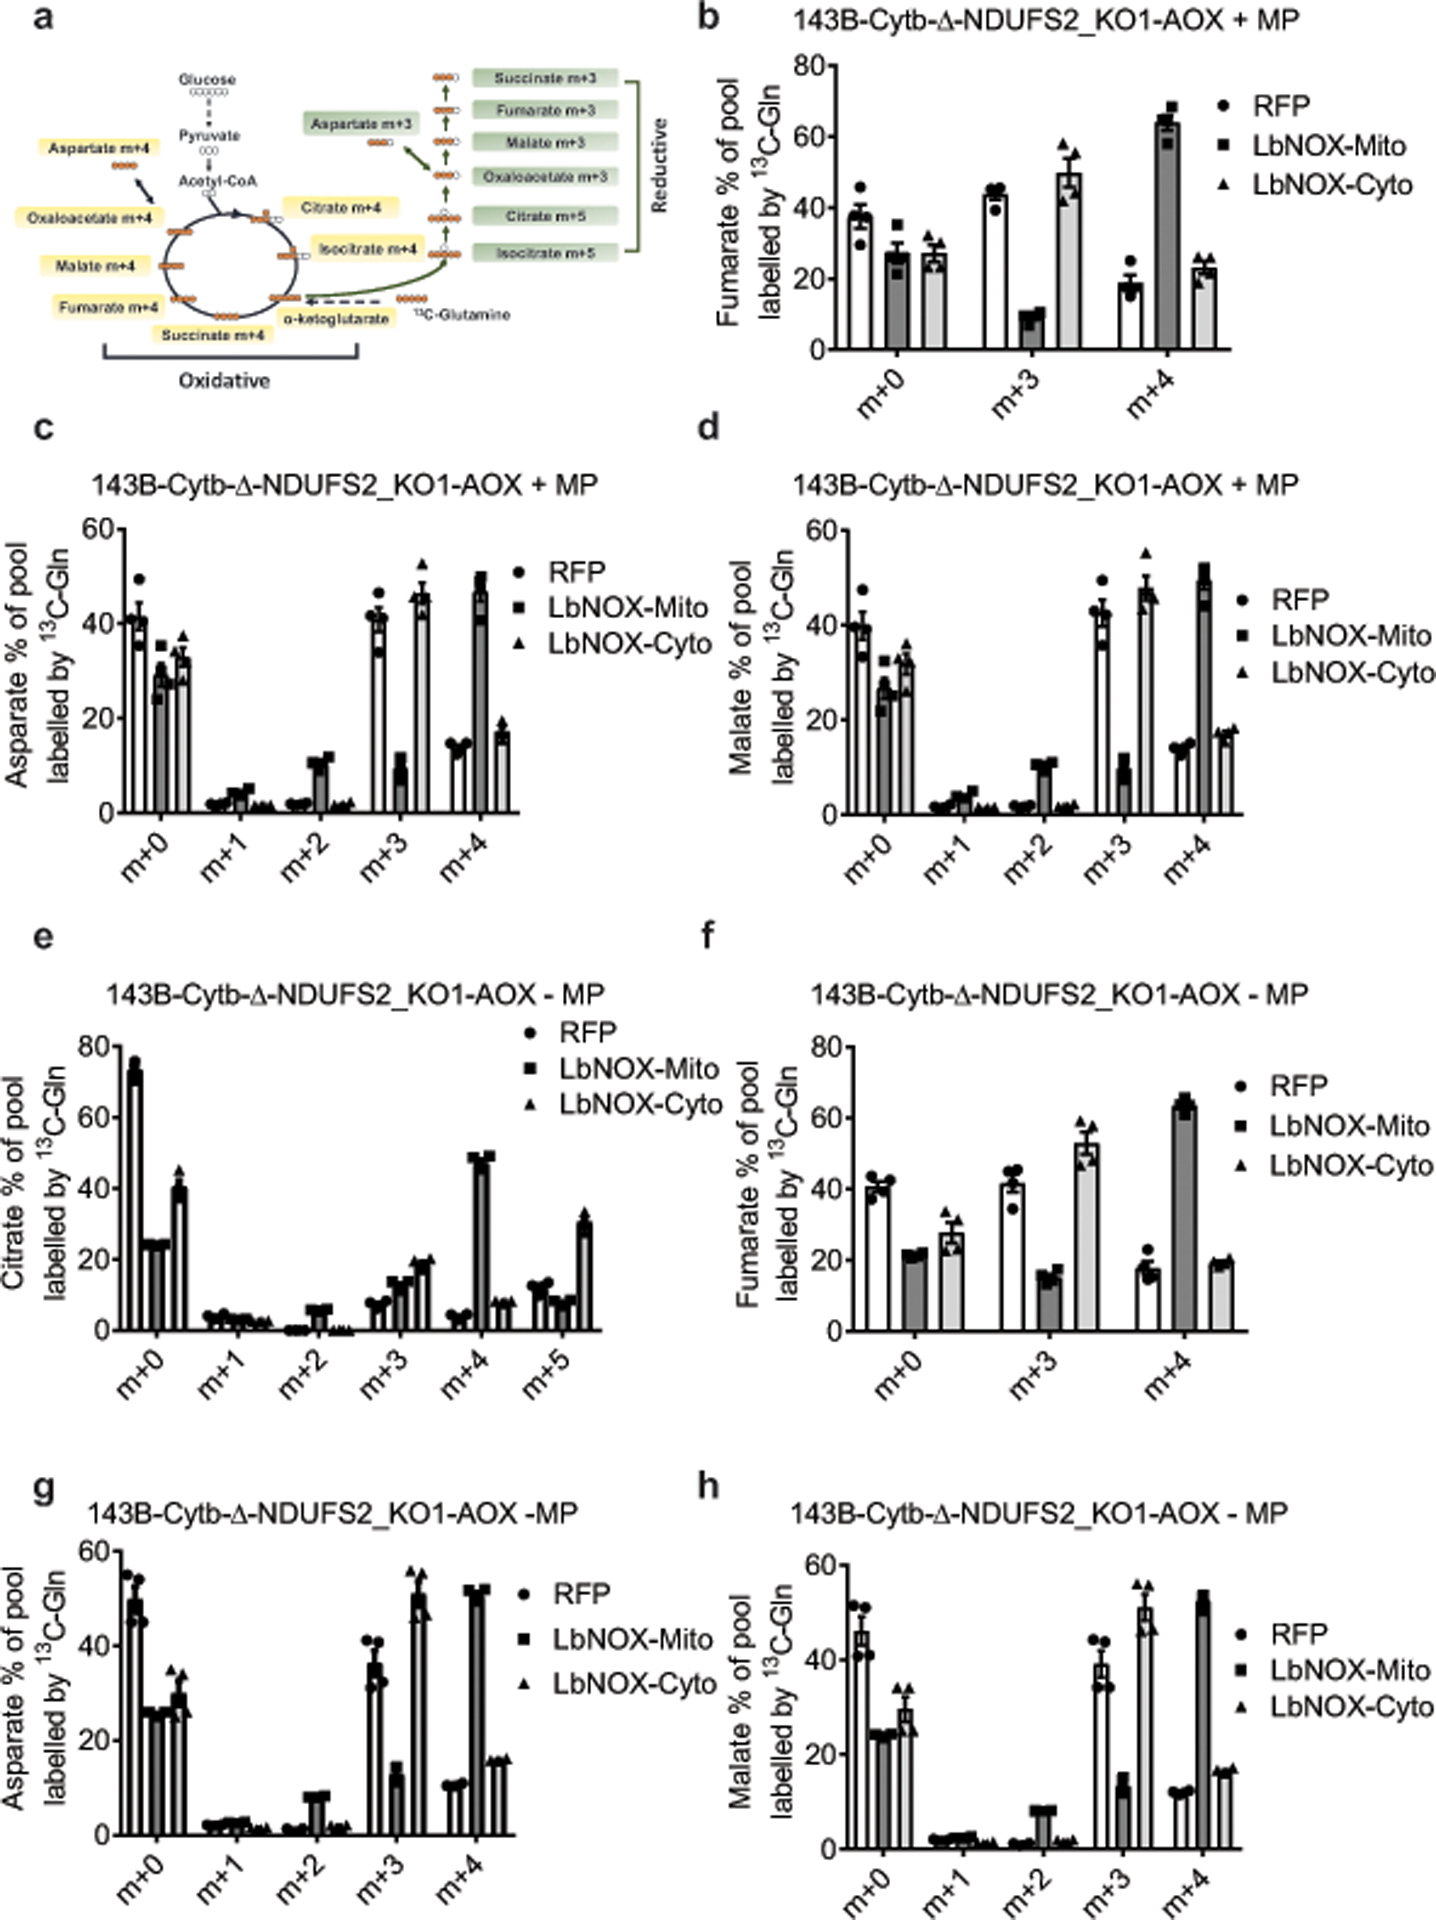
a, Schematic representation for oxidative and reductive glutamine metabolism. Metabolism of [U-13C]glutamine generates fully labeled α-ketoglutarate. Oxidation of α-ketoglutarate in the TCA cycle produces metabolites with four 13C-carbons (m+4), while reduction of α-ketoglutarate through the reductive carboxylation pathway produces citrate with five 13C-carbons (m+5). Further reductive metabolism of the m+5 citrate yields metabolites with three 13C-carbons (m+3). b-h, 143B-Cytb-Δ-NDUFS2_KO1-AOX-RFP, 143B-Cytb-Δ-NDUFS2_KO1-AOX-LbNOX-Mito, and 143B-Cytb-Δ-NDUFS2_KO1-AOX-LbNOX-Cyto cells were labeled for six hours with [U-13C]glutamine in the presence (b-d) or absence of methyl pyruvate (e-h), and percentage of labeled metabolite pools were examined. m+5 and m+3 pools result from glutamine flow through reductive metabolism. m+4 pools result from glutamine flow through oxidative metabolism. Data represent mean ± s.e.m. of 4 biologically independent experiments.
Extended Figure 10: Complex II is necessary for tumor growth.
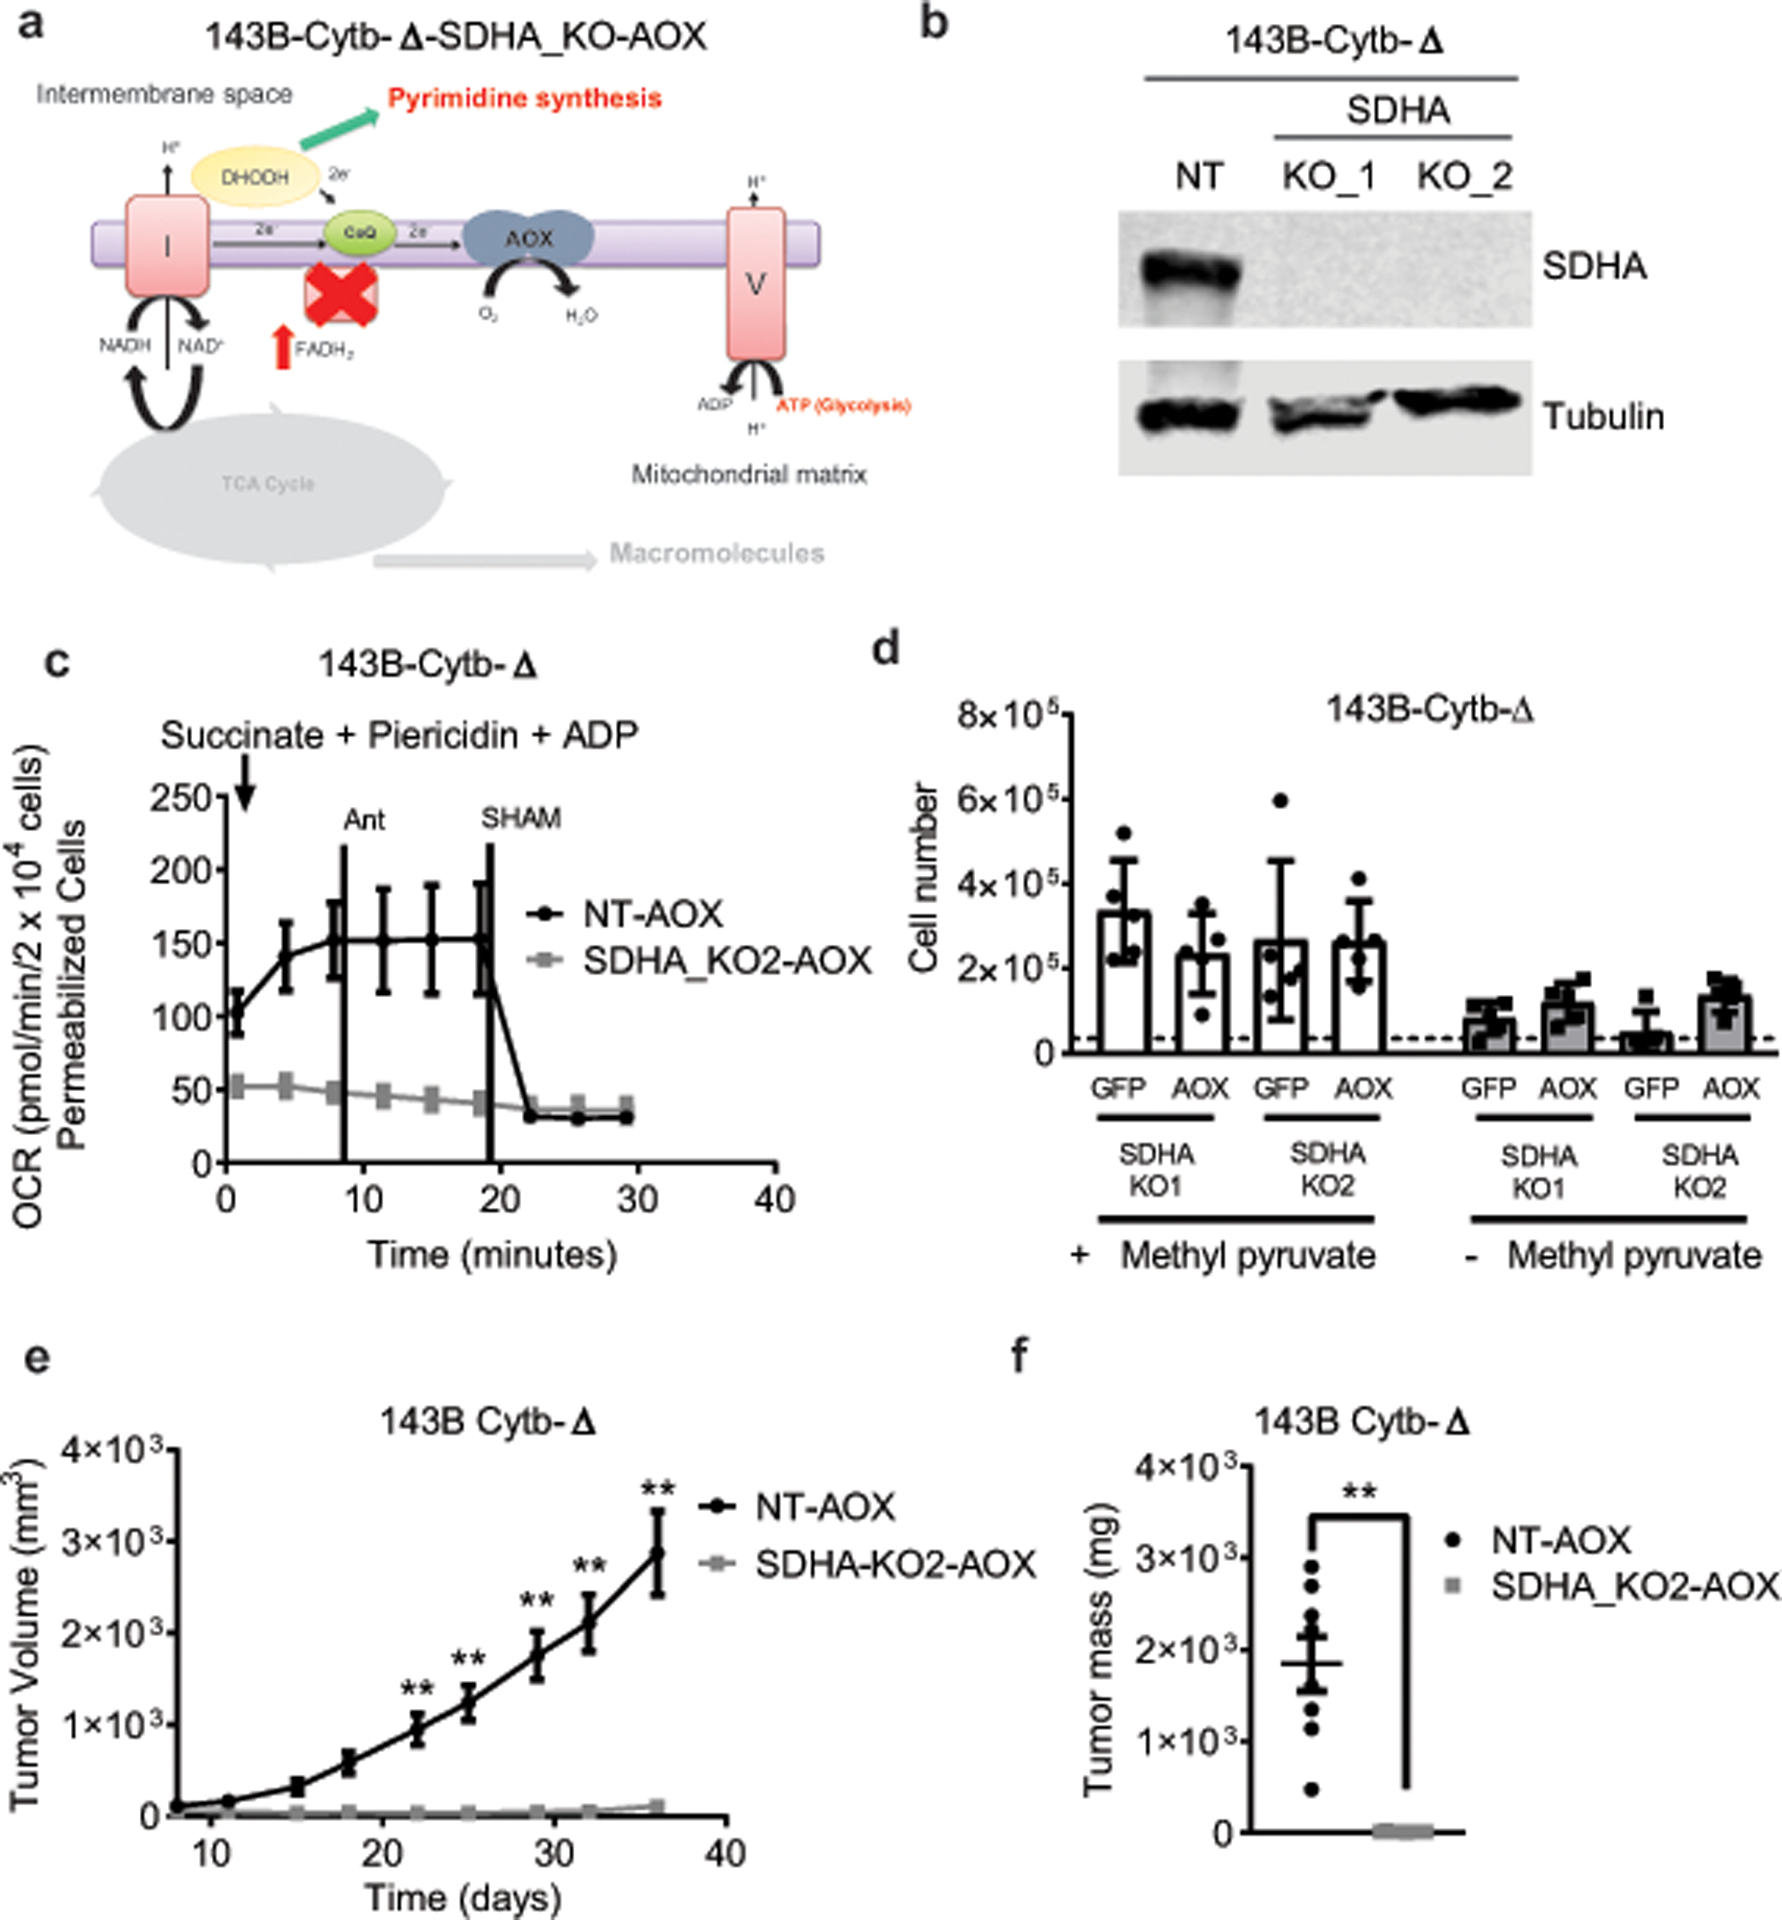
a, Schematic representation of the ETC in complex II deficient 143B-Cytb-Δ cells expressing AOX. b, Western blot analysis of SDHA in 143B-Cytb-Δ non targeting (NT) and 143B-Cytb-Δ-SDHA_KOs cells. Tubulin was used as a loading control. Data representative of two independent experiments. c, Complex II driven oxygen consumption rate of permeabilized 143B-Cytb-Δ-NT-AOX and 143B-Cytb-Δ-SDHA_KO2-AOX cells. Piericidin A (1 μM) and Antimycin A (1 μM) were used to inhibit complex I and III respectively. SHAM (2 mM) was used to inhibit AOX activity (n=4 biologically independent experiments). d, 143B-Cytb-Δ-SDHA-KOs expressing GFP or AOX were grown in the presence or absence of methyl pyruvate and cell number was assessed after 72h (n=5 biologically independent experiments). e,f, Average tumor volume (e) and tumor mass (f) of xenografts from 143B-Cytb-Δ-NT-AOX and 143B-Cytb-Δ-SDHA_KO2-AOX cells (n=8 mice per group from two independent cohorts). Data represent mean ± s.e.m. (c-f). Statistical significance was determined using two-tailed t-tests (f) or 2-way ANOVA (d,e) with a Bonferroni test for multiple comparisons (*p < 0.05; **p < 0.01, exact P values in Source Data). For gel source data, see Supplemental Figure 6.
Extended Figure 11: Restoration of complex II by ectopic expression of SDHA cDNA rescues tumor growth.
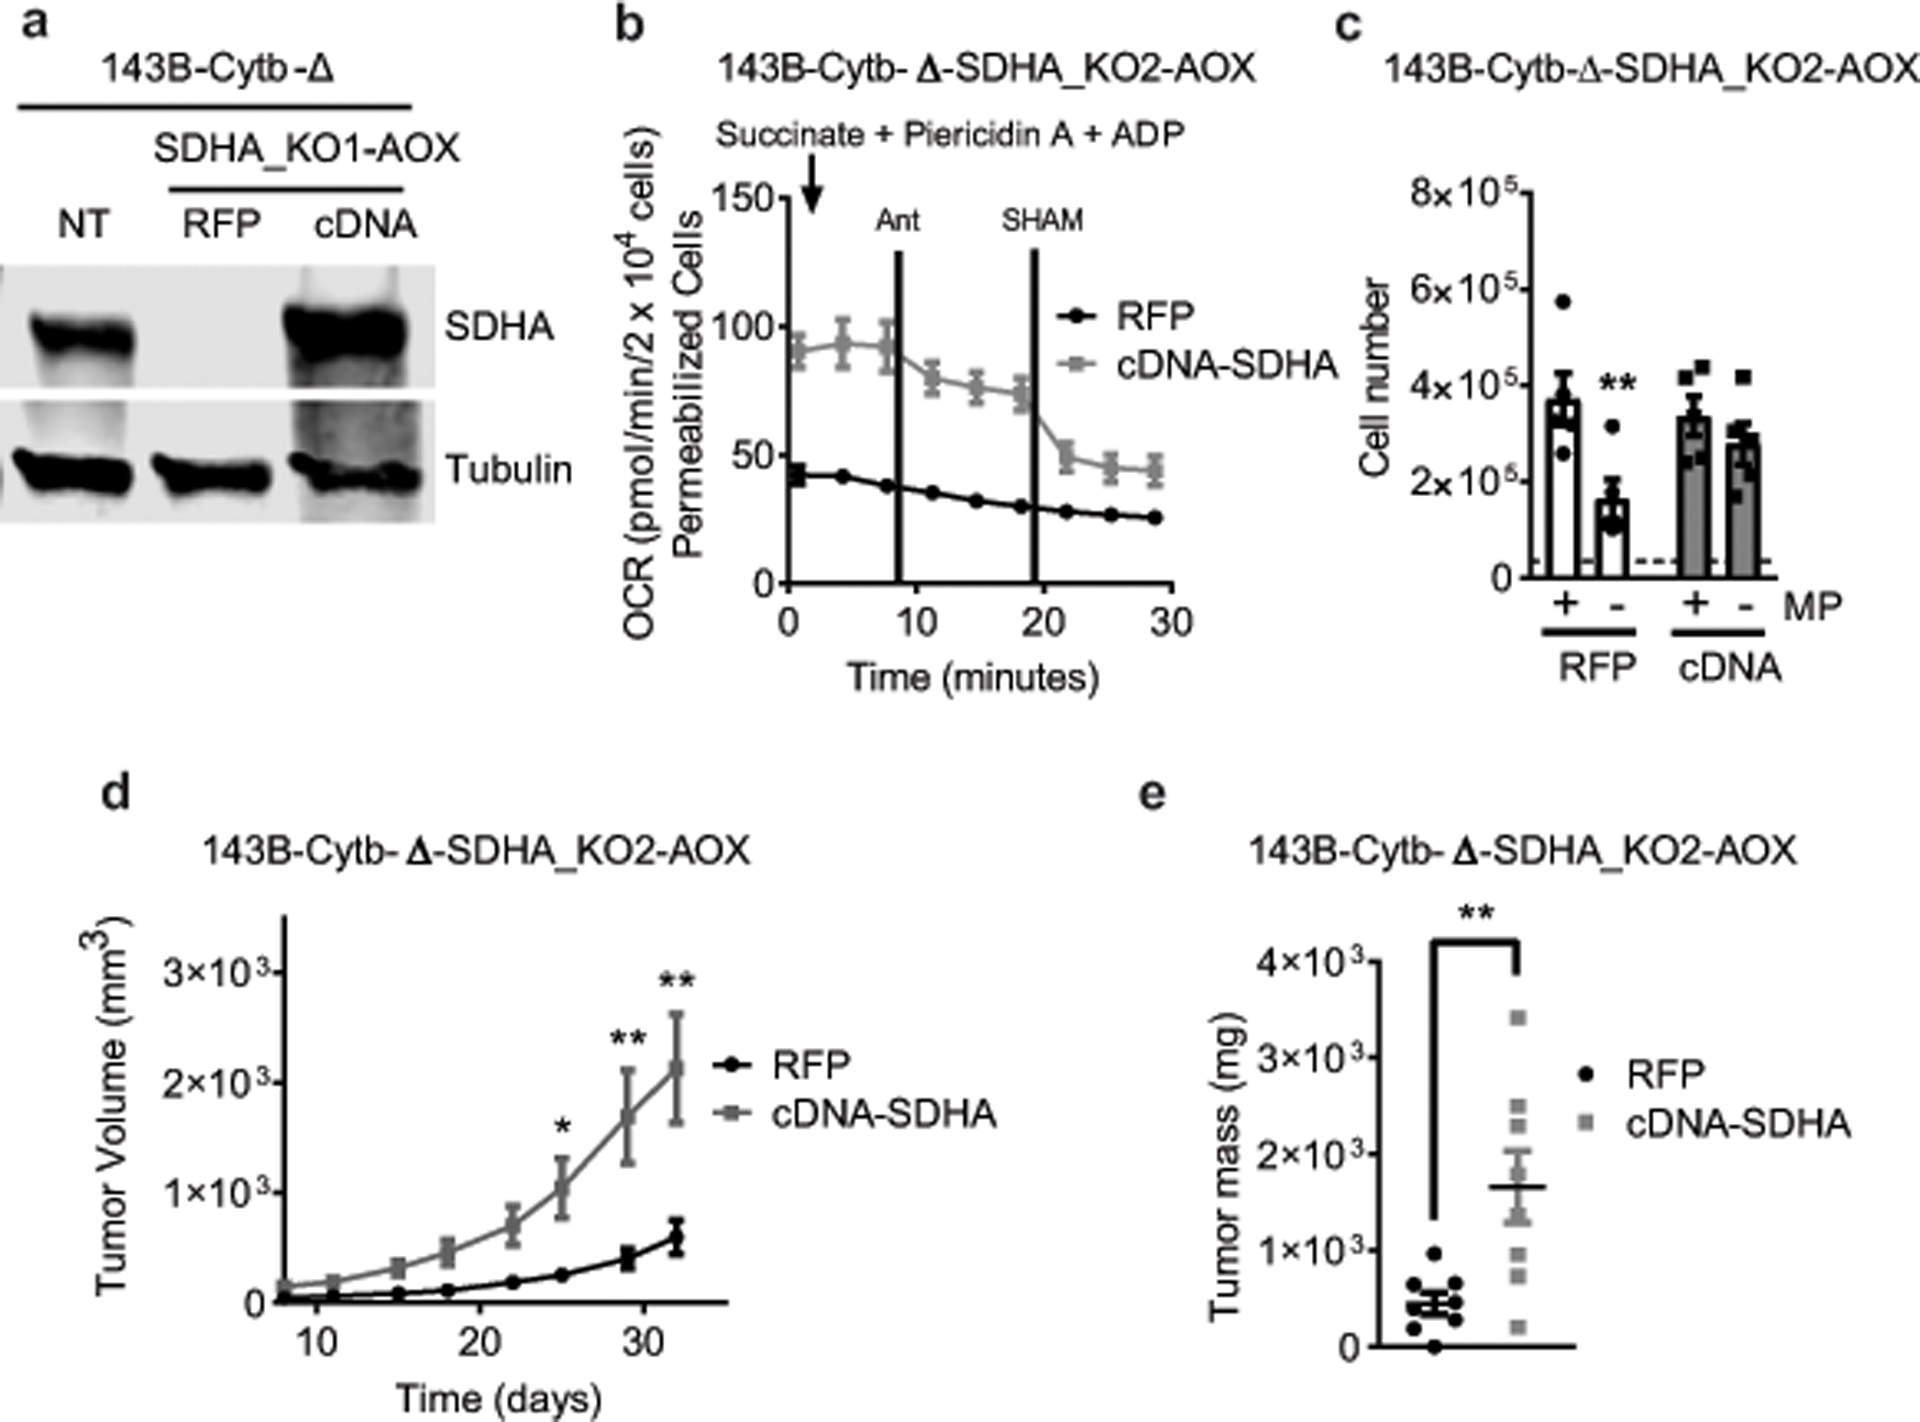
a, Western blot analysis of SDHA protein levels in 143B-Cytb-Δ-NT, 143B-Cytb-Δ-SDHA_KO2-AOX-RFP and 143B-Cytb-Δ-SDHA_KO2-AOX-cDNA SDHA cells. Data representative of three independent experiments. b, Complex II driven oxygen consumption rate of permeabilized 143B-Cytb-Δ-SDHA_KO2-AOX-RFP and 143B-Cytb-Δ-SDHA_KO2-AOX-cDNA SDHA cells. Succinate and ADP were provided as substrates. Piericidin A (1 μM) and Antimycin A (1 μM) were used to inhibit complex I and III respectively. SHAM (2 mM) was used to inhibit AOX activity (n=4 biologically independent experiments). c, 143B-Cytb-Δ-SDHA_KO2-AOX-RFP and 143B-Cytb-Δ-SDHA_KO2-AOX-cDNA SDHA cells were grown in the presence or absence of methyl pyruvate and cell number was assessed after 72h (n=5 biologically independent experiments). d,e, Average tumor volume (d) and tumor mass (e) of xenografts from 143B-Cytb-Δ-SDHA_KO2-AOX-RFP and 143B-Cytb-Δ-SDHA_KO2-AOX-cDNA SDHA cells (n=8 mice per group from two independent cohorts). Data represent mean ± s.e.m. (b-e). Statistical significance was determined using two-tailed t-tests (e) or 2-way ANOVA (c,d) with a Bonferroni test for multiple comparisons (*p < 0.05; **p < 0.01, exact P values in Source Data). For gel source data, see Supplemental Figure 6.
Supplementary Material
Acknowledgements
This work was supported by NIH (5R35CA197532) to N.S.C.; a postdoctoral fellowship by Ramon Areces Foundation of Spain to I.M.R.; NCI (T32 CA009560) and NIH (2T32HL076139-16) to H.K.; NIH (5 T32 CA 9560-33) and Northwestern University Pulmonary department’s Cugell fellowship to K.V.; NIH (T32CA09560) and (T32HL076139-13) to G.S.M., and NIH (T32 T32HL076139) to S.E.W. E.M.S. is a Cancer Research Institute Irvington Fellow supported by the Cancer Research Institute. We thank Robert H. Lurie Cancer Center Flow Cytometry facility supported by NCI CCSG P30 CA060553 for their invaluable assistance. Imaging work was performed at the Northwestern University Center for Advanced Microscopy generously supported by NCI CCSG P30 CA060553 awarded to the Robert H Lurie Comprehensive Cancer Center. We thank Thales Papagiannakopoulos and Sarah Leboeuf for providing KP cells. We thank Carlos Moraes for Cytb-Δ cells. Original LbNOX constructs were generated by Vamsi Mootha’s lab and acquired from Addgene. We thank Eric Dufour and Howard Jacobs for original NDI1 and AOX constructs. We thank the members of the Chandel lab for thoughtful discussion.
Footnotes
Data availability. All data from the manuscript are available from the corresponding author on request.
Reporting summary. Further information on experimental design is available in the Nature Research Reporting Summary linked to this article.
Competing interests: Navdeep S. Chandel is SAB member of Rafael Pharmaceuticals.
References
- 1.DeBerardinis RJ & Chandel NS We need to talk about the Warburg effect. Nature Metabolism 2, 127–129, doi: 10.1038/s42255-020-0172-2 (2020). [DOI] [PubMed] [Google Scholar]
- 2.Weinberg F et al. Mitochondrial metabolism and ROS generation are essential for Kras-mediated tumorigenicity. Proc Natl Acad Sci U S A 107, 8788–8793, doi: 10.1073/pnas.1003428107 (2010). [DOI] [PMC free article] [PubMed] [Google Scholar]
- 3.Tan AS et al. Mitochondrial genome acquisition restores respiratory function and tumorigenic potential of cancer cells without mitochondrial DNA. Cell Metab 21, 81–94, doi: 10.1016/j.cmet.2014.12.003 (2015). [DOI] [PubMed] [Google Scholar]
- 4.Ju YS et al. Origins and functional consequences of somatic mitochondrial DNA mutations in human cancer. Elife 3, doi: 10.7554/eLife.02935 (2014). [DOI] [PMC free article] [PubMed] [Google Scholar]
- 5.Kuntz EM et al. Targeting mitochondrial oxidative phosphorylation eradicates therapy-resistant chronic myeloid leukemia stem cells. Nat Med 23, 1234–1240, doi: 10.1038/nm.4399 (2017). [DOI] [PMC free article] [PubMed] [Google Scholar]
- 6.Roth KG, Mambetsariev I, Kulkarni P & Salgia R The Mitochondrion as an Emerging Therapeutic Target in Cancer. Trends Mol Med 26, 119–134, doi: 10.1016/j.molmed.2019.06.009 (2020). [DOI] [PMC free article] [PubMed] [Google Scholar]
- 7.Navarro P et al. Targeting Tumor Mitochondrial Metabolism Overcomes Resistance to Antiangiogenics. Cell Rep 15, 2705–2718, doi: 10.1016/j.celrep.2016.05.052 (2016). [DOI] [PubMed] [Google Scholar]
- 8.Kim SH et al. Phenformin Inhibits Myeloid-Derived Suppressor Cells and Enhances the Anti-Tumor Activity of PD-1 Blockade in Melanoma. J Invest Dermatol 137, 1740–1748, doi: 10.1016/j.jid.2017.03.033 (2017). [DOI] [PubMed] [Google Scholar]
- 9.Viale A et al. Oncogene ablation-resistant pancreatic cancer cells depend on mitochondrial function. Nature 514, 628–632, doi: 10.1038/nature13611 (2014). [DOI] [PMC free article] [PubMed] [Google Scholar]
- 10.Maher EA et al. Metabolism of [U-13 C]glucose in human brain tumors in vivo. NMR Biomed 25, 1234–1244, doi: 10.1002/nbm.2794 (2012). [DOI] [PMC free article] [PubMed] [Google Scholar]
- 11.Hensley CT et al. Metabolic Heterogeneity in Human Lung Tumors. Cell 164, 681–694, doi: 10.1016/j.cell.2015.12.034 (2016). [DOI] [PMC free article] [PubMed] [Google Scholar]
- 12.Hakkaart GA, Dassa EP, Jacobs HT & Rustin P Allotopic expression of a mitochondrial alternative oxidase confers cyanide resistance to human cell respiration. EMBO Rep 7, 341–345, doi: 10.1038/sj.embor.7400601 (2006). [DOI] [PMC free article] [PubMed] [Google Scholar]
- 13.Titov DV et al. Complementation of mitochondrial electron transport chain by manipulation of the NAD+/NADH ratio. Science 352, 231–235, doi: 10.1126/science.aad4017 (2016). [DOI] [PMC free article] [PubMed] [Google Scholar]
- 14.Martinez-Reyes I et al. TCA Cycle and Mitochondrial Membrane Potential Are Necessary for Diverse Biological Functions. Mol Cell 61, 199–209, doi: 10.1016/j.molcel.2015.12.002 (2016). [DOI] [PMC free article] [PubMed] [Google Scholar]
- 15.Garcia-Bermudez J et al. Aspartate is a limiting metabolite for cancer cell proliferation under hypoxia and in tumours. Nat Cell Biol 20, 775–781, doi: 10.1038/s41556-018-0118-z (2018). [DOI] [PMC free article] [PubMed] [Google Scholar]
- 16.Sullivan LB et al. Supporting Aspartate Biosynthesis Is an Essential Function of Respiration in Proliferating Cells. Cell 162, 552–563, doi: 10.1016/j.cell.2015.07.017 (2015). [DOI] [PMC free article] [PubMed] [Google Scholar]
- 17.Sullivan LB et al. Aspartate is an endogenous metabolic limitation for tumour growth. Nat Cell Biol 20, 782–788, doi: 10.1038/s41556-018-0125-0 (2018). [DOI] [PMC free article] [PubMed] [Google Scholar]
- 18.Birsoy K et al. An Essential Role of the Mitochondrial Electron Transport Chain in Cell Proliferation Is to Enable Aspartate Synthesis. Cell 162, 540–551, doi: 10.1016/j.cell.2015.07.016 (2015). [DOI] [PMC free article] [PubMed] [Google Scholar]
- 19.Bajzikova M et al. Reactivation of Dihydroorotate Dehydrogenase-Driven Pyrimidine Biosynthesis Restores Tumor Growth of Respiration-Deficient Cancer Cells. Cell Metab 29, 399–416 e310, doi: 10.1016/j.cmet.2018.10.014 (2019). [DOI] [PMC free article] [PubMed] [Google Scholar]
- 20.Mullen AR et al. Reductive carboxylation supports growth in tumour cells with defective mitochondria. Nature 481, 385–388, doi: 10.1038/nature10642 (2011). [DOI] [PMC free article] [PubMed] [Google Scholar]
- 21.Lussey-Lepoutre C et al. Loss of succinate dehydrogenase activity results in dependency on pyruvate carboxylation for cellular anabolism. Nat Commun 6, 8784, doi: 10.1038/ncomms9784 (2015). [DOI] [PMC free article] [PubMed] [Google Scholar]
- 22.Cardaci S et al. Pyruvate carboxylation enables growth of SDH-deficient cells by supporting aspartate biosynthesis. Nat Cell Biol 17, 1317–1326, doi: 10.1038/ncb3233 (2015). [DOI] [PMC free article] [PubMed] [Google Scholar]
- 23.DeBerardinis RJ & Chandel NS Fundamentals of cancer metabolism. Sci Adv 2, e1600200, doi: 10.1126/sciadv.1600200 (2016). [DOI] [PMC free article] [PubMed] [Google Scholar]
- 24.Guo JY et al. Activated Ras requires autophagy to maintain oxidative metabolism and tumorigenesis. Genes Dev 25, 460–470, doi: 10.1101/gad.2016311 (2011). [DOI] [PMC free article] [PubMed] [Google Scholar]
- 25.Romero R et al. Keap1 loss promotes Kras-driven lung cancer and results in dependence on glutaminolysis. Nat Med 23, 1362–1368, doi: 10.1038/nm.4407 (2017). [DOI] [PMC free article] [PubMed] [Google Scholar]
- 26.Momcilovic M et al. In vivo imaging of mitochondrial membrane potential in non-small-cell lung cancer. Nature, doi: 10.1038/s41586-019-1715-0 (2019). [DOI] [PMC free article] [PubMed] [Google Scholar]
- 27.Molina JR et al. An inhibitor of oxidative phosphorylation exploits cancer vulnerability. Nat Med 24, 1036–1046, doi: 10.1038/s41591-018-0052-4 (2018). [DOI] [PubMed] [Google Scholar]
- 28.Alistar A et al. Safety and tolerability of the first-in-class agent CPI-613 in combination with modified FOLFIRINOX in patients with metastatic pancreatic cancer: a single-centre, open-label, dose-escalation, phase 1 trial. Lancet Oncol 18, 770–778, doi: 10.1016/S1470-2045(17)30314-5 (2017). [DOI] [PMC free article] [PubMed] [Google Scholar]
- 29.Weinberg F et al. Mitochondrial metabolism and ROS generation are essential for Kras-mediated tumorigenicity. Proc Natl Acad Sci U S A 107, 8788–8793, doi: 10.1073/pnas.1003428107 (2010). [DOI] [PMC free article] [PubMed] [Google Scholar]
- 30.DuPage M, Dooley AL & Jacks T Conditional mouse lung cancer models using adenoviral or lentiviral delivery of Cre recombinase. Nat Protoc 4, 1064–1072, doi: 10.1038/nprot.2009.95 (2009). [DOI] [PMC free article] [PubMed] [Google Scholar]
- 31.Mullen AR et al. Reductive carboxylation supports growth in tumor cells with defective mitochondria. Nature 481, 385–388, doi: 10.1038/nature10642 (2011). [DOI] [PMC free article] [PubMed] [Google Scholar]
- 32.Chong J, Soufan O, Li C, Caraus I, Li S, Bourque G, Wishart DS, Xia J. MetaboAnalyst 4.0: towards more transparent and integrative metabolomics analysis. Nucleic Acids Res 46, (W1):W486–W94. doi: 10.1093/nar/gky310 (2018). [DOI] [PMC free article] [PubMed] [Google Scholar]
Associated Data
This section collects any data citations, data availability statements, or supplementary materials included in this article.