Summary
Most general anesthetics and classical benzodiazepines act through positive modulation of γ-aminobutyric acid type A (GABAA) receptors to dampen neuronal activity in the brain1–5. Direct structural information for how these drugs work at their physiological receptor sites is absent for general anesthetics. Here we present high-resolution structures of GABAA receptors bound to intravenous anesthetic, benzodiazepine, and inhibitory modulators. These structures were solved in a lipidic environment and complemented by electrophysiology and molecular dynamics simulations. Structures in complex with the anesthetics phenobarbital, etomidate and propofol reveal both distinct and common transmembrane binding sites, shared in part by the benzodiazepine diazepam. Structures bound by antagonistic benzodiazepine-site ligands identify a novel membrane binding site for diazepam and suggest an allosteric mechanism for anesthetic reversal by flumazenil. This study provides a foundation for understanding how pharmacologically diverse and clinically essential drugs act through overlapping and distinctive mechanisms to potentiate inhibitory signaling in the brain.
Introduction
General anesthetics were long thought to act through a membrane effect due to a strong correlation between their potency and their tendency to partition into lipid6–9. This non-specific model became harder to reconcile upon discovery of exceptions to the rule, including isomers of anesthetics with opposing activities10–12. More recent electrophysiology11, mutagenesis13 and labeling studies2, in concert with mouse knock-in studies14, identified the GABAA receptor as the principal target for modern intravenous (IV) anesthetics. Barbiturates were developed in the 1930s as anti-convulsive drugs and were the first IV anesthetics. They have a narrow therapeutic index and have been largely replaced by etomidate and propofol, which are more selective, and are the two most commonly used IV anesthetics. All general anesthetics acting through the GABAA receptor are positive allosteric modulators, like the classical benzodiazepines, but with transmembrane sites distinct from where benzodiazepines are mainly thought to act.
Benzodiazepines are GABAA receptor ligands used in treating epilepsy, anxiety and insomnia3,4. Classical benzodiazepines like diazepam are positive allosteric modulators of GABAA receptors and exhibit a spectrum of pharmacological effects, from sedation at low doses to induction of anesthesia at higher doses. These different effects have been related to two distinct classes of binding sites on the receptor. A high-affinity benzodiazepine site at the α-γ subunit interface in the receptor’s extracellular domain is responsible for the positive modulation useful in treating anxiety and seizure disorders. One or more lower affinity sites are thought to contribute to the ability of high doses of some benzodiazepines, like diazepam, to directly induce anesthesia15,16. Flumazenil is a competitive antagonist of the α1-γ2 high-affinity benzodiazepine site3,5 that is used clinically as an antidote for benzodiazepine overdose and to reverse general anesthesia17. The structural mechanisms underlying potentiation by benzodiazepines and their antagonism by flumazenil have begun to emerge but remain unclear.
Here we investigate the structural basis of how IV anesthetics modulate GABAA receptor signaling, and how their mechanisms overlap in part with those of benzodiazepines. We optimized a lipid reconstitution approach for the α1β2γ2 GABAA receptor to determine structures in complex with GABA plus the barbiturate phenobarbital, and with GABA plus etomidate, and GABA plus propofol, mapping their distinct sites and atomic interactions. We compare these anesthetic complexes to new structures bound by GABA alone, GABA plus diazepam, and GABA plus flumazenil, to define common and distinctive mechanisms for potentiation, and elucidate how flumazenil competitively or allosterically antagonizes the positive modulators. We then analyze α1β2γ2 receptor structures bound by GABA plus picrotoxin (pore blocker) and bicuculline (competitive antagonist) for comparison with recent structures of the highly similar α1β3γ2 receptor18,19, where we identify systematic conformational differences likely arising from the lipid reconstitution method. Mutagenesis, electrophysiology and molecular dynamics simulations (MD) complement the structural findings on ligand recognition and conformational stabilization.
Barbiturate recognition
Barbiturates exhibit a spectrum of GABAA receptor-mediated activities, including sedative, anxiolytic, hypnotic and anti-convulsant effects. Phenobarbital specifically remains popular as an anti-epileptic drug. At low concentrations it potentiates the receptor’s response to GABA, while at high concentrations it evokes direct allosteric activation, through binding sites in the transmembrane domain20. We developed a lipid reconstitution approach to stabilize the TMD and avoid pore collapse observed with detergent21 (Extended Data Fig. 1 and 2, Methods), then collected cryo-EM data on the α1β2γ2 receptor in complex with GABA plus phenobarbital. Despite approximate 5-fold symmetry in the membrane domain for the barbiturate complex, density for the TMD of the γ2 subunit (γ-TMD) was weaker than for other subunits, an observation common in all ligand complexes we studied, with functional implications potentially relevant to desensitization22. Therefore, we performed focused 3D classification on the γ-TMD to improve local signal, which resulted in a 3.1 Å resolution map with strong signal in the γ-TMD, and with clear density for phenobarbital at α-β and γ-β interfaces (Fig. 1, Extended Data Figs. 3, 4, and Extended Data Table 1).
Figure 1: Phenobarbital binding sites.
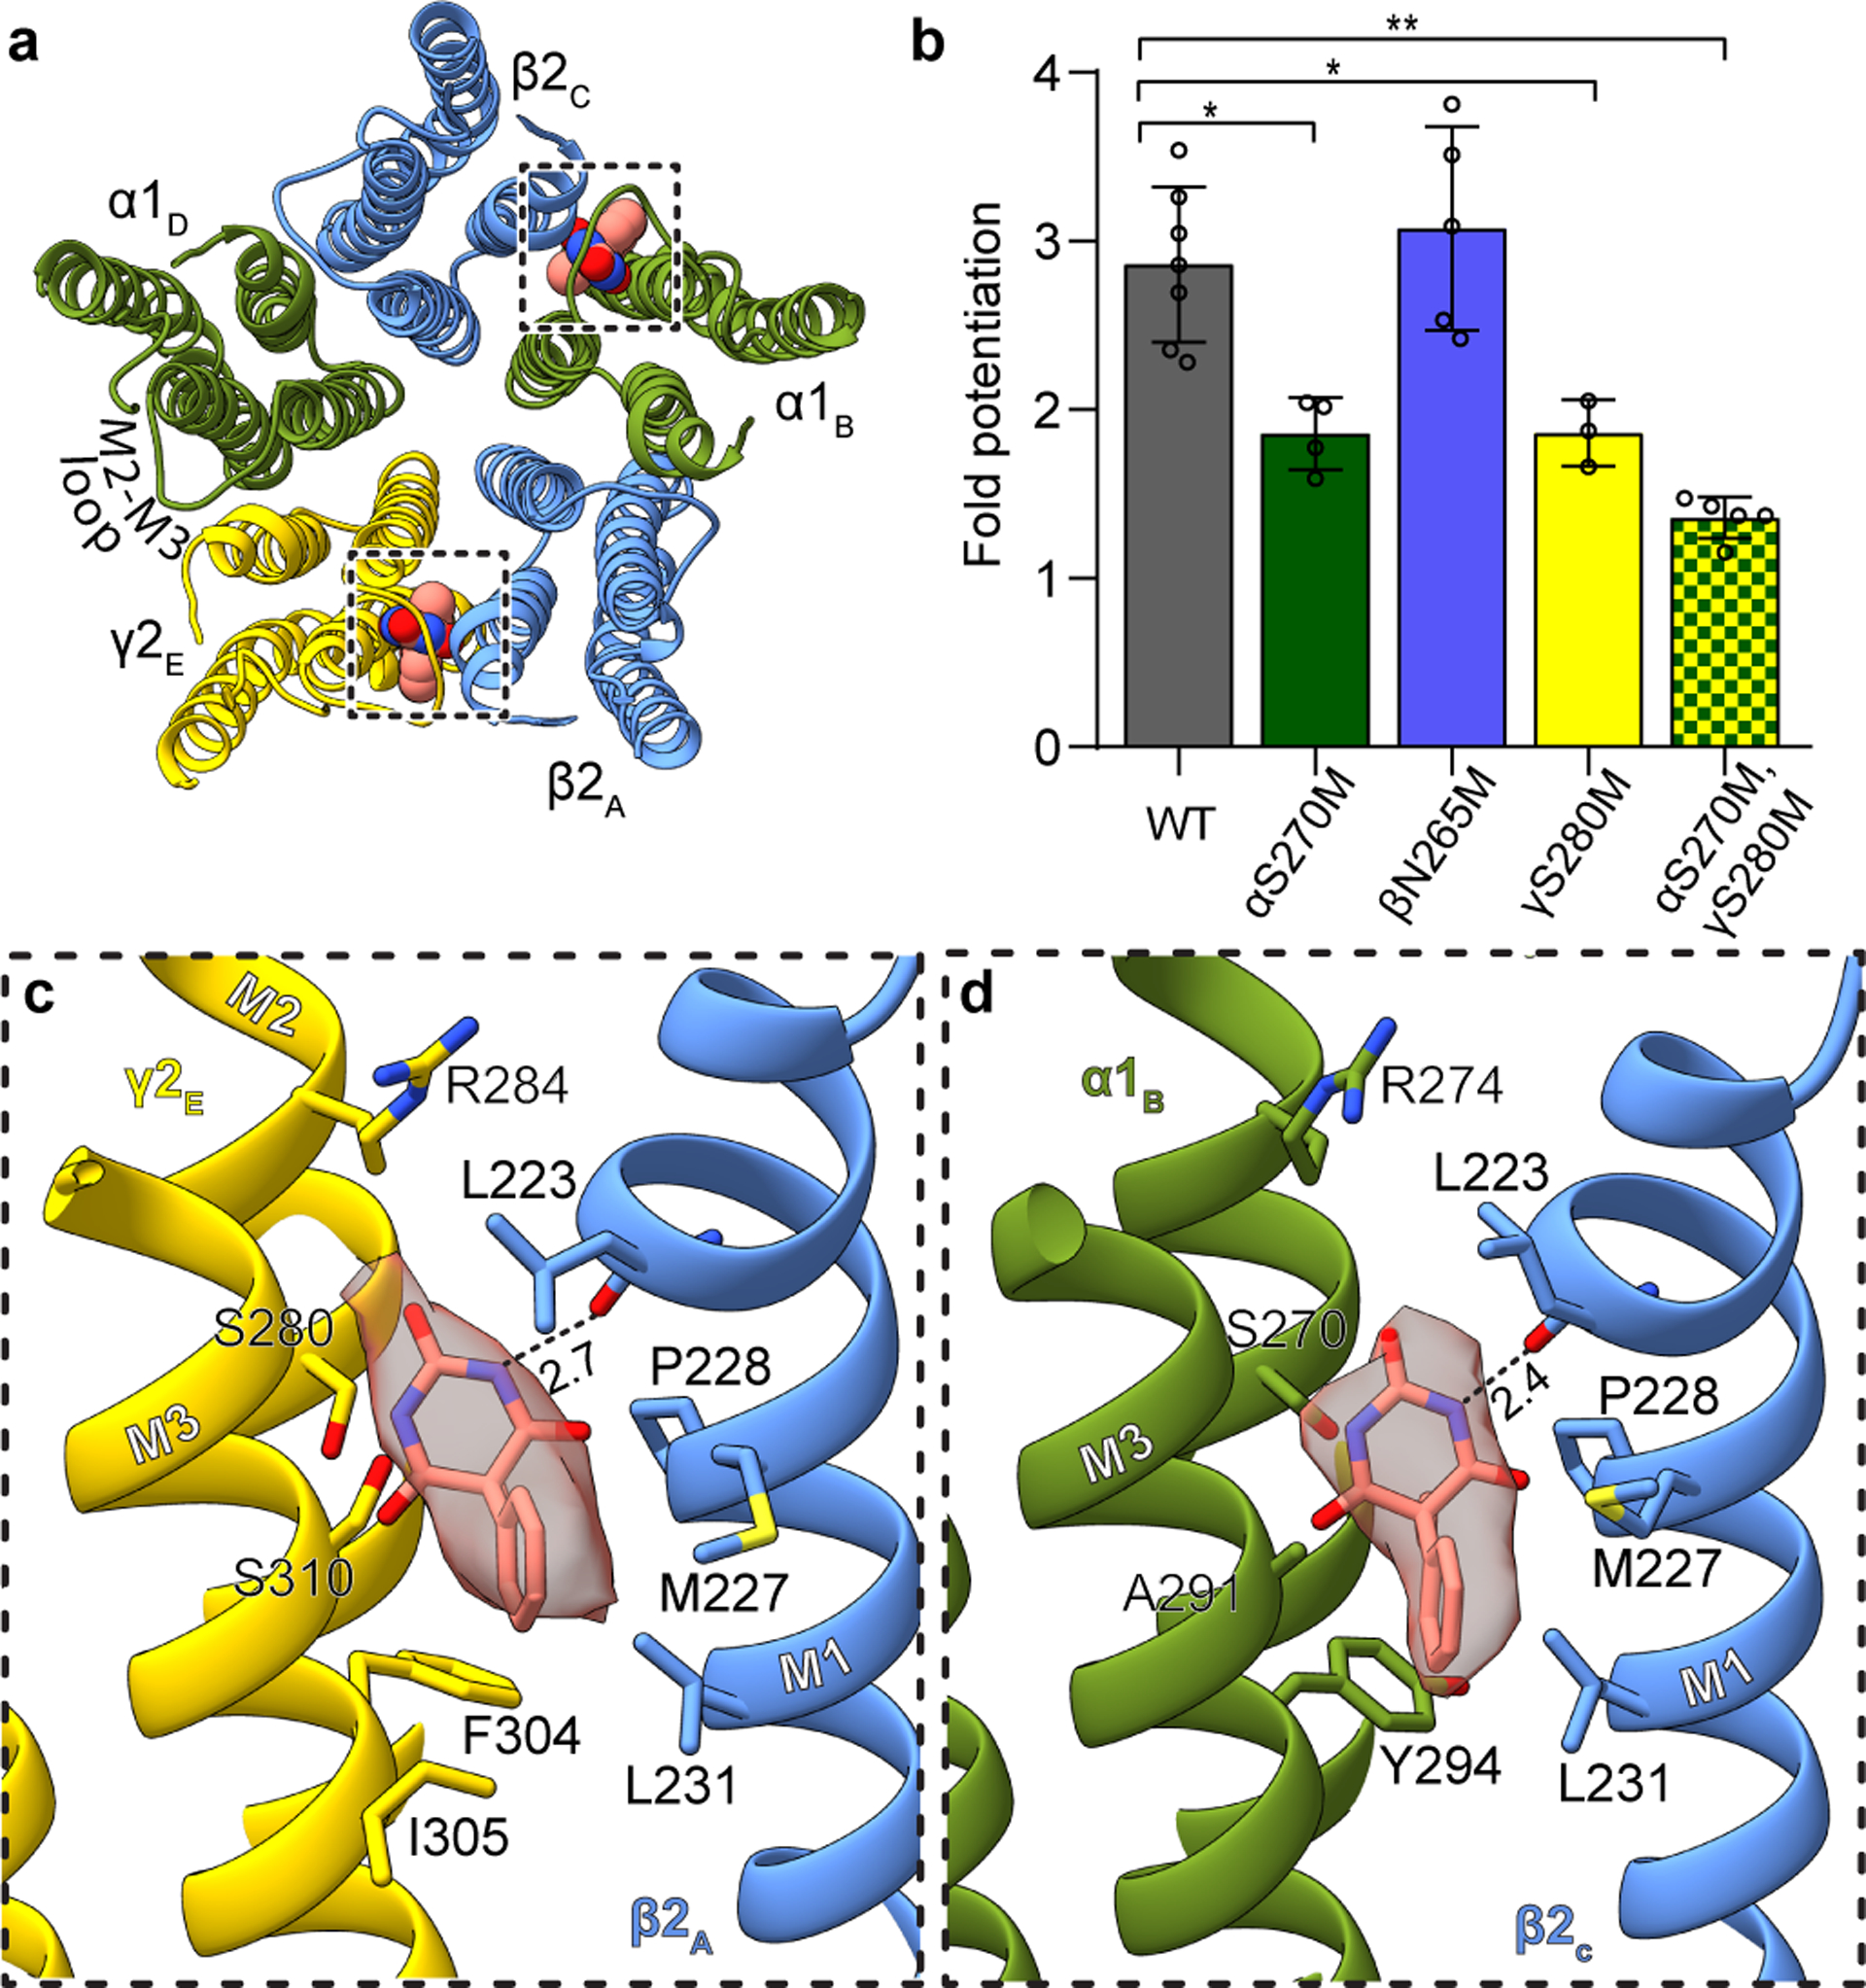
Panel a provides overview of atomic model of TMD viewed down channel axis from synaptic perspective; boxes highlight phenobarbital sites with ligand shown as spheres. Panel b shows the effect of mutation at the 15’ position of different subunits on fold potentiation of GABA activation by phenobarbital. The bars indicate mean ± SD, n = 7 (WT), 4 (αS270M), 5 (βN265M), 3 (γS280M) and 5 (double mutant) *, p < 0.01 ; ** p < 0.0001. “n=X” represents biologically independent patch clamp experiments with individual cells. Panels c and d show binding site details for phenobarbital at γ-β and α-β interfaces. H-bonds indicated with dashed line and distance.
The binding mode for phenobarbital is equivalent between the two sites, with the barbituric acid group resting deep in the M3-M1 interfaces, the phenyl group orienting away from the channel axis, and the ethyl group orienting toward the pore (Fig. 1c–d, Supplementary Videos 1–2). The binding locus is at the level of the M2 15′ residue and just below a short π-helix in β2 M1. Notably, the proline responsible for this π-helix is conserved across diverse members of the Cys-loop receptor superfamily; it creates a bulge in M1 that in turn creates a pocket present at all interfaces in the structure below the M2-M3 loop. Phenobarbital is stabilized mainly through van der Waals interactions, with one electrostatic contact between the backbone carbonyl oxygen of βL223 and a barbituric acid nitrogen. While these two binding modes are consistent in position and in predicted pose with the affinity labeling analysis23, they are in potential conflict with a study in β3 point-mutant knock-in mice that predict binding at β-α interfaces24. Mice with a mutation of β3 N265M, the M2 15′ residue that would contribute to a β-α interface site, exhibit a partial loss in anesthetic response from pentobarbital. This β2/3 15′ asparagine residue corresponds to S270 in α1 and S280 in γ2 (Fig. 1c–d). We observed no density for phenobarbital at the β-α interface, and based on the structure, substitution of the 15′ serine with asparagine would result in a clash with phenobarbital. To test the roles of the γ-β, α-β and potential β-α interfaces in sensitivity in vitro, we mutated these homologous positions to methionine, which renders receptors less sensitive or unresponsive to anesthetics25, and tested the sensitivity of mutant receptors to potentiation of low dose GABA with phenobarbital (Fig. 1b). We found that individual mutation of the residue in the interfaces where we modeled phenobarbital resulted in a significant loss in potentiation, which was increased in the double mutant. In contrast, mutation of the β265 position resulted in no significant difference in phenobarbital potentiation. Thus, the mutagenesis, electrophysiology, structural biology and affinity labeling are internally consistent in defining two important barbiturate sites in the GABAA receptor TMD, at the α-β and γ-β interfaces.
Etomidate and propofol recognition
Propofol is the most widely used IV general anesthetic26. Etomidate preceded propofol in development and is currently substituted for propofol in cases where cardiovascular or respiratory depression is a concern26,27. In vitro mutagenesis studies identified binding sites for both compounds at β-α interfaces, in positions equivalent to the β-α TMD sites of diazepam, which were responsible for their potentiation of GABA binding, as well as direct activation at higher concentrations. Evidence for etomidate binding exclusively at β-α interfaces is strong25,28–30. Affinity labeling and mutagenesis results for propofol suggest that in addition to the β-α sites25,31–33, there may be additional sites at other subunit interfaces32,34 and/or at the TMD-ECD junction35. Mouse knock-in studies of mutated GABAA subunits connected the immobilizing vs. sedative-hypnotic effects of both agents to the β-α TMD sites in β336 vs. β237 subunit-containing receptors, respectively, with a caveat that the results were less clear in the β2 knock-in mice for propofol than for etomidate. We obtained structures of the α1β2γ2 GABAA receptor in complex with etomidate (3.5 Å) and propofol (2.6 Å) to directly interrogate binding interactions and provide a foundation for understanding allosteric potentiation.
Both the etomidate and propofol maps revealed clear ligand density at β-α interfaces at the predicted sites, and no corresponding density at the other interfaces (Fig. 2a–d, Extended Data Figs. 3, 4, Extended Data Table 1, Supplementary Videos 3, 4). The pose for both ligands, at each of the two β-α interfaces, is equivalent. Etomidate binds at the β-α interfaces at the same level as phenobarbital, with its phenyl ring orienting toward the cytosol, its methyl and imidazole groups orienting toward the channel axis, and its ethyl ester orienting away from the pore, toward bulk lipid (Fig. 2c, Supplementary Video 3). The etomidate orientation is strikingly similar to that predicted from affinity labeling38. Its phenyl ring packs against the β15′ N265, likely forming an electrostatic interaction between the side chain amide nitrogen and phenyl ring π electrons. Mutation to serine at this β15′ position in a related receptor assembly results in a 10-fold loss in etomidate sensitivity, while mutation to methionine results in total loss of etomidate potentiation28. The imidazole ring of etomidate is sandwiched between βF289 in the M3 helix and αP233 across the interface in M2. Extensive van der Waals contacts are made at the interface, including with the side chain of βM286. Mutation of M286 to tryptophan results in a large loss in sensitivity to etomidate29, consistent with all common rotamers of tryptophan in this position generating clashes with either etomidate or the receptor.
Figure 2: Etomidate and propofol interactions.
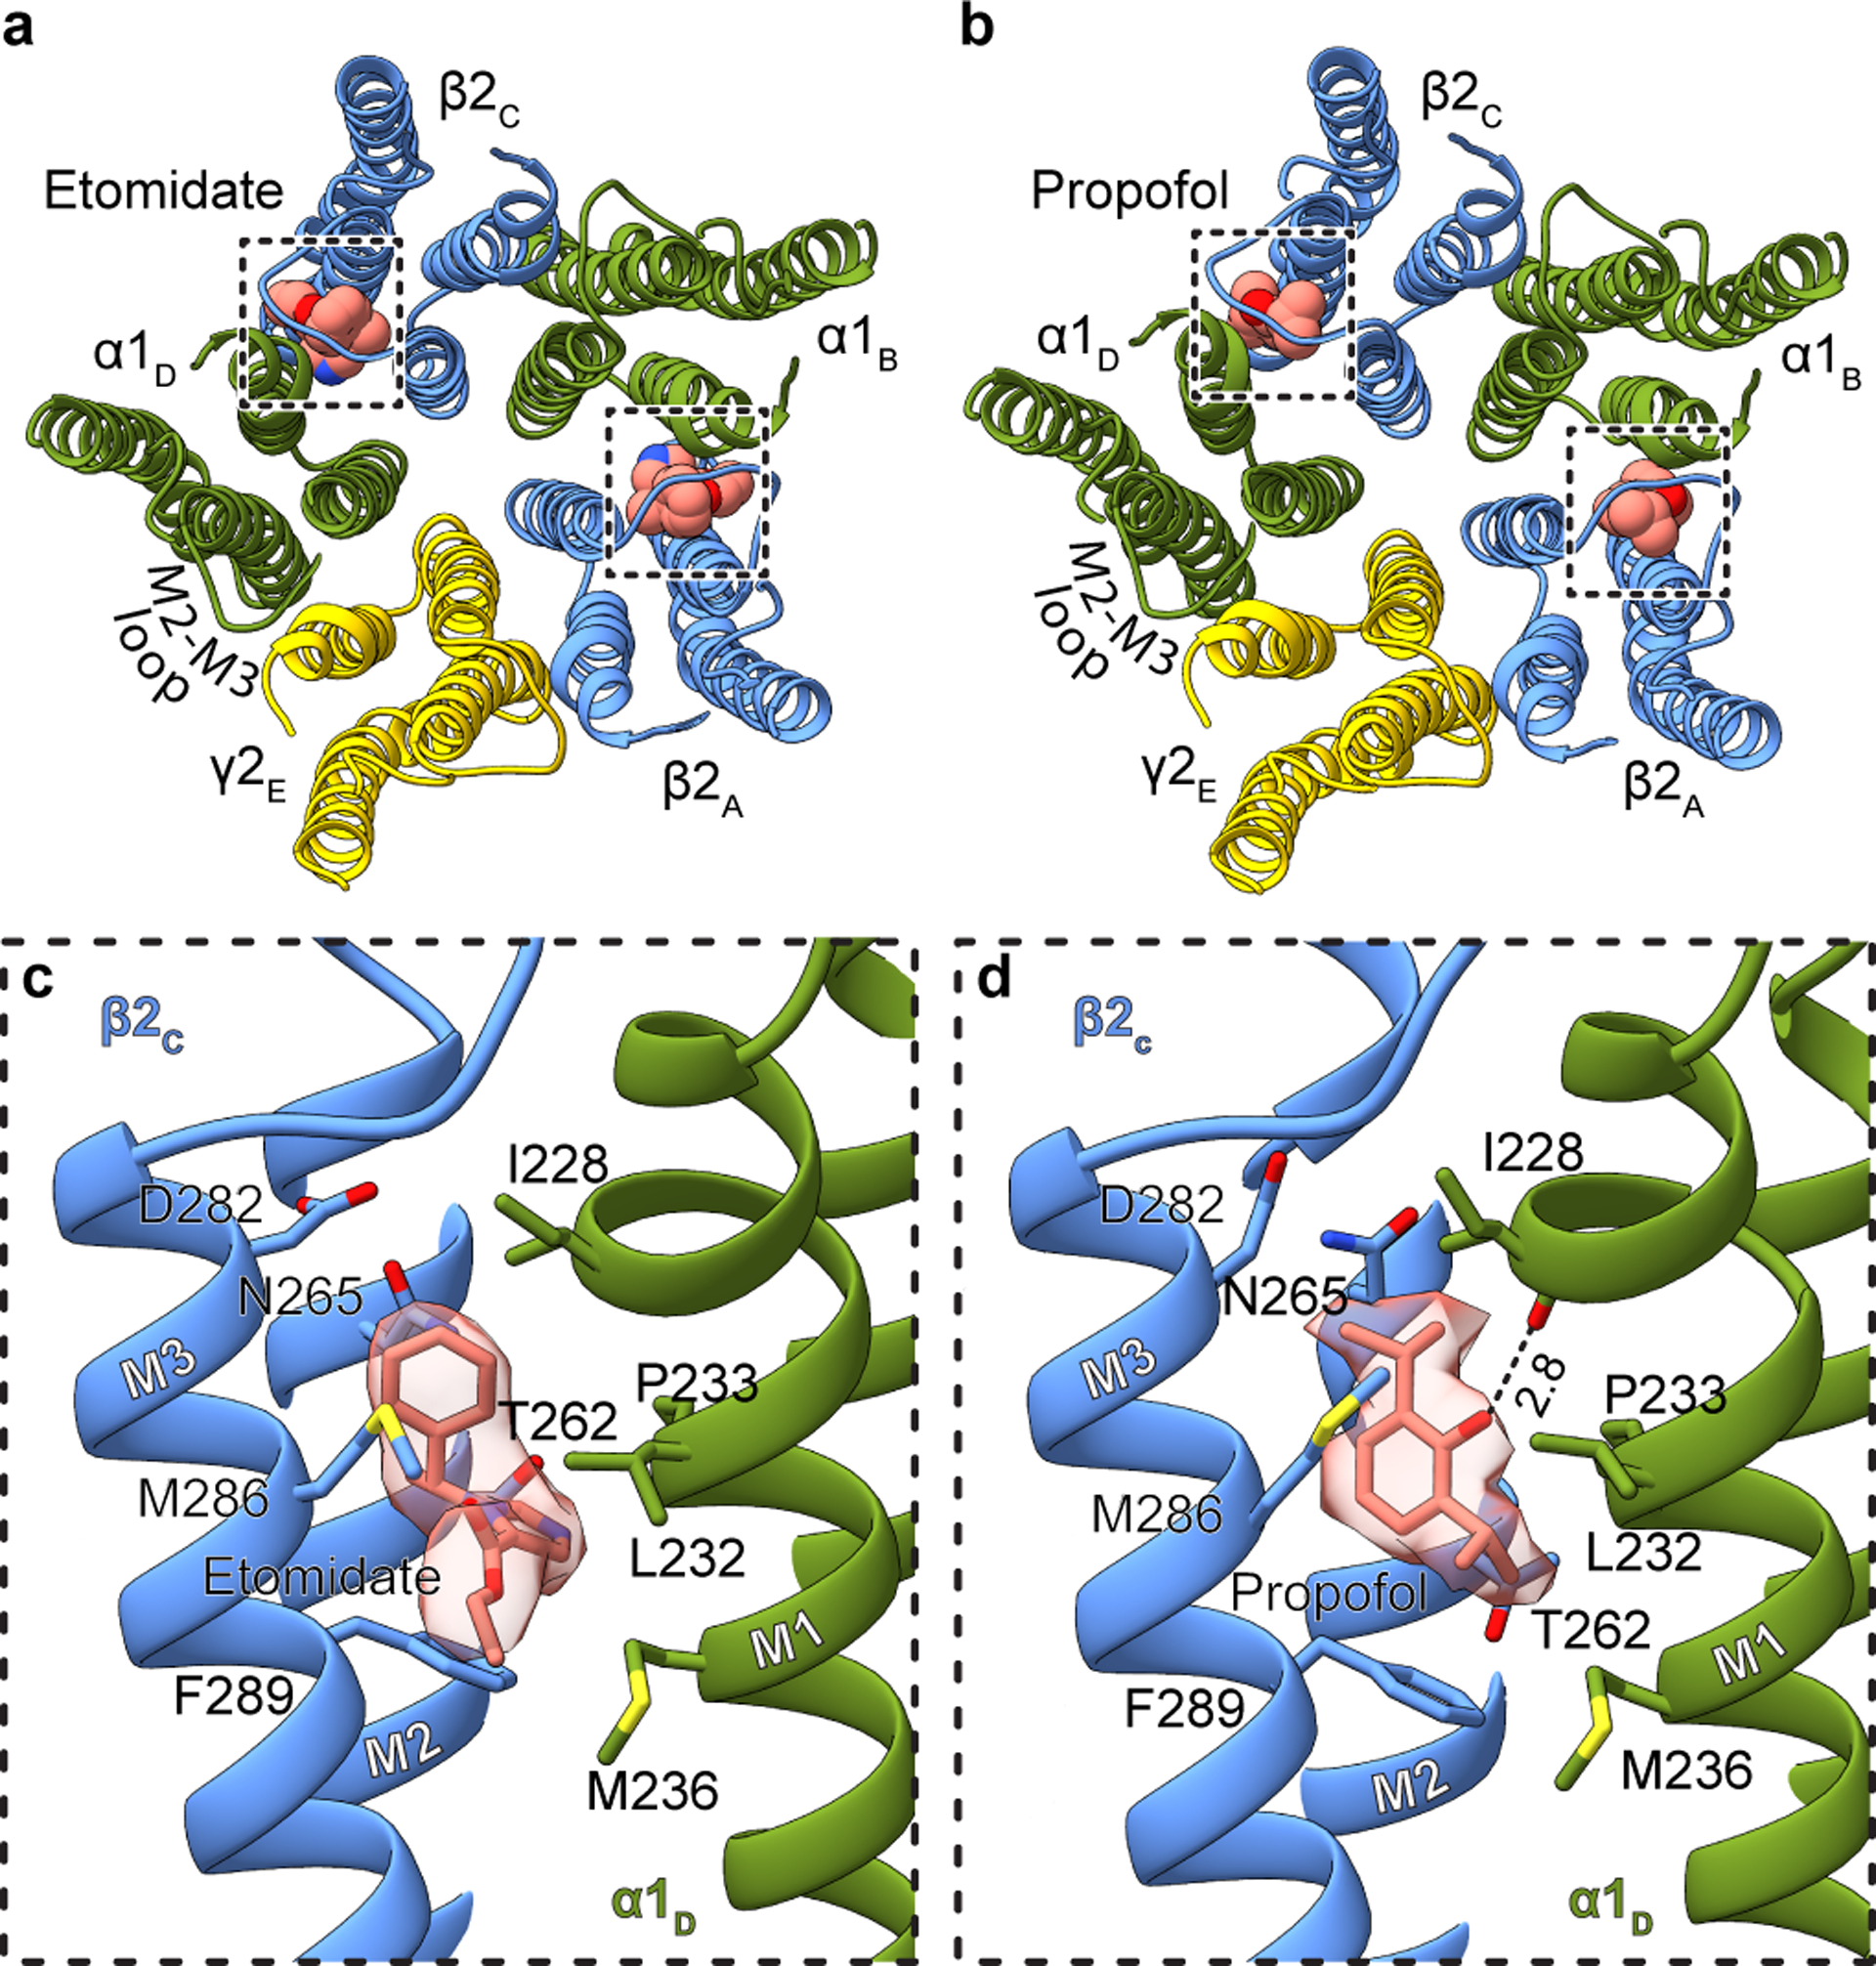
Panels a and b show atomic model overview of the TMD sites for etomidate and propofol, respectively; ligands are shown as spheres. Subunit subscripts denote chain ID. Panels c and d show binding site details for one of the two equivalent β-α sites for each ligand. Experimental density for ligands is shown as semi-transparent surface.
The notably high resolution of the GABA plus propofol complex allowed confident positioning of propofol at both β-α interfaces in a position overlapping with that of etomidate (Fig. 2d, Supplementary Video 4). Propofol is symmetric and smaller than etomidate, and makes fewer contacts with the receptor. One isopropyl group orients toward the channel axis and one toward bulk lipid; this latter hydrophobic group packs against the αP233 that creates the M1 π-helix. The channel-proximal isopropyl group orients toward the β15′ position, forming van der Waals contacts. Substitution of this residue with serine has little effect in the response of knock-in mice to propofol37, which is logical in the context of the structure; unlike for etomidate, propofol is not oriented to make electrostatic interactions with the 15′ asparagine. In contrast, knock-in mice harboring a β3 15′ methionine are insensitive to the immobilizing effects of propofol36; this long hydrophobic side chain would compete directly for propofol binding in the structure. The benzyl ring is oriented with its face parallel to the membrane normal; its hydroxyl extension, a hydrogen bond donating group known to be a determinant of propofol potency39, forms a hydrogen bond with the αI228 backbone carbonyl oxygen liberated by the M1 π-helix. βM286 reaches across the subunit interface such that it could limit or slow exchange between the bound propofol and bulk lipid; mutation of this residue to tryptophan causes a loss of propofol potentiation40, as observed for etomidate29. Simulations to assess propofol binding at the other three TMD interfaces suggests it is less stable there (Extended Data Fig. 1h). While we cannot rule out the possibility of propofol binding at additional sites41, the structural analysis, combined with mutagenesis, affinity labeling and animal studies, are consistent with high-affinity binding of both etomidate and propofol only at β-α interfaces in the TMD. Interestingly, at the α-β and α-γ interfaces, density consistent with a lipid head group occupies the propofol-equivalent position. At the two β-α interfaces, lipid density is also present, but peripheral to the site (Extended Data Fig. 5a–e).
Benzodiazepine mechanisms
We next relate the anesthetic recognition insights to a distinct class of allosteric modulators, the benzodiazepines. We obtained structures of three complexes with GABA bound to survey a range of activities: the benzodiazepine-site antagonist flumazenil (3.5 Å); an apo benzodiazepine site (3.2 Å); and the positive modulator diazepam (2.9 Å; Extended Data Figs. 2–7, Extended Data Table 2). We discuss these three structures in detail in Supplementary Information and focus here on novel findings and emergent trends. In the flumazenil complex, we found near-perfect agreement between the ECD between this structure and the same complex in detergent21 (Extended Data Fig. 6f, g). The relatively high disorder in the γ-TMD observed in all structures was most notable in the flumazenil complex, where a gap is present at the γ-β interface (Fig. 3a–f, Extended Data Fig. 2e, f). This gap shrinks in the absence of flumazenil and disappears in the presence of diazepam. In addition to the expected density for diazepam at the classical benzodiazepine site in the ECD α-γ interface (Extended Data Fig. 7a, b), we observed three distinct densities for diazepam in the transmembrane domain, two at β-α interfaces observed previously19 and a third at the γ-β interface that overlaps with one of the phenobarbital sites (Fig. 3c, Extended Data Fig. 7d–f, Supplementary Videos 7, 8). Binding of diazepam to this latter site may contribute to the overall stability of the TMD by closing the γ-β gap, similar to what was observed with the barbiturate, and may also play a role in benzodiazepine-induced potentiation through a mechanism similar to that of anesthetics15,16. In this new class of diazepam binding site at the γ-β TMD interface (Extended Data Fig. 7d, f, Supplementary Video 8), the diazepine ring pucker inverts, adopting an enantiomeric conformation (Extended Data Fig. 7g). In contrast to the β-α sites, the diazepam at the γ-β interface positions above γS280, homologous to βN265. In this pose, the pendant phenyl ring of diazepam points away from the channel axis and interacts with conserved phenylalanine (γF304) and proline (βP228) residues (Extended Data Fig. 7f, Supplementary Video 8). Consequently, the benzyl ring is located near the γM2 helix and the diazepine carbonyl oxygen forms a hydrogen bond with γT277. Investigation of the other intersubunit sites in the TMD revealed tubular density at the α-β interface, which shares sequence similarity with the γ-β site and has been proposed to be an active binding site for benzodiazepines15,16 and barbiturates23, in addition to the α-γ interface. These densities likely correspond to lipids based on MD simulations (Extended Data Fig. 5f, g; Supplementary Videos 9–10). Our structural and simulation results thus support the existence of an orphan site that does not respond to benzodiazepines or anesthetics2.
Figure 3. Benzodiazepine sites and mechanism.
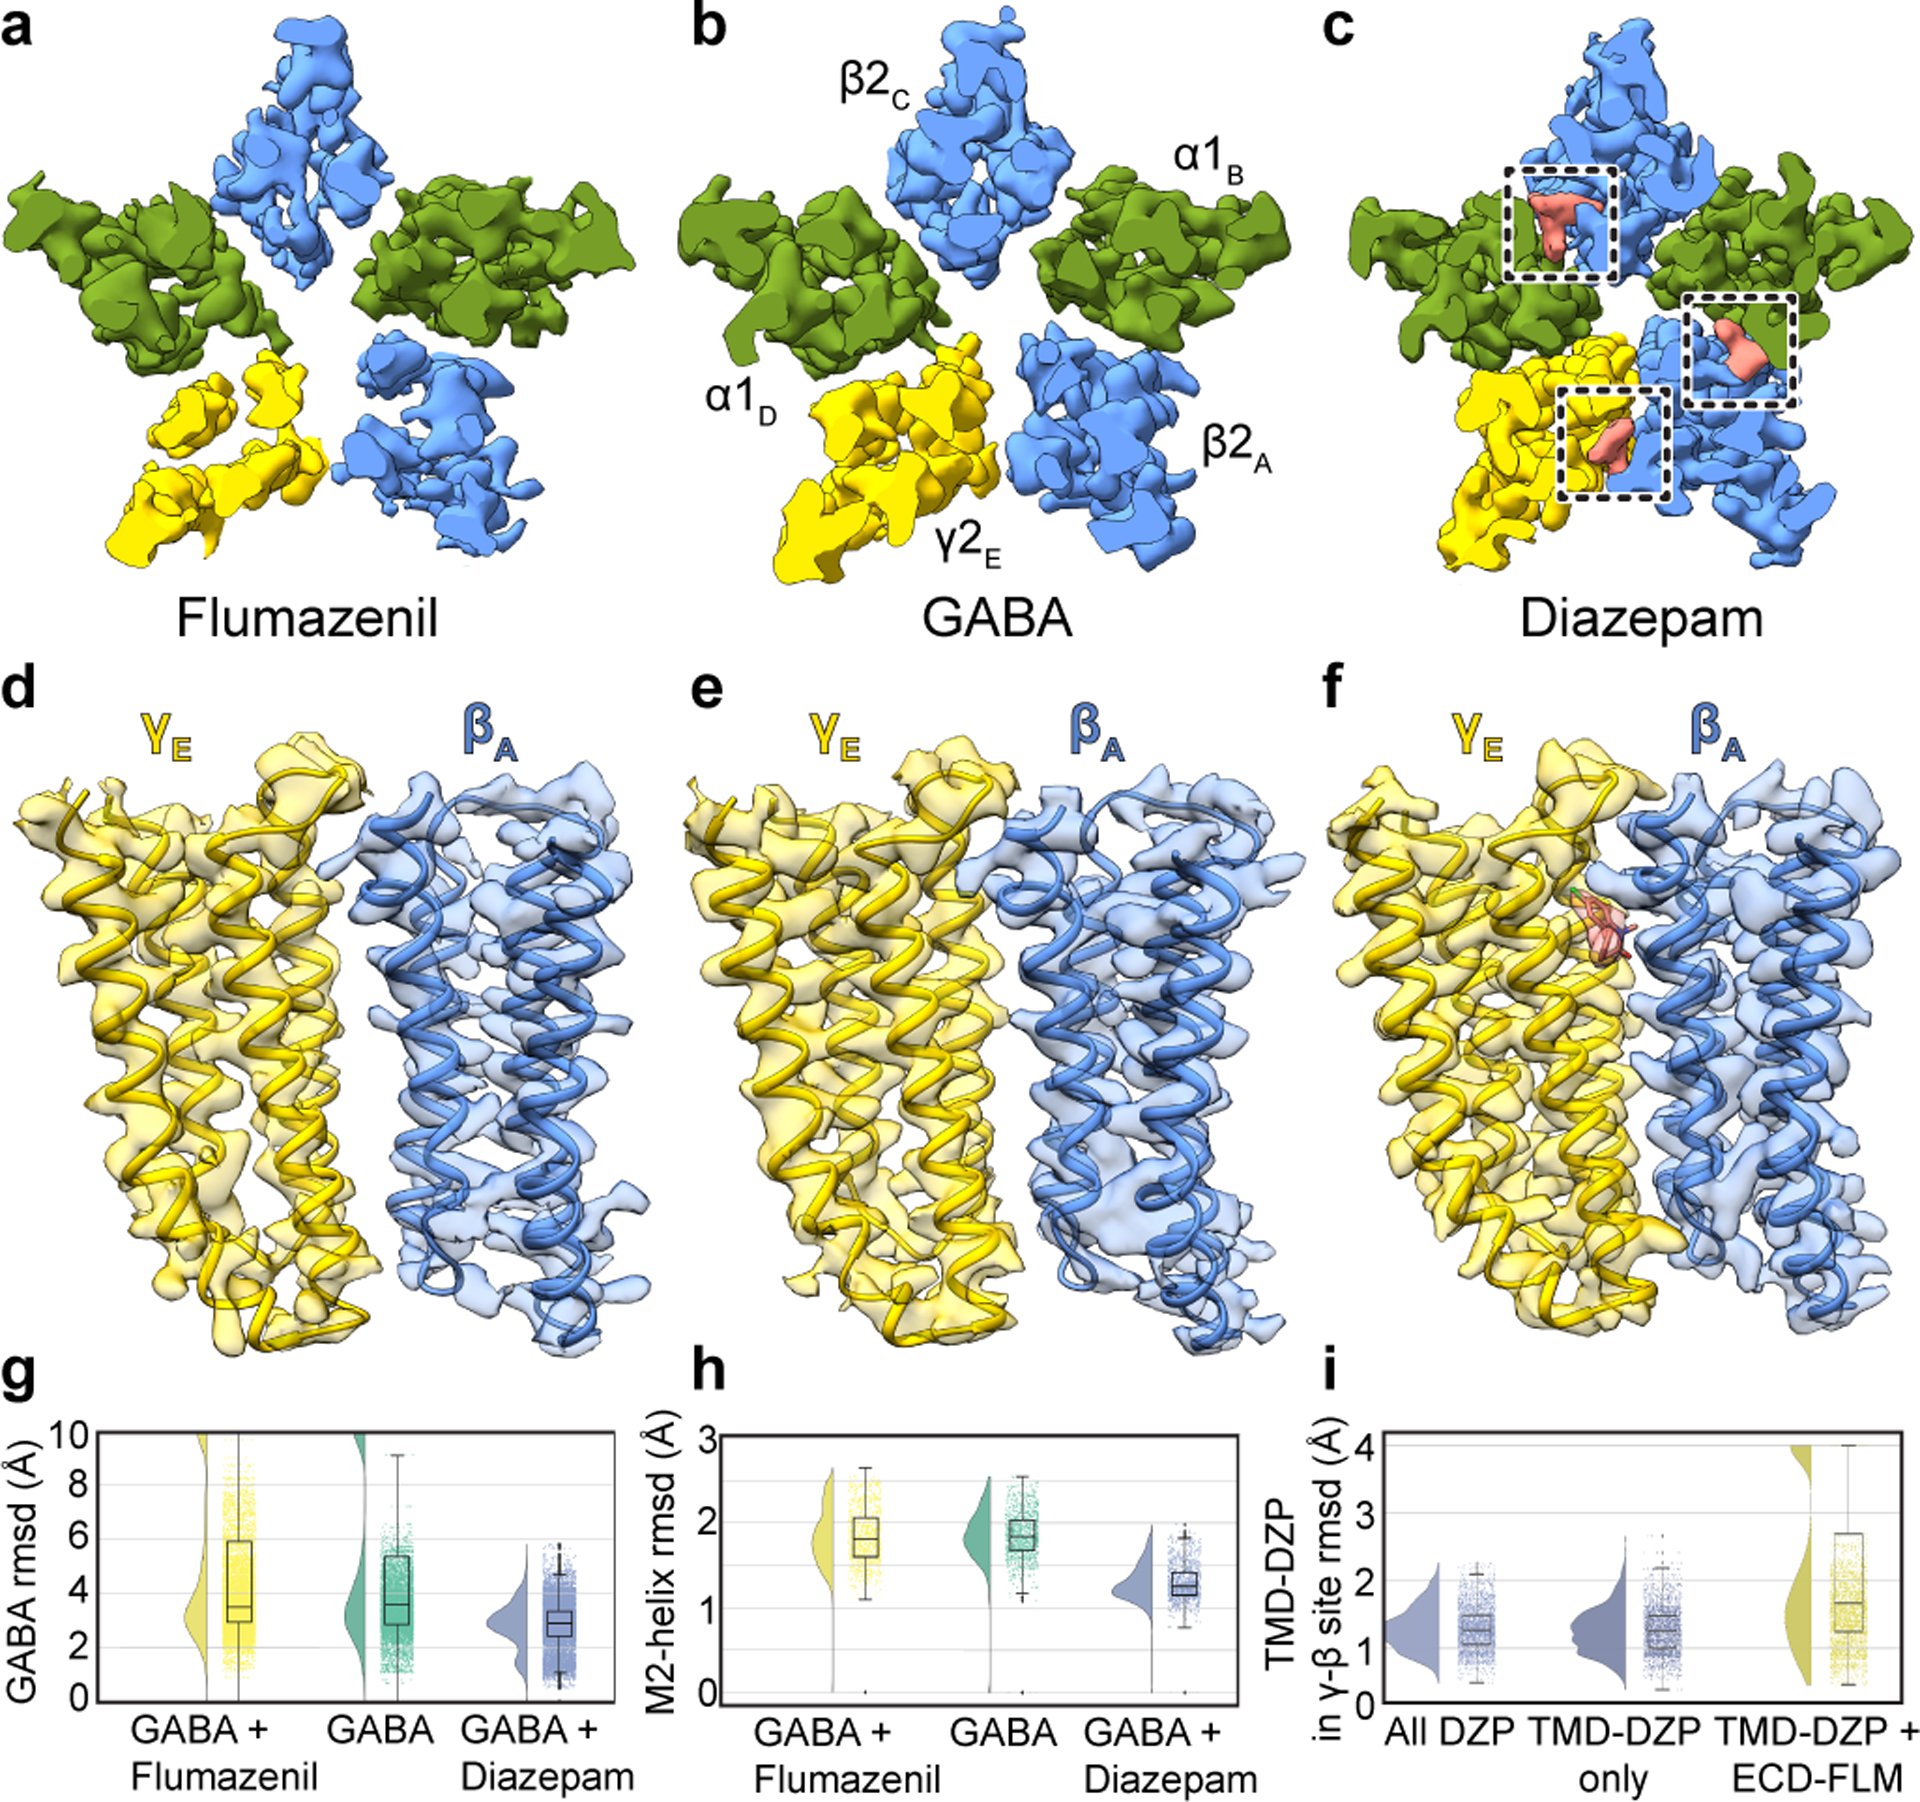
Panels a-c show z-slices in the TMD of cryo-EM density maps for the three complexes; boxes in c highlight diazepam (salmon) TMD sites. Panels d-f show map and model in TMD at the γ-β interface to illustrate large interfacial gap in flumazenil complex, smaller gap in GABA alone complex, and absence of a gap in diazepam complex. Panels g-i show stability (rmsd, Å) in benzodiazepine-related simulations, with probability distribution at left, and raw data (n = 500 samples from 4 simulations, see Methods) plus boxplots indicating median, interquartile (25th-75th percentiles) and minimum–maximum ranges at right. Panel g, diazepam-bound simulations (blue) exhibit stabilization of GABA over both orthosteric sites relative to flumazenil-bound (yellow) or GABA-alone (green) conditions. Panel h, stabilization of M2 helices in the presence of diazepam. Panel i, destabilization of the transmembrane γ-β interface in the presence of extracellular flumazenil, relative to either diazepam or no ligand at the extracellular α-γ interface.
Occupancy of four sites by diazepam results in global stabilization compared to the GABA alone complex, and especially compared to the flumazenil complex (Fig. 3a–f). Together, these three structures and the anesthetic-bound complexes display a correlation between receptor stability in the TMD and activity of the allosteric ligand. In contrast to the stabilization in the TMD observed with positive modulator complexes, flumazenil binding destabilizes the TMD and results in a slightly expanded ECD (Supplementary Video 5). In simulations of the flumazenil-bound and GABA-alone complexes, GABA frequently dissociated (Fig. 3g, Extended Data Fig. 7h); conversely, GABA remained stably bound at both its binding sites in all simulations of the diazepam-bound complex (Fig. 3g, Extended Data Fig. 7i). Diazepam additionally stabilized the TMD, as monitored in rmsd of the pore-lining M2 helices relative to complexes with GABA alone and with flumazenil (Fig. 3h). We next simulated substitution of flumazenil for diazepam at the ECD site while preserving the TMD diazepam molecules, and observed specific dissociation of diazepam from the γ-β site (Fig. 3i), consistent with our structure-based hypothesis that flumazenil binding in the ECD destabilizes this interface. Taken together, structural and dynamic analyses reveal that both benzodiazepine and anesthetic positive modulators stabilize local and global organization of the receptor.
Comparison with recent structures
The structure of the α1β2γ2 receptor in complex with GABA plus diazepam provides an opportunity for direct comparison with the α1β3γ2 receptor in complex with the same ligands19. There are important differences in the approaches used to obtain these structures, including a truncation in the M3-M4 loop used in the constructs of our studies (discussed in Extended Data Figs. 8–10 and Supplementary Information). Sequence identity between β2 and β3 is 92% when the disordered intracellular domain is not considered. Consistencies lend confidence to the results and differences may have important consequences for physiology or model interpretation. Overall, the functional profiles (Extended Data Fig. 11) and the structures agree well in architectural details, including pose and interactions of the ligands (Extended Data Fig. 8a–b), except as noted in the distinct TMD binding site for diazepam. Global comparisons reveal that the TMD of the α1β3γ2 receptor is more compact and its pore is more constricted (Extended Data Fig. 9a–c). We sought additional reference points for direct comparison and obtained cryo-EM structures of the α1β2γ2 receptor in complex with the competitive antagonist bicuculline (methylated form) at 3.1 Å, and with GABA plus the channel blocker picrotoxin at 2.9 Å resolution (Extended Data Figs. 3–4,6, 8, Extended Data Tables 1–2, Supplementary Information). We observed the same trend in pore constriction in these structures as compared to the α1β3γ2 structures, wherein the top of the pore in our structures is consistently wider (Extended Data Fig. 9d–i).
Extending the comparison to other members of the Cys-loop receptor superfamily, the α1β3γ2 receptor structures have more surface area buried at subunit interfaces than any other structures in the anion-selective branch (Extended Data Fig. 9j). Examination of low-pass filtered maps reveals a smaller nanodisc diameter for the α1β3γ2 structures (90–93 Å) compared to the α1β2γ2 structures (107–109 Å, Extended Data Fig. 10a–c). This finding was surprising, as the scaffold employed for the former, MSP2N2, was used intentionally for its large diameter of ~150–165 Å42, but in the α1β3γ2 maps, it wraps tightly around the TMD structure. Differences in reconstitution may underlie the discrepancy: the on-column reconstitution approach used in the α1β3γ2 studies18,19 removes excess lipids, while still in detergent, before adding the nanodisc scaffold. As detergent is removed, the scaffold could condense around the TMD. In contrast, in an effort to better mimic a bona fide membrane, we included excess lipids throughout purification and reconstitution (Methods, Extended Data Fig. 10d). The result is a layer of lipids insulating the α1β2γ2 receptor from the saposin shell, and more flexibility and a wider pore in the TMD. The differences are relatively subtle but systematic, and may help explain why the pore conformation of the α1β3γ2 structures in the presence of picrotoxin +/− GABA, and vs. bicuculline, are essentially identical19, unlike the two distinct conformations we observe (Supplementary Information Figs. 2–4 and Supplementary Discussion). We suggest that delipidation during α1β3γ2 GABAA receptor reconstitution constrained the TMD and obscured the full range of conformational changes.
Conformational state and anesthetic selectivity
The pores of all six agonist and agonist plus modulator structures adopt desensitized conformations, with a closed gate at the base of the pore at the level of the −2′ side chains (Extended Data Fig. 8g), consistent with expectations from steady-state physiological responses. Interestingly, all IV anesthetic-bound structures show an increase in channel diameter at the 9′ position relative to GABA alone. This pore expansion at its midpoint results from rotation of the 9′ Leu sidechains away from the central axis, toward the adjacent subunit, resulting in a decrease in the free-energy barrier to chloride permeation (Extended Data Fig. 8h). This rotation is a hallmark of activation43, suggesting that the potentiation mechanism of IV anesthetics may include stabilizing the 9′ activation gate in an open-like state (Extended Data Fig. 8g).
The pore conformations in the presence of GABA plus picrotoxin, and the competitive antagonist bicuculline, contrast with these desensitized states. Bicuculline stabilizes a closed, resting-like state of the pore, with a gate at the 9′ position (Extended Data Fig. 8g), similar to that observed in the α1β3γ2 structure19; relative to GABA complexes, this structure is less hydrated above the hydrophobic gate in MD simulations (Supplementary Fig. 2a). Picrotoxin, in the presence of GABA, stabilizes what we suggest is an intermediate state between desensitized and resting, where the ECD adopts a compact agonist-bound conformation while the TMD adopts a more resting-like conformation with the 9′ gate partially closed. Electrophysiology results are consistent with this structural interpretation, as are comparisons of buried surface areas at interfaces (Supplementary Fig. 3, Extended Data Fig. 9k), and published observations that picrotoxin readily dissociates from the agonist-bound receptor44. Simulations of the picrotoxin-bound structure also demonstrated a similar extent of hydration above the hydrophobic gate as in other GABA complexes, greater than in the bicuculline complex (Supplementary Fig. 2a). Furthermore, principal component analysis (PCA) of TMD transitions project the picrotoxin-bound structure along a path from GABA- to bicuculline-bound states (Extended Data Fig. 8i, Supplementary Fig. 2b); PCA within the ECD clustered the picrotoxin complex with GABA-alone (Supplementary Fig. 2c). Thus, structural, functional and simulation results are consistent with picrotoxin, in the presence of GABA, binding to a receptor with a desensitized- or activated-like ECD conformation, and an intermediate TMD conformation, from which it can dissociate more readily than it could from a simple resting state.
While the funnel shape of the TMD pore is similar among the GABA and modulator-bound structures, we observed modulator-induced asymmetric motions that correlate with the specific site(s) occupied by a specific ligand. These subunit transformations are complex and include translations and rotations, with all rotations counter-clockwise about an axis approximately normal to the membrane plane and through varying positions of each subunit. The transformations result in opening or closing of access to the anesthetic TMD pockets (Fig. 4; curved arrows approximate trend in transformation). In the GABA alone structure, all 5 interfacial sites are open. Flumazenil binding has little overall effect, but through destabilizing the γ-β interface closes the β-α TMD pocket where diazepam, etomidate and propofol bind, providing a compelling long-range allosteric mechanism for anesthetic reversal upon clinical administration of flumazenil45,46. Diazepam, through binding at one ECD site and three TMD sites, promotes global rotation of the TMD halves of all subunits, most noticeably in the β2 subunits, which results in closure of the α-β interface pocket. Phenobarbital causes a less dramatic but more symmetric rotation of all subunits via binding at the γ-β and α-β interfaces. Etomidate and propofol bind at common β-α sites; etomidate closes both γ-β and α-β access points while binding of the smaller propofol does not affect access to other sites. Notably, all potentiator-bound structures (phenobarbital, etomidate, propofol and diazepam) clustered in a region along the dominant principal components of motion for the TMD distinct from complexes with inhibitors (bicuculline or picrotoxin), flumazenil, or GABA alone (Extended Data Fig. 8i, Supplementary Fig. 2b).
Figure 4: Anesthetic cavity selectivity and conformation.
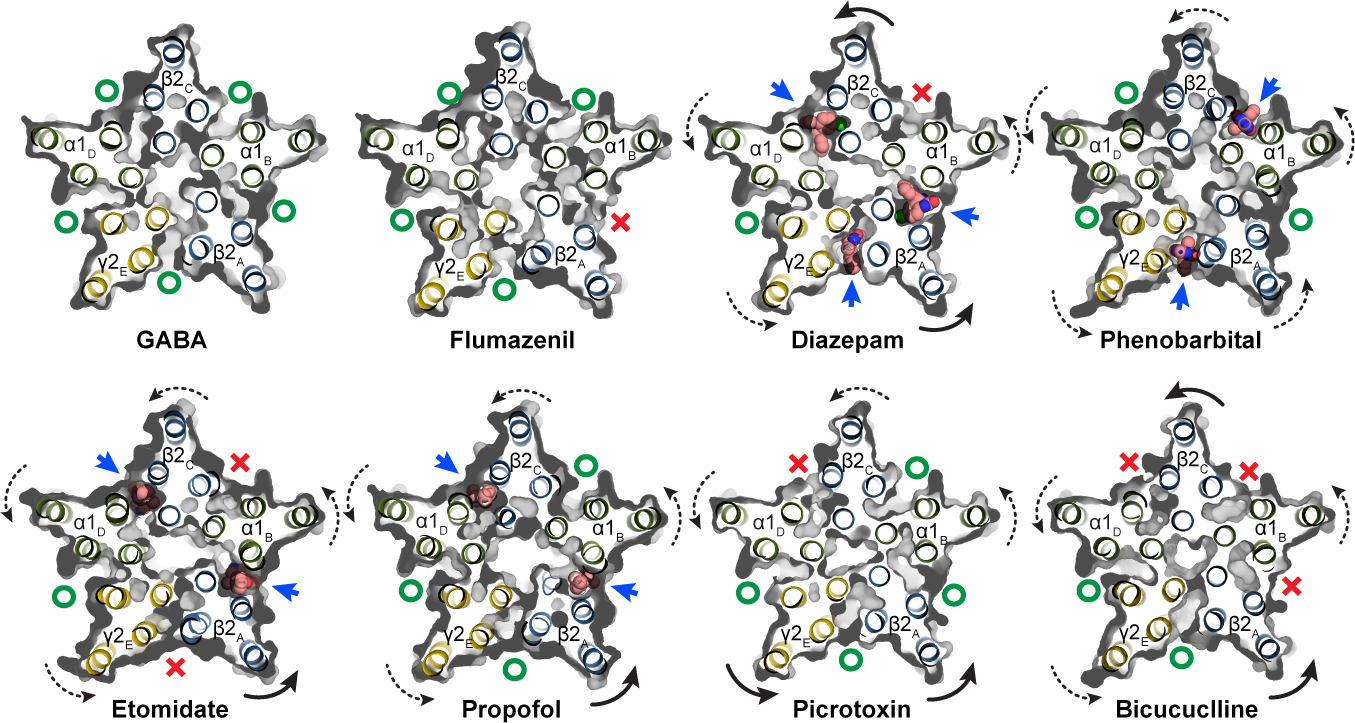
Models and molecular surfaces are shown from a perspective down the channel axis, at the level of the TMD binding sites identified for diazepam, phenobarbital, etomidate and propofol. Straight arrows indicate occupied binding sites with ligands shown as spheres. Curved arrows indicate rigid body subunit transformations relative to the GABA alone structure (dashed lines are minor; solid lines are major rotations/translations). Green “O’s” indicate open or partially open cavities; red “X’s” indicate closed-off cavities.
Picrotoxin binding results in occlusion of a single β-α interface, while bicuculline binding closes both β-α interfaces as well as the α-β site, further emphasizing the conformational state distinction between the picrotoxin and bicuculline complexes. Bicuculline, in addition to a rotation in the TMD halves of the subunits, promotes a compression of the TMD structure that brings the 9′ leucine side chains into position to block ion permeation, and creates the most compact TMD structure among all the structures (Extended Data Figs. 8g, 9k). Bicuculline binding allosterically closes three of the anesthetic pockets, including the α-β interface, consistent with its partial antagonism of activation by phenobarbital47. A striking observation is that one pocket, at the α-γ interface, is always open. We see density consistent with a lipid at this position (Extended Data Fig. 5a, b, f, g), which may relate to why this pocket cannot be closed, and why at least among the panel of ligands we surveyed, none bind there. A speculative hypothesis is that a lipid plays the role of an endogenous modulator or cofactor at this site.
Taken together, this panel of structures illustrates the complex interplay between binding of diverse modulators and conformational transitions. The observation of distinct, asymmetric structural differences arising from binding of each ligand mirrors results from cysteine accessibility, disulfide crosslinking and electrophysiology studies that uncovered functional asymmetry in structural transitions22,33,48,49. The structural and dynamic stabilization that emerge from anesthetic and benzodiazepine positive modulators contrasts with the destabilization in particular at the γ-β interface observed from flumazenil binding. The finding that flumazenil binding destabilizes the receptor TMD suggests a long-range allosteric mechanism for benzodiazepine and anesthetic reversal by flumazenil.
Methods
Receptor expression and purification.
A tri-cistronic construct of the human α1β2γ2 GABAA receptor, with the three genes linked by a 22 amino acid long P2A “self-cleaving” peptide58, was designed, codon optimized, synthesized and cloned into the pEZT-BM expression vector to enhance the expression of the tri-heteromeric receptor59. Both a full-length wild-type and M3-M4 loop truncation construct were made in this tri-cistronic format. In the construct used for EM, for each subunit, the M3-M4 loop of the three subunits was replaced by a linker peptide, SQPARAA, as in our previous study21. The order of the subunits in the expression construct was β2-γ2-α1, with a twin strep tag placed at the N-terminus of the γ2 subunit for purification. Bacmam virus was produced using Sf9 cells (ATCC CRL-1711) and titered as described for the α4β2 nicotinic receptor59. Suspension cultures of HEK293S GnTI− cells (ATCC CRL-3022) were grown at 37°C with 8% CO2 and were transduced with multiplicities of infection of 0.5 at a cell density of 3.5 – 4.0 × 10⁶ cells/ml. The HEK and Sf9 cells lines were not authenticated nor were they tested for mycoplasma. At the time of transduction, 1 mM sodium butyrate (Sigma-Aldrich) was added to the culture and temperature was reduced to 30 °C to enhance protein expression. After 72 hr, cells were collected by centrifugation and resuspended in 20 mM Tris, pH 7.4, 150 mM NaCl (TBS buffer) containing 1 mM phenylmethanesulfonyl fluoride (PMSF; Sigma-Aldrich) and the target ligands (2mM GABA; 1 μM flumazenil (Santa Cruz Biotechnology) + 2 mM GABA; 200 μM diazepam (Sigma-Aldrich) + 2 mM GABA; 2 mM phenobarbital (Sigma-Aldrich) + 2 mM GABA; 500 μM etomidate (Tocris) + 2 mM GABA; 100 μM propofol (Sigma-Aldrich) + 2 mM GABA; 50 μM bicuculline methbromide (Sigma-Aldrich); 100 μM picrotoxin (Sigma-Aldrich) + 2 mM GABA) for the intended complex, and lysed using an Avestin Emulsiflex. Lysed cells were centrifuged for 20 min at 10,000g and the resulting supernatants were centrifuged at 186,000g for 2 h. Membrane pellets were homogenized using a Dounce homogenizer and solubilized in TBS buffer containing 40 mM n-dodecyl-β-maltoside (DDM, Anatrace) and 1 mM PMSF and ligands. Solubilized membranes were centrifuged for 40 min at 186,000 g and the supernatants were passed over Strep-Tactin XT Superflow affinity resin (IBA-GmbH). The resin was washed with TBS buffer containing 0.01 % (w/v) porcine brain polar lipids (Avanti), 2 mM DDM, and ligands. The receptors were eluted in the same buffer containing 50 mM biotin (Sigma-Aldrich).
Receptor-nanodisc reconstitution.
The saposin A expression plasmid was provided by Salipro Biotech AB. We selected saposin over other nanodisc scaffolds based on its ability to accommodate a range of membrane protein sizes and preserve an approximately symmetric TMD conformation (Extended Data Fig. 1a–e). Reconstitution of GABAA receptors into saposin-based nanodiscs was modified from the protocol in Lyons et al.60 (Extended Data Fig. 9D). The concentrated α1β2γ2 receptors (~15 μM) were pre-incubated with porcine brain polar lipids for 10 min at room temperature, and then saposin was added and incubated for 2 min. The molar ratio of receptor, lipids and saposin was 1:230:30. The reaction was diluted ~10-fold by TBS to initiate reconstitution. Detergent was removed by adding Bio-Beads SM-2 (Bio-Rad) to a final concentration of 200 mg/ml while rotating overnight at 4 °C. Bio-Beads were removed the next day, and the sample was collected for size exclusion chromatography.
Cryo-EM sample preparation.
The α1β2γ2 receptors reconstituted in nanodiscs were mixed with 1F4 Fab21 in a 3:1 (w/w) ratio. After incubating for 15 min, the mixture was concentrated and injected over a Superose 6 Increase 10/300 GL column (GE Healthcare) equilibrated in TBS with ligands (2 mM GABA; 1 μM flumazenil + 2 mM GABA; 200 μM diazepam + 2 mM GABA; 2 mM phenobarbital + 2 mM GABA; 500 μM etomidate + 2 mM GABA; 100 μM propofol + 2 mM GABA; 100 μM picrotoxin + 2 mM GABA; 50 μM bicuculline methbromide). Peak fractions were analyzed by fluorescence-detection size exclusion chromatography (FSEC), monitoring tryptophan fluorescence. Fractions showing a single peak were collected and concentrated to an A280 of 7–9. During sample concentration, the buffer for the propofol sample was changed to TBS with 2 mM GABA and 1 mM propofol. Immediately prior to freezing grids, 0.5 mM fluorinated Fos-Choline-8 (Anatrace) was mixed with the sample to minimize preferred orientation. 3 μL of sample was applied to glow-discharged gold R1.2/1.3 200 mesh holey carbon grids (Quantifoil) and immediately blotted for 3 s at 100% humidity and 4°C. The grids were then plunge-frozen into liquid ethane using a Vitrobot Mark IV (FEI).
Cryo-EM data collection and processing.
Cryo-EM data were collected on a 300 kV Titan Krios Microscope (FEI) equipped with a K2 Summit or a K3 direct electron detector (Gatan) and a GIF quantum energy filter (20 eV) (Gatan) using super-resolution mode. Details of all datasets are summarized in Extended Data Tables 1–2. All datasets were processed using the same general workflow in RELION 3.0 or 3.161. Dose-fractionated images were gain normalized, 2 x Fourier binned, aligned, dose-weighted and summed using MotionCor262. Contrast transfer function (CTF) and defocus value estimation were done using GCTF63 or CTFFIND464. Particle picking for the three data sets collected at the HMS facility were carried out using crYOLO65. For the five data sets collected at the UTSW and PNCC facilities, ~50 particles were picked manually and subjected to reference-free 2D classification to generate initial references for autopicking in Relion. These references were then used for autopicking from a subset of 30–50 images, and then 2D classification was repeated to obtain good references for autopicking on all images. After autopicking, images were inspected, and bad images and false-positive particles were removed manually and by particle sorting. Ab initio models were generated using 3,000–5,000 good particles in RELION, and then were used for 3D classification. 3D classes with strong TMD signal were selected for 3D refinement. The best 3D class was used for an initial model (low-pass filtered to 40 or 50 Å) for 3D refinement. Per-particle CTF refinement and beam tilt estimation were performed and a second round of refinement was followed with fine local angular sampling using the map from the first refinement as the initial model, which was low-pass filtered to 10 Å. Because we observed a high level of disorder in the TMD of the γ-subunit in all 8 data sets, focused 3D classification without alignment66 was performed on the γ-TMD after subtracting the signal from the rest of the receptor and nanodisc. Particles from the best classes were selected for particle polishing and an additional round of 3D refinement to generate the final maps. Local resolution was estimated with ResMap67.
Model building, refinement and validation.
An initial model was generated by combining the ECD of the heteropentameric GABAA receptor – Fab complex bound to GABA + flumazenil (RCSB: 6D6U)21 and the TMD of a homology model generated by Swiss-Model68 based on the β3 homopentamer structure (RCSB: 4COF)69. This model was docked into the density map using UCSF-chimera70. The model was manually adjusted, and flumazenil was removed, in Coot71. To build models of the different complexes, the GABA-bound structure was first built and then used as a starting model. Well-ordered N-linked glycans were built within the vestibule and along the surface of the ECD. In GABA, GABA + diazepam, GABA + etomidate, GABA + propofol and bicuculline complexes, an additional branch of mannose densities was found in chain B and built de novo. After manual building in Coot, global real space and B-factor refinement with stereochemistry restraints were done in Phenix72. The map-model FSC value between the final model and the map was estimated by Phenix and plotted in Extended Data Fig 3. In Extended Data Tables 1–2 we list fraction of particles used in the final fraction relative to those that emerge from 2D classification. We found a correlation between this percentage and relative order in the γ2-TMD. The GABA + flumazenil reconstruction was produced from only 8% of the particles selected after 2D classification, indicating a high degree of intrinsic flexibility in the γ-TMD. In the GABA alone complex, the fraction was 16%. For the diazepam complex, 36% of the particles after 2D classification had a well-ordered γ2-TMD, similar to that from the phenobarbital complex, providing a measure of the increase in stability in the diazepam complex relative to both flumazenil and GABA alone.
Schematic interaction analysis of the bound ligands was performed using Ligplot+73. Subunit interfaces were analyzed by PDBePISA server74. Pore radius profiles were analyzed using Hole275. Sequence alignments were made using PROMALS3D76. Structural figures were generated by UCSF-Chimera and Pymol (Schrodinger, LLC). Structural biology software packages were compiled by SBGrid77.
Electrophysiology.
Whole cell voltage-clamp recordings were made from adherent HEK293S GnTI− cells transiently transfected with the tri-cistronic pEZT construct used for structural analysis. Upon transfection with 0.2 – 0.5 μg of the plasmid per well in a 12-well dish, the cells were moved to 30°C. On the day of recording (1–3 days later), cells were re-plated onto a 35 mm dish and washed with bath solution, which contained (in mM): 140 NaCl, 2.4 KCl, 4 MgCl2, 4 CaCl2, 10 HEPES pH 7.3, and 10 glucose. Borosilicate pipettes were pulled and polished to an initial resistance of 2–4 MΩ. The pipette solution contained (in mM): 150 CsCl, 10 NaCl, 10 EGTA, and 20 HEPES pH 7.3. Cells were clamped at −75 mV. The recordings were made with an Axopatch 200B amplifier, sampled at 5 kHz, and low-pass filtered at 2 kHz using a Digidata 1440A (Molecular Devices) and analyzed with pClamp 10 software (Molecular Devices). The ligand solutions were prepared in bath solution from concentrated stocks (1 M GABA and 500 mM phenobarbital stocks were prepared in water and 100 mM stocks of bicuculline, diazepam, picrotoxin, etomidate, and 10 mM stock of flumazenil were prepared in DMSO. Solution exchange was achieved using a gravity driven RSC-200 rapid solution changer (Bio-Logic). In phenobarbital potentiation experiments with mutants (in Fig. 1b), responses are from 5 μM GABA compared to 5 μM GABA plus 500 μM phenobarbital. Peak currents were measured using HEK293S GnTI− expressing WT or mutant receptors. The experiments were repeated for at least 3 times from three different cells. Statistical analyses were performed using Prism v8 (GraphPad). To quantify differences in peak currents between EM and mutant constructs, mean and standard deviations were calculated from more than three independent patches for each group. An unpaired two-tailed Student’s t-test was used for single comparisons between wild-type and mutant groups. * and ** denote statistical significance corresponding to p-values of < 0.01 and < 0.0001, respectively.
Coarse-grained simulations.
Atomic coordinates for the α1β2γ2 receptor with the intracellular domain modification in complex with GABA plus phenobarbital were coarse-grained, through the representation of ~4 heavy atoms as a single bead, using Martini Bilayer Maker in CHARMM-GUI78. Ligands and glycans were omitted, and the protein was embedded in a symmetric membrane containing 40% cholesterol, 20% 1-palmitoyl-2-oleoyl-sn-glycero-3-phosphocholine (POPC), 20% POPE, 9% POPS, and 1% PIP2, previously shown to approximate the neuronal plasma membrane24. In total, 4,437 lipids were inserted in the simulation system, constituting 313,112 total beads including water and ions. After energy minimization and equilibration in CHARMM-GUI, simulations were run with the protein restrained for 25 μs in GROMACS 2019.479 to allow lipid convergence, using Martini 2.2 and 2.0 parameters53 for amino acids and lipids, respectively. Five replicates were performed from different initial lipid compositions generated in CHARMM-GUI. For comparison, an additional simulation of the receptor in complex with bicuculline was performed. All simulations relaxed within 20 μs to equivalent patterns of lipid association around the receptor, including local enrichment of PIP2 and cholesterol at transmembrane subunit interfaces.
MD simulations.
The final frame from a randomly selected coarse-grained simulation was selected for backmapping to an all-atom system, including all PIP2 molecules observed to bind persistently in more than 2 replicates. The lipid bilayer was backmapped into CHARMM36 topologies80, then placed around each protein model reported in this work, and trimmed to a box size of 14 × 14 × 16 nm. The system was solvated and neutralized in ~150 mM NaCl. All atomistic simulations were performed using GROMACS 2019.4 in the CHARMM36 forcefield81. Simulations included resolved GABA or modulatory ligands except as indicated. For flumazenil-substitution simulations, flumazenil was superimposed from the flumazenil-bound structure in place of extracellular diazepam in the diazepam-bound structure; for propofol-saturation simulations in Extended Data Figure 1, propofol was superimposed at the α-γ, γ-β, and α-β interfaces based on pseudo-symmetric poses at β-α interfaces in the propofol-bound structure. Parameters for ligand molecules were generated with CGenFF in CHARMM‐GUI78, with additional optimization using quantum mechanics for ligands with high penalty scores82. Each system was energy-minimized and then relaxed with a constant number of particles, pressure, and temperature for at least 60 ns, during which the position restraints on the protein were gradually released. All ligands were restrained during equilibration. For each equilibrated system, four replicates of 500-ns unrestrained simulations were then generated and frames analyzed every 4 ns, for a total of 500 samples in each condition (four replicates x 125 frames). Temperature was kept at 300 K using a velocity-rescaling thermostat83, Parrinello-Rahman pressure coupling84 ensured constant pressure, the particle mesh Ewald algorithm57 was used for long-range electrostatic interactions, and H-bond lengths were constrained using the LINCS algorithm85. Analyses were performed using VMD86, MDAnalysis87, and MDTraj88. Simulation properties were represented using raincloud plots (doi: 10.12688/wellcomeopenres.15191.1), e.g. Fig. 3g–i, Extended Data Fig. 1h and Supplementary Fig. 2a showing unmirrored probability distribution functions at left, and jittered raw data with superimposed boxplots indicating sample median, interquartile range (25th–75th percentiles), minimum–maximum range, and outliers at right.
Principal component analysis.
Protein models in complex with GABA, bicuculline, GABA + etomidate, GABA + phenobarbital, and GABA + propofol were rmsd-aligned using all Cα atoms, then used to calculate principal components (PC) of motion in Cartesian coordinate space for Cα atoms of the TMD (residues equivalent to β2–218 to 338) or ECD (β2–10 to 217) in all subunits. Subsequently, all protein models reported in this work (n = 8 independent structures) were projected onto the PC1–2 subspaces for the two domains. Elastic-network interpolations between the bicuculline and GABA complexes were performed using eBDIMS89 with cutoff=6, mode=3, and 1 unbiased step, then projected onto the principal component subspaces.
Ion permeation calculations.
The free energy along the pore axis for chloride was calculated using the accelerated weight histogram (AWH) method90. Briefly, for each equilibrated structure (complexes with GABA, bicuculline, GABA + phenobarbital, or GABA + propofol) we applied one independent AWH bias, and simulated for 50 ns each with 16 walkers sharing bias data and contributing to the same target distribution. Each bias acts on the center-of-mass z-distance between one central chloride ion and the Cα of β−270, α−275, and γ−285 residues, with a sampling interval across more than 95% of the box length along the z axis to reach periodicity. To keep the solute close to the pore entrance, the coordinate radial distance was restrained to stay below 10 Å by adding a flat-bottom umbrella potential.
Data availability:
Atomic model coordinates for bicuculline methbromide, GABA + propofol, GABA + flumazenil, GABA + etomidate, GABA + phenobarbital, GABA + diazepam, GABA, and GABA + picrotoxin–bound structures have been deposited in the Protein Data Bank with accession codes 6X3S, 6X3T, 6X3U, 6X3V, 6X3W, 6X3X, 6X3Z and 6X40, respectively, and the cryo-EM density maps have been deposited in the Electron Microscopy Data Bank with accession codes EMD-22031, EMD-22032, EMD-22033, EMD-22034, EMD-22035, EMD-22036, EMD-22037 and EMD-22038, respectively.
Supplementary Material
Extended Data
Extended Data Figure 1: Biochemistry, sample condition screening, and stability of atomistic MD simulations in brain lipids.
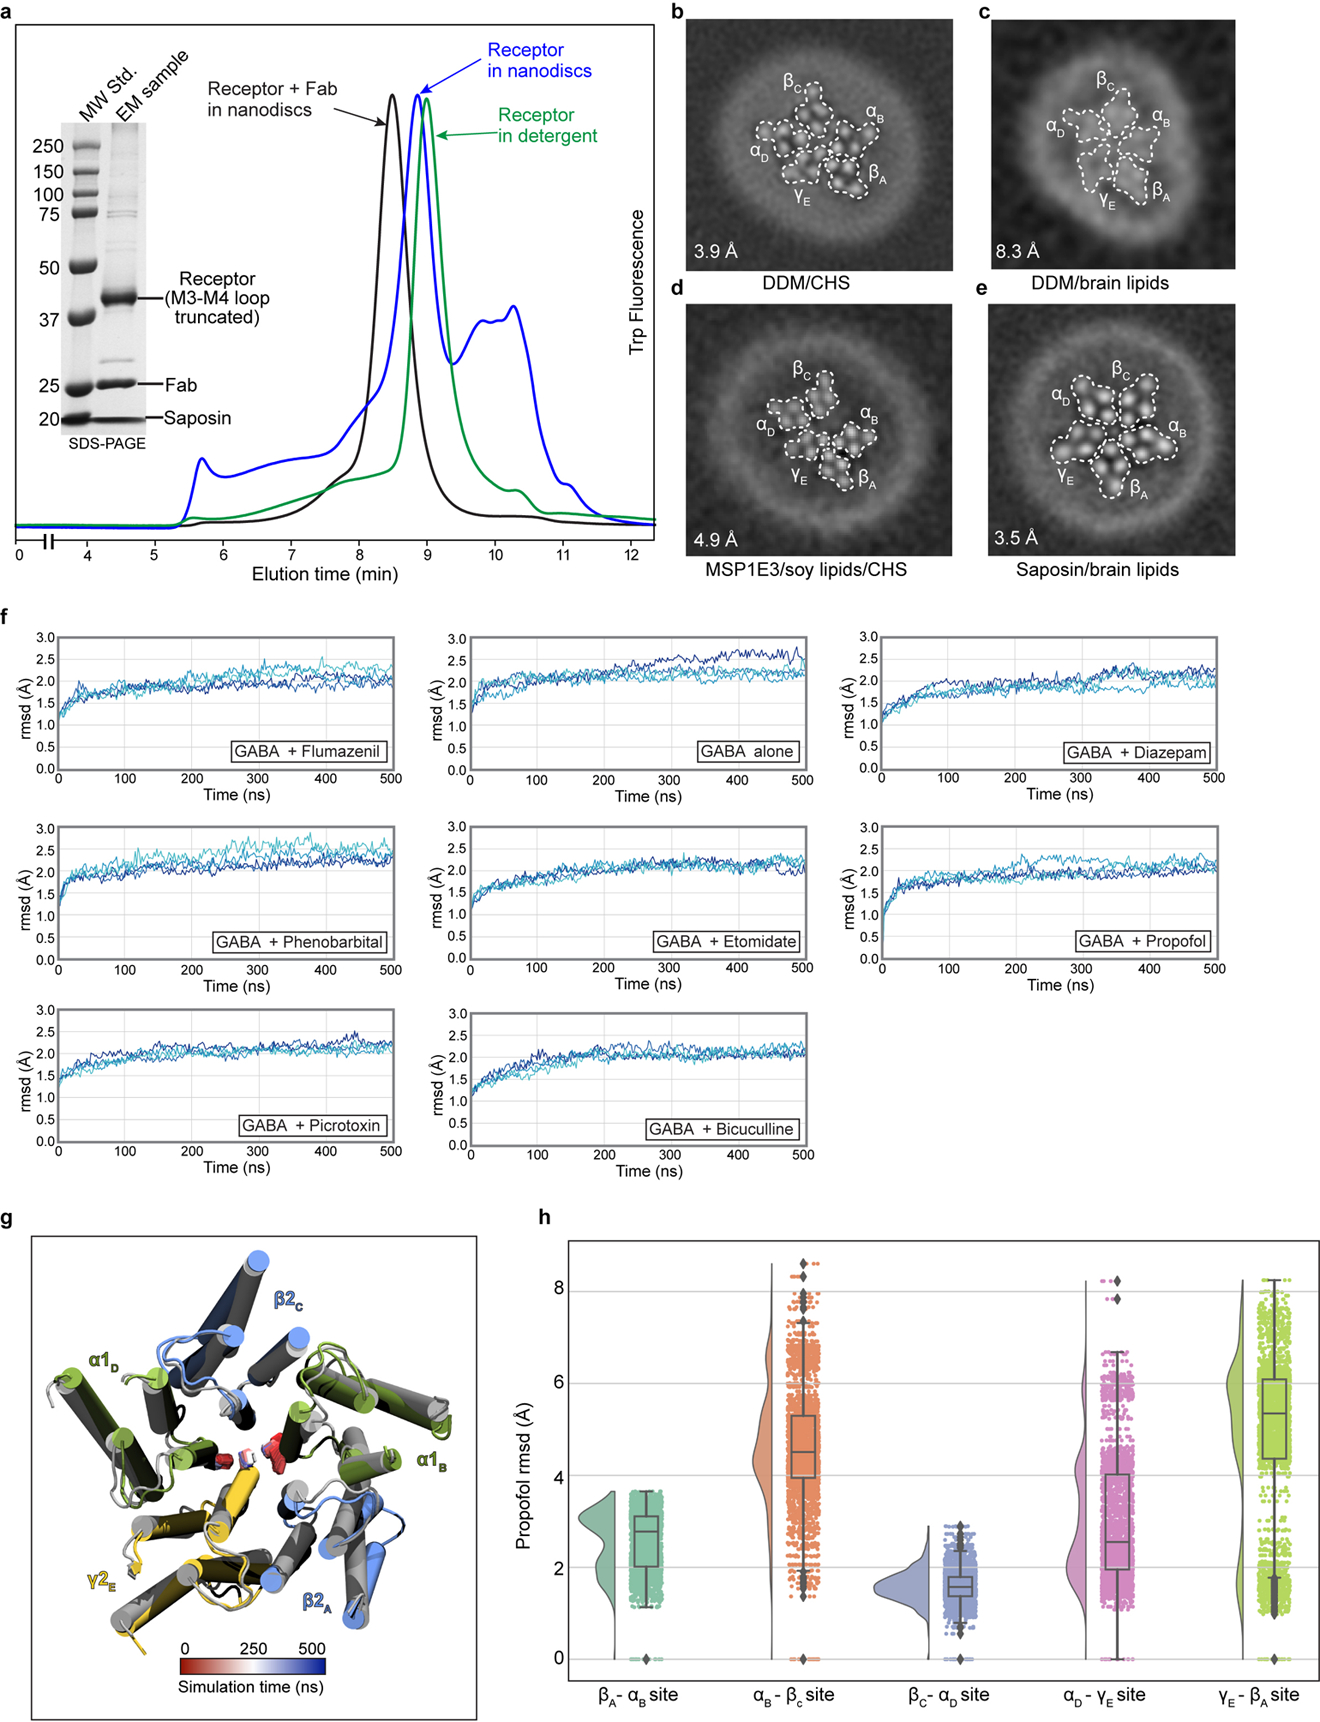
In 2018, our group reported the structure of the α1β2γ2 receptor in complex with GABA and flumazenil in detergent21. While this initial study revealed details of the classical neurotransmitter and benzodiazepine binding sites, the structures showed an unanticipated asymmetric occluded state in the transmembrane region, where we observed the γ2 transmembrane domain (TMD) collapsed into the pore or structurally disordered. Structures in complex with GABA50 or with a nanobody modulator (unpublished51), also in detergent, exhibited very low resolution in the membrane domain that precluded detailed analysis. Structures of the α1β3γ2 receptor in lipid nanodiscs were reported more recently, with a well-ordered and approximately symmetric transmembrane domain18,19. We first sought to improve order and prevent collapse of the symmetric transmembrane domain (TMD) quaternary structure by optimizing lipid reconstitution of the GABA plus flumazenil receptor complex as a benchmark. Panel a shows analytical size-exclusion chromatography of the α1β2γ2 receptor at different stages of preparation of the GABA plus flumazenil complex, which we used to benchmark the reconstitution approach: receptor in detergent, increasing in size after exchange into nanodiscs, then a further increase in size after addition of Fab. Inset SDS-PAGE shows relatively pure nanodisc-Fab-receptor complex, which was used for grid preparation. Panels b-e show TMD z-slices of 3D reconstructions from preparations with GABA, flumazenil and various membrane mimetics. Inset numbers are resolution values from the reconstructions and white dashed lines highlight subunit boundaries. Panel b is from the dataset published in 201821. Panel c is from sample purified in DDM supplemented with brain lipids, more symmetric but very low resolution. Panel d is from protein purified in DDM supplemented with soy polar lipid extract (Avanti) and cholesteryl hemisuccinate (CHS, Anatrace) and exchanged in MSP1E3 nanodiscs containing soy lipids, highly asymmetric. Panel e is the condition used to obtain the GABA plus flumazenil complex in this study. We applied this purification and nanodisc reconstitution approach to all other complexes. Panel f shows results from atomistic MD simulations validating the stability of these complexes in a brain-lipid environment, as well as differential dynamics in the presence of different ligands. After embedding our models in mixed membranes with expected brain-lipid proportions52 and equilibrating with coarse-grained simulations53, cholesterol and phosphatidylinositol 4,5-bisphosphate (PIP2) were found to accumulate at the protein surface, particularly at subunit interfaces (Supplementary Videos 9 and 10, respectively). Such interactions could contribute to the symmetrizing effect of brain lipids relative to detergent or other lipid mixtures. Subsequent quadruplicate 500-ns all-atom MD simulations of all 8 structures reported in this work were largely stable, converging to ≤ 3 Å root-mean-squared deviation (rmsd) for all protein Cα atoms. This panel shows deviations from starting conformations (rmsd, Å) of protein Cα atoms in α1β2γ2 receptor structures. Each trace represents one of four 500-ns replicates. Panel g illustrates an alternative conformation observed in multiple exploratory simulations of the flumazenil-bound structure (gray) with flumazenil removed. Within 200 ns, the γ M2-helix spontaneously translocates to block the pore (snapshot at 500 ns, colored), supporting a flexible conformational repertoire for this subunit. Transition is tracked over time (red–blue) by the position of P-2′ in α and γ. Panel h presents simulation results for propofol stability at all five interfacial TMD sites, with probability distributions at left, and raw data (n = 500 samples from 4 simulations, see Methods) plus boxplots indicating sample median, interquartile range (25th-75th percentiles), minimum–maximum range, and outliers at right.. Propofol was inserted at the α-β, α-γ and γ-β sites by symmetry superposition of the resolved β-α propofol. In quadruplicate simulations of >400 ns each, the inserted propofol molecules were not stably bound, sampling a broad distribution up to 8 Å rmsd from initial poses. In contrast, propofol at the β-α interfaces remained within 4 Å rmsd of its initial poses. Thus, simulations support a preference for propofol binding at the β-α over other interfaces.
Extended Data Figure 2: Detailed cryo-EM processing flowchart for GABA plus flumazenil complex.
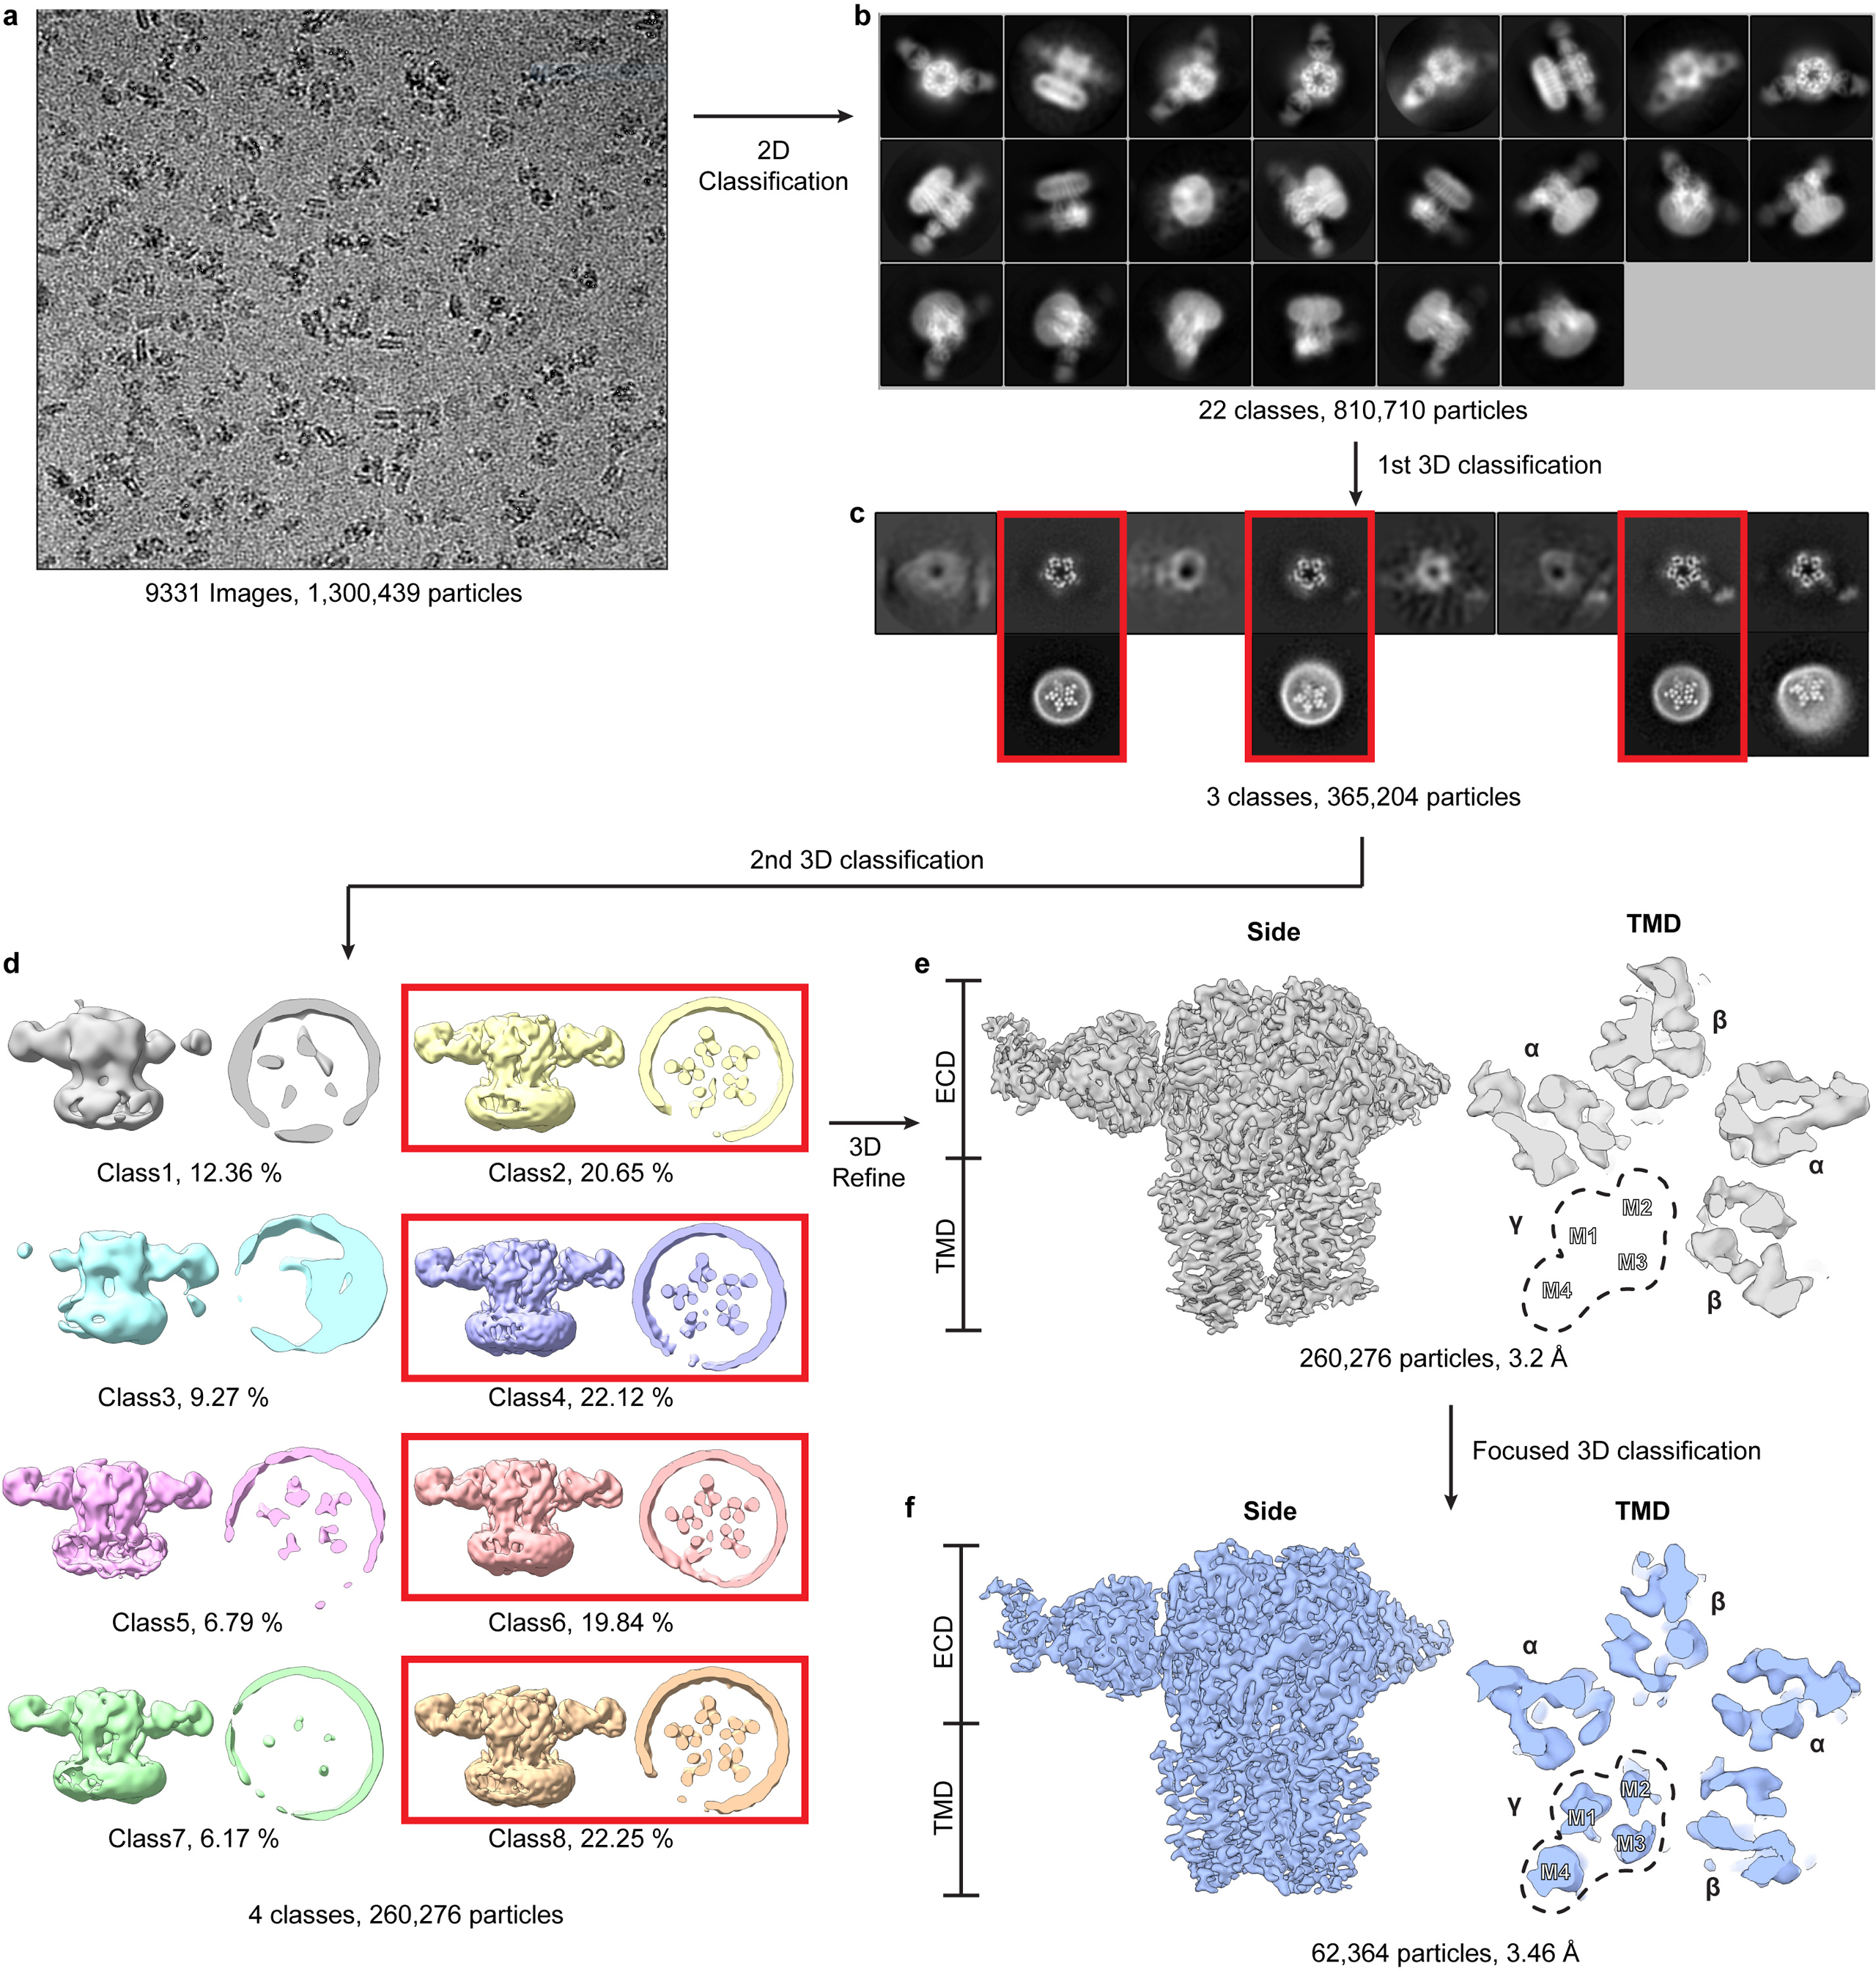
Panel a shows a representative cryo-EM image. Panel b shows projection images from the final selected 2D classes. Panel c shows 3D classification results; good classes selected for further processing are boxed in red and in lower row have TMD z-slices shown. Note fuzzy nanodisc appearance adjacent to γ2 subunit, consistent with conformational heterogeneity in this region. Panel d shows 3D maps from a second round of 3D classification, from which particle from four classes (red boxes) were selected and used to generate map shown in panel e. Signal subtraction and γ2 subunit focused 3D classification resulted in the map in panel f.
Extended Data Figure 3: Overall and local map resolution and global map-model agreement.
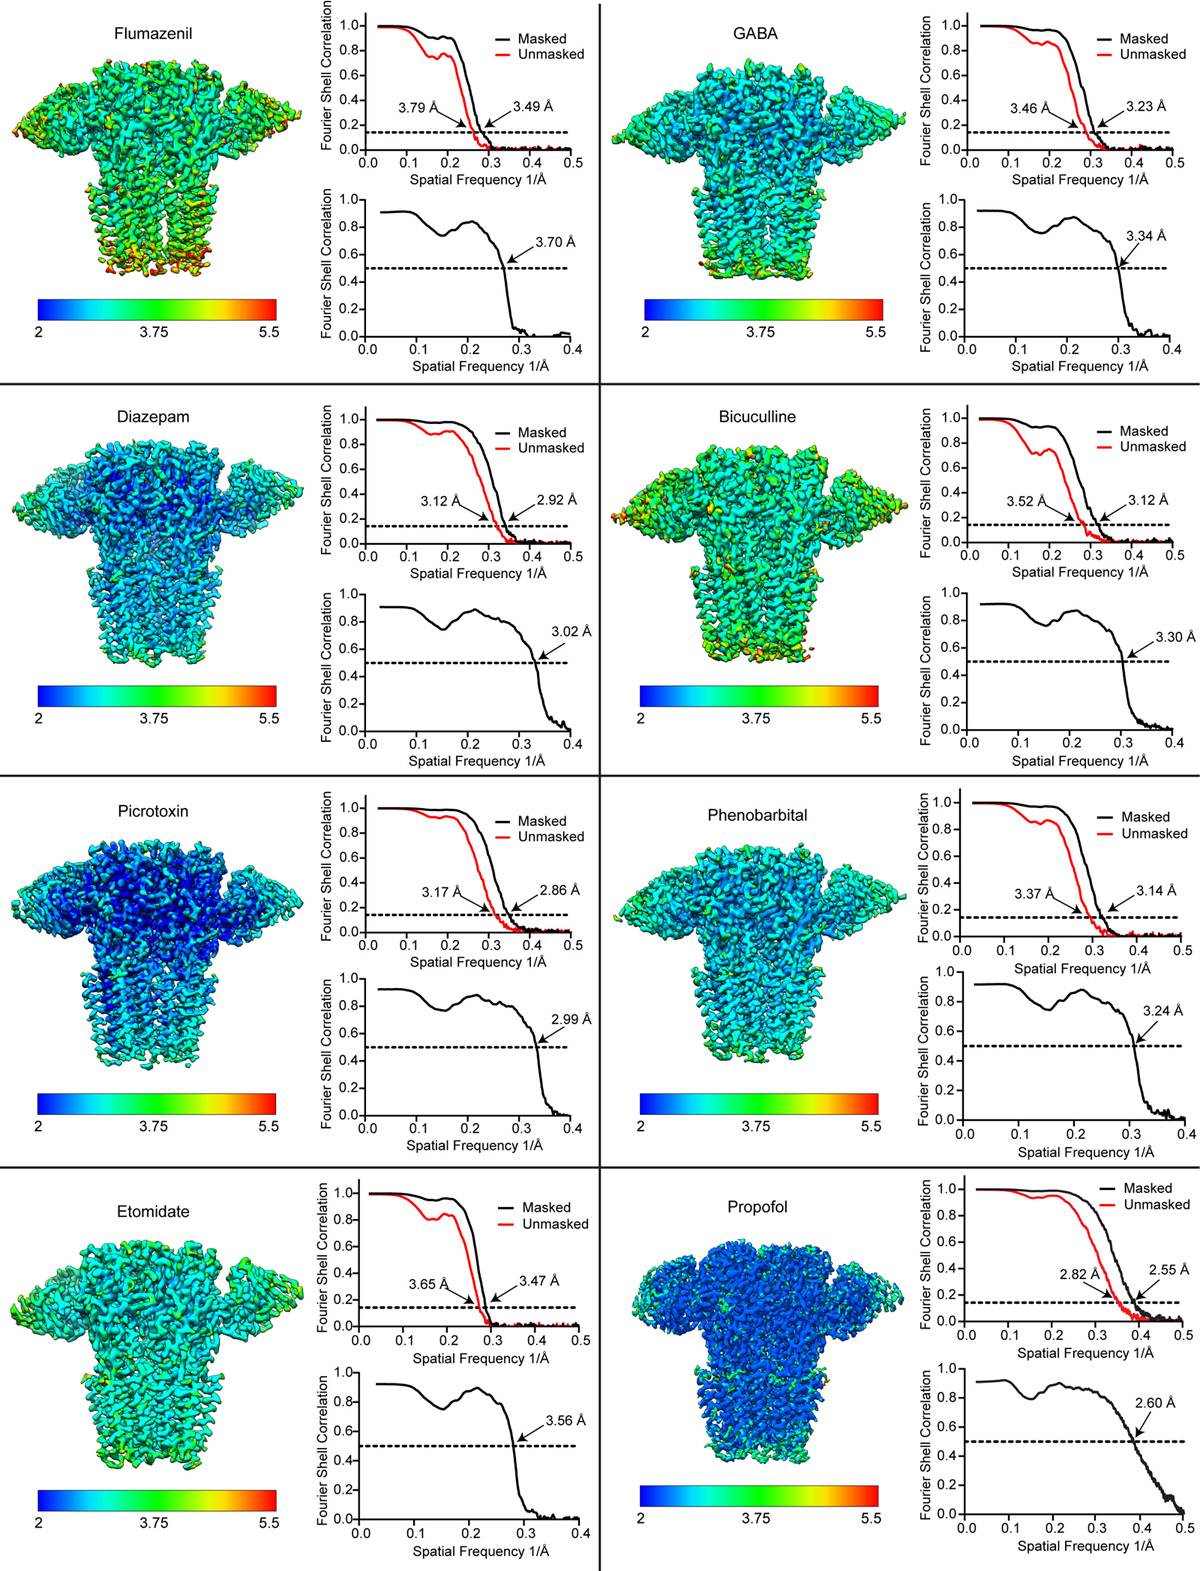
For each structure, the sharpened map is colored by local resolution, and map FSC (upper right) and map-model FSC (lower right) plots are shown. For the flumazenil complex, two maps were used in building, a higher resolution map that had weak γ-TMD density, and a lower resolution map with strong γ-TMD signal. Shown here for this structure is the lower resolution map with strong signal for the whole receptor. Both maps will be deposited for this flumazenil complex, and relevant statistics for these maps are shown in Extended Data Tables 1, 2.
Extended Data Figure 4: Map quality and ligand binding sites.
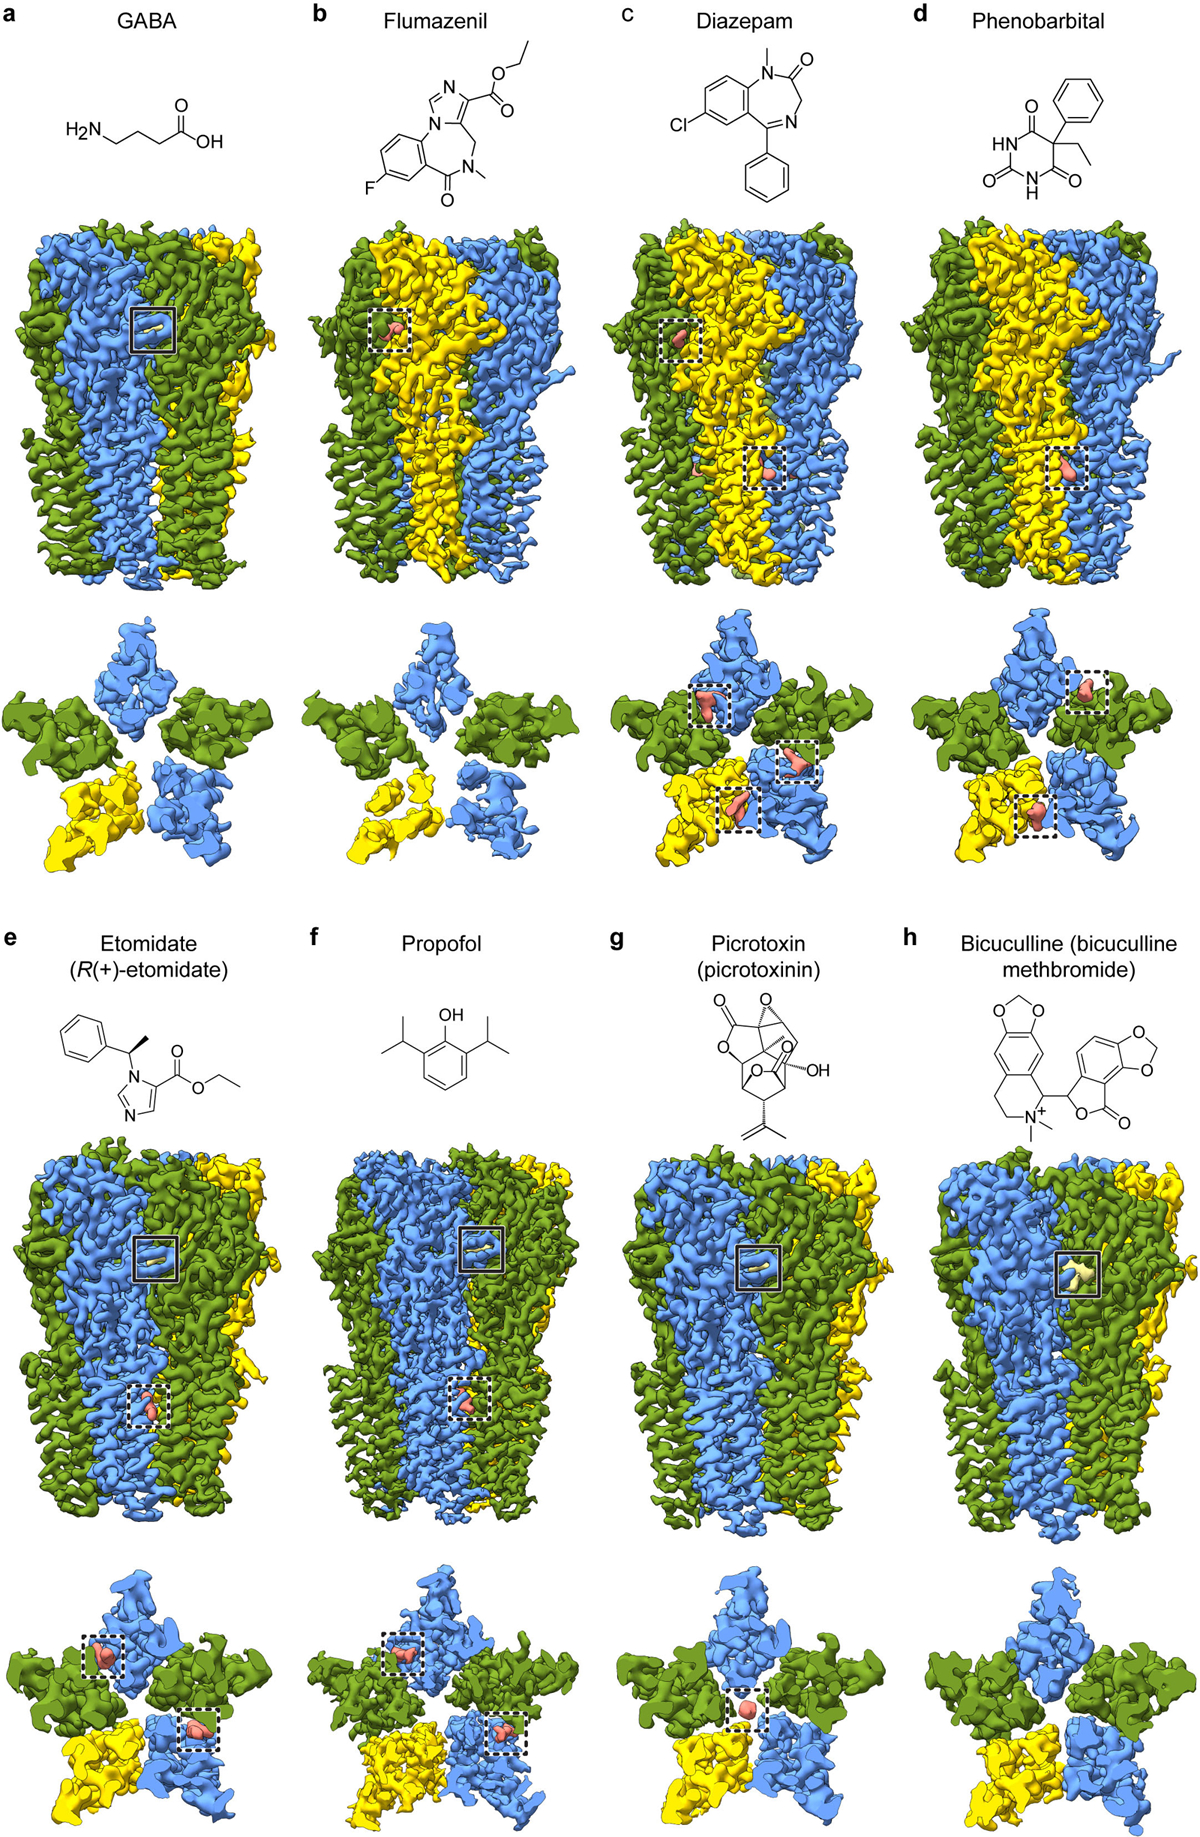
Each panel a-h shows a side view and a TMD slice from the experimental density map, accompanied by the chemical structure of the ligand in that complex. Note, GABA is present in all structures except the bicuculline complex. Solid boxes highlight GABA binding sites; dashed boxes highlight allosteric ligands (including picrotoxin) binding sites. Propofol binding sites at subunit interfaces in f are distinct from the intrasubunit sites identified initially in the prokaryotic GLIC channel54, and similar in location but distinct in pose compared to the intersubunit site mutants of GLIC55.
Extended Data Figure 5: Lipid interactions in TMD.
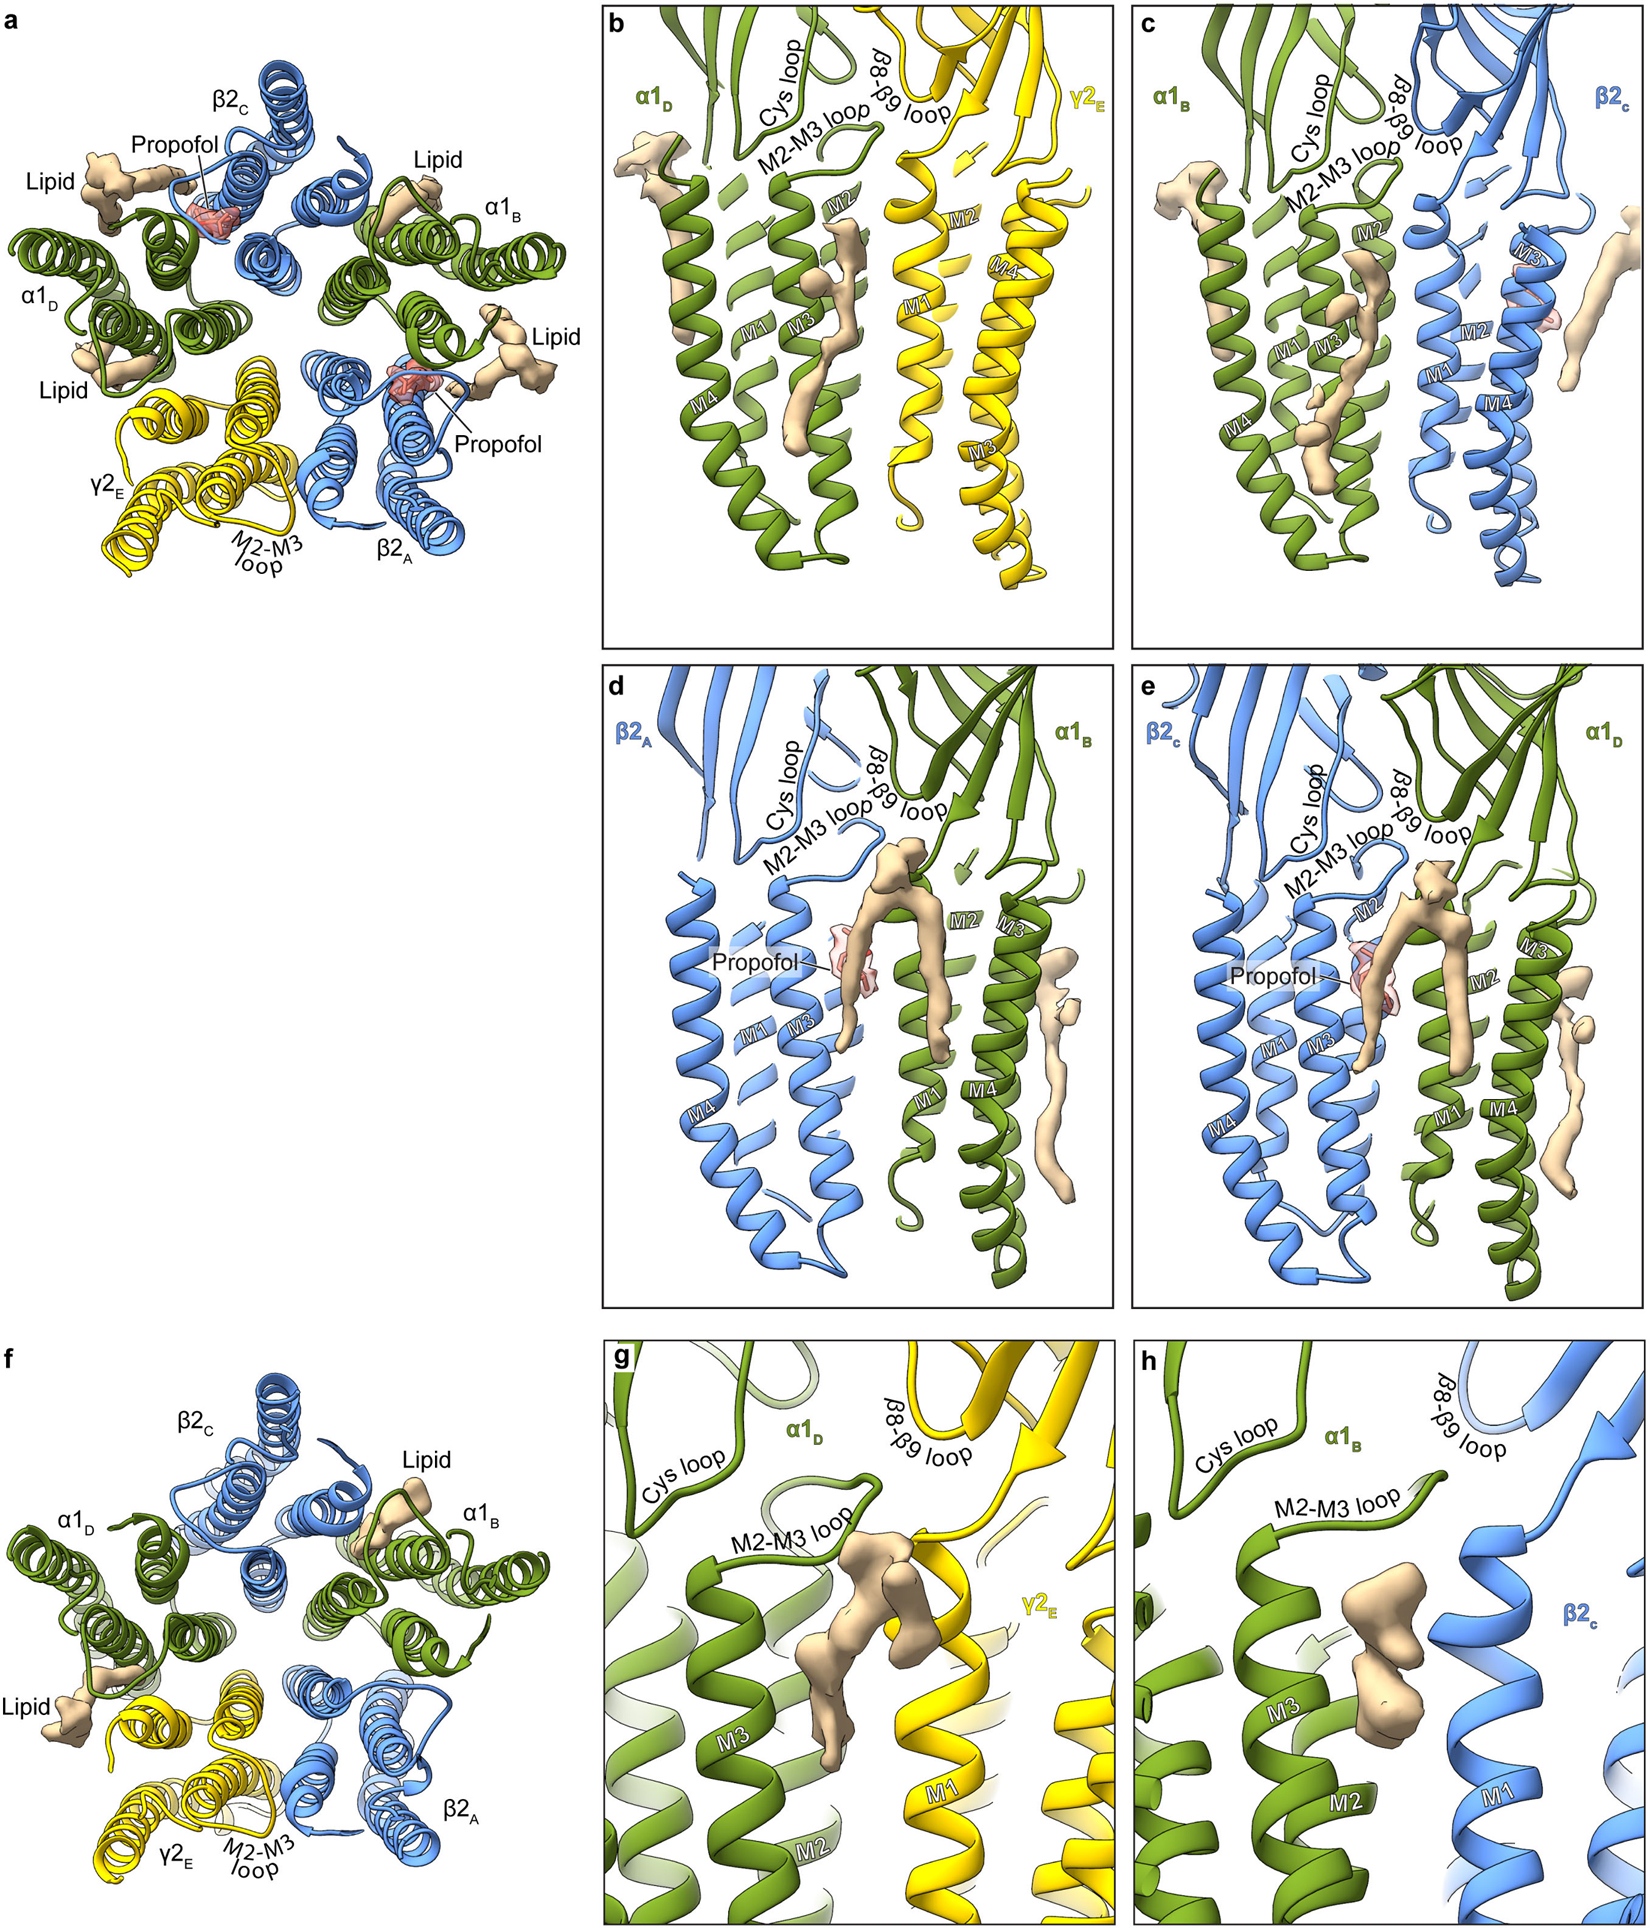
Panel a shows an atomic model overview of the TMD sites for possible lipid binding in the GABA plus propofol complex; densities for putative lipids are shown in tan. A subset of these are consistent with those modeled as POPC in the α1β3γ2 structures18,19. Panels b-e show side views of lipid density at the different subunit interfaces. The lipid density maps shown were generated using the unsharpened map. Panels f-h are made from the GABA plus diazepam complex structure. Panel f shows an atomic model overview of the TMD sites for possible lipid binding; densities for putative lipids are shown in tan. Panels g and h show side views of potential lipid density at the subunit interfaces.
Extended Data Figure 6: Representative map quality and model fit and structural analysis of GABA alone, diazepam and flumazenil complexes.
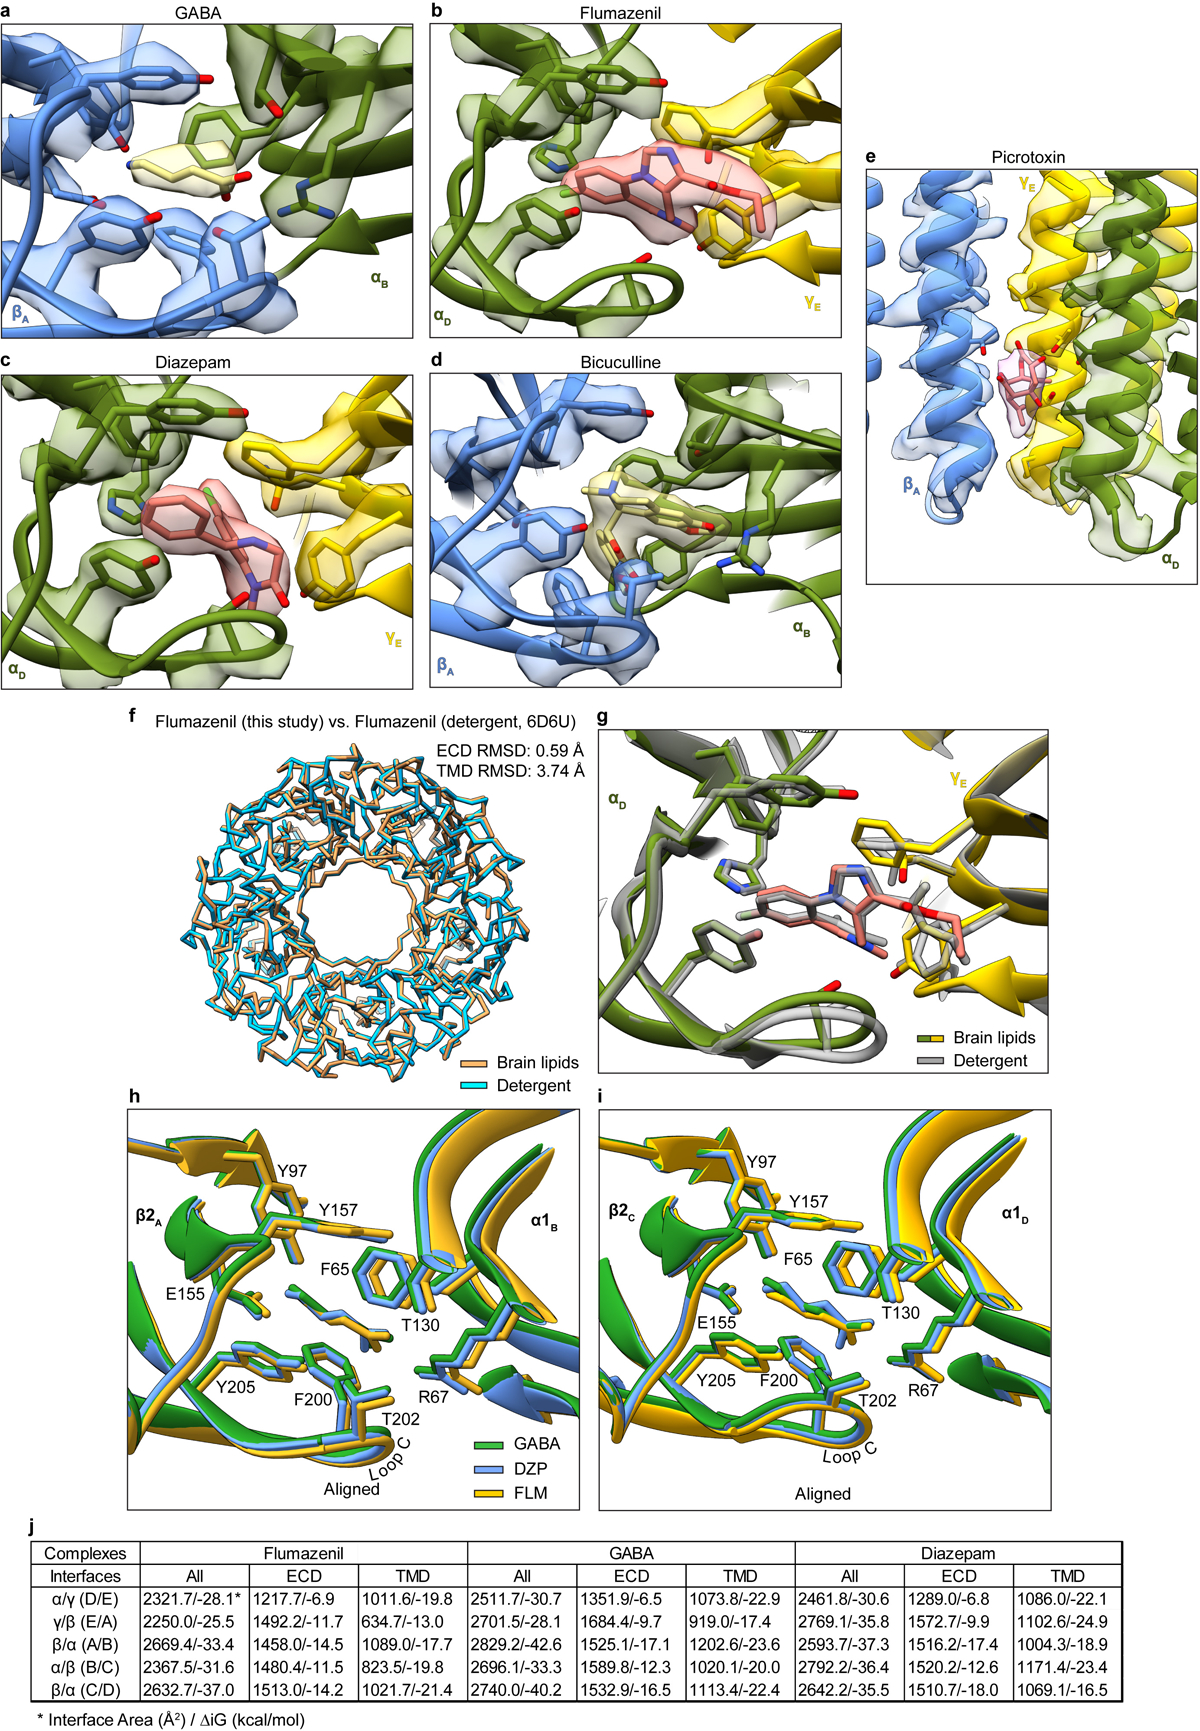
Semitransparent surface is shown for central ligand and contacting side chains for panels a-d. Panel a shows GABA site at chain A-B β-α interface in GABA alone structure. The two β-α GABA sites from the structure superimpose nearly perfectly and do not shed light on the differences in functional contributions found in electrophysiology studies with concatamers48. Structures of apo receptor may be essential in identifying structural differences in the two GABA sites. Panel b shows flumazenil site at α-γ interface; panel c shows diazepam at same ECD interface in its structure. Panel d shows bicuculline site at same interface as panel a. Panel e shows picrotoxin site in TMD; here, density is shown for ligand and all nearby protein structure elements. Panel f shows superposition of two GABA plus flumazenil complexes, one from the detergent condition21 and one from this study in brain lipids, to illustrate absence of differences in backbone conformation. Note, loops that interact with the TMD do vary in conformation. Panel g shows detail of flumazenil site from the superposition in panel f. Panels h and i show superpositions of three structures from the current study: GABA alone, GABA plus diazepam and GABA plus flumazenil, focused on the two GABA binding sites. Panel j shows calculated interface areas and interaction energies for each subunit pair, for each of the benzodiazepine-related structures.
Extended Data Figure 7: Agonist and benzodiazepine complexes.
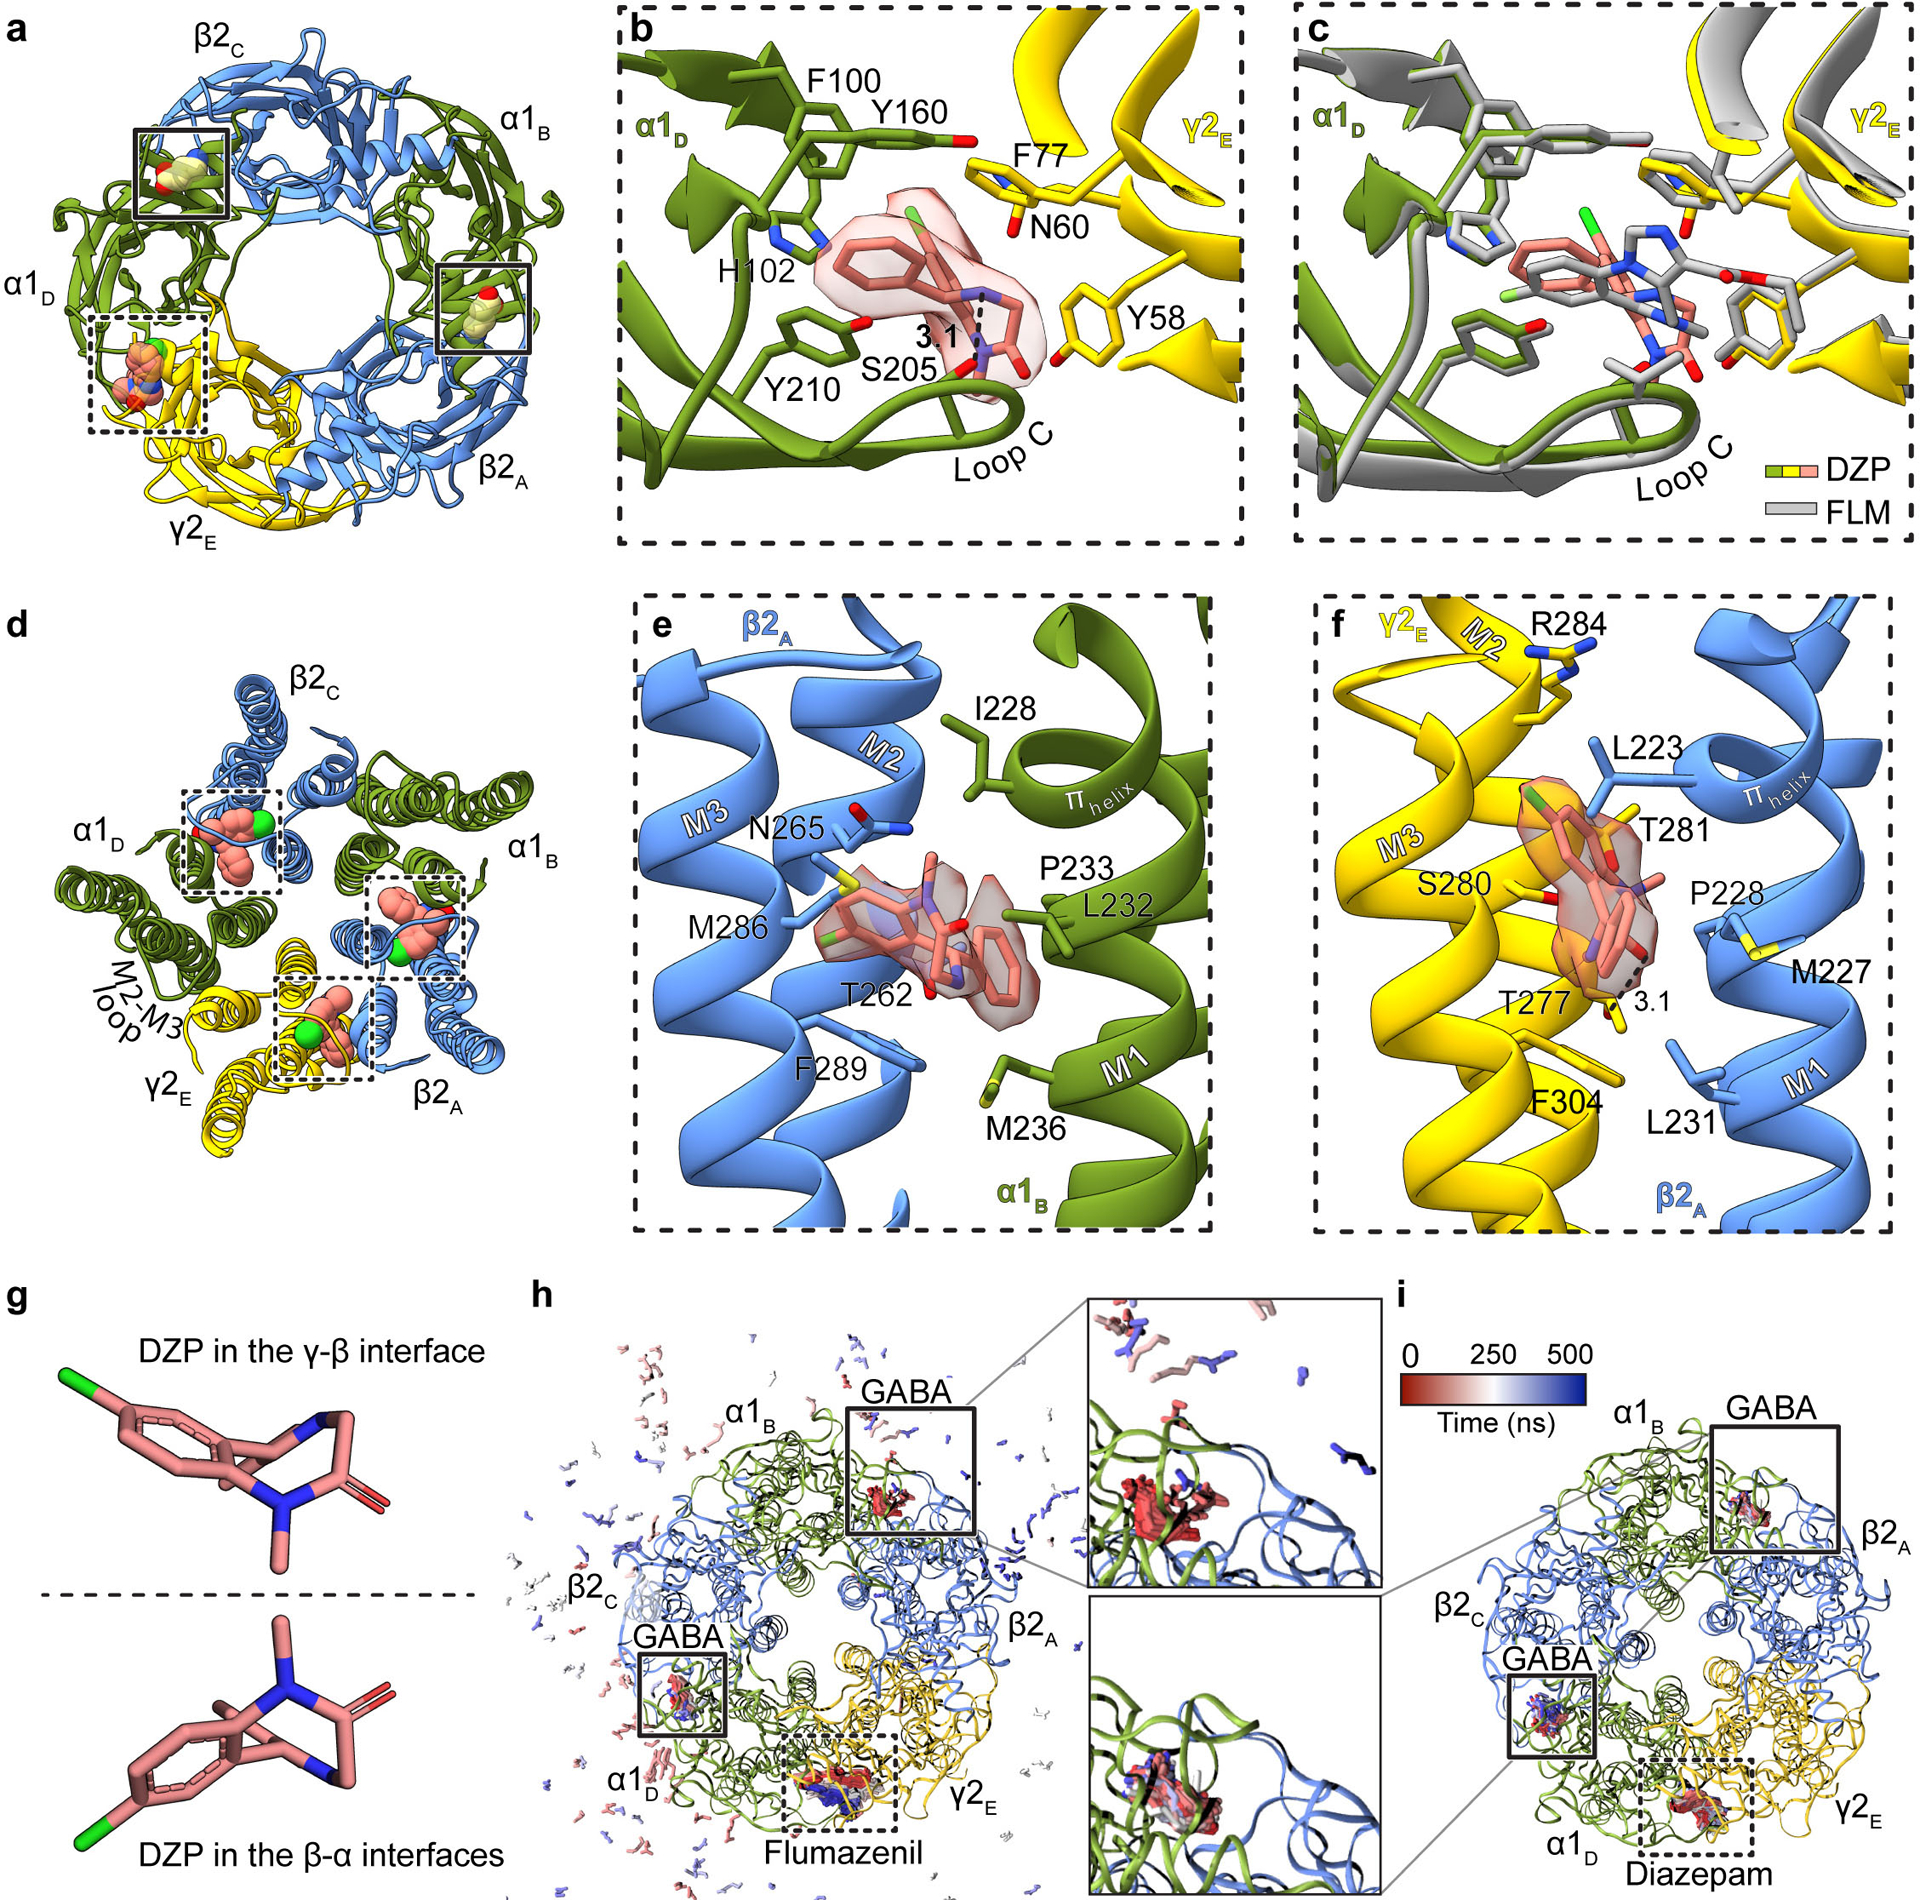
Panels a-c focus on ECD binding sites viewed from synaptic perspective; a, Overview of the diazepam complex. Panel b, position of diazepam with ligand map quality shown; side chains shown for residues contacting diazepam. Panel c, superposition of flumazenil and diazepam complexes. Panel d shows the three TMD sites identified for diazepam. Panels e and f show binding site details for diazepam at β-α and γ-β interfaces. The two enantiomeric conformations of diazepam identified in the TMD sites are in panel g. Panels h-i show snapshots from MD simulations viewed from the extracellular side. Extracellular GABA and benzodiazepines are shown as sticks, colored by frame (red-blue scale). Panel h, flumazenil-bound simulation with GABA in the upper site unbinding within 100 ns (pink-blue peripheral sticks). Panel i, diazepam-bound simulation with GABA retained in both orthosteric sites. Subunit subscripts denote chain ID. Stick representation is shown for residues within van der Waals contact range.
Extended Data Figure 8: Ligand site comparisons among α1β2γ2, α1β3γ2 and GluCl structures, and panel of pore conformations.
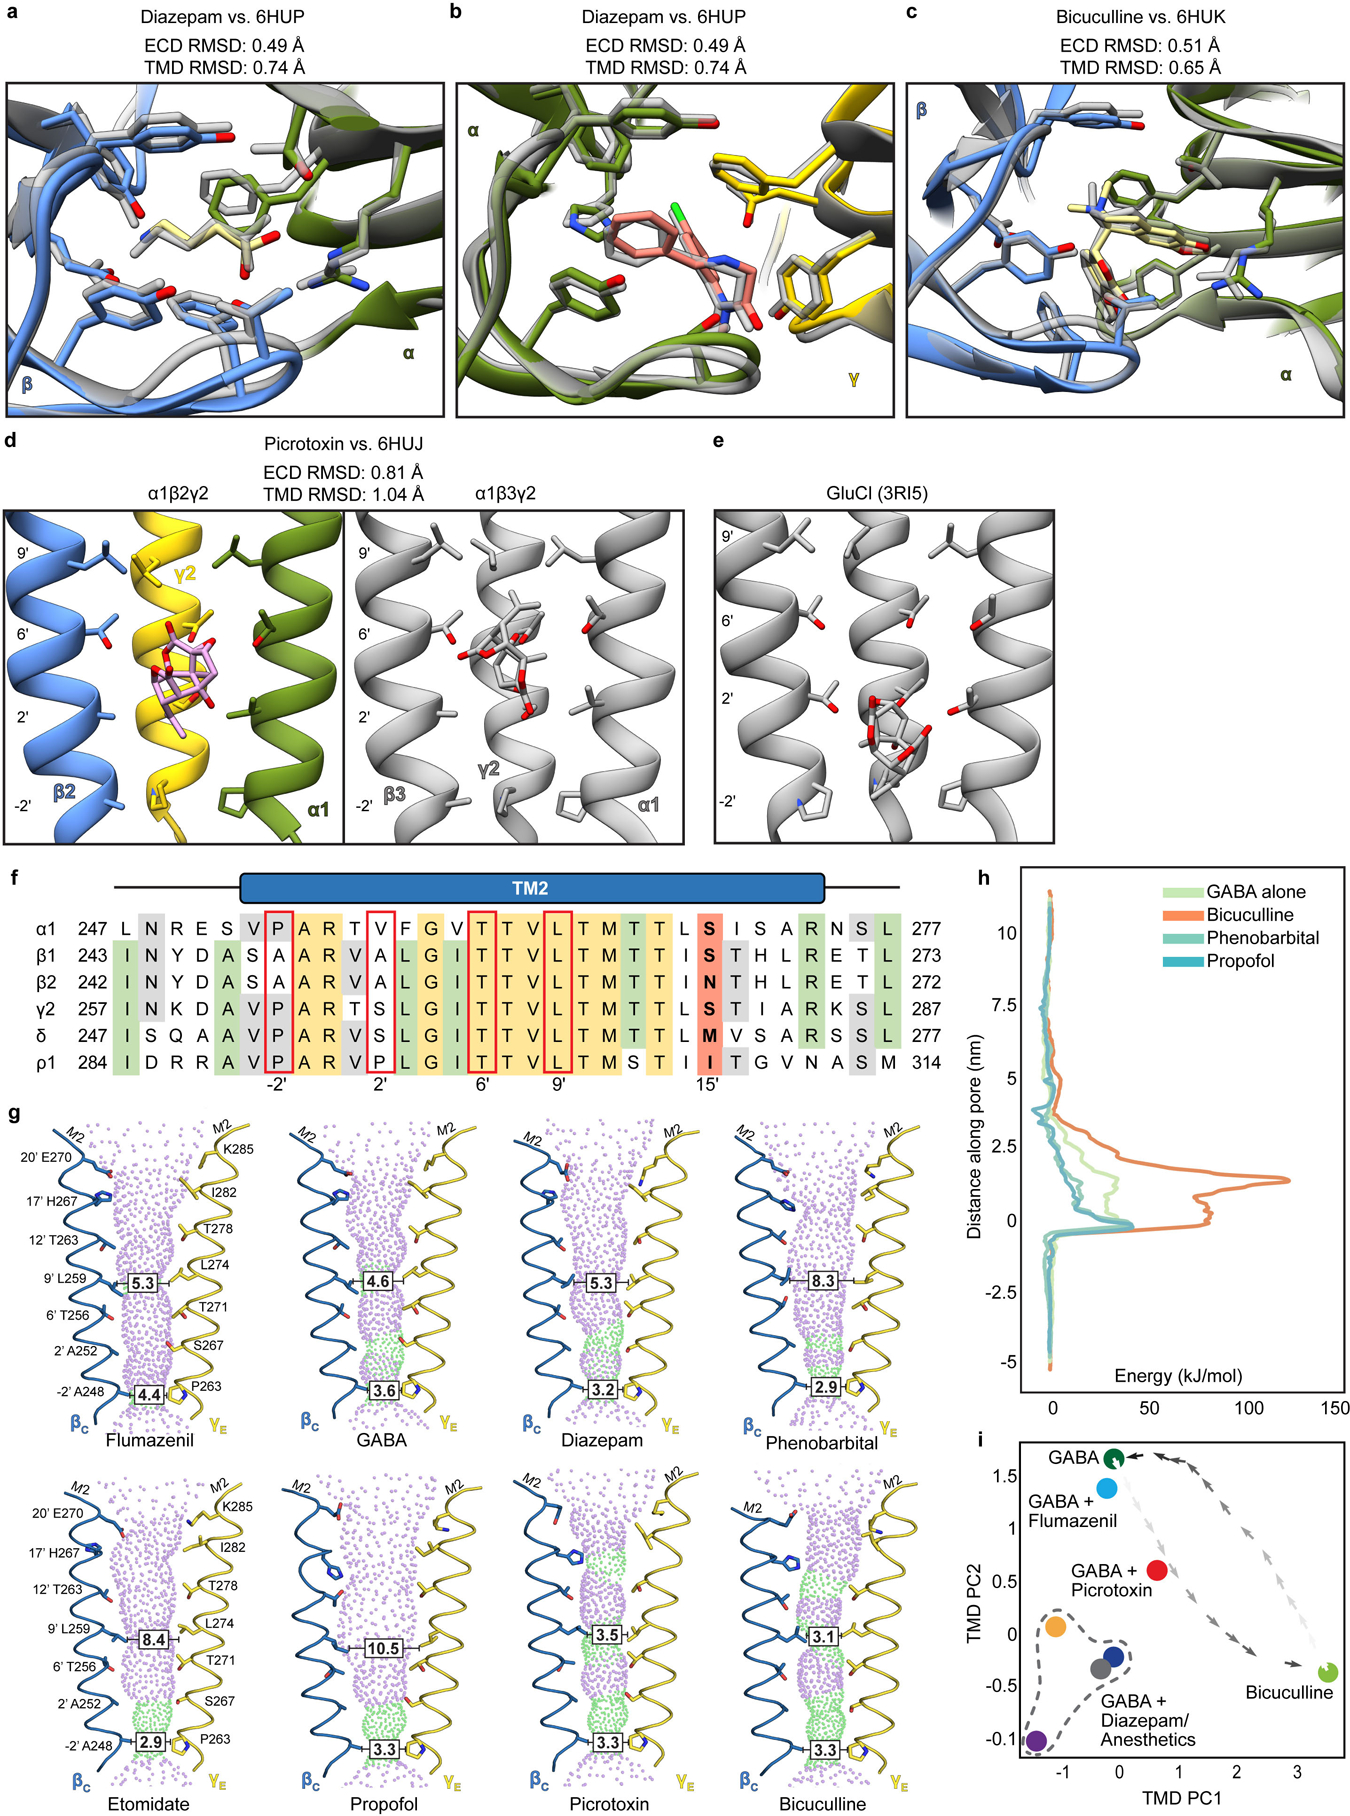
Panels a and b show superpositions of the GABA and diazepam ECD binding sites from the α1β2γ2 receptor (this study; subunits and ligands are colored) and the α1β3γ2 receptor (in grey)19, respectively. Panel c shows a superposition similar to those in a and c but for the bicuculline complexes (N,N-dimethyl higher affinity form from this study; bicuculline (single N-methyl) for α1β3γ2 in grey). Panels d and e compare picrotoxin binding sites from three structures: this study, the α1β3γ2 structure and GluCl56. The results suggest picrotoxin can bind to multiple conformations at different depths of the pore. GluCl is most widely open and picrotoxin binds most deeply; in that study, picrotoxin was used as a probe for an open-state conformation56. The pore is more tightly closed in α1β3γ2 than in α1β2γ2, which may allow picrotoxin to bind more deeply in the latter structure. In GluCl and in α1β2γ2, the picrotoxin isoprenyl tail orients toward the cytosol; in α1β3γ2, tail orients toward extracellular surface. This orientation allows in GluCl for favorable interactions between the “basket” oxygens and the polar 2′ residues. The α1β2/β3γ2 receptors are more hydrophobic at the 2′ position, which may also explain favorable positioning of picrotoxin higher in the pore, where in the α1β2γ2 structure these oxygens are likely to make hydrogen-bonding interactions with conserved 6′ threonine hydroxyls. Panel f shows a sequence alignment of GABAA subunit M2 helices. Red boxes highlight residues potentially important in picrotoxin binding; in bold are the 15′ residues that play a role in anesthetic selectivity and sensitivity. Panel g shows pore conformational states for all ligand complexes, with opposing β1 and γ2 M2 α-helices shown as ribbons with pore-lining side chains shown as sticks. Purple and green spheres illustrate shape of the pore. Boxed distances in the pore are diameters at the desensitization gate (−2′) and resting gate (9′) positions. Panel h shows free energies for chloride ion permeation along the pore axis (cytoplasmic side down, with −2′ gate at 0 nm), for representative α1β2γ2 complexes. Overlaid plots show the energy barrier at the 9′ hydrophobic gate (~2 nm) in the bicuculline complex (orange) to be partially relieved in the GABA complex (green), and further relieved in complexes with GABA + phenobarbital or + propofol (light or dark blue, respectively). Panel i shows all α1β2γ2 structures reported in this work (n = 8 independent structures), plotted along dominant principal components (PCs) calculated for the TMD. Snapshots of a simulated transition57 between the GABA and bicuculline complexes (dark-to-light crosses) show that the GABA + picrotoxin complex maps along this pathway. GABA + diazepam and IV anesthetics bound structures (GABA + diazepam, dark blue; etomidate, gray; phenobarbital, orange; propofol, purple) cluster at lower left, distinct from GABA-alone or flumazenil- or inhibitor-bound states.
Extended Data Figure 9: Ion pore conformation and TMD subunit interface packing in α1β2γ2 vs. α1β3γ2 structures.
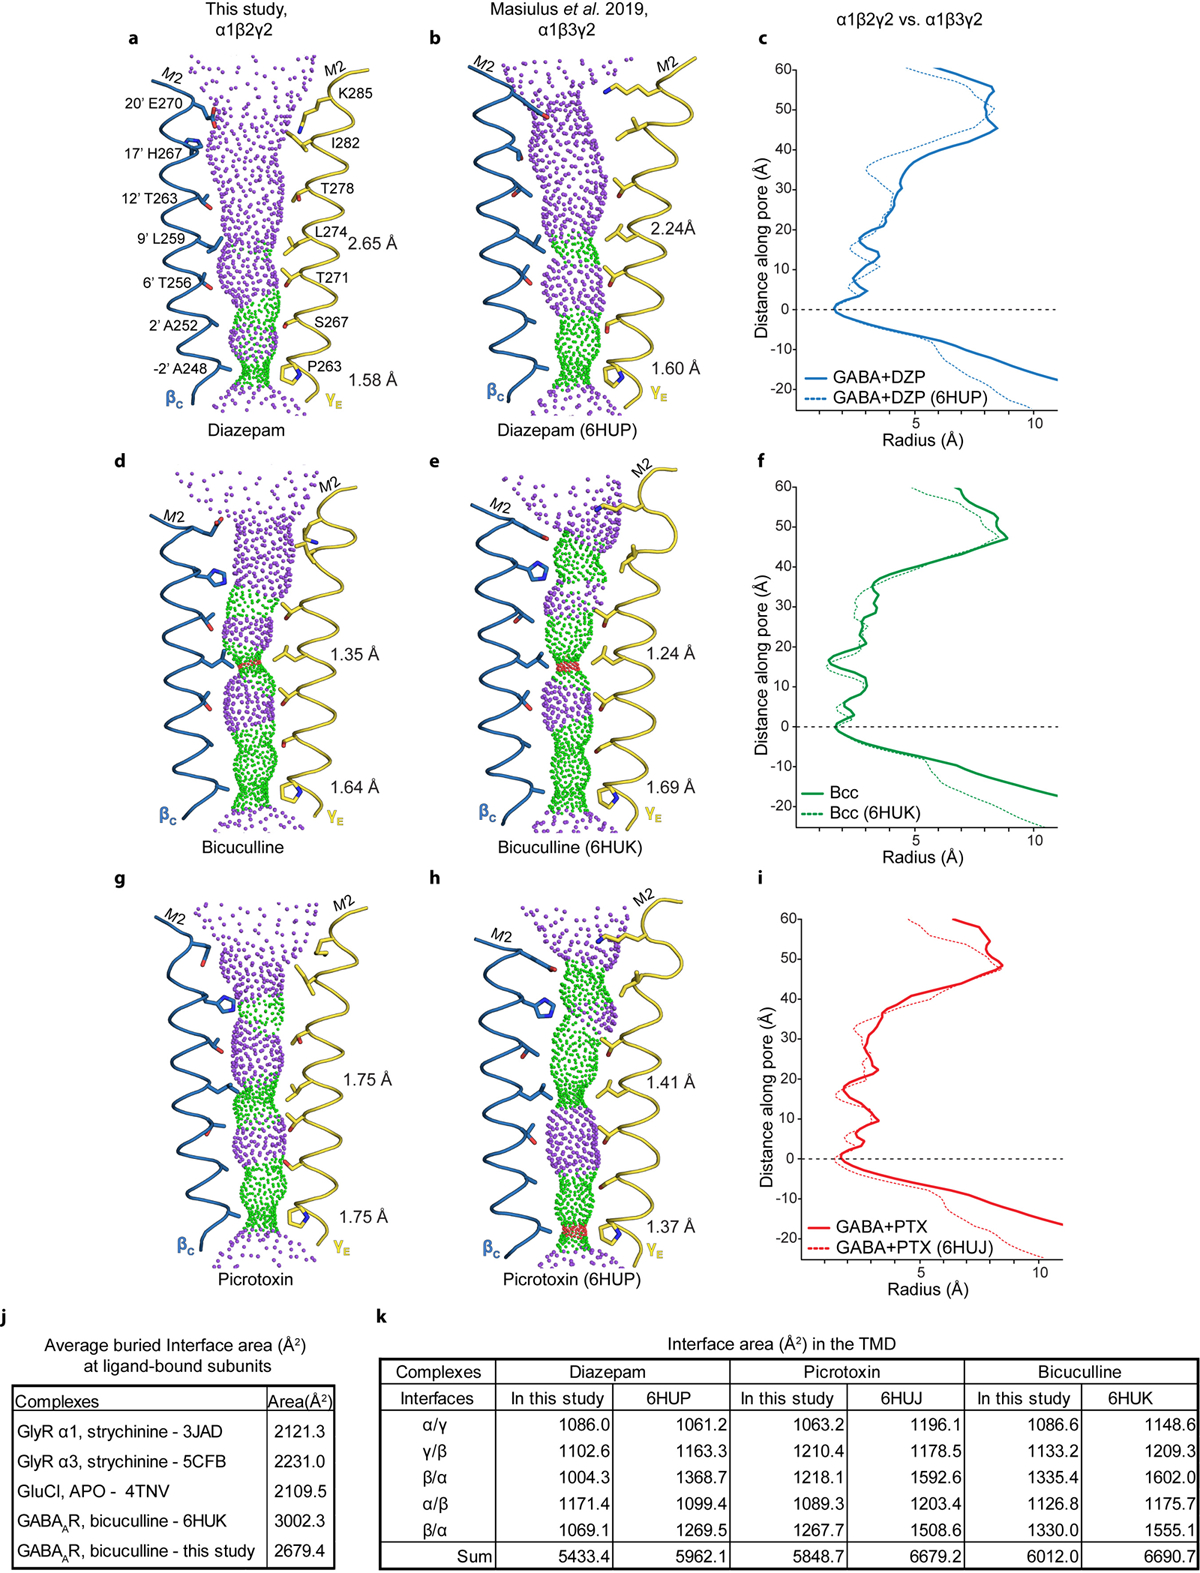
Panels a-b show pore conformations for α1β2γ2 (this study) and α1β3γ219 structures bound by GABA plus diazepam, respectively, with opposing β1 and γ2 M2 α-helices shown as ribbons and pore-lining side chains shown as sticks. Purple and green spheres illustrate shape of the pore; purple is for radii > 2.8 Å; green is 1.4–2.8 Å; red is < 1.4 Å. Distances on right side of pore are radii at the desensitization gate (−2′) and resting gate (9′) positions. Panel c compares these two structures in the form of a pore radius vs. distance along the pore plot. Structures were aligned at y=0 at the level of the −2′ desensitization gate. Panels d-f and g-i make the same comparisons, but for the bicuculline and GABA plus picrotoxin complexes, respectively. Panel j compares interface area buried per subunit interface (Å2, ECD+TMD) for representative anion-selective receptors; top three are homopentamers where the area given is the average from all interfaces, while for the two bicuculline structures the area comes from the average of the two β-α interfaces. Comparison is limited to anion-selective receptors due to absence of ordered intracellular domains; eukaryotic cation-selective receptors contain intracellular domains that contribute to interface surface area. Panel k tabulates buried TMD subunit interface areas between pairs of GABAA receptor structures to illustrate tighter packing in the α1β3γ2 receptor structures.
Extended Data Figure 10: Nanodisc sizes correspond to lipid ratio used in reconstitution.
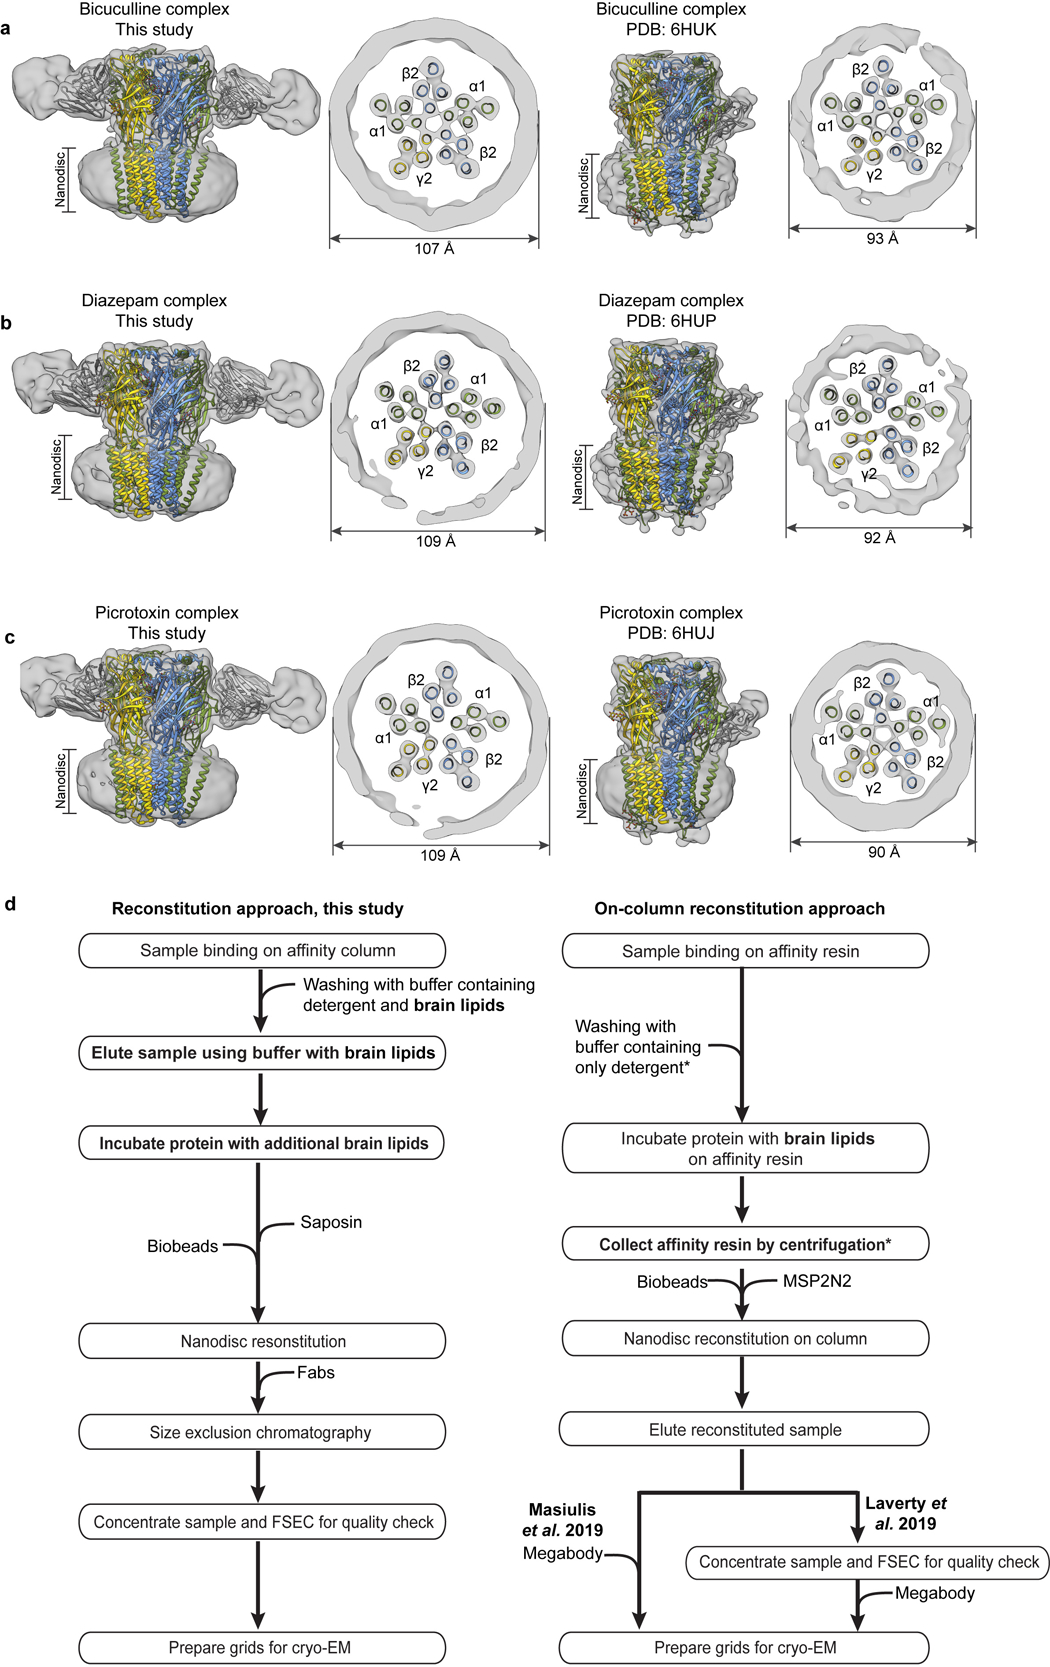
Panels a-c compare experimental EM maps (with docked structures), low-pass filtered to 10 Å resolution, between matched α1β2γ2 and α1β3γ2 ligand complexes. Panel d compares the reconstitution approach from the current study with the on-column approach used to obtain the α1β3γ2 receptor structures18,19. Asterisks indicate steps we hypothesize give rise to the observed different nanodisc sizes: washing with lipid-free detergent buffer removes lipids, and the step of collecting affinity resin by centrifugation removes excess lipids, such that when the MSP2N2 scaffold and biobeads are added, there are no extra lipids to fill the large scaffold.
Extended Data Figure 11: Example electrophysiological recordings with cryo-EM construct.
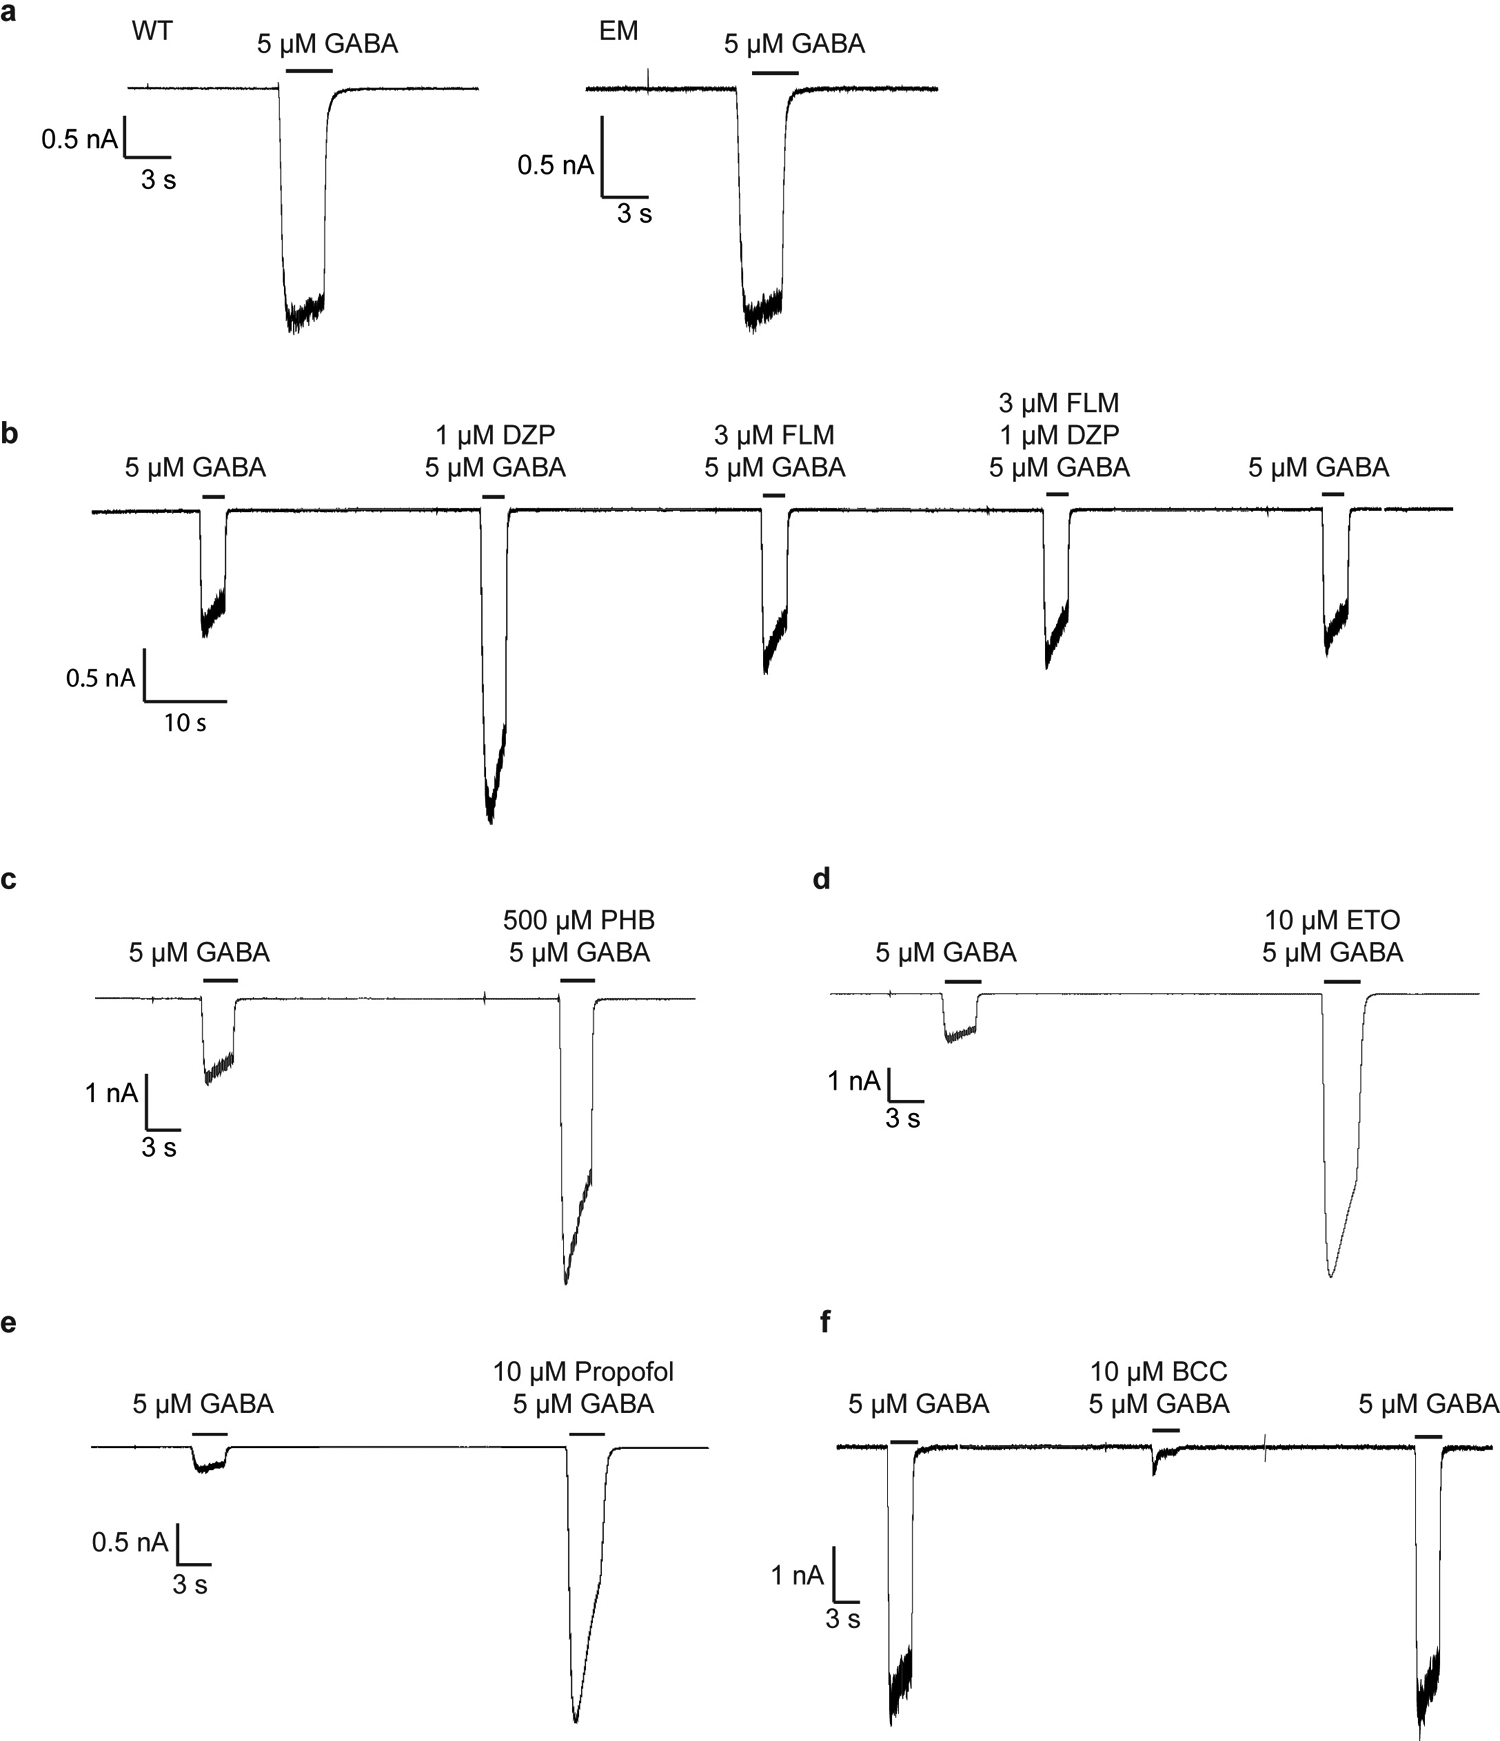
All recordings were made in whole-cell voltage-clamp mode at −75 mV with transiently-transfected HEK cells. In panel a, WT, full-length receptor compared to cryo-EM construct, response to application of GABA. All remaining recordings are with the EM construct. In panel b, a representative response is shown for application of GABA, then GABA plus diazepam, then GABA plus flumazenil, then GABA plus diazepam plus flumazenil. In panel c, application of GABA, then GABA plus phenobarbital. In d, application of GABA, then GABA plus etomidate. In e, application of GABA, then GABA plus propofol. In f, application of GABA, then GABA plus methylated form of bicuculline. The patch clamp experiments were repeated 3 times independently.
Extended Data Table 1: Cryo-EM data collection, refinement and validation statistics.
| Bicuculline methbromide (EMDB-22031) (PDB 6X3S) | GABA+ Propofol (EMDB-22032) (PDB 6X3T) | GABA+ Etomidate (EMDB-22034) (PDB 6X3V) | GABA+ Phenobarbital (EMDB-22035) (PDB 6X3W) | |
|---|---|---|---|---|
| Data collection and processing | ||||
| EM Facility | UTSW | PNCC | UTSW | HMS |
| Magnification | 105 K | 22.5 K | 105 K | 105 K |
| Voltage (kV) | 300 | 300 | 300 | 300 |
| Electron exposure (e−/Å2) | 85.05 | 50.00 | 66.07 | 69.59 |
| Defocus range (μm) | −1.8 to −2.8 | −1.8 to −2.8 | −1.8 to −2.8 | −1.8 to −2.8 |
| Pixel size (Å) | 0.833 | 1.035 | 0.833 | 0.825 |
| Symmetry imposed | C1 | C1 | C1 | C1 |
| Initial particle images (no.) | 1,219,070 | 3,052,289 | 1,972,936 | 1,076,196 |
| Particle images after 2D classification | 815,729 | 926,936 | 719,534 | 513,431 |
| Final particle images (no.) (%)‡ | 80,103 (9.8) | 158,159 (17.1) | 124,310 (17.3) | 145,958 (28.4) |
| Map resolution (Å) | 3.12 | 2.55 | 3.47 | 3.14 |
| FSC threshold | 0.143 | 0.143 | 0.143 | 0.143 |
| Map resolution range (Å) | 2.7 – 4.2 | 2 – 2.8 | 3 – 4.0 | 2.4 – 3.8 |
| Refinement | ||||
| Initial model used (PDB code) | 6X3Z | 6X3Z | 6X3Z | 6X3Z |
| Model resolution (Å) | 3.31 | 2.60 | 3.56 | 3.24 |
| FSC threshold | 0.5 | 0.5 | 0.5 | 0.5 |
| Model resolution range (Å) | n.a. | n.a. | n.a. | n.a. |
| Map sharpening B factor (Å2) | −86 | −61 | −100 | −102 |
| Model composition | ||||
| Non-hydrogen atoms | 17,407 | 17,416 | 17,426 | 17,399 |
| Protein residues | 2,121 | 2,121 | 2,121 | 2,121 |
| Ligands | 23 | 27 | 27 | 25 |
| B factors (Å2) | ||||
| Protein | 43.00 | 41.53 | 29.54 | 35.92 |
| Ligand | 52.96 | 42.31 | 40.90 | 45.94 |
| R.m.s. deviations | ||||
| Bond lengths (Å) | 0.004 | 0.004 | 0.005 | 0.008 |
| Bond angles (°) | 0.599 | 0.586 | 0.568 | 1.133 |
| Validation | ||||
| MolProbity score | 1.79 (100th %) | 1.77 (99th %) | 1.72 (100th %) | 1.59 (100th %) |
| Clashscore | 9.42 (96th %) | 5.88 (99th %) | 7.33 (100th %) | 5.41 (100th %) |
| Poor rotamers (%) | 0.05 | 2.28 | 0.58 | 0.85 |
| Ramachandran plot | ||||
| Favored (%) | 95.72 | 96.96 | 95.48 | 95.67 |
| Allowed (%) | 4.28 | 3.04 | 4.52 | 4.33 |
| Disallowed (%) | 0.00 | 0.00 | 0.00 | 0.00 |
Percent of particles in final reconstitution compared to after 2D classification
Extended Data Table 2: Cryo-EM data collection, refinement and validation statistics.
| GABA (EMDB-22037) (PDB 6X3Z) | GABA+ Diazepam (EMDB-22036) (PDB 6X3X) | GABA+ Flumazenil (EMDB-22033) (PDB 6X3U) | GABA+ Picrotoxin (EMDB-22038) (PDB 6X40) | |
|---|---|---|---|---|
| Data collection and processing | ||||
| EM Facility | HMS | UTSW | UTSW | HMS |
| Magnification | 105 K | 105 K | 165 K | 105 K |
| Voltage (kV) | 300 | 300 | 300 | 300 |
| Electron exposure (e−/Å2) | 63.79 | 63.04 | 50.28 | 62.91 |
| Defocus range (μm) | −1.8 to −2.8 | −1.8 to −2.8 | −0.6 to −2.1 | −1.4 to −2.3 |
| Pixel size (Å) | 0.825 | 0.833 | 0.84 | 0.825 |
| Symmetry imposed | C1 | C1 | C1 | C1 |
| Initial particle images (no.) | 1,705,334 | 2,868,814 | 1,072,111 | 1,847,538 |
| Particle images after 2D classification | 871,313 | 826,254 | 810,710 | 1,550,272 |
| Final particle images (no.) (%)‡ | 171,838 (19.7) | 297,028 (35.9) | 260,276 / 62,364 (32.1 / 7.7) | 165,494 (10.7) |
| Map resolution (Å) | 3.23 | 2.92 | 3.20 / 3.49 | 2.86 |
| FSC threshold | 0.143 | 0.143 | 0.143 | 0.143 |
| Map resolution range (Å) | 2.5 – 3.9 | 2 – 3.5 | 3 – 4.5 | 2 – 3.2 |
| Refinement | ||||
| Initial model used (PDB code) | 6U6D + 4COF | 6X3Z | 6X3Z | 6X3Z |
| Model resolution (Å) | 3.34 | 3.02 | 3.70 | 2.99 |
| FSC threshold | 0.5 | 0.5 | 0.5 | 0.5 |
| Model resolution range (Å) | n.a. | n.a. | n.a. | n.a. |
| Map sharpening B factor (Å2) | −109 | −113 | −125 / −120 | −94 |
| Model composition | ||||
| Non-hydrogen atoms | 17,365 | 17,470 | 17,387 | 17,411 |
| Protein residues | 2,121 | 2,121 | 2,121 | 2,121 |
| Ligands | 23 | 29 | 24 | 26 |
| B factors (Å2) | ||||
| Protein | 62.75 | 40.07 | 24.15 | 62.21 |
| Ligand | 66.81 | 46.42 | 31.71 | 60.63 |
| R.m.s. deviations | ||||
| Bond lengths (Å) | 0.007 | 0.006 | 0.005 | 0.007 |
| Bond angles (°) | 1.069 | 1.024 | 0.998 | 1.092 |
| Validation | ||||
| MolProbity score | 1.59 (100th %) | 1.49 (100th %) | 1.47 (100th %) | 1.68 (100th %) |
| Clashscore | 5.44 (100th %) | 4.14 (100th %) | 4.05 (100th %) | 7.16 (98th %) |
| Poor rotamers (%) | 0.69 | 0.53 | 0.32 | 0.42 |
| Ramachandran plot | ||||
| Favored (%) | 95.77 | 95.82 | 95.91 | 95.82 |
| Allowed (%) | 4.23 | 4.18 | 4.09 | 4.18 |
| Disallowed (%) | 0.00 | 0.00 | 0.00 | 0.00 |
Percent of particles in final reconstitution compared to after 2D classification
Acknowledgements:
We thank Rico Cabuco and Leah Baxter for baculovirus production, and all members of the Hibbs Lab for discussion. Single-particle cryo-EM data were collected at the University of Texas Southwestern Medical Center Cryo-Electron Microscopy Facility, which is supported by the CPRIT Core Facility Support Award RP170644, at the Harvard Cryo-Electron Microscopy Center for Structural Biology, and at the Pacific Northwest Cryo-EM Center at Oregon Health & Science University, which is supported by NIH grant U24GM129547, accessed through EMSL (grid.436923.9) a DOE office of Science User Facility sponsored by the Office of Biological and Environmental Research. Computational resources were provided by the Swedish National Infrastructure for Computing. J.J.K and S.Z. acknowledge support from the American Heart Association grants 20POST35200127 and 18POST34030412, respectively. This work was supported by Vetenskapsrådet VR and the Knut and Alice Wallenberg foundation to E.L. and by The Welch Foundation (I-1812) and grants from the NIH (DA037492, DA042072, and NS095899) to R.E.H.
Footnotes
Declaration of interests: The authors declare no competing interests.
Supplementary information is available.
References
- 1.Hemmings HC Jr. et al. Emerging molecular mechanisms of general anesthetic action. Trends Pharmacol Sci 26, 503–510, doi: 10.1016/j.tips.2005.08.006 (2005). [DOI] [PubMed] [Google Scholar]
- 2.Forman SA & Miller KW Mapping General Anesthetic Sites in Heteromeric gamma-Aminobutyric Acid Type A Receptors Reveals a Potential For Targeting Receptor Subtypes. Anesth Analg 123, 1263–1273, doi: 10.1213/ANE.0000000000001368 (2016). [DOI] [PMC free article] [PubMed] [Google Scholar]
- 3.Sieghart W & Savic MM International Union of Basic and Clinical Pharmacology. CVI: GABAA Receptor Subtype- and Function-selective Ligands: Key Issues in Translation to Humans. Pharmacol Rev 70, 836–878, doi: 10.1124/pr.117.014449 (2018). [DOI] [PubMed] [Google Scholar]
- 4.Sigel E & Ernst M The Benzodiazepine Binding Sites of GABAA Receptors. Trends Pharmacol Sci 39, 659–671, doi: 10.1016/j.tips.2018.03.006 (2018). [DOI] [PubMed] [Google Scholar]
- 5.Olsen RW GABAA receptor: Positive and negative allosteric modulators. Neuropharmacology 136, 10–22, doi: 10.1016/j.neuropharm.2018.01.036 (2018). [DOI] [PMC free article] [PubMed] [Google Scholar]
- 6.Meyer H Welche Eigenschaft der Anasthetica bedingt ihre narkotische Wirkung? Naunyn-Schmiedebergs Arch Exp Path Pharmakol 42, 109–118 (1899). [Google Scholar]
- 7.Meyer H Zur Theorie der Alkolnarkose: der Einfluss wechselnder Temperatur auf Wirkungsstarke und Theilungscoefficient der Narcotica. Naunyn-Schmiedebergs Arch Exp Path Pharmakol 46, 338–346 (1901). [Google Scholar]
- 8.Overton E Studien über die Narkose Zugleich ein Beitrag zur allgemeinen Pharmakologie. (Gustav Fischer, 1901).
- 9.Janoff AS, Pringle MJ & Miller KW Correlation of general anesthetic potency with solubility in membranes. Biochim Biophys Acta 649, 125–128, doi: 10.1016/0005-2736(81)90017-1 (1981). [DOI] [PubMed] [Google Scholar]
- 10.Franks NP & Lieb WR Molecular and cellular mechanisms of general anaesthesia. Nature 367, 607–614, doi: 10.1038/367607a0 (1994). [DOI] [PubMed] [Google Scholar]
- 11.Krasowski MD & Harrison NL General anaesthetic actions on ligand-gated ion channels. Cell Mol Life Sci 55, 1278–1303, doi: 10.1007/s000180050371 (1999). [DOI] [PMC free article] [PubMed] [Google Scholar]
- 12.Krasowski MD Contradicting a unitary theory of general anesthetic action: a history of three compounds from 1901 to 2001. Bull Anesth Hist 21, 1, 4–8, 21 passim, doi: 10.1016/s1522-8649(03)50031-2 (2003). [DOI] [PMC free article] [PubMed] [Google Scholar]
- 13.Mihic SJ et al. Sites of alcohol and volatile anaesthetic action on GABA(A) and glycine receptors. Nature 389, 385–389, doi: 10.1038/38738 (1997). [DOI] [PubMed] [Google Scholar]
- 14.Drexler B, Antkowiak B, Engin E & Rudolph U Identification and characterization of anesthetic targets by mouse molecular genetics approaches. Can J Anaesth 58, 178–190, doi: 10.1007/s12630-010-9414-1 (2011). [DOI] [PMC free article] [PubMed] [Google Scholar]
- 15.Walters RJ, Hadley SH, Morris KD & Amin J Benzodiazepines act on GABAA receptors via two distinct and separable mechanisms. Nat Neurosci 3, 1274–1281, doi: 10.1038/81800 (2000). [DOI] [PubMed] [Google Scholar]
- 16.Middendorp SJ, Maldifassi MC, Baur R & Sigel E Positive modulation of synaptic and extrasynaptic GABAA receptors by an antagonist of the high affinity benzodiazepine binding site. Neuropharmacology 95, 459–467, doi: 10.1016/j.neuropharm.2015.04.027 (2015). [DOI] [PubMed] [Google Scholar]
- 17.Votey SR, Bosse GM, Bayer MJ & Hoffman JR Flumazenil: a new benzodiazepine antagonist. Ann Emerg Med 20, 181–188, doi: 10.1016/s0196-0644(05)81219-3 (1991). [DOI] [PubMed] [Google Scholar]
- 18.Laverty D et al. Cryo-EM structure of the human alpha1beta3gamma2 GABAA receptor in a lipid bilayer. Nature 565, 516–520, doi: 10.1038/s41586-018-0833-4 (2019). [DOI] [PMC free article] [PubMed] [Google Scholar]
- 19.Masiulis S et al. GABAA receptor signalling mechanisms revealed by structural pharmacology. Nature 565, 454–459, doi: 10.1038/s41586-018-0832-5 (2019). [DOI] [PMC free article] [PubMed] [Google Scholar]
- 20.Loscher W & Rogawski MA How theories evolved concerning the mechanism of action of barbiturates. Epilepsia 53 Suppl 8, 12–25, doi: 10.1111/epi.12025 (2012). [DOI] [PubMed] [Google Scholar]
- 21.Zhu S et al. Structure of a human synaptic GABAA receptor. Nature 559, 67–72, doi: 10.1038/s41586-018-0255-3 (2018). [DOI] [PMC free article] [PubMed] [Google Scholar]
- 22.Gielen M, Barilone N & Corringer P-J The desensitization pathway of GABAA receptors, one subunit at a time. bioRxiv (2020). [DOI] [PMC free article] [PubMed] [Google Scholar]
- 23.Chiara DC et al. Specificity of intersubunit general anesthetic-binding sites in the transmembrane domain of the human alpha1beta3gamma2 gamma-aminobutyric acid type A (GABAA) receptor. J Biol Chem 288, 19343–19357, doi: 10.1074/jbc.M113.479725 (2013). [DOI] [PMC free article] [PubMed] [Google Scholar]
- 24.Zeller A, Arras M, Jurd R & Rudolph U Identification of a molecular target mediating the general anesthetic actions of pentobarbital. Mol Pharmacol 71, 852–859, doi: 10.1124/mol.106.030049 (2007). [DOI] [PubMed] [Google Scholar]
- 25.Belelli D, Callachan H, Hill-Venning C, Peters JA & Lambert JJ Interaction of positive allosteric modulators with human and Drosophila recombinant GABA receptors expressed in Xenopus laevis oocytes. Br J Pharmacol 118, 563–576, doi: 10.1111/j.1476-5381.1996.tb15439.x (1996). [DOI] [PMC free article] [PubMed] [Google Scholar]
- 26.Vuyk J, Sitsen E & Reekers M in Miller’s Anesthesia (ed Gropper MA) (Elsevier, 2020). [Google Scholar]
- 27.Forman SA Clinical and molecular pharmacology of etomidate. Anesthesiology 114, 695–707, doi: 10.1097/ALN.0b013e3181ff72b5 (2011). [DOI] [PMC free article] [PubMed] [Google Scholar]
- 28.Belelli D, Lambert JJ, Peters JA, Wafford K & Whiting PJ The interaction of the general anesthetic etomidate with the gamma-aminobutyric acid type A receptor is influenced by a single amino acid. Proc Natl Acad Sci U S A 94, 11031–11036, doi: 10.1073/pnas.94.20.11031 (1997). [DOI] [PMC free article] [PubMed] [Google Scholar]
- 29.Siegwart R, Jurd R & Rudolph U Molecular determinants for the action of general anesthetics at recombinant alpha(2)beta(3)gamma(2)gamma-aminobutyric acid(A) receptors. J Neurochem 80, 140–148, doi: 10.1046/j.0022-3042.2001.00682.x (2002). [DOI] [PubMed] [Google Scholar]
- 30.Li GD et al. Identification of a GABAA receptor anesthetic binding site at subunit interfaces by photolabeling with an etomidate analog. J Neurosci 26, 11599–11605, doi: 10.1523/JNEUROSCI.3467-06.2006 (2006). [DOI] [PMC free article] [PubMed] [Google Scholar]
- 31.Krasowski MD et al. Propofol and other intravenous anesthetics have sites of action on the gamma-aminobutyric acid type A receptor distinct from that for isoflurane. Mol Pharmacol 53, 530–538, doi: 10.1124/mol.53.3.530 (1998). [DOI] [PubMed] [Google Scholar]
- 32.Jayakar SS et al. Multiple propofol-binding sites in a gamma-aminobutyric acid type A receptor (GABAAR) identified using a photoreactive propofol analog. J Biol Chem 289, 27456–27468, doi: 10.1074/jbc.M114.581728 (2014). [DOI] [PMC free article] [PubMed] [Google Scholar]
- 33.Bali M & Akabas MH Gating-induced conformational rearrangement of the gamma-aminobutyric acid type A receptor beta-alpha subunit interface in the membrane-spanning domain. J Biol Chem 287, 27762–27770, doi: 10.1074/jbc.M112.363341 (2012). [DOI] [PMC free article] [PubMed] [Google Scholar]
- 34.Jayakar SS et al. Identifying Drugs that Bind Selectively to Intersubunit General Anesthetic Sites in the alpha1beta3gamma2 GABAAR Transmembrane Domain. Mol Pharmacol 95, 615–628, doi: 10.1124/mol.118.114975 (2019). [DOI] [PMC free article] [PubMed] [Google Scholar]
- 35.Yip GM et al. A propofol binding site on mammalian GABAA receptors identified by photolabeling. Nat Chem Biol 9, 715–720, doi: 10.1038/nchembio.1340 (2013). [DOI] [PMC free article] [PubMed] [Google Scholar]
- 36.Jurd R et al. General anesthetic actions in vivo strongly attenuated by a point mutation in the GABA(A) receptor beta3 subunit. FASEB J 17, 250–252, doi: 10.1096/fj.02-0611fje (2003). [DOI] [PubMed] [Google Scholar]
- 37.Reynolds DS et al. Sedation and anesthesia mediated by distinct GABA(A) receptor isoforms. J Neurosci 23, 8608–8617 (2003). [DOI] [PMC free article] [PubMed] [Google Scholar]
- 38.Chiara DC et al. Mapping general anesthetic binding site(s) in human alpha1beta3 gamma-aminobutyric acid type A receptors with [(3)H]TDBzl-etomidate, a photoreactive etomidate analogue. Biochemistry 51, 836–847, doi: 10.1021/bi201772m (2012). [DOI] [PMC free article] [PubMed] [Google Scholar]
- 39.Krasowski MD, Hong X, Hopfinger AJ & Harrison NL 4D-QSAR analysis of a set of propofol analogues: mapping binding sites for an anesthetic phenol on the GABA(A) receptor. J Med Chem 45, 3210–3221, doi: 10.1021/jm010461a (2002). [DOI] [PMC free article] [PubMed] [Google Scholar]
- 40.Krasowski MD, Nishikawa K, Nikolaeva N, Lin A & Harrison NL Methionine 286 in transmembrane domain 3 of the GABAA receptor beta subunit controls a binding cavity for propofol and other alkylphenol general anesthetics. Neuropharmacology 41, 952–964, doi: 10.1016/s0028-3908(01)00141-1 (2001). [DOI] [PMC free article] [PubMed] [Google Scholar]
- 41.Eaton MM et al. Multiple Non-Equivalent Interfaces Mediate Direct Activation of GABAA Receptors by Propofol. Curr Neuropharmacol 14, 772–780, doi: (2016). [DOI] [PMC free article] [PubMed] [Google Scholar]
- 42.Ritchie TK et al. Chapter 11 - Reconstitution of membrane proteins in phospholipid bilayer nanodiscs. Methods Enzymol 464, 211–231, doi: 10.1016/S0076-6879(09)64011-8 (2009). [DOI] [PMC free article] [PubMed] [Google Scholar]
- 43.Damgen MA & Biggin PC A Refined Open State of the Glycine Receptor Obtained via Molecular Dynamics Simulations. Structure 28, 130–139 e132, doi: 10.1016/j.str.2019.10.019 (2020). [DOI] [PMC free article] [PubMed] [Google Scholar]
- 44.Gielen M, Thomas P & Smart TG The desensitization gate of inhibitory Cys-loop receptors. Nat Commun 6, 6829, doi: 10.1038/ncomms7829 (2015). [DOI] [PMC free article] [PubMed] [Google Scholar]
- 45.Dahaba AA et al. Effect of flumazenil on bispectral index monitoring in unpremedicated patients. Anesthesiology 110, 1036–1040, doi: 10.1097/ALN.0b013e31819db2c4 (2009). [DOI] [PubMed] [Google Scholar]
- 46.Safavynia SA et al. Effects of gamma-Aminobutyric Acid Type A Receptor Modulation by Flumazenil on Emergence from General Anesthesia. Anesthesiology 125, 147–158, doi: 10.1097/ALN.0000000000001134 (2016). [DOI] [PMC free article] [PubMed] [Google Scholar]
- 47.Ueno S, Bracamontes J, Zorumski C, Weiss DS & Steinbach JH Bicuculline and gabazine are allosteric inhibitors of channel opening of the GABAA receptor. J Neurosci 17, 625–634 (1997). [DOI] [PMC free article] [PubMed] [Google Scholar]
- 48.Baumann SW, Baur R & Sigel E Individual properties of the two functional agonist sites in GABA(A) receptors. J Neurosci 23, 11158–11166 (2003). [DOI] [PMC free article] [PubMed] [Google Scholar]
- 49.Rosen A, Bali M, Horenstein J & Akabas MH Channel opening by anesthetics and GABA induces similar changes in the GABAA receptor M2 segment. Biophys J 92, 3130–3139, doi: 10.1529/biophysj.106.094490 (2007). [DOI] [PMC free article] [PubMed] [Google Scholar]
- 50.Phulera S et al. Cryo-EM structure of the benzodiazepine-sensitive alpha1beta1gamma2S tri-heteromeric GABAA receptor in complex with GABA. Elife 7, doi: 10.7554/eLife.39383 (2018). [DOI] [PMC free article] [PubMed] [Google Scholar]
- 51.Miller PSM,S; Malinauskas T; Kotecha A; Rao S; Chavali S; Colibus LD; Pardon E; Hannan S; Scott S; Sun Z; Frenz B; Klesse G; Li S; Diprose JM; Siebert CA; Esnouf RM; DiMaio F; Tucker SJ; Smart TG; Steyaert J; Badu MM; Sansom MSP; Huiskonen JT; Aricescu AR Heteromeric GABAA receptor structures in positively-modulated active states. BioRxiv, doi: 10.1101/338343 (2018). [DOI] [Google Scholar]
- 52.Ingolfsson HI et al. Computational Lipidomics of the Neuronal Plasma Membrane. Biophys J 113, 2271–2280, doi: 10.1016/j.bpj.2017.10.017 (2017). [DOI] [PMC free article] [PubMed] [Google Scholar]
- 53.Periole X & Marrink SJ The Martini coarse-grained force field. Methods Mol Biol 924, 533–565, doi: 10.1007/978-1-62703-017-5_20 (2013). [DOI] [PubMed] [Google Scholar]
- 54.Nury H et al. X-ray structures of general anaesthetics bound to a pentameric ligand-gated ion channel. Nature 469, 428–431, doi: 10.1038/nature09647 (2011). [DOI] [PubMed] [Google Scholar]
- 55.Fourati Z et al. Structural Basis for a Bimodal Allosteric Mechanism of General Anesthetic Modulation in Pentameric Ligand-Gated Ion Channels. Cell Rep 23, 993–1004, doi: 10.1016/j.celrep.2018.03.108 (2018). [DOI] [PubMed] [Google Scholar]
- 56.Hibbs RE & Gouaux E Principles of activation and permeation in an anion-selective Cys-loop receptor. Nature 474, 54–60, doi: 10.1038/nature10139 (2011). [DOI] [PMC free article] [PubMed] [Google Scholar]
- 57.Essmann U et al. A smooth particle mesh Ewald method. The Journal of Chemical Physics 103, 8577–8593, doi: 10.1063/1.470117 (1995). [DOI] [Google Scholar]
- 58.Kim JH et al. High cleavage efficiency of a 2A peptide derived from porcine teschovirus-1 in human cell lines, zebrafish and mice. PLoS One 6, e18556, doi: 10.1371/journal.pone.0018556 (2011). [DOI] [PMC free article] [PubMed] [Google Scholar]
- 59.Morales-Perez CL, Noviello CM & Hibbs RE Manipulation of Subunit Stoichiometry in Heteromeric Membrane Proteins. Structure 24, 797–805, doi: 10.1016/j.str.2016.03.004 (2016). [DOI] [PMC free article] [PubMed] [Google Scholar]
- 60.Lyons JA, Boggild A, Nissen P & Frauenfeld J Saposin-Lipoprotein Scaffolds for Structure Determination of Membrane Transporters. Methods Enzymol 594, 85–99, doi: 10.1016/bs.mie.2017.06.035 (2017). [DOI] [PubMed] [Google Scholar]
- 61.Zivanov J et al. New tools for automated high-resolution cryo-EM structure determination in RELION-3. Elife 7, doi: 10.7554/eLife.42166 (2018). [DOI] [PMC free article] [PubMed] [Google Scholar]
- 62.Zheng SQ et al. MotionCor2: anisotropic correction of beam-induced motion for improved cryo-electron microscopy. Nat Methods 14, 331–332, doi: 10.1038/nmeth.4193 (2017). [DOI] [PMC free article] [PubMed] [Google Scholar]
- 63.Zhang K Gctf: Real-time CTF determination and correction. J Struct Biol 193, 1–12, doi: 10.1016/j.jsb.2015.11.003 (2016). [DOI] [PMC free article] [PubMed] [Google Scholar]
- 64.Rohou A & Grigorieff N CTFFIND4: Fast and accurate defocus estimation from electron micrographs. J Struct Biol 192, 216–221, doi: 10.1016/j.jsb.2015.08.008 (2015). [DOI] [PMC free article] [PubMed] [Google Scholar]
- 65.Wagner T et al. SPHIRE-crYOLO is a fast and accurate fully automated particle picker for cryo-EM. Commun Biol 2, 218, doi: 10.1038/s42003-019-0437-z (2019). [DOI] [PMC free article] [PubMed] [Google Scholar]
- 66.Bai XC, Rajendra E, Yang G, Shi Y & Scheres SH Sampling the conformational space of the catalytic subunit of human gamma-secretase. Elife 4, doi: 10.7554/eLife.11182 (2015). [DOI] [PMC free article] [PubMed] [Google Scholar]
- 67.Kucukelbir A, Sigworth FJ & Tagare HD Quantifying the local resolution of cryo-EM density maps. Nat Methods 11, 63–65, doi: 10.1038/nmeth.2727 (2014). [DOI] [PMC free article] [PubMed] [Google Scholar]
- 68.Schwede T, Kopp J, Guex N & Peitsch MC SWISS-MODEL: An automated protein homology-modeling server. Nucleic Acids Res 31, 3381–3385 (2003). [DOI] [PMC free article] [PubMed] [Google Scholar]
- 69.Miller PS & Aricescu AR Crystal structure of a human GABAA receptor. Nature 512, 270–275, doi: 10.1038/nature13293 (2014). [DOI] [PMC free article] [PubMed] [Google Scholar]
- 70.Pettersen EF et al. UCSF Chimera--a visualization system for exploratory research and analysis. J Comput Chem 25, 1605–1612, doi: 10.1002/jcc.20084 (2004). [DOI] [PubMed] [Google Scholar]
- 71.Emsley P, Lohkamp B, Scott WG & Cowtan K Features and development of Coot. Acta Crystallogr D Biol Crystallogr 66, 486–501, doi: 10.1107/S0907444910007493 (2010). [DOI] [PMC free article] [PubMed] [Google Scholar]
- 72.Adams PD et al. PHENIX: a comprehensive Python-based system for macromolecular structure solution. Acta Crystallogr D Biol Crystallogr 66, 213–221, doi: 10.1107/S0907444909052925 (2010). [DOI] [PMC free article] [PubMed] [Google Scholar]
- 73.Laskowski RA & Swindells MB LigPlot+: multiple ligand-protein interaction diagrams for drug discovery. J Chem Inf Model 51, 2778–2786, doi: 10.1021/ci200227u (2011). [DOI] [PubMed] [Google Scholar]
- 74.Krissinel E & Henrick K Inference of macromolecular assemblies from crystalline state. J Mol Biol 372, 774–797, doi: 10.1016/j.jmb.2007.05.022 (2007). [DOI] [PubMed] [Google Scholar]
- 75.Smart OS, Neduvelil JG, Wang X, Wallace BA & Sansom MS HOLE: a program for the analysis of the pore dimensions of ion channel structural models. J Mol Graph 14, 354–360, 376, doi: 10.1016/s0263-7855(97)00009-x (1996). [DOI] [PubMed] [Google Scholar]
- 76.Pei J, Kim BH & Grishin NV PROMALS3D: a tool for multiple protein sequence and structure alignments. Nucleic Acids Res 36, 2295–2300, doi: 10.1093/nar/gkn072 (2008). [DOI] [PMC free article] [PubMed] [Google Scholar]
- 77.Morin A et al. Collaboration gets the most out of software. Elife 2, e01456, doi: 10.7554/eLife.01456 (2013). [DOI] [PMC free article] [PubMed] [Google Scholar]
- 78.Jo S, Kim T, Iyer VG & Im W CHARMM-GUI: a web-based graphical user interface for CHARMM. J Comput Chem 29, 1859–1865, doi: 10.1002/jcc.20945 (2008). [DOI] [PubMed] [Google Scholar]
- 79.Abraham MJ et al. GROMACS: High performance molecular simulations through multi-level parallelism from laptops to supercomputers. SoftwareX 1-2, 19–25, doi: 10.1016/j.softx.2015.06.001 (2015). [DOI] [Google Scholar]
- 80.Wassenaar TA, Pluhackova K, Bockmann RA, Marrink SJ & Tieleman DP Going Backward: A Flexible Geometric Approach to Reverse Transformation from Coarse Grained to Atomistic Models. J Chem Theory Comput 10, 676–690, doi: 10.1021/ct400617g (2014). [DOI] [PubMed] [Google Scholar]
- 81.Best RB et al. Optimization of the additive CHARMM all-atom protein force field targeting improved sampling of the backbone phi, psi and side-chain chi(1) and chi(2) dihedral angles. J Chem Theory Comput 8, 3257–3273, doi: 10.1021/ct300400x (2012). [DOI] [PMC free article] [PubMed] [Google Scholar]
- 82.Vanommeslaeghe K et al. CHARMM general force field: A force field for drug-like molecules compatible with the CHARMM all-atom additive biological force fields. Journal of Computational Chemistry 31, 671–690, doi: 10.1002/jcc.21367 (2010). [DOI] [PMC free article] [PubMed] [Google Scholar]
- 83.Bussi G, Donadio D & Parrinello M Canonical sampling through velocity rescaling. J Chem Phys 126, 014101, doi: 10.1063/1.2408420 (2007). [DOI] [PubMed] [Google Scholar]
- 84.Parrinello M & Rahman A Crystal structure and pair potentials: A molecular-dynamics study. Phys. Rev. Lett 45, 1196–1199, doi: 10.1103/PhysRevLett.45.1196 (1980). [DOI] [Google Scholar]
- 85.Hess B P-LINCS: A Parallel Linear Constraint Solver for Molecular Simulation. J Chem Theory Comput 4, 116–122, doi: 10.1021/ct700200b (2008). [DOI] [PubMed] [Google Scholar]
- 86.Humphrey W, Dalke A & Schulten K VMD: visual molecular dynamics. J Mol Graph 14, 33–38, 27–38, doi: 10.1016/0263-7855(96)00018-5 (1996). [DOI] [PubMed] [Google Scholar]
- 87.Michaud-Agrawal N, Denning EJ, Woolf TB & Beckstein O MDAnalysis: a toolkit for the analysis of molecular dynamics simulations. J Comput Chem 32, 2319–2327, doi: 10.1002/jcc.21787 (2011). [DOI] [PMC free article] [PubMed] [Google Scholar]
- 88.McGibbon RT et al. MDTraj: A Modern Open Library for the Analysis of Molecular Dynamics Trajectories. Biophys J 109, 1528–1532, doi: 10.1016/j.bpj.2015.08.015 (2015). [DOI] [PMC free article] [PubMed] [Google Scholar]
- 89.Orellana L, Yoluk O, Carrillo O, Orozco M & Lindahl E Prediction and validation of protein intermediate states from structurally rich ensembles and coarse-grained simulations. Nat Commun 7, 12575, doi: 10.1038/ncomms12575 (2016). [DOI] [PMC free article] [PubMed] [Google Scholar]
- 90.Lindahl V, Gourdon P, Andersson M & Hess B Permeability and ammonia selectivity in aquaporin TIP2;1: linking structure to function. Sci Rep 8, 2995, doi: 10.1038/s41598-018-21357-2 (2018). [DOI] [PMC free article] [PubMed] [Google Scholar]
Associated Data
This section collects any data citations, data availability statements, or supplementary materials included in this article.
Supplementary Materials
Data Availability Statement
Atomic model coordinates for bicuculline methbromide, GABA + propofol, GABA + flumazenil, GABA + etomidate, GABA + phenobarbital, GABA + diazepam, GABA, and GABA + picrotoxin–bound structures have been deposited in the Protein Data Bank with accession codes 6X3S, 6X3T, 6X3U, 6X3V, 6X3W, 6X3X, 6X3Z and 6X40, respectively, and the cryo-EM density maps have been deposited in the Electron Microscopy Data Bank with accession codes EMD-22031, EMD-22032, EMD-22033, EMD-22034, EMD-22035, EMD-22036, EMD-22037 and EMD-22038, respectively.


