

Summary
Cell transplantation into immunodeficient recipients is a widely used approach to study stem cell and cancer biology; however, studying cell states post transplantation in vivo is inconvenient in mammals. Here, we generated a foxn1/Casper mutant zebrafish that is transparent and exhibits T cell deficiency. By employing the line for hematopoietic stem cell (HSC) transplantation (HSCT), we could achieve nonconditioned transplantation. Meanwhile, we found that fetal HSCs from 3 days post fertilization zebrafish embryos produce a better transplant outcome in foxn1/Casper mutants, compared with adult HSCs. In addition to HSCT, the foxn1/Casper mutant is feasible for allografts of myelodysplastic syndrome-like and muscle cells, as well as xenografts of medaka muscle cells. In summary, foxn1/Casper mutants permit the nonconditioned engraftment of multiple cell types and visualized characterization of transplanted cells in vivo.
Keywords: foxn1/Casper mutant, nonconditioned cell transplantation, hematopoietic stem cells, xenograft, zebrafish
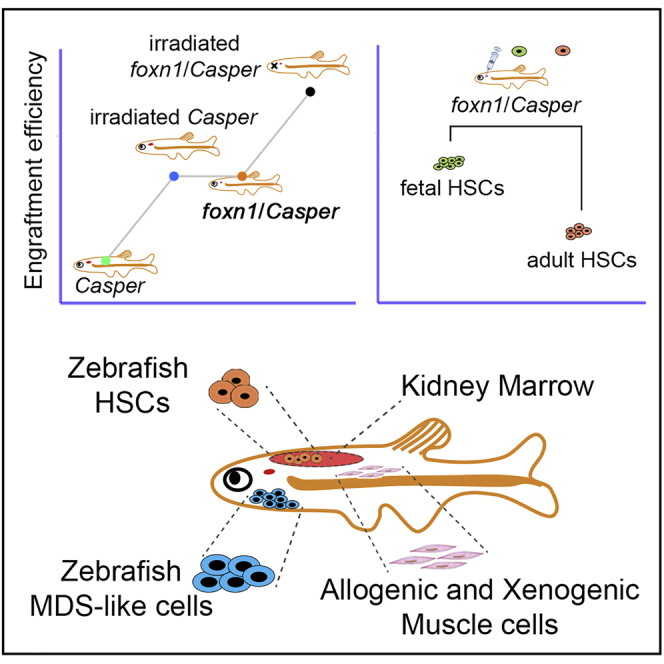
Graphical Abstract
Highlights
-
•
foxn1/Casper mutant zebrafish permit unconditioned and visualized cell transplantation
-
•
Zebrafish fetal HSCs possess more robust engraftment ability than adult HSCs
-
•
foxn1/Casper mutant zebrafish permit allogeneic MDS-like cell transplantation
-
•
Allograft and xenograft of muscle cells can be monitored in foxn1/Casper mutant zebrafish
In this article, Liu and colleagues generated a foxn1/Casper mutant zebrafish line with immunodeficiency and transparency to permit allograft and xenograft of normal and malignant cells without preconditioning. In addition, they evaluated the engraftment efficiency of HSCs from different developmental stages in foxn1/Casper recipients. Additional applications included the engraftment of MDS-like cells and xenogenic medaka muscle cells.
Introduction
Cell transplantation is a well-established method to study various biological events in development, immunology, cancer biology, and regenerative medicine (Li et al., 2011; Moore and Langenau, 2016; Trounson and McDonald, 2015). Hematopoietic stem cell (HSC) transplantation (HSCT) is a widely used paradigm of cell transplantation to study HSC properties and treat patients with hematological malignancies in current clinical therapy settings (Barriga et al., 2012; Jill et al., 2011; Mantel et al., 2015). Given that the unmatched polymorphic major histocompatibility between donors and recipients can result in noneffective HSCT (Tay et al., 1995; Thomas et al., 1971), studying the relationship between donors and recipients has long been regarded as a central issue in this field (Becker et al., 1963; Wu et al., 1967). Initially, irradiated mice and zebrafish were used to receive engrafted HSCs, because irradiation was able to suppress immune rejection and cleared the endogenous HSC compartment for the engraftment of donor HSCs in recipients (Traver et al., 2004). However, irradiation not only eliminates the immune cells, but also damages the HSC niche (Kapp et al., 2018; Zhou et al., 2017), which is required for successful reconstitution of the hematopoietic system. Therefore, immunodeficient recipients, such as forkhead box N1 (Foxn1)-null mice (nude mice) (Fogh et al., 1977) and nonobese diabetic, DNA-activated catalytic peptide-null, interleukin receptor 2 gamma chain-null mice (NSG mice) (Shultz et al., 2007), were generated for allograft and xenograft of HSCs and solid tumor cells. Although the immunodeficient mouse models have been extensively utilized for cell transplantation, it is still not convenient to directly observe the transplanted cells in real time in vivo.
The zebrafish has been an excellent vertebrate model for cell transplantation, owing to the generation of a transparent adult zebrafish, Casper, which allows for direct observation of fluorescence-labeled cells post transplantation (White et al., 2008). Through outcrossing of Casper with immunodeficient lines, several transplantation platforms in zebrafish have been established and applied to allograft or xenograft of normal and malignant cancer cells (Moore et al., 2016; Yan et al., 2019). However, these studies were limited in what they revealed of the stage-dependent characteristics of developmental cells. Our previous study demonstrated that zebrafish embryos with the foxn1 mutation displayed deficient T cell development, largely due to deficient thymic epithelial cell development (Ma et al., 2012). Therefore, we asked whether foxn1/Casper mutant zebrafish could be used as recipients for studying stage-specific characteristics of developmental cells and identifying optimized transplantation strategies.
In this study, we describe a foxn1/Casper mutant zebrafish, a new type of transparent and immunodeficient line, which can be used as recipients for HSCT without irradiation. In addition, our newly generated homozygous foxn1/Casper mutants exhibited a higher survival rate, and the female homozygous foxn1/Casper mutants are fertile compared with previously reported immunodeficient lines, such as rag2−/− (Tang et al., 2014) and prkdc−/− (Moore et al., 2016). Because of these complementary advantages of foxn1/Casper models, we can perform large-scale transplantation experiments. More importantly, the foxn1/Casper mutant line permits real-time visualization of transplanted cells in vivo. With the help of this mutant line, we uncovered the important characteristics of HSCs post transplantation and provided a new tool for studying the function of HSCs.
Results
Generation and Characterization of foxn1 Mutant Zebrafish
Previously, nude mice with the Foxn1 mutation have been shown to be a convenient tool for HSCT and solid tumor cell transplantation (Fogh et al., 1977; Szadvari et al., 2016). To address whether zebrafish with the foxn1 mutation could be used as recipients for transplantation, we generated a foxn1 mutant zebrafish with the zinc finger nuclease technique (Kim et al., 2010). The 7 > 6 bp transition in the third exon of the foxn1 gene induced a frameshift mutation, which leads to a premature stop codon (Figures 1A, S1A, and S1B). To determine whether the mutation is missense in the mutant line, the Foxn1 protein in maternal-zygotic (MZ) mutants was detected, and the protein level was markedly decreased in the MZ mutants (Figures 1B and 1C). Consistently, quantitative real-time PCR (qRT-PCR) results also showed that the mRNA level of foxn1 was significantly decreased in the MZ mutants (Figure 1D). Compared with the wild-type (WT) or heterozygous siblings, the adult foxn1/Casper mutants are easily distinguished by their smaller body size, especially for the males (Figures S1C and S1D). Importantly, the survival rate of foxn1/Casper mutants can reach approximately 60% under nonantibiotic conditions and even 86% under antibiotic-supplemented conditions (Figure S1E).
Figure 1.

Generation and Characterization of foxn1 Mutant Zebrafish
(A) Schematics of foxn1 mutant DNA and protein sequences. The nucleotide sequence (top) shows that the wild-type (WT) sequence -TCTACAA- was mutated to -ATCAGC-, followed by the early termination of translation (bottom). The red letters denote the mutated protein sequence and red asterisk indicates the stop coding.
(B) The protein level of Foxn1 in 5 dpf WT and foxn1 mutant (foxn1−/−) embryos.
(C) Quantification of protein levels in (B) (mean ± SD, t test; ∗∗∗p < 0.001, n = 3 in each group).
(D) The foxn1 mRNA level in 5 dpf WT, foxn1+/−, and foxn1−/− embryos was detected by qRT-PCR (mean ± SD, one-way ANOVA, Tukey's; N.S., nonsignificant; ∗∗∗p < 0.001; n = 3 in each group).
(E) Whole-mount in situ hybridization data showing the developmental phenotype of early T cells, marked by rag1, ccr9a, and lck. The red circles and red arrows indicate the lateral and dorsal views of the thymus region, respectively. Scale bar, 100 μm.
(F) H&E staining of 3-month-old thymus sections. The blue arrows and dashed lines denote the thymus region. Original magnification: left (4×), right (10×). Scale bar, 100 μm.
(G) QRT-PCR analysis to detect the expression of differentiated hematopoietic cell markers in the kidney marrow (KM). T and B cell receptor rearrangement genes rag1 and rag2; mature T cell markers lck, tcra, and tcrb; mature B cell markers igm, igz, pax5, and cd37; natural killer cell marker il2rb; myeloid markers lyz and mpo (mean ± SD, t test; N.S., nonsignificant; ∗p < 0.05, ∗∗p < 0.01; n = 3 in each group).
(H) Flow-cytometric analysis of different blood cell types in adult WT, foxn1+/−, and foxn1−/− KMs. Each circle and percentage represents a different cell lineage (I, erythrocyte; II, myelocyte; III, lymphocyte; and IV, precursor). Total cell numbers in whole KMs are indicated (mean ± SD, n [WT] = 5, n [foxn1+/−] = 6, n [foxn1−/−] = 5).
(I) Quantification of different blood lineages in the KMs based on (H) (mean ± SD, one-way ANOVA, Tukey's; ∗p < 0.05, ∗∗∗p < 0.001; n [WT] = 4, n [foxn1+/−] = 5, n [foxn1−/−] = 3).
(J) Reverse-transcription PCR analysis of tcrb and igm rearrangements of KM cells in WT and foxn1 mutant. The variable (V) and constant (C) regions of tcrb transcripts and the variable H (VH) and constant mu (Cm) regions of igm transcripts were detected by specific primers. Elongation factor 1 alpha (elf1a) is a positive control. n (WT) = 2, n (foxn1−/−) = 6.
See also Figure S1.
Previous studies revealed T cell defects in mice and humans with the Foxn1 mutation (Romano et al., 2012). Moreover, our previous study also reported that defects in T cell development are readily observed in foxn1 knockdown zebrafish embryos (Ma et al., 2012). Thus, we first wondered whether T cell development was indeed affected in foxn1 mutant embryos. The expression of T cell related genes recombination activating 1 (rag1), chemokine (C-C motif) receptor 9a (ccr9a), and lymphocyte-specific protein-tyrosine kinase (lck) was decreased in the thymus of foxn1 mutant embryos (Figure 1E). Consistently, the number of rag2-dsRed+ cells was decreased in the thymus of foxn1 MZ mutant embryos at 5 days post fertilization (dpf) (Figure S1F). Histological analysis of 3-month-old adult zebrafish showed that the thymus was atrophic in foxn1 mutants compared with WT (Figure 1F). These results showed that T cell development and thymic structure were impaired after foxn1 deletion.
Next, we detected the expression level of differentiated hematopoietic cell markers in the kidney marrow (KM) of adult fish by qRT-PCR. Although the expression of the T and B cell receptor rearrangement genes rag1 and rag2 was not changed, the expression of mature T cell markers such as lck, T cell receptor α (tcra), and T cell receptor β (tcrb) was reduced significantly, whereas the expression of the mature B cell markers immunoglobulin heavy constant μ (igm), immunoglobulin heavy constant ζ (igz), paired box 5 (pax5), and CD37 molecule (cd37) was increased significantly (Figure 1G). Moreover, the natural killer (NK) cell marker interleukin-2 receptor β (il2rb) and the myelocyte markers lysozyme C (lyz) and myeloid-specific peroxidase (mpo) showed normal expression in foxn1 mutants, indicating that the NK cell and myelocyte differentiation was not altered upon loss of foxn1 (Figure 1G). Furthermore, we performed flow-cytometric analysis of KM, and the four major blood lineages (I, erythrocyte; II, myelocyte; III, lymphocyte; and IV, precursor) were distinguished by light scatter characteristics and morphology (Figures 1H and S1G) (Traver et al., 2003). The results revealed a marked reduction of lymphocyte number in foxn1 mutants compared with that in WT or heterozygous siblings (Figure 1I and Table S1). We further assessed the tcrb and igm rearrangements (Tang et al., 2014) and found that T cells in foxn1 mutants displayed incomplete tcrb rearrangements, while the igm rearrangements of B cells were not affected, indicating that the T cell receptor repertoire in foxn1 mutants is different from that of WT (Figure 1J). Taken together, similar to the impaired T cell development in nude mice, foxn1 mutant zebrafish also present T cell defects and thus might be suitable for cell transplantation.
Direct Imaging of Transplanted HSCs In Vivo Using foxn1/Casper Mutants
To assess whether the foxn1/Casper mutants serve as cell transplantation recipients properly, HSCT (Pugach et al., 2009) was performed in Casper, 25-Gy-irradiated Casper, nonirradiated foxn1/Casper, and 15-Gy-irradiated foxn1/Casper recipients (Figure 2A). In brief, KM was isolated from 3-month-old Tg (CD41:GFP) zebrafish (Figure S2A) and dispersed in single-cell suspensions for cell sorting. Then, CD41-GFPlo HSCs (Ma et al., 2011) were confirmed under fluorescence microscopy (Figures S2B and S2C) and transplanted into recipients irradiated 2 days before. The effects of irradiation on survival rate were monitored dynamically under HSCT and non-HSCT conditions (Figures 2B and S2D and Table S2). At 2 h post transplantation, CD41-GFPlo cells were readily observed in the head and tail region (Figure S2E).
Figure 2.

foxn1/Casper Mutant Engrafts HSCs without Irradiation
(A) Schematic representation of the workflow of HSC transplantation. CD41-GFPlo cells were sorted from the KM of Tg (CD41:GFP), and 1 × 10⁴ CD41-GFPlo cells were injected into each recipient (Casper, 25-Gy-irradiated Casper, foxn1/Casper, and 15-Gy-irradiated foxn1/Casper).
(B) The survival rate of each recipient at 60 days post transplantation (dpt). The irradiated foxn1/Casper showed a low survival rate after transplantation (data presented as days-percentage survival, t test; ∗p < 0.05, ∗∗p < 0.01; n (CD41-GFPlo > Casper) = 10, n (CD41-GFPlo > irradiated Casper) = 19, n (CD41-GFPlo > foxn1/Casper) = 23, and n (CD41-GFPlo > irradiated foxn1/Casper) = 18).
(C) Imaging of representative recipients at 60 dpt. CD41-GFP+ cells could be visualized under a GFP field in the KM of nonirradiated foxn1/Casper mutant. The red dashed lines indicate the KM regions. n = 5; scale bar, 1 mm (kidney).
(D) Confocal imaging of engrafted CD41-GFP+ cells at 60 dpt in tail region. White arrows indicate the CD41-GFPhi and CD41-GFPlo cells (top), and two magnified pictures show the CD41-GFPhi and CD41-GFPlo cells, respectively (bottom). Scale bar, 100 μm (top), 10 μm (bottom).
(E) Representative flow-cytometric analysis of recipient KM at 60 dpt. The dots in the rectangles indicate engrafted CD41-GFP+ cells (mean ± SD, n [CD41-GFPlo > Casper] = 10, n [CD41-GFPlo > irradiated Casper] = 8, n [CD41-GFPlo > foxn1/Casper] = 8, and n [CD41-GFPlo > irradiated foxn1/Casper] = 4).
(F) The statistical analysis of (E) (mean ± SD, one-way ANOVA, Tukey's; N.S., nonsignificant; ∗p < 0.05, ∗∗p < 0.01).
See also Figure S2.
The engraftment efficiency of CD41-GFPlo HSCs was evaluated at 60 days post transplantation (dpt), and the GFP+ cells could be directly observed in the KM of foxn1/Casper mutants, but not in Casper recipients (Figure 2C). In addition, in the tail region, the individual CD41-GFPhi and CD41-GFPlo cells could be also visualized by confocal imaging (Figure 2D). Moreover, the flow-cytometric analysis showed that the engrafted CD41-GFP+ cells could be detected in recipient KM (Figure 2E). The analysis of the percentage of CD41-GFP+ cells in KM at 60 dpt showed that HSC engraftment efficiencies in irradiated Casper and nonirradiated foxn1/Casper mutants were comparable, but were both higher than that in Casper, indicating that the nonirradiated foxn1/Casper mutant recipient is feasible for HSCT (Figure 2F). Finally, to compare the lineage distributions in irradiated Casper and nonconditioned foxn1/Casper after HSCT, we performed HSCT with ubi-dsRed+/CD41-GFP+ cells. We found that the frequency of erythroid, myeloid, and precursor lineages, but not lymphocytes, in nonconditioned foxn1/Casper was comparable to that in irradiated Casper after transplantation, indicating that the lymphoid population failed to reestablish due to the defective thymus (Figures S2F and S2G). Taken together, the foxn1/Casper mutant without irradiation can be used to observe donor-derived cells in vivo post transplantation. Therefore, our following studies involved in cell transplantation employed Casper and nonirradiated foxn1/Casper mutants as recipients.
Fetal HSCs Possess More Robust Engraftment Ability Than Adult HSCs
Given that the fetal- and adult-derived HSCs displayed substantial differences in self-renewal, lineage distribution, and gene expression (Bowie et al., 2007), HSCs at different stages may have distinct transplant outcomes in clinical trials. To compare the engraftment abilities of HSCs derived from different developmental stages, we transplanted fetal HSCs (3 dpf trunk region) and adult KM HSCs (3 months post fertilization [mpf]) into adult Casper and foxn1/Casper mutants, respectively (Figure 3A). The fetal and adult ubi-dsRed+/CD41-GFPlo HSCs were harvested from Tg (ubi:dsRed/CD41:GFP) (Figure S3A). After transplantation of 1 × 10⁴ donor-derived ubi-dsRed+/CD41-GFPlo HSCs into corresponding recipients for 2 months, the transplant outcomes were evaluated (Table S3). The results showed that the percentage of fetal HSC-derived cells (ubi-dsRed+ cells) was significantly higher than that of adult HSC-derived cells (ubi-dsRed+ cells) in foxn1/Casper recipients (Figures 3B and 3C). We also analyzed the long-term transplantation outcomes of fetal and adult HSCs at 90 dpt, and the result showed a higher engraftment efficiency of fetal HSCs compared with adult HSCs (Figure S3B). Importantly, the percentage of fetal-derived ubi-dsRed+/CD41-GFP+ cells in recipient KM was higher than that of adult-derived cells, indicating a robust self-renewal ability of fetal HSCs (Figures 3D and 3E). However, the erythroid, myeloid, and lymphoid differentiation of engrafted fetal HSCs was comparable to that of adult HSCs (Figures S3B–S3D). Notably, zebrafish fetal HSCs showed higher engraftment efficiency than adult HSCs, which was consistent with previous findings in mouse (Arora et al., 2014; Bowie et al., 2007).
Figure 3.

The Comparison of Transplant Outcomes in Fetal and Adult HSCs
(A) A schematic of the fetal and adult HSC transplantation assay. Fetal and adult donor HSCs were derived from Tg (ubi:dsRed/CD41:GFP) at 3 dpf in the trunk region and 3 mpf in the KM region, respectively. Recipients were 3-month-old Casper and foxn1/Casper mutants.
(B) Flow-cytometric analysis of engrafted ubi-dsRed+ cells in the recipient KM at 60 dpt (mean ± SD; n [WT] = 5, n [fetal HSCs > Casper] = 6, n [fetal HSCs > foxn1/Casper] = 12, n [adult HSCs > Casper] = 7, and n [adult HSCs > foxn1/Casper] = 9).
(C) Statistical analysis of (B) (mean ± SD, two-way ANOVA, Tukey's; ∗∗p < 0.01, ∗∗∗p < 0.001).
(D) Flow-cytometric analysis of engrafted fetal and adult HSC in recipient KM (mean ± SD; n [WT] = 5, n [fetal HSCs > Casper] = 6, n [fetal HSCs > foxn1/Casper] = 12, n [adult HSCs > Casper] = 7, and n [adult HSCs > foxn1/Casper] = 9).
(E) The statistical analysis of engraftment efficiency in (D) (mean ± SD, two-way ANOVA, Tukey's; ∗∗p < 0.01, ∗∗∗p < 0.001).
(F) Heatmap analysis of selected genes based on transcriptome data of fetal and adult CD41-GFPlo cells.
(G) QRT-PCR analysis of the expression level of cell-cycle genes in fetal and adult CD41-GFPlo cells (mean ± SD, t test; N.S., nonsignificant; ∗p < 0.05, ∗∗p < 0.01; n = 3 in each group).
See also Figure S3.
To study the underlying mechanism, we analyzed our recent bulk RNA-sequencing (RNA-seq) data of sorted fetal and adult HSCs (Xue et al., 2019). The analytic results showed that 3,158 and 1,342 genes were upregulated and downregulated in fetal HSCs, respectively (Figures S3E and S3F). Heatmap analysis revealed that the expression of genes related to cell proliferation and cell-cycle progression in fetal HSCs was much higher than that in adult HSCs (Figure 3F). In addition, gene ontology analysis indicated that most upregulated genes were enriched in “cell cycle” and “cell division” terms (Figure S3G). To further validate this result, we detected the expression of cell-cycle genes in sorted fetal and adult CD41-GFPlo HSCs by qRT-PCR. Compared with adult HSCs, the fetal HSCs displayed higher expression levels of cell-cycle-promoting genes (ccna1, ccnb1, ccne, ccnd1, ccnh, cdk1, cdk2, ckd7, cdc20, and pcna), but lower expression levels of cell-cycle-inhibiting genes (cdkn1a and cdkn1b) (Figure 3G). Taken together, these results showed that fetal HSCs harbor stronger cell-cycle activity than adult HSCs, partially explaining why fetal HSCs exhibit higher engraftment efficiency than adult HSCs.
Allograft and Xenograft of Muscle Cells in foxn1/Casper Mutants
To study whether the foxn1/Casper mutants can engraft other cells than HSCs, we tried to transplant muscle cells into the mutants. First, zebrafish muscle cells were isolated from Tg (ubi:dsRed/fmyhc2:GFP) and transplanted into Casper and foxn1/Casper mutants by intramuscular injection. The ubi-dsRed+/fmyhc2-GFP+ cells could be detected at 15 and 30 dpt in foxn1/Casper mutants, but not in Casper recipients (Figures S4A–S4C). Moreover, the transplanted muscle cells could also be imaged at 60 dpt in foxn1/Casper recipients (Figure S4D). Collectively, the data showed that the foxn1/Casper mutant can engraft allogeneic muscle cells and serve as a great model for direct visualization of transplanted cells in vivo.
Given that the foxn1/Casper mutant is an efficient transplantation platform for allogeneic cells, we wondered whether the foxn1/Casper mutant is also suitable for xenograft. Medaka, which has a distant evolutionary relationship with zebrafish, was selected as a xenograft donor. Equivalent numbers of muscle cells derived from medaka Tg (ubi:mCherry) were transplanted into Casper and foxn1/Casper mutants, respectively. The results showed that the medaka mCherry+ muscle cells remained engrafted beyond 30 days and the muscle fibers could be observed directly (Figures S4E and S4F). Taken together, the results show that the foxn1/Casper mutant can be engrafted with medaka muscle, suggesting that it is a feasible tool for xenografting in future study.
Allograft of MDS-like Cells in foxn1/Casper Mutants
Cell transplantation has been applied to monitor the dynamic changes of malignant cells (Yan et al., 2019). To demonstrate whether the foxn1/Casper mutant permits the transplantation of malignant cells, we transplanted myelodysplastic syndrome-like (MDS-like) cells from adult Tg (cmybhyper:GFP) zebrafish (Liu et al., 2017). The MDS-like zebrafish were first selected based on their pathologic external features at 24 mpf (Figure 4A). Flow-cytometric analysis showed that the percentage of myelocytes in MDS-like zebrafish KM was significantly higher than that in WT (no transgenic background) and siblings, whereas other blood lineages showed a decrease in MDS-like zebrafish KM (Figures 4B and 4C), indicating a myelodysplasia phenotype. Next, KM cells were harvested from siblings and MDS-like zebrafish for transplantation. At 30 dpt, the MDS-like cmybhyper-GFP+ cells proliferated robustly in foxn1/Casper mutants, while they could not be detected in Casper recipients (Figure 4D). We also studied the survival of MDS-like cell-transplanted foxn1/Casper recipients, and the survival rates were 43.3% (26/60), 20% (12/60), and 8.3% (5/60) at 30, 45, and 60 dpt, respectively. To further characterize the MDS-like phenotype of the engrafted cells, we analyzed recipient KM and detected a significantly higher percentage of myelocytes in MDS-like cmybhyper-GFP+ cell-engrafted KM compared with that in sibling cmybhyper-GFP+ cell-engrafted KM (Figure 4E). Moreover, we performed cytological analysis of recipient KM using Wright-Giemsa staining, and the results showed that myelocytes exhibited enlarged cell size and increased cell granularity, which resembled the MDS-like phenotype (Figure 4F). These data suggest that foxn1/Casper mutants could be engrafted with allogeneic MDS-like cells.
Figure 4.

Allogeneic MDS-like Cell Transplantation with Tg (cmybhyper:GFP)
(A) The pathologic external features of zebrafish Tg (cmybhyper:GFP). Some of the transgenic zebrafish display MDS-like phenotypes (exophthalmos, cachexia, and abdominal mass). The red arrows denote diseased areas. Scale bar, 1 mm.
(B) Flow-cytometric analysis of 24-month-old WT (no transgenic background) and Tg (cmybhyper:GFP) KM. The representative percentages of myelocytes in WT, siblings, and MDS-like zebrafish are indicated. Total cell numbers in whole KM are indicated (mean ± SD; n [WT] = 3, n [siblings] = 7, n [MDS-like zebrafish] = 6).
(C) Statistical analysis of the percentage of different blood lineages in (B) (mean ± SD, one-way ANOVA, Tukey's; ∗p < 0.05, ∗∗p < 0.01, n [WT] = 3, n [siblings] = 7, n [MDS-like zebrafish] = 6).
(D) Direct observation of engrafted MDS-like cells. At 30 dpt, MDS-like cmybhyper-GFP+ cells could be visualized in foxn1/Casper recipient KM, not in the Casper. The red dashed lines indicate the KM regions. The red arrow indicates the engrafted MDS-like cmybhyper-GFP+ cells in the head. n (Casper) = 0/10, n (foxn1/Casper) = 9/12. Scale bar, 1 mm.
(E) Statistical analysis of the percentage of different blood lineages in MDS-like and sibling cmybhyper-GFP+ cell-engrafted KMs. The cmybhyper-GFP+ cells in recipient KM were gated for analysis (mean ± SD, t test; N.S., non-significant; ∗p < 0.05; n > 3 in each group).
(F) Wright-Giemsa staining of blood cells in recipient KM after MDS-like and sibling cmybhyper-GFP+ cell transplantation. The red arrows indicate the MDS-like myelocytes in recipients. Scale bar, 5 μm.
Discussion
Here we established a foxn1/Casper zebrafish mutant with the characteristics of immunodeficiency and optical transparency. By comparing the HSC engraftment efficiency of foxn1/Casper mutants with irradiated Casper and irradiated foxn1/Casper mutants, we found that the foxn1/Casper mutants displayed engraftment efficiency comparable to that of irradiated Casper. Although irradiated foxn1/Casper mutants exhibited the highest engraftment efficiency, their low survival rate makes them unsuitable for serving as recipients. Moreover, we found that fetal HSCs gave rise to higher transplant outcomes than adult HSCs, and the conserved transplant outcome of fetal HSCs between zebrafish and mice (Arora et al., 2014) demonstrated that fetal HSCs are more suitable for transplantation compared with adult HSCs. Furthermore, we could directly observe the transplanted MDS-like and muscle cells in real time in living foxn1/Casper mutants, which provides a potential platform to study therapeutic strategies for blood disease and solid tumors.
The engraftment ability is a gold standard for the functional evaluation of HSCs, and HSCT is a widely used approach for this purpose. In mammals, the donor HSCs used in primary HSCT are often from the adult bone marrow (BM). Later, fetal HSCs were also shown to be capable of long-term multilineage engraftment ability, yet the engraftment efficiency was low (Bertrand et al., 2005; North et al., 2002). Previous studies have compared the functional differences between fetal and adult HSCs and the results demonstrated that fetal HSCs reconstitute more efficiently than BM HSCs in adult recipients (Arora et al., 2014; Bowie et al., 2007). In the present study, we found that the engraftment efficiency of fetal HSCs was higher in adult recipients than that of adult HSCs, consistent with the finding in mice. According to our RNA-seq data and qRT-PCR results, the cell-cycle activity was much higher in fetal HSCs than in adult HSCs, indicating that the proliferating fetal HSCs are responsible for rapid reconstitution in HSCT. Taken together, these findings in zebrafish and mice might serve as a potential guideline in that fetal HSCs are a preferential choice for successful HSCT.
In adult zebrafish, the opaque features limit its application for direct imaging of cell migration and other behaviors in vivo. Therefore, the widely used pigmentation mutant Casper is an optimized model to overcome this obstacle. The in vivo cell tracing post transplantation can be realized using the foxn1/Casper mutant. In this work, we could easily observe the fluorescence-labeled hematopoietic cells at 60 dpt. Dynamic changes in hematopoietic and muscle cells could be visualized, supporting that tracing cell migration in live adult zebrafish is feasible. Furthermore, we demonstrated that the allogeneic MDS-like cells could engraft efficiently in this newly generated foxn1/Casper mutant, supporting that it would be useful for tumor cell engraftment in the future, such as muscle-cell-related human rhabdomyosarcoma and sarcoma and blood-cell-related human acute myeloid leukemia and acute lymphoid leukemia. More importantly, the medaka muscle cells engrafted successfully in foxn1/Casper mutants, which indicates that the foxn1/Casper mutant could be used as an optimized xenograft model like the nude mouse. Unexpectedly, when we performed mouse HSCT using foxn1/Casper mutants, there was no detection of successful engraftment. We reasoned that this might be due to the incomplete immune deficiency of this mutant (still retaining B and NK cells), the distinct HSC niche, or the unmatched physiological temperatures (Yan et al., 2019) between mice and zebrafish.
In summary, we have demonstrated that the foxn1/Casper mutant is a feasible model to permit transplantation of HSCs, muscle cells, and MDS-like cells without irradiation preconditioning. Given the immunodeficiency and transparency of the foxn1/Casper mutant, this model can be further applied to study the physiological and pathological events of normal and malignant cells in vivo.
Experimental Procedures
Zebrafish Lines
Zebrafish embryos were obtained via the natural spawning of adult zebrafish. Zebrafish adults were raised at 28.5°C in system water (conductivity at 500–550 μs/cm and pH at 7.0–7.5), and the Tg (rag2:dsRed) line was kindly provided by Zilong Wen (Hong Kong University of Science and Technology, Hong Kong, China); Tg (CD41:GFP) (Ma et al., 2011), Tg (cmybhyper:GFP) (Liu et al., 2017), Tg (fmyhc2:GFP) (Qiu et al., 2016), and Tg (ubi:loxP-dsRed-loxP-GFP) (here referred to Tg (ubi:dsRed)) lines (gifts from J.W. Xiong, Peking University, Beijing, China) were used as donors. The medaka Tg (ubi:mCherry) line (National BioResource Project, Medaka; unpublished) was used for xenografts. The foxn1/Casper mutant was obtained through outcrossing a foxn1 mutant with the Casper line (White et al., 2008). Casper, irradiated Casper, and foxn1/Casper were used as transplant recipients. Genotyped foxn1/Casper mutants and all the transplanted recipients were kept in sterilized fish water supplemented with penicillin (100 units/mL) and streptomycin (100 μg/mL) (Gibco, 15140122). The double-transgenic lines Tg (ubi:dsRed/CD41:GFP) and Tg (ubi:dsRed/fmyhc2:GFP) were obtained through outcrossing of single-transgenic lines. This study was approved by the Ethical Review Committee of the Institute of Zoology, Chinese Academy of Sciences, China.
Foxn1 Mutant Generation and Genotyping
Target-specific ZFN vectors for foxn1 (Genebank: BX663513) were designed and synthesized as previously described (Kim et al., 2010). The target site sequence was CCATCAGTCCTCTACAACACCA. ZFN vectors were linearized with PvuII and capped mRNAs were synthesized using T7 RNA polymerase. Two to three nanograms of ZFN mRNA was injected into one-cell-stage embryos. For identification and genotyping of the foxn1 mutant, we used the endonuclease MnlI (New England Biolabs, R0163S) to detect heteroduplex formation after DNA denaturation and annealing. Primers used for genotyping were foxn1 forward (5′-TTACACTTTCTAAAGAGGCTTG-3′) and foxn1 reverse (5′-TGACCCAGTAAATGCAGCCTTG-3′).
Hematopoietic Stem Cell Transplantation
The donor cells (3-month-old adult HSCs) were obtained from the KM of Tg (ubi:dsRed/CD41:GFP). The detailed procedure was followed as previously reported (Tang et al., 2014). In this study, we utilized WT AB zebrafish whole KM cells as a negative control to gate ubi-dsRed+/CD41-GFPlo HSCs based on fluorescent colors. Staining with propidium iodide was used to exclude dead cells. Briefly, the donor fish were anesthetized with 0.01% tricaine (Sigma-Aldrich, A5040), and then the KM was taken out and placed in 1.5 mL tubes that contained 1× PBS with 5% serum (Gibco, 10438026). The KM was dissected using 1 mL pipette tips. Then the cell suspension was filtered through 40 μm filtering membrane and centrifuged for 8 min (1,000 rpm) before cell sorting and analysis. For fetal HSC collection, the trunk region of 3 dpf embryos was obtained from Tg (ubi:dsRed/CD41:GFP) using a 2 mL injection syringe and dispersed to a single-cell suspension using 0.5% trypsin. Then the cell suspension was filtered through a 40 μm filtering membrane and centrifuged for 8 min (1,000 rpm) before cell sorting. The sorted cells were centrifuged for 8 min (1,000 rpm) and resuspended in proper volumes for transplantation. Recipient fish (3-month-old Casper, irradiated Casper, foxn1/Casper mutants, and irradiated foxn1/Casper) were first anesthetized with 0.01% tricaine and then irradiated using 25 Gy (Casper) or 15 Gy (foxn1/Casper). After 2 days, irradiated fish were used for transplantation. The cells were injected into recipients using a 26s-gauge Hamilton 80,366 syringe (Sigma-Aldrich, 20779) by retroorbital injection (Pugach et al., 2009).
The engraftment efficiency was assessed at 60 dpt. The photographs of whole adult fish were first taken using a Nikon SMZ1500, and the images of blood cells were taken using Nikon A1 confocal microscopy. Subsequently, the KM of recipients was analyzed using MoFlo XDP (Beckman) and the results were processed using FlowJo (10.5.0) and Summit (5.1.0) software. FlowSight (Merck Millipore) was used for analysis of different hematopoietic lineages. The numbers of transplanted cells and recipients are provided in Tables S2 and S3.
MDS-like Cell Transplantation
For MDS-like cell collection, the cells were obtained from the KM of Tg (cmybhyper:GFP). The 24-month-old MDS-like fish were selected based on their pathologic external features, and the whole KM cells of Tg (cmybhyper:GFP) were collected as described above. The whole KM cells were mixed from eight donors and centrifuged for 8 min (1,000 rpm) and resuspended. About 5 × 10⁵ cells were injected into each recipient using a 26s-gauge Hamilton 80,366 syringe by retroorbital injection. The 3-month-old Casper and foxn1/Casper mutant were used as recipients. Photographs of whole adult fish and KM were taken at 45 dpt using a Nikon SMZ1500. The KM of recipients was analyzed using MoFlo XDP (Beckman) and the results were processed using FlowJo and Summit software.
Muscle Cell Transplantation
For muscle cell collection, the dorsal musculature was excised from anesthetized 3-month-old adult Tg (ubi:dsRed/fmyhc2:GFP) and medaka Tg (ubi:mCherry). The muscle tissue was obtained from 10 donors and dissected by maceration using razor blade and surgical scissors in 1× PBS with 5% serum and then suspended with a 5 mL serological pipette repeatedly. The cell suspension was filtered through a 40 μm filtering membrane and centrifuged for 8 min (1,000 rpm) twice and resuspended. The cell number was calculated by Trypan blue staining and hemocytometer counts. About 1 × 10⁶ (2–3 μL) muscle cells were injected into recipients using a 26s-gauge Hamilton 80,366 syringe (Sigma-Aldrich, 20779) by intramuscular injection (Tenente et al., 2014). The 3-month-old Casper and foxn1/Casper mutant were used as recipients. At 15 and 30 dpt, photographs of whole adult fish and muscle cells were taken using a Nikon SMZ1500 and Nikon A1 confocal microscopy.
RNA-Seq and Gene Ontology Analysis
The caudal hematopoietic tissue region (3 dpf) and adult KM (3 mpf) were dissociated to single cells, and CD41-GFPlo cells were sorted by MoFlo XDP (Beckman). The total RNA of the sorted CD41-GFPlo cells was extracted and subjected to RNA-seq. The deep-sequencing service and gene ontology analysis were provided by Shanghai Institutes for Biological Sciences, Chinese Academy of Sciences.
Data and Code Availability
The accession numbers for the data reported in this paper are GEO: GSM3403648, GSM3403649, GSM3403658, and GSM3403659.
Whole-Mount In Situ Hybridization and Western Blotting
The zebrafish embryos (5 dpf) were collected and whole-mount in situ hybridization (WISH) was performed using a ZF-A4 in situ hybridization machine (Zfand, China) with probes of rag1, ccr9a, and lck as previously described (Ma et al., 2012). The photographs of WISH were taken using a Nikon SMZ1500. The thymus region of WT and foxn1 mutants at 5 dpf were collected for protein sample extraction. Foxn1 protein level was detected using the Foxn1 antibody (AbMax, DWS008) recognizing the RESDPYSQKSAERFRR-SEPQESSEE peptide and following the protocol as previously described (Ma et al., 2012).
Quantitative Real-Time PCR
Total RNA used for qRT-PCR was extracted from 5 dpf zebrafish embryos and 3-month-old adult KM. Total RNA was extracted using TRIzol reagent (Invitrogen, 15596018) and was reverse transcribed (Promega, GoScript Reverse Transcription System kit A5000). The mRNA levels of target genes were analyzed in this assay. The qRT-PCR primers were used as previously reported (Tang et al., 2014) and are listed in Table S3.
Tcrb and igm Rearrangement Assessment
The total RNA was collected from 3-month-old adult KM and then reverse transcribed (Promega, GoScript Reverse Transcription System kit A5000). The PCR primers used for detection and the amplification procedure were previously reported (Tang et al., 2014). Here elf1a was a positive control. The zebrafish numbers of WT and foxn1 mutants for each group were 2 and 6, respectively.
Wright-Giemsa Staining and Hematoxylin and Eosin Staining
Zebrafish blood cells were collected from KM or peripheral blood and were smeared on the slides. The slides were dried at 37°C overnight. Wright-Giemsa staining was carried out to label different blood cell lineages according to the standard protocol. The adult tissues were fixed with 4% polyformaldehyde overnight and dehydrated using anhydrous ethanol. Then the tissues were embedded in paraffin. The paraffin sections of kidney and thymus were cut using a LEICA RM2255 and the thickness of each section was 10 μm. Then the H&E staining of thymus was performed as described previously (Zhang et al., 2015). The H&E staining was acquired using a Nikon ECLIPSE 80i.
Statistical Analysis
Original photos were transformed into 8-bit grayscale images by ImageJ 1.8.0, and the area of the digitized region was analyzed. Data in each chart are presented as the mean ± SD (standard deviation), and Student's t test, one-way ANOVA (Tukey's), and two-way ANOVA (Tukey's) were used for statistical analysis; p < 0.05 was statistically significant (∗p < 0.05, ∗∗p < 0.01, ∗∗∗p < 0.001). All statistical analysis was carried out using SPSS 20.0 and Prism 7.05.
Author Contributions
P.L., S.G., and G.L. performed all experiments; Y.B., J.C., and C.K. provided the foxn1 mutant; D.M., Y.Z., S.G., and L.W. contributed to the editing; F.L. conceived the project, analyzed the data, and wrote the paper. All authors read and approved the final manuscript.
Acknowledgments
We thank our lab members for helpful discussions and critical reading of the paper. We thank Jing-Wei Xiong for providing the zebrafish Tg (ubi:loxP-dsRed-loxP-GFP) line, Anming Meng for the zebrafish Tg (fmyhc2:GFP) line, and Qiang Tu for the medaka Tg (ubi:mCherry) line. This work was supported by grants from the National Key Research and Development Program of China, China (2018YFA0800200, 2018YFA0801000, 2016YFA0100500), the Strategic Priority Research Program of the Chinese Academy of Sciences, China (XDA16010207), the National Natural Science Foundation of China, China (31830061, 31425016, 81530004), and the Youth Innovation Promotion Association, CAS, China (2016083). Y.-K.B. was supported by a National Cancer Center grant, Korea (NCC1310860).
Published: August 20, 2020
Footnotes
Supplemental Information can be found online at https://doi.org/10.1016/j.stemcr.2020.07.020.
Contributor Information
Lu Wang, Email: wanglu1@ihcams.ac.cn.
Feng Liu, Email: liuf@ioz.ac.cn, http://english.biomembrane.ioz.cas.cn/research/groups/liufeng.
Supplemental Information
References
- Arora N., Wenzel P.L., McKinney-Freeman S.L., Ross S.J., Kim P.G., Chou S.S., Yoshimoto M., Yoder M.C., Daley G.Q. Effect of developmental stage of HSC and recipient on transplant outcomes. Dev. Cell. 2014;29:621–628. doi: 10.1016/j.devcel.2014.04.013. [DOI] [PMC free article] [PubMed] [Google Scholar]
- Barriga F., Ramirez P., Wietstruck A., Rojas N. Hematopoietic stem cell transplantation: clinical use and perspectives. Biol. Res. 2012;45:307–316. doi: 10.4067/S0716-97602012000300012. [DOI] [PubMed] [Google Scholar]
- Becker A.J., Mc C.E., Till J.E. Cytological demonstration of the clonal nature of spleen colonies derived from transplanted mouse marrow cells. Nature. 1963;197:452–454. doi: 10.1038/197452a0. [DOI] [PubMed] [Google Scholar]
- Bertrand J.Y., Giroux S., Golub R., Klaine M., Jalil A., Boucontet L., Godin I., Cumano A. Characterization of purified intraembryonic hematopoietic stem cells as a tool to define their site of origin. Proc. Natl. Acad. Sci. U S A. 2005;102:134–139. doi: 10.1073/pnas.0402270102. [DOI] [PMC free article] [PubMed] [Google Scholar]
- Bowie M.B., Kent D.G., Dykstra B., McKnight K.D., McCaffrey L., Hoodless P.A., Eaves C.J. Identification of a new intrinsically timed developmental checkpoint that reprograms key hematopoietic stem cell properties. Proc. Natl. Acad. Sci. U S A. 2007;104:5878–5882. doi: 10.1073/pnas.0700460104. [DOI] [PMC free article] [PubMed] [Google Scholar]
- Fogh J., Fogh J.M., Orfeo T. One hundred and twenty-seven cultured human tumor cell lines producing tumors in nude mice. J. Natl. Cancer Inst. 1977;59:221–226. doi: 10.1093/jnci/59.1.221. [DOI] [PubMed] [Google Scholar]
- Jill L.O., de Jong C.E.B., Chen A.T., Pugach E., Mayhall E.A., Alexandra, Smith C.H., Feldman H.A., Zhou Y., Zon L.I. Characterization of immune-matched hematopoietic transplantation in zebrafish. Blood. 2011;117:4234–4242. doi: 10.1182/blood-2010-09-307488. [DOI] [PMC free article] [PubMed] [Google Scholar]
- Kapp F.G., Perlin J.R., Hagedorn E.J., Gansner J.M., Schwarz D.E., O'Connell L.A., Johnson N.S., Amemiya C., Fisher D.E., Wolfle U. Protection from UV light is an evolutionarily conserved feature of the haematopoietic niche. Nature. 2018;558:445–448. doi: 10.1038/s41586-018-0213-0. [DOI] [PMC free article] [PubMed] [Google Scholar]
- Kim J.S., Lee H.J., Carroll D. Genome editing with modularly assembled zinc-finger nucleases. Nat. Methods. 2010;7:91–92. doi: 10.1038/nmeth0210-91b. [DOI] [PMC free article] [PubMed] [Google Scholar]
- Li P., White R.M., Zon L.I. Transplantation in zebrafish. Methods Cell Biol. 2011;105:403–417. doi: 10.1016/B978-0-12-381320-6.00017-5. [DOI] [PubMed] [Google Scholar]
- Liu W., Wu M., Huang Z., Lian J., Chen J., Wang T., Leung A.Y.H., Liao Y., Zhang Z., Liu Q. c-myb hyperactivity leads to myeloid and lymphoid malignancies in zebrafish. Leukemia. 2017;31:222–233. doi: 10.1038/leu.2016.170. [DOI] [PMC free article] [PubMed] [Google Scholar]
- Ma D., Zhang J., Lin H.F., Italiano J., Handin R.I. The identification and characterization of zebrafish hematopoietic stem cells. Blood. 2011;118:289–297. doi: 10.1182/blood-2010-12-327403. [DOI] [PMC free article] [PubMed] [Google Scholar]
- Ma D.Y., Wang L., Wang S.F., Gao Y., Wei Y.L., Liu F. Foxn1 maintains thymic epithelial cells to support T-cell development via mcm2 in zebrafish. Proc. Natl. Acad. Sci. U S A. 2012;109:21040–21045. doi: 10.1073/pnas.1217021110. [DOI] [PMC free article] [PubMed] [Google Scholar]
- Mantel C.R., O'Leary H.A., Chitteti B.R., Huang X., Cooper S., Hangoc G., Brustovetsky N., Srour E.F., Lee M.R., Messina-Graham S. Enhancing hematopoietic stem cell transplantation efficacy by mitigating oxygen shock. Cell. 2015;161:1553–1565. doi: 10.1016/j.cell.2015.04.054. [DOI] [PMC free article] [PubMed] [Google Scholar]
- Moore J.C., Langenau D.M. Allograft cancer cell transplantation in zebrafish. Adv. Exp. Med. Biol. 2016;916:265–287. doi: 10.1007/978-3-319-30654-4_12. [DOI] [PubMed] [Google Scholar]
- Moore J.C., Tang Q., Yordán N.T., Moore F.E., Garcia E.G., Lobbardi R., Ramakrishnan A., Marvin D.L., Anselmo A., Sadreyev R.I., Langenau D.M. Single-cell imaging of normal and malignant cell engraftment into optically clear prkdc-null SCID zebrafish. J. Exp. Med. 2016;213:2575–2589. doi: 10.1084/jem.20160378. [DOI] [PMC free article] [PubMed] [Google Scholar]
- North T.E., de Bruijn M.F., Stacy T., Talebian L., Lind E., Robin C., Binder M., Dzierzak E., Speck N.A. Runx1 expression marks long-term repopulating hematopoietic stem cells in the midgestation mouse embryo. Immunity. 2002;16:661–672. doi: 10.1016/s1074-7613(02)00296-0. [DOI] [PubMed] [Google Scholar]
- Pugach E.K., Li P., White R., Zon L. Retro-orbital injection in adult zebrafish. J. Vis. Exp. 2009;2009:1645. doi: 10.3791/1645. [DOI] [PMC free article] [PubMed] [Google Scholar]
- Qiu J., Fan X., Wang Y., Jin H., Song Y., Han Y., Huang S., Meng Y., Tang F., Meng A. Embryonic hematopoiesis in vertebrate somites gives rise to definitive hematopoietic stem cells. J. Mol. Cell Biol. 2016;8:288–301. doi: 10.1093/jmcb/mjw024. [DOI] [PMC free article] [PubMed] [Google Scholar]
- Romano R., Palamaro L., Fusco A., Iannace L., Maio S., Vigliano I., Giardino G., Pignata C. From murine to human nude/SCID: the thymus, T-cell development and the missing link. Clin. Dev. Immunol. 2012;2012:467101. doi: 10.1155/2012/467101. [DOI] [PMC free article] [PubMed] [Google Scholar]
- Shultz L.D., Ishikawa F., Greiner D.L. Humanized mice in translational biomedical research. Nat. Rev. Immunol. 2007;7:118–130. doi: 10.1038/nri2017. [DOI] [PubMed] [Google Scholar]
- Szadvari I., Krizanova O., Babula P. Athymic nude mice as an experimental model for cancer treatment. Physiol. Res. 2016;65:S441–S453. doi: 10.33549/physiolres.933526. [DOI] [PubMed] [Google Scholar]
- Tang Q., Abdelfattah N.S., Blackburn J.S., Moore J.C., Martinez S.A., Moore F.E., Lobbardi R., Tenente I.M., Ignatius M.S., Berman J.N. Optimized cell transplantation using adult rag2 mutant zebrafish. Nat. Methods. 2014;11:821–824. doi: 10.1038/nmeth.3031. [DOI] [PMC free article] [PubMed] [Google Scholar]
- Tay G.K., Witt C.S., Christiansen F.T., Charron D., Baker D., Herrmann R., Smith L.K., Diepeveen D., Mallal S., Mccluskey J. Matching for Mhc haplotypes results in improved survival following unrelated bone-marrow transplantation. Bone Marrow Transpl. 1995;15:381–385. [PubMed] [Google Scholar]
- Tenente I.M., Tang Q., Moore J.C., Langenau D.M. Normal and malignant muscle cell transplantation into immune compromised adult zebrafish. J. Vis. Exp. 2014;94:52597. doi: 10.3791/52597. [DOI] [PMC free article] [PubMed] [Google Scholar]
- Thomas E.D., Buckner C.D., Rudolph R.H., Fefer A., Storb R., Neiman P.E., Bryant J.I., Chard R.L., Clift R.A., Epstein R.B. Allogeneic marrow grafting for hematologic malignancy using hl-a matched donor-recipient sibling pairs. Blood J. Hematol. 1971;38:267–287. [PubMed] [Google Scholar]
- Traver D., Paw B.H., Poss K.D., Penberthy W.T., Lin S., Zon L.I. Transplantation and in vivo imaging of multilineage engraftment in zebrafish bloodless mutants. Nat. Immunol. 2003;4:1238–1246. doi: 10.1038/ni1007. [DOI] [PubMed] [Google Scholar]
- Traver D., Winzeler A., Stern H.M., Mayhall E.A., Langenau D.M., Kutok J.L., Look A.T., Zon L.I. Effects of lethal irradiation in zebrafish and rescue by hematopoietic cell transplantation. Blood. 2004;104:1298–1305. doi: 10.1182/blood-2004-01-0100. [DOI] [PubMed] [Google Scholar]
- Trounson A., McDonald C. Stem cell therapies in clinical trials: progress and challenges. Cell Stem Cell. 2015;17:11–22. doi: 10.1016/j.stem.2015.06.007. [DOI] [PubMed] [Google Scholar]
- White R.M., Sessa A., Burke C., Bowman T., LeBlanc J., Ceol C., Bourque C., Dovey M., Goessling W., Burns C.E. Transparent adult zebrafish as a tool for in vivo transplantation analysis. Cell Stem Cell. 2008;2:183–189. doi: 10.1016/j.stem.2007.11.002. [DOI] [PMC free article] [PubMed] [Google Scholar]
- Wu A.M., Till J.E., Siminovitch L., McCulloch E.A. A cytological study of the capacity for differentiation of normal hemopoietic colony-forming cells. J. Cell. Physiol. 1967;69:177–184. doi: 10.1002/jcp.1040690208. [DOI] [PubMed] [Google Scholar]
- Xue Y., Liu D., Cui G., Ding Y., Ai D., Gao S., Zhang Y., Suo S., Wang X., Lv P. A 3D atlas of hematopoietic stem and progenitor cell expansion by multi-dimensional RNA-seq analysis. Cell Rep. 2019;27:1567–1578.e5. doi: 10.1016/j.celrep.2019.04.030. [DOI] [PubMed] [Google Scholar]
- Yan C., Brunson D.C., Tang Q., Do D., Iftimia N.A., Moore J.C., Hayes M.N., Welker A.M., Garcia E.G., Dubash T.D. Visualizing engrafted human cancer and therapy responses in immunodeficient zebrafish. Cell. 2019;177:1903–1914.e4. doi: 10.1016/j.cell.2019.04.004. [DOI] [PMC free article] [PubMed] [Google Scholar]
- Zhang P., He Q., Chen D., Liu W., Wang L., Zhang C., Ma D., Li W., Liu B., Liu F. G protein-coupled receptor 183 facilitates endothelial-to-hematopoietic transition via Notch1 inhibition. Cell Res. 2015;25:1093–1107. doi: 10.1038/cr.2015.109. [DOI] [PMC free article] [PubMed] [Google Scholar]
- Zhou B.O., Yu H., Yue R., Zhao Z.Y., Rios J.J., Naveiras O., Morrison S.J. Bone marrow adipocytes promote the regeneration of stem cells and haematopoiesis by secreting SCF. Nat. Cell Biol. 2017;19:891–903. doi: 10.1038/ncb3570. [DOI] [PMC free article] [PubMed] [Google Scholar]
Associated Data
This section collects any data citations, data availability statements, or supplementary materials included in this article.
Supplementary Materials
Data Availability Statement
The accession numbers for the data reported in this paper are GEO: GSM3403648, GSM3403649, GSM3403658, and GSM3403659.