

Abstract
Polymer nanoparticles (NPs), due to their small size and surface functionalization potential has demonstrated effective drug transport across the blood-brain-barrier (BBB). Currently, the lack of in vitro BBB models that closely recapitulate the complex human brain microenvironment contributes to the high failure rate of neuro-pharmaceutical clinical trials. In this work, a previously established microfluidic 3D in vitro human BBB model, formed by the self-assembly of human induced pluripotent stem cell-derived endothelial cells, primary brain pericytes and astrocytes in tri-culture within 3D fibrin hydrogel was exploited to quantify polymer NP permeability, as a function of their size and surface chemistry. Microvasculature were perfused with commercially available 100 – 400 nm fluorescent polystyrene (PS) NPs, and newly-synthesized 100 nm rhodamine-labelled polyurethane (PU) NPs. Confocal images were taken at different timepoints and computationally analyzed to quantify fluorescence intensity inside/outside the microvasculature, to determine NP spatial distribution and permeability in 3D. Results showed similar permeability of PS and PU NPs, which increased after surface-functionalization with brain-associated ligand holo-transferrin. Compared to conventional transwell models, our method enabled rapid analysis of NP permeability in a physiologically-relevant human BBB set-up. Therefore, this work demonstrates a new methodology to preclinically assess NP ability to cross the human BBB.
Keywords: human blood-brain-barrier, in vitro testing platform, microfluidic device, self-organized microvasculature, polymer nanoparticles, Blood-brain-barrier-nanoparticles
Graphical Abstract
Nanoparticles (NPs) represent a therapeutic solution to cross the near-impenetrable blood-brain-barrier (BBB). In this article, Lee and co-workers describe a new method to assess NP permeability in a previously developed 3D in vitro human BBB microvasculature model. The quantitative method successfully captured the increase in permeability of NPs surface-functionalized with Transferrin and their 3D spatio-temporal distribution.

1. Introduction
The blood-brain-barrier (BBB) forms a highly selective barrier between the microvascular blood stream and brain tissue; it is composed of endothelial cells (ECs), which form the microvasculature, surrounded by pericytes and astrocytes,[1,2] and regulates the passage of substances between the blood and brain, maintaining brain homeostasis, while providing a barrier against pathogens and neurotoxins.[2] Due to its high selectivity, the BBB also represents a major obstacle to the efficient delivery of large molecules for the treatment of brain diseases.[3–5]
Polymer NPs, by virtue of their small size and tunable properties, have been explored for delivering diagnostic agents,[6] nucleic acids,[7,8] proteins,[9] and traditional small molecule medicines to the brain.[10] Specifically, their chemical properties can be tuned to achieve target stability, drug encapsulation and release properties.[11] The passage of NPs through the BBB seems to be mostly size-dependent. For instance, particles with 10 to <1000 nm size have been commonly used for drug delivery to the brain,[11,12] and particularly, 100 nm NPs have demonstrated favorable delivery capabilities.[13–16]
Additionally, it has been shown that surface modification of NPs with ligands for specific binding to BBB cells enhances NP accumulation in the brain through receptor-mediated endocytosis.[17–20] Among these,[21,22] holo-transferrin (Tf) has been widely studied as it binds to the Tf receptor (TfR), which is more abundantly expressed by brain ECs compared to ECs of other blood vessels,[21,23] and overexpressed by brain tumor vasculature.[12,24,25] Notably, TfR-targeting NPs have been found to improve drug delivery into brain tissue.[22,26–28] Despite evidence suggesting that NPs with specific size and surface composition can accumulate in the brain, the clinical translation of such approaches has not been achieved successfully.
Currently, in vivo xenograft mouse models are used for the preclinical evaluation of NP efficacy.[29] However, crucial cellular, genetic, immunologic and molecular differences exist between humans and mice, limiting the capability of animal models to screen for therapeutics that effectively target the human brain.[30,31] Animal models also raise ethical issues, are costly and time-consuming.[32] As such, more human-relevant and efficient platforms are needed.
Microfluidic or ‘organ-on-a-chip’ models have the potential to accelerate the in vitro preclinical evaluation and screening of NPs for effective therapies.[33–36] Among the many two-dimensional (2D) and 3D vascular models, only few 3D in vitro models of functional brain vasculature have been described.[37–39] However, they typically show larger diameters (600–800 μm) compared to brain vessels (arterioles and venules: 1–100 μm; capillaries: 5–10 μm), which results in altered transport properties. To address such limitations, a 3D in vitro microfluidic model of the human BBB microvasculature has been recently developed by the authors, by the tri-culture of human induced pluripotent stem cell-derived ECs (iPSC-ECs), primary human pericytes and astrocytes in 3D fibrin hydrogel (Figure 1 and Figure S1 and S2, Supporting Information).[37] Here, co-cultured cells self-assembled into complex structures, recapitulating brain vascular morphogenesis; during the 7-days culture, iPSC-ECs increased their expression of tight junction proteins, including Zonula occludens-1 (ZO-1), Occludin (OCLN) and Claudin-5 (CLDN5), and common brain EC membrane transporters.[37] The model exhibited many features that mimic the human BBB, and showed similar vascular permeability to rat brain microvasculature (Figure S1, Supporting Information).[37]
Figure 1.

a) Schematic representation of the human blood-brain-barrier (BBB) and b) vascular cross-section. c) Illustrative description of culture protocol, from 2D culture of each cell type to generation of a 3D in vitro human BBB in a matrix environment within a microfluidic system. The microfluidic system was fabricated using PDMS by soft lithography techniques and was designed with gel inlet ports for injecting fibrin gel, and media reservoirs for injecting cell culture medium. d) Timeline of experimental protocol with the associated growth and morphology of BBB microvasculature over time in the 3D in vitro microfluidic system. All schematics were created with BioRender.
In this work, we applied this physiologically-relevant tool to evaluate NP transport across the BBB. To achieve this, a method was proposed for studying in vitro transport of fluorescently-tagged polymer NPs in the 3D model. The effects of NP size and Tf surface functionalization (Figure 2a) on permeability values were studied, using 2 types of polymer NPs: commercially available polystyrene (PS) and newly synthesized polyurethane (PU) NPs. The 3D model allowed for more rapid evaluation of NP permeability than using a 2D transwell set-up (5 min vs. 3 h) and could effectively capture the effect of NP surface functionalization. Therefore, the work represents a proof of concept that advanced in vitro 3D BBB models can potentially predict NP transport to the brain and are useful for preclinical screening of nanotherapeutics.
Figure 2.
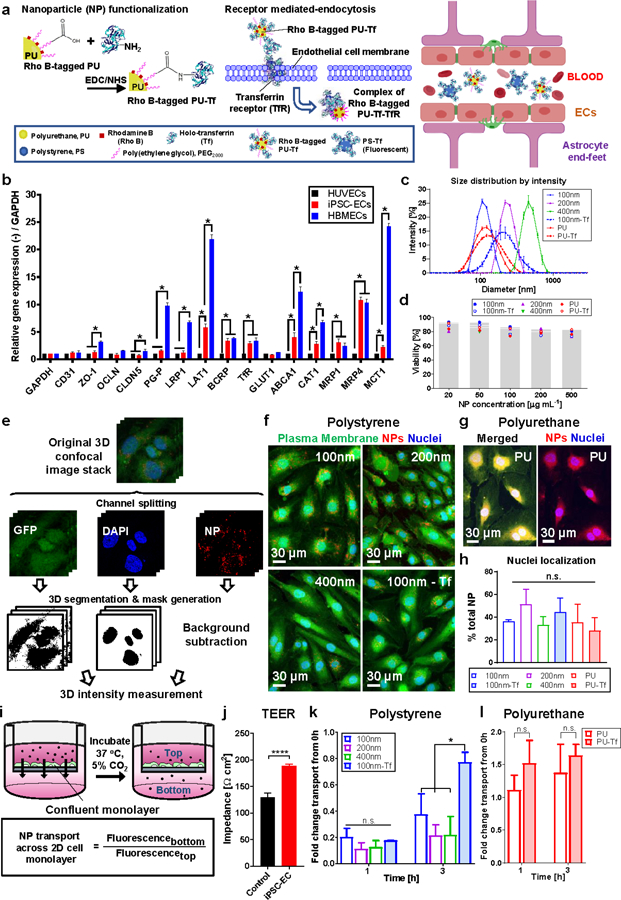
a) Method of preparing transferrin (Tf)-functionalized PU NPs (left) and Tf receptor (TfR)-mediated endocytosis of Tf-functionalized NPs (right). Image created with BioRender. b) Relative RT-qPCR of surface and junction proteins by different ECs cultured over 7 days in 2D. A comparison is shown of mRNA expression of factors relating to brain endothelial transporter proteins, regulation of microvasculature maturation and BBB features. Fold change is relative to control HUVEC mono-culture, with GAPDH as the internal standard housekeeping gene. c) Size distribution curves of NPs with/without Tf as characterized by DLS measurements. d) Non-significant difference in iPSC-EC viability toward increasing NP concentrations, with results presented as the percentage compared to the untreated control (0 µg mL−1 NPs). e) Method for quantifying cell uptake and nuclei localization of NPs. Confocal images showing cell uptake of f) PS NPs with/without Tf and g) PU NPs. h) Percentage of NPs localized at nuclei compared to total NPs per cell. i) Transwell set-up to evaluate NP transport across an iPSC-EC monolayer, which was assessed by the ratio of measured fluorescence intensity of media collected from the bottom and top of the transwell insert. j) TEER characterization of iPSC-EC monolayer indicates cell confluence and presence of tight intercellular junctions. Fold change in net movement of NPs across an iPSC-EC monolayer in the transwell set-up from 0 h for k) PS and l) PU NPs. Data were analyzed using a two-tailed Student’s t-test and where appropriate, one-way ANOVA with Holm-Sidak’s multiple comparisons test or Kruskal-Wallis H test with Dunn’s multiple comparisons test. Data are shown as the mean ± SD, n ≥ 3 independent experiments, with * p ≤ 0.05. (n.s.: not significant)
2. Results
2.1. RT-qPCR of Surface and Junction Protein Expression by Endothelial Cells (ECs)
Preliminary experiments were aimed at supporting the use of iPSC-ECs in the BBB microvasculature model, and at selecting a proper functionalizing ligand for NPs. Different EC types (human brain microvascular EC; HBMECs, iPSC-ECs and, as control cells, human umbilical vein ECs; HUVECs) were cultured in vitro for 7 days on tissue culture plates.
Results for HUVECs showed that the TfR was one of the most highly upregulated amongst other brain-specific transporters, including large neutral amino acid transporter 1 (LAT1) and multidrug resistance-associated protein 4 (MRP4) (Figure 2b). The TfR was also one of the most highly upregulated surface proteins on iPSC-ECs (2.91-fold expression compared to HUVECs) (Figure 2b). HBMECs upregulated several surface and junction proteins of tight intercellular junctions and showed high expression of multiple brain-specific transporters (Figure 2b). Additionally, HBMECs have been previously observed to self-assemble into large and discontinuous microvascular networks, while iPSC-ECs form a complex and perfusable microvasculature when cultured in a 3D matrix.[37] Based on these results, iPSC-ECs were selected for the development of a functional 3D in vitro BBB microvasculature model to test Tf-functionalized NPs.
2.2. Physical Characterization of PS and PU NPs With/Without Tf-functionalization
The PU NPs used in this study are spherical in shape, as shown by transmission electron cryomicroscopy (Cryo TEM) images (Figure S3, Supporting Information) and previous studies.[40] Similarly, commercial PS NPs possess a spherical shape.[41] Commercially available PS NPs and synthesized PU NPs were used and surface-functionalized with Tf, following published methods, exploiting carbodiimide-mediated grafting (Figure 2a).[42] PS and PU NPs displayed a narrow size distribution (Figure 2c), but after Tf-functionalization, they increased their size and zeta potential (Figure 2c and Table 1), in agreement with previous literature.[40,42]
Table 1.
DLS characterization of PS and PU NPs.
| NP type | Size [nm] | PDI | ZP [mV] |
|---|---|---|---|
| 100 nm (PS) | 109.0 ± 0.8 | 0.0377 ± 0.02 | −43.7 ± 0.3 |
| 200 nm (PS) | 233.0 ± 0.6 | 0.0373 ± 0.03 | −37.0 ± 2.4 |
| 400 nm (PS) | 457.0 ± 16.5 | 0.122 ± 0.07 | −37.4 ± 2.0 |
| 100 nm (PS-Tf) | 203.0 ± 3.1 | 0.215 ± 0.04 | −0.04 ± 0.2 |
| PU | 112.0 ± 1.0 | 0.0940 ± 0.01 | −44.9 ± 4.0 |
| PU-Tf | 118.0 ± 1.4 | 0.157 ± 0.01 | −32.2 ± 0.5 |
2.3. Cytocompatibility and Cell Uptake of PS and PU NPs
MTS cell viability assays confirmed that NPs were not cytotoxic for iPSC-ECs at the concentrations tested (0–500 µg mL−1), showing: 81.7 ± 5.8% viability compared to the non-treated control (Figure 2d). Additionally, analysis of 3D confocal images of iPSC-ECs incubated in the presence of NPs (Figure 2e) confirmed that the cells internalized NPs (Figure 2f and 2g) which successfully localized in the region close to cell nuclei (Figure 2h).
2.4. PS and PU NP Permeability Across a 2D Monolayer in a Transwell Model
A 2D transwell model of the BBB was set up (Figure 2i), showing an increase in trans-endothelial electrical resistance (TEER) values, as a function of culture time from 130.0 ± 8.3 Ω cm2 after 24 h, to 189.0 ± 3.4 Ω cm2 after 2–3 days (Figure 2j). The 2D transwell model was used to measure NP permeability: PS NPs with 100–400 nm size showed similar permeability (Figure 2k), while PU NPs showed significantly higher permeability compared to PS NPs (Figure S4, Supporting Information). Permeability of PS-Tf NPs showed a 2.06-fold significant increase compared to non-functionalized PS NPs after 3 h (Figure 2k). In contrast, permeability of PU-Tf NPs was not significantly higher than that of PU NPs after 1 h and 3 h testing time (Figure 2l). Additionally, the permeability of both FITC-dextran and NPs did not change when they were tested in combination (Figure S5, Supporting Information).
2.5. PS and PU NP Permeability Across a 3D Microvasculature in a Microfluidic Model
The 3D in vitro BBB model (Figure 1, Figure 3a and 3b, and Figure S1 and S2, Supporting Information) was utilized for permeability measurements. Permeability of FITC-dextran decreased with an increase in its molecular weight (10 kDa: 2.21 ± 1.96 × 10⁻⁷ cm s−1; 40 kDa: 0.83 ± 0.86 × 10⁻⁷ cm s−1; 70 kDa: 0.62 ± 0.39 × 10⁻⁷ cm s−1) (Figure 3c), in agreement with previous literature.[37] Permeability values of PS NPs with different size did not change significantly (100 nm: 1.64 ± 1.36 × 10⁻⁷ cm s−1; 200 nm: 1.33 ± 0.87 × 10⁻⁷ cm s−1; 400 nm: 1.42 ± 0.72 × 10⁻⁷ cm s−1) (Figure 3d), while it significantly increased for PS-Tf NPs (3.09 ± 3.26 × 10⁻⁷ cm s−1) over non-Tf-functionalized NPs (Figure 3e). PU NPs showed similar permeability (1.58 ± 1.16 × 10⁻⁷ cm s−1) as PS NPs, which significantly increased for PU-Tf NPs (3.70 ± 2.72 × 10⁻⁷ cm s−1) (Figure 3f). The permeability of FITC-dextran did not change in the co-presence of NPs (data not shown).
Figure 3.

a) Set-up and method of 3D permeability measurements. Representative confocal images of NPs, which fluoresce in the red fluorescence channel, transporting across the microvasculature are shown. b) Approach for measuring intensity of NPs within/outside microvasculature at different timepoints for 3D permeability analysis. 3D permeability measurements of c) FITC-dextran, d) bare PS NPs, e) bare PS NPs and PS-Tf NPs and f) bare PU and PU-Tf NPs in 3D. Data were analyzed using a two-tailed Student’s t-test and where appropriate, one-way ANOVA with Holm-Sidak’s multiple comparisons. Data are shown as the mean ± SD, n ≥ 3 independent experiments, with * p ≤ 0.05, *** p ≤ 0.001, **** p ≤ 0.0001. (n.s.: not significant)
2.6. 3D Spatiotemporal Distribution of PS and PU NPs Across the 3D Microvasculature
3D confocal images of the microvasculature perfused with NPs allowed quantification of spatial and time-dependent distribution of NPs (Figure 4a). There was a mean 2.5-fold increase in fluorescence intensity in the region close to the narrowest vessel lumen over two subsequent timepoints (Figure 4b). Slight changes in fluorescence intensity could be detected as far as 100 μm distance from the vessel wall (Figure 4c and 4d).
Figure 4.

a) 3D intensity map showing localization and density of NPs outside microvasculature over time. b) Fold change in signal intensity of fluorescent dextran (FITC) and NPs (red fluorescence) over 2 timepoints. c) Confocal images showing sections being sampled using line scan measurements (yellow line) at different timepoints to generate the d) intensity profile histogram of the fluorescence signal of NPs at two timepoints along the line indicated in (c).
3. Discussion
This study proposed a new method to characterize polymer NP transport across a previously developed human BBB 3D in vitro model (Figure 1, Figure S1 and S2, Supporting Information).[37] In previous work, we found that both PCs and ACs contribute toward improved BBB formation, structural integrity, relative gene expressions, as well as microvessel morphology, diameter and microvascular permeability.[37] We also observed an increase in tightness of junctional proteins that was consistent with the progressive reduction of microvascular permeability in the tri-culture BBB model.[37] Based on previous permeability results, we expect higher NP microvascular permeability in the conditions of iPSC-EC monoculture and co-culture with ACs. Further investigations would ascertain the relative importance of the different cellular components of the BBB on the transport of nanocarriers into the central nervous system.
In this study, we first performed relative RT-qPCR analysis on 2D monocultures of iPSC-ECs, HBMECs and HUVECs to validate the use of iPSC-ECs in the model and to select a proper ligand for NP surface functionalization. HUVECs were used as control cells as they are not specific for the brain microvasculature and can recapitulate the function of generic vascular ECs.[43,44] Results showed that the TfR was one of the most highly upregulated surface proteins on iPSC-ECs compared to HUVECs (Figure 2b and Table S1, Supporting Information). TfR expression is expected to be further upregulated in the 3D in vitro human BBB model, which comprises iPSC-ECs, human pericytes and astrocytes (Figure 1). Pericytes and astrocytes secrete brain-specific growth factors which support the formation of the tight intercellular junctions that give rise to low BBB permeability.[45,46] Moreover, the presence of tight junctions in the previously developed 3D in vitro human BBB model suggests that a paracrine effect is exerted by astrocytes and pericytes on iPSC-ECs, which would hence increase TfR expression.[37]
HBMECs showed significantly higher expression levels of the TfR and other brain-specific transporters, such as LAT1 and monocarboxylate transporter-1 (MCT1), compared to HUVECs (Figure 2b). However, HBMECs were previously observed to self-assemble into large and discontinuous microvascular networks, which makes them unsuitable for developing a functional BBB microvasculature model.[37] On the other hand, iPSC-ECs were demonstrated to form a complex and perfusable microvasculature when cultured in a 3D matrix.[37] Additionally, iPSC-ECs are an easily available cell source and may allow for patient-personalized research.[30] Based on these results, iPSC-ECs were appropriate for generating the 3D in vitro BBB model, while the TfR was selected as a proper target receptor in the study of NPs in this model. Indeed scientific literature has previously highlighted the therapeutic potential of Tf-based NP transport across the BBB.[22,26–28] Tf can also be expressed by brain microcapillaries and other ECs[47] such as those of liver capillaries and might play an important role for NP transport across liver-specific microvessels. Further studies can involve the surface-functionalization of NPs with other brain-specific ligands, which can further validate and optimize the BBB model for preclinical screening of nanotherapeutics.
In this study, PS and PU NPs with narrow size distribution were used (Figure 2c). After Tf-functionalization, PS-Tf NP size and zeta potential increased (Table 1), in agreement with previous studies that performed complete physicochemical characterizations of such NPs.[42] In contrast, the size of PU-Tf NPs did not change significantly compared to PU NPs, and there was a slight, but statistically significant increase in zeta potential. These differences in size and zeta potential of NPs after Tf grafting could be attributed to the different initial surface composition of PS vs. PU NPs, which would affect the conformation and amount of grafted Tf molecules.
Cell viability assays confirmed that NPs were not cytotoxic for up to 10X the concentration used in permeability studies (Figure 2d). Confocal microscopy analysis also showed that iPSC-ECs internalized NPs (Figure 2e), which then localized near the cell nuclei (Figure 2h). This result suggested that NPs could possibly cross the BBB model via transcytosis, as NPs could be packaged into vesicles near the nuclei to then be trafficked out of the cell.[48,49]
A 2D transwell model was set up to measure NP transport across an iPSC-EC monolayer (Figure 2i). Its increase in TEER values over time suggested the formation of tight intercellular junctions (Figure 2j). NPs were able to cross such monolayers, and no substantial difference in the permeability of PS NPs with different sizes were observed (Figure 2k), in agreement with literature.[50] At least 3 h were needed to detect an increase in permeability for PS-Tf NPs compared to PS NPs (Figure 2k), while the permeability of PU and PU-Tf NPs was similar after 1 h and 3 h testing time (Figure 2l). Hence, in addition to their lack of 3D architectural complexity, 2D transwell assays do not facilitate direct comparisons across NPs made of different materials and are time-consuming.
In contrast, the 3D in vitro BBB model allowed for permeability comparisons across NPs prepared using different materials or with Tf surface functionalization, in a short time (5 min) (Figure 3a and 3b). Permeability values of non-functionalized PS NPs measured in the 3D model did not change as a function of NP size in the 100–400 nm range (Figure 3d).
Although the surface chemistry of PS and PU NPs was different, non-functionalized PU and PS NPs showed similar permeability values. Notably, the permeability of non-functionalized NPs in the 3D model was 2-fold higher than for 40 and 70 kDa FITC-dextrans (Figure 3c and 3d). In contrast, NP permeability across the 2D transwell monolayer was inferior to that of 70 kDa FITC-dextran (Figure S5, Supporting Information). Previous authors also reported one order of magnitude higher permeability values in a 3D model compared with a 2D transwell model.[51] In the 3D in vitro model, transcytosis possibly played a more important role compared to paracellular transport. Conversely, in the 2D transwell set-up, transcytosis effects were possibly inferior and paracellular transport prevailed. Also, transcytosis mechanisms may possibly differ between in vitro 2D monolayers and 3D environments.[52] Receptor-mediated transport can additionally differ for an EC monoculture (transwell set-up) vs. a system where ECs receive supporting factors from pericytes and astrocytes and thus display tighter intercellular junctions (3D BBB model).[53,54] Furthermore, NP and FITC-dextran permeabilities did not change when they were tested in combination in 2D (Figure S5, Supporting Information); similarly, FITC-dextran permeabilities did not change in 3D models (data not shown). This suggested that NPs did not alter the tightness of cell junctions. Future studies can further explore the primary mechanisms responsible for NP transport.
Tf-functionalization increased permeability values especially for PU-Tf NPs (Figure 3f). Such results are particularly relevant for future translation of PU NPs to the clinic, considering their demonstrated efficient delivery of drugs to tumors in murine models.[40] In the case of PS-Tf NPs, the method for Tf surface grafting has been previously demonstrated to cause partial protein denaturation, decreasing Tf binding interaction with iPSC-ECs.[20,55] Additionally, NP permeability in the presence of culture medium can be affected by the formation of a protein corona around NPs.[56,57] On the other hand, PU NPs were functionalized using a PEGylated Tf: the PEG segment functioned as a spacer, providing Tf flexibility and exposure,[58] and as an anti-fouling agent, reducing non-specific protein adsorption,[59] and preserving Tf biological function. Hence, PU-Tf NPs presented Tf more effectively to TfRs on iPSC-ECs, possibly resulting in improved transcytosis.[60] Additionally, the surface of PU-Tf NPs also contained lipid molecules that may increase NP affinity for cells.[40] Future studies that quantify the amount of biologically active Tf on the NP surface would confirm such hypotheses.
An algorithm was developed to spatially detect precise fluctuations in fluorescence signals of FITC-dextran and NPs. By analyzing NP distribution in 3D space within and outside the microvasculature (Figure 4a), a mean 2.5-fold increase in fluorescence intensity was quantified in the region close to the narrowest lumen over 2 subsequent timepoints (Figure 4b). Changes in fluorescence intensity could be detected as far as 100 µm distance from the vessel wall (Figure 4c and 4d). In vivo, neurons are approximately 10 to 20 µm from the brain capillaries,[61] implying that in a hypothetical in vitro BBB model incorporating neurons,[62] NPs can travel across the BBB and reach the target neurons.
In our study, certain regions of the BBB microvasculature appeared to be leaky. This was possibly due to the heterogeneous expression of tight junctions and incomplete maturation of the microvasculature, resulting in a local increase in NP permeability. A possible method of reducing vessel leakiness is to continuously perfuse vessels with fluid flow which has been demonstrated to improve microvascular formation. Flow-mediated shear stress is known to promote the differentiation of vascular endothelial cells toward a more BBB-like phenotype and increase their expression of tight junction proteins and membrane transporters, further reducing vessel permeability.[63]
The data provided here present a new application of a previously developed 3D in vitro human BBB microvasculature model and an effective and convenient methodology for quantifying the transport and distribution properties of NPs across the model. Notably, model reproducibility depends on consistency of experimental parameters, including device geometry, and the specific batch and passage number of each cell type. Overall, our findings contribute insight on the influence of NP size, composition and surface functionalization on their transport properties.
In the future, the same methodology could be applied to a diseased BBB model, obtained by culturing the cells in the presence of inflammatory cytokines.[64] Indeed, a leakier BBB has often been associated with brain pathologies such as Parkinson’s Disease, Stroke,[65,66] and cancer metastasis to the brain.[67]
Moreover, the BBB model could be grown using iPSCs derived from patients with specific neurodegenerative diseases and unique genetic profiles, thereby producing a patient-specific pathological model to screen the efficacy and transport of nanocarriers for patient sub-groups. Personalized drug design could thus be tailored to the patient based on the screening results of the patient-specific BBB model. It remains unclear if there is significant variation in the BBB between patients and if there are significant differences in the results obtained using personalized in vitro models versus generic cell lines. However, the use of iPSC-ECs for developing patient-specific in vitro models can encourage further investigations that clarify these differences.[68] Therefore, the here-proposed methodology could contribute toward a better understanding of disease-specific transport processes and signaling molecular pathways, potentially leading to the discovery of new targets and candidate membrane transporters to enable improved drug delivery across the BBB.
4. Conclusion
This work reports initial findings on the application of a previously characterized self-assembled 3D in vitro human BBB model, for the evaluation of the transport and spatiotemporal distribution of different polymer NPs. The proposed methodology utilized fluorescently-tagged NPs and was able to capture the boost in transport of Tf-functionalized NPs in a few minutes. Results are highly relevant from the perspective of nanotherapeutic preclinical screening according to the principle of the 3Rs (Reduction, Refinement, Replacement).[69] In the future, this 3D in vitro platform could potentially enable patient-specific evaluation of drug-loaded NP delivery to the brain.
5. Experimental Section
Materials.
For seeding of microfluidic devices: polydimethylsiloxane (PDMS) (Sylgard 184 silicone elastomer kit) was purchased from Dow Corning. Fibrinogen (cat. no. F8630), fibronectin (cat. no. C010), poly-L-lysine (cat. no P4707) and thrombin (cat. no. T9549) were purchased from Sigma-Aldrich.
For PU synthesis: Poly(ε-caprolactone)-diol (PCL-diol (2,000 g mol−1), Poly(ethylenglicole) (PEG 2000 g mol−1), n-BOC Serinol, Dibutyl Dilaurate (DBTL), and 1,6 Hexamethylene diisocyanate (HDI) were purchased from Sigma-Aldrich (Milan, Italy).
For PU NP preparation: L-α-phosphatidylglycerol (Egg-PG), 1,2-distearoyl-sn-glycero-3-phosphoethanolamine-N-[carboxyl(polyethylene glycol)-2000] (DSPE-PEG-COOH) and L-α-phosphatidylethanolamine-N-(lissamine-rhodamine B-sulfonyl) (Egg-Liss-Rhod PE) were purchased from Avanti Polar Lipids (Alabaster, AL, USA). Holo-Tf Human (cat. no. T4132), N-(3-Dimethylaminopropyl)-N’-ethylcarbodiimide hydrochloride (EDC), N-Hydroxysuccinimide (NHS), 2-(N-morpholino)ethanesulfonic acid (MES) hemisodium salt, were purchased from Sigma-Aldrich (Milan, Italy).
Red fluorescent carboxylate PS NPs (cat. no. F8801, F8810, FluoSpheres) were purchased from Life Technologies and Spherotech (cat no. CFP-0562-2).
Preparation and characterization of NPs.
PS NPs (100, 200, 400 nm) were covalently conjugated with human holo-Tf as previously described.[42] Bare carboxylic-modified 100 nm PS NPs (2.2 mg mL−1) were incubated with Tf (2.2 mg mL−1) in MES buffer (50 mM) for 2 h at room temperature (RT). Tf-conjugated NPs were collected by centrifugation, suspended in Milli-Q water and stored at 4 °C for further use.
PU NPs were prepared by the nanoprecipitation method as previously described.[40] Briefly, the polymer was dissolved in acetonitrile and dropped into a water solution of lipids, containing Egg-PG (200 μg), DSPE-PEG-COOH (240 μg) and Egg-Liss-Rhod PE (5 µl). The particle suspension was centrifuged at 3200 rpm. For Tf covalent coupling, NPs were collected, resuspended in MES buffer, containing EDC and NHS (1:2.5 molar ratio) and incubated for 30 min at RT to activate the carboxyl groups on the surface. Activated NPs were quickly collected by centrifugation, resuspended in Dulbecco’s Phosphate Buffered Saline (DPBS) containing Tf (1:16 molar ratio to COOH), and incubated at 4 °C overnight. Tf-conjugated NPs were then collected, suspended in Milli-Q water and stored at 4 °C for further use.[40,42]
DLS and zeta-potential analysis were conducted using a Malvern ZS90 zeta-sizer (Nano ZS, Malvern, UK) to respectively measure the hydrodynamic diameter, polydispersity and zeta potential of different NPs. Cryo TEM was performed by dropping a PU NP suspension (7 µl, 0.5 mg mL−1) onto a carbon-coated copper mesh grid.
Cell culture.
Human iPSC-ECs (Cellular Dynamics International, CDI) and HBMECs (Angio-proteomie, cAP-0002) were cultured on flasks coated with human fibronectin (Millipore) (30 µg mL−1) in vascular medium (VascuLife VEGF Medium Complete Kit, Lifeline with iCell media supplement, CDI). Human primary astrocytes and pericytes (ScienCell) were cultured on flasks coated with poly-L-lysine in culture medium (ScienCell), and maintained in a humidified incubator (37 °C, 5% CO2). HUVECs (Lonza, C2519AS) were cultured in EGM-2 media (Endothelial Cell Growth Medium-2 Bulletkit, Lonza). Culture medium was replaced every 2 days and cells were used between P3 to P5.
Real-time RT-qPCR.
To measure protein expression of junction and transporter proteins, total RNA was isolated from iPSC-ECs, HBMECs and HUVECs after 7-days culture in 2D tissue culture plates by RNeasy Mini kit (Qiagen). Reverse transcription was performed using a SuperScript VILO cDNA Synthesis Kit (Invitrogen, Waltham, MA, USA) to synthesize cDNA from mRNA. The primer sequences are shown in Table S1, Supporting Information. Real-time RT-PCR was performed with a 7900HT Fast Real-Time PCR System (Applied Biosystems) using SYBR Premix Ex Taq II (Takara). The mRNA level of glyceraldehyde 3-phosphate dehydrogenase (GAPDH; housekeeping gene) was set to 100% and used as the internal standard in all experiments. RT-PCR experiments were repeated at least three times for cDNA prepared from at least three batches.
MTS assay.
iPSC-ECs were seeded in 96-well plates and allowed to grow to confluency (~ 80%). NPs were resuspended using different concentrations (0 – 500 µg mL−1 in culture medium), added to cells and left in the incubator for up to 4 h. Thereafter, cells were rinsed twice with DPBS before adding fresh medium without NPs but with the 3-(4,5-dimethylthiazol-2-yl)-5-(3-carboxymethoxyphenyl)-2-(4-sulfophenyl)-2H-tetrazolium (MTS) reagent. The MTS assay was then performed following the manufacturer’s instructions (CellTiter 96 AQueous One Solution Cell Proliferation Assay, Promega). Absorbance measurements were performed using the VMax micro plate reader (Molecular Devices).
Imaging and quantification of cellular NP uptake.
iPSC-ECs were plated on glass-bottom dishes (Matek, cat no. P35G-0–14-C) and allowed to grow to confluency (~ 80%). To visualize cells, cells were stained with Cell Tracker Green (CMFDA; 2 µM) following the manufacturer’s instructions. NPs (50 µg mL−1 in culture medium) were added to the labelled cells and then incubated for up to 4 h. After 4 h, cells were rinsed twice with DPBS to remove excess NPs before fixation with 4% paraformaldehyde and counterstained with DAPI (1:1000). Cells were imaged using confocal microscopy (1024 × 1024 pixels, 60X magnification) for at least 3 different regions of interest (ROI).
NP uptake was quantified by measuring the fluorescence intensity of the NP within two different 3D regions: (i) a region close to the nuclei (includes the nucleus and a 1 µm-thick layer surrounding the nucleus) and (ii) the cytoplasm. These were generated using Fiji software by applying the Trainable Weka Segmentation plugin and previously trained classifiers. The NP signal was first processed to remove background signal by using the filter “Remove Background” with a rolling radius of 15 pixels. The amount of fluorescence signal (a.u.) was determined in each region by multiplying the volume of the respective region and the volume-averaged value of the signal. Then, a ratio was obtained by dividing data of the nuclei-associated region by the signal within the cytoplasmic region.
Transwell set-up.
iPSC-ECs were seeded in transwell inserts (1 µm pore size; Corning) and allowed to grow to confluency over 2–3 days. Cell confluency, hence functionality of tight intercellular junctions, was assessed by measuring TEER using EVOM2 (World precision instrument) with silver/silver-chloride chopstick electrodes (STX2) between the cell-seeded insert and bottom surface of the culture plate well where the TEER probe was fully submerged in culture medium during measurement.
In a first set of experiments, after the formation of a confluent iPSC-EC monolayer, culture medium was aspirated, and cells were incubated (1 h and 3 h) with the NP suspension (200 µl, 50 µg mL−1 in culture medium) in the transwell insert, while culture medium (200 µl) was added in the bottom well. At each timepoint, medium in the insert and well was separately collected. The total fluorescence signal of each medium sample was measured by VMax micro plate reader (Molecular Devices). NP transport across the iPSC-EC monolayer was assessed by the ratio of measured fluorescence intensity of media collected from the bottom and top of the transwell insert (Figure 2i).
In a second set of experiments, a solution of only 70 kDa FITC-dextran (100 µg mL−1 in DPBS) or containing both FITC-dextran and NPs (100 µg mL−1 FITC-dextran and 50 µg mL−1 NPs in DPBS) was prepared. After formation of a confluent iPSC-EC monolayer, culture medium was aspirated, and cells were incubated with the FITC-dextran solution with/without NPs (200 µl) in the transwell insert, while DPBS (200 µl) was added in the bottom well. 3D z-stack images of the region above and below the insert membrane (interspace: 500 µm) were captured using a confocal microscope (800 × 800 pixels, 20X magnification) after 0 min and 5 min. Then, permeability across the 2D monolayer was quantified using Fiji software by considering the fluorescence intensities at both regions at 0 min (Itop0 and Ibottom0) and at 5 min (Itop5 and Ibottom5) for the green (FITC-dextran) and red (NPs) fluorescence channels, using Equation (1):
| (1) |
where the subscript I is the mean intensity of the signal within the ROI, Vb is the volume of bottom solution in the observation area, AT is the lateral surface of the transwell membrane (3.2 mm × 3.2 mm) and ∆t = t2−t1 is the duration of the test (5 min).
Development of 3D in vitro human BBB microvasculature.
The 3D BBB microvasculature was established following a previously reported protocol (Figure 1).[37] First, microfluidic devices, designed using AutoCAD (Autodesk) (height: 150 µm, fluidic channel width: 1340 µm, main channel width: 2200 µm, distance between posts: 150 µm; Figure S2, Supporting Information), were fabricated using soft lithography methods as previously described.[36]
All cells were detached, centrifuged, resuspended in thrombin solution (Sigma-Aldrich) (4 U mL−1 in VascuLife) and left on ice. The tri-cellular suspension (20 µl) was mixed with fibrinogen (Sigma-Aldrich; 20 µl, 6 mg mL−1 in DPBS) to achieve 6 × 10⁶ cells mL−1 iPSC-ECs, 1 × 10⁶ cells mL−1 pericytes and 1 × 10⁶ cells mL−1 astrocytes. The mixture was injected into the gel filling port. Devices were placed upside-down in a humidified chamber and left for 15 min (RT) for gel polymerization. Then, ‘medium A’, EGM-2 + vascular endothelial growth factor (VEGF, Peprotech; 50 ng mL−1) + 1% (v/v) Astrocyte Growth Supplement (ScienCell), was introduced to both fluidic channels. ‘Medium B’, EGM-2 + 1% (v/v) AGS, was used from days 5 to 7.
At day 2 or 3, medium was removed from one fluidic channel, replaced with fibronectin (30 µl, 60 µg mL−1 in DPBS) and left in the incubator for 30 min, before rinsing twice with DPBS. iPSC-ECs were detached, resuspended (2 × 10⁶ cells mL−1 in medium A) and the suspension (30 µl) injected into the coated fluidic channel. Devices were tilted upside-down (60° angle) for 15 min (RT), allowing cells to spread evenly over the gel interface by gravity. Then, medium A was added to the fluidic channel. The following day, non-adherent iPSC-ECs were removed by replacing with fresh medium and the procedure performed for the other fluidic channel. Media was replaced daily (Figure 1).
3D permeability measurements and quantification.
All NPs were freshly prepared before each experiment and vortexed for 10 s before their use. A solution of 70kDa FITC-dextran (Sigma-Aldrich) mixed with NPs was used for permeability experiments (100 µg mL−1 FITC-dextran and 50 µg mL−1 NPs in culture medium). Alternatively, a solution of 10, 40 or 70 kDa FITC-dextran solution (100 µg mL−1 in culture medium) was used. NPs were red fluorescent with an optimal excitation and emission wavelength of 580 nm and 605 nm, respectively.
To measure the permeability of fluorescent NPs in 3D, medium was first removed from both fluidic channels of each device. In one fluidic channel, a solution containing NPs and FITC-dextran (15 µl) was added, while culture medium without NPs (15 µl) was added simultaneously in the other fluidic channel. In other experiments, solutions of FITC-dextrans with different molecular weights were used. 3D z-stacks of the microvasculature in the gel channel was imaged at 5 min intervals by confocal microscopy (512 × 512 pixels, 20X magnification) (Olympus model FV1000) for at least 3 different ROI (of equal area and volume) that were taken along the length of the microfluidic channel to ensure non-biased sampling of the microvasculature (Figure 3a). Video recording of NP movement through the in vitro BBB microvasculature was obtained using NIS-Elements software (Nikon) on a fluorescence microscope (Nikon, Ti-E Eclipse) (1392 × 1040 pixels, 20X magnification, 15 frames s−1) (Movie S1).
NP permeability was quantified by considering the increase in fluorescence intensity of FITC-dextran and NPs within the gel using Equation (2):
| (2) |
where the subscripts g and v stand for the gel region and vascular region, respectively, I is the mean intensity of the signal within the ROI, Vg is the volume of the gel, Av is the lateral surface of the microvasculature and ∆t = t2−t1 is the duration of the test (5 to 30 min). As described in Equation (2), the same volume of gel to volume of microvasculature is considered in the calculation of permeability for each ROI over 2 subsequent timepoints. Geometrical parameters such as lateral area and volume of the network were computed using Fiji software by segmenting the images using the FITC-dextran signal with the 3D Trainable Weka Segmentation plugin and an ad-hoc classifier. The above-described measurements were derived based on the 3D analysis of the confocal image stacks of the microvasculature as previously described.[51]
Generation of 3D intensity map showing spatiotemporal distribution.
3D intensity maps were generated to assess the spatial distribution of NPs within the gel at each timepoint using 3D confocal image stacks. The fluorescence intensity of NPs in the ROI, which include the microvasculature and surrounding gel region, was then plotted in 3D. To achieve this aim, TIFF 3D stacks were converted to VTK files using a Matlab code (https://it.mathworks.com/matlabcentral/fileexchange/58819-write-2d-and-3d-arrays-into-vtk), before displaying the final 3D intensity maps using Paraview (https://www.paraview.org/). Spatiotemporal distribution analysis was performed using Fiji software (http://rsbweb.nih.gov/ij/). Briefly, intensity images were sampled along specific lines drawn within single image planes across different timepoints. Then, intensity profile histograms of the cross-section were plotted.
Statistical analysis.
All data were plotted as the mean ± standard deviation (SD) using Prism (GraphPad software). Statistical analysis was determined using a two-tailed Student’s t-test and where appropriate, one-way ANOVA with Holm-Sidak’s multiple comparisons test or Kruskal-Wallis H test with Dunn’s multiple comparisons test. Bar graphs display the pooled results (mean ± SD) of ≥ 3 independent experiments (3–5 devices per condition for each experiment; ≥ 3 ROI for each device; total ROI per condition on average n = 30). p values and adjusted p values of less than 0.05 were taken as evidence of a statistically significant difference.
Supplementary Material
Acknowledgements
Funding support was provided by the National Research Foundation, Prime Minister’s Office, Singapore, under its CREATE program for the Singapore-MIT Alliance for Research and Technology BioSystems and Micromechanics IRG (S.L., R.K.), MIT-POLITO grant BIOMODE – Compagnia di San Paolo (M.C., R.K., V.C.), Fondazione Fratelli Agostino and Enrico Rocca under the Progetto Rocca doctoral fellowship (L.P.), European Union’s Horizon 2020 research and innovation program under the Marie Sklodowska-Curie grant agreement 658665 (C.M.), National Science Foundation, Science and Technology Center on Emergent Behaviors of Integrated Cellular Systems (CBET-0939511) (T.O., R.K.), a core grant to Singapore Immunology Network (SIgN) from Agency for Science, Technology and Research (A*STAR) (G.A.), and US National Cancer Institute (U01 CA214381–01) (R.K.). M.C. would like to acknowledge support from the joint “Doctorate of Bioengineering and Medical-Surgical Sciences” of University of Turin and Politecnico di Torino.
Footnotes
Supporting Information
Supporting Information is available from the Wiley Online Library or from the author.
Conflict of Interest
R.K. is a co-founder and has significant financial interest in AIM Biotech, a company that manufactures microfluidic systems.
Contributor Information
Sharon Wei Ling Lee, Singapore-MIT Alliance for Research and Technology (SMART), BioSystems and Micromechanics (BioSyM) IRG, 1 Create Way, #04-13/14, Singapore 138602, Singapore; Department of Microbiology and Immunology, Yong Loo Lin School of Medicine, National University of Singapore, 5 Science Drive 2, Singapore 117545, Singapore; Singapore Immunology Network (SIgN), Agency for Science, Technology and Research (A*STAR), 8A Biomedical Grove, Immunos Building, Biopolis, Singapore 138648, Singapore.
Marco Campisi, Department of Mechanical and Aerospace Engineering, Politecnico di Torino, Corso Duca Degli Abruzzi 24, 10129 Torino, Italy.
Tatsuya Osaki, Institute of Industrial Science, The University of Tokyo, Fe412, Komaba 4-6-1, Meguro-ku, 153-8505, Japan; Department of Mechanical Engineering, Massachusetts Institute of Technology, 500 Technology Square, MIT Building, Room NE47-321, Cambridge, MA, 02139, USA.
Luca Possenti, LaBS, Department of Chemistry, Materials and Chemical Engineering “Giulio Natta” (CMIC), Politecnico di Milano, Piazza Leonardo Da Vinci 32, 20133 Milan, Italy.
Clara Mattu, Department of Mechanical and Aerospace Engineering, Politecnico di Torino, Corso Duca Degli Abruzzi 24, 10129 Torino, Italy.
Giulia Adriani, Singapore Immunology Network (SIgN), Agency for Science, Technology and Research (A*STAR), 8A Biomedical Grove, Immunos Building, Biopolis, Singapore 138648, Singapore; Department of Biomedical Engineering, Faculty of Engineering, National University of Singapore, 4 Engineering Drive 3, Singapore 117583, Singapore.
Roger Dale Kamm, Department of Mechanical Engineering, Massachusetts Institute of Technology, 500 Technology Square, MIT Building, Room NE47-321, Cambridge, MA, 02139, USA; Department of Biological Engineering, Massachusetts Institute of Technology, 500 Technology Square, MIT Building, Room NE47-321, Cambridge, MA, 02139, USA.
Valeria Chiono, Department of Mechanical and Aerospace Engineering, Politecnico di Torino, Corso Duca Degli Abruzzi 24, 10129 Torino, Italy.
References
- [1].Cipolla MJ, Control of Cerebral Blood Flow, Morgan & Claypool Life Sciences, 2009. [PubMed] [Google Scholar]
- [2].Abbott NJ, Patabendige AAK, Dolman DEM, Yusof SR, Begley DJ, Neurobiol. Dis 2010, 37, 13. [DOI] [PubMed] [Google Scholar]
- [3].Bell RD, Berislav AE, Zlokovic V, Acta Neuropathol 2009, 118, 103. [DOI] [PMC free article] [PubMed] [Google Scholar]
- [4].Jain RK, Di Tomaso E, Duda DG, Loeffler JS, Sorensen AG, Batchelor TT, Nat. Rev. Neurosci 2007, 8, 610. [DOI] [PubMed] [Google Scholar]
- [5].Pardridge WM, Expert Opin. Drug Deliv 2016, 13, 963. [DOI] [PubMed] [Google Scholar]
- [6].Meyers JD, Doane T, Burda C, Basilion JP, Nanomedicine 2013, 8, 123. [DOI] [PMC free article] [PubMed] [Google Scholar]
- [7].Woodrow KA, Cu Y, Booth CJ, Saucier-sawyer JK, Wood MJ, Mark Saltzman W, Saltzman WM, Nat. Mater 2009, 8, 526. [DOI] [PMC free article] [PubMed] [Google Scholar]
- [8].Zhang Y, Zhang YF, Bryant J, Charles A, Boado RJ, Pardridge WM, Clin. Cancer Res 2004, 10, 3667. [DOI] [PubMed] [Google Scholar]
- [9].Kreuter J, Alyautdin RN, Kharkevich DA, Ivanov AA, Brain Res 1995, 674, 171. [DOI] [PubMed] [Google Scholar]
- [10].Shao K, Huang R, Li J, Han L, Ye L, Lou J, Jiang C, J. Control. Release 2010, 147, 118. [DOI] [PubMed] [Google Scholar]
- [11].Saraiva C, Praça C, Ferreira R, Santos T, Ferreira L, Bernardino L, J. Control. Release 2016, 235, 34. [DOI] [PubMed] [Google Scholar]
- [12].Chen Y, Liu L, Adv. Drug Deliv. Rev 2012, 64, 640. [DOI] [PubMed] [Google Scholar]
- [13].Gao H, Acta Pharm. Sin. B 2016, 6, 268. [DOI] [PMC free article] [PubMed] [Google Scholar]
- [14].Shalviri A, Chan HK, Raval G, Abdekhodaie MJ, Liu Q, Heerklotz H, Wu XY, Colloids Surfaces B Biointerfaces 2013, 101, 405. [DOI] [PubMed] [Google Scholar]
- [15].Shilo M, Sharon A, Baranes K, Motiei M, Lellouche J-PM, Popovtzer R, J. Nanobiotechnology 2011, 13, 10.1186/s12951-015-0075-7. [DOI] [PMC free article] [PubMed] [Google Scholar]
- [16].Li J, Cai P, Shalviri A, Henderson JT, He C, Foltz WD, Prasad P, Brodersen PM, Chen Y, Dacosta R, Rauth AM, Wu XY, ACS Nano 2014, 8, 9925. [DOI] [PubMed] [Google Scholar]
- [17].Chen H, Tang L, Qin Y, Yin Y, Tang J, Tang W, Sun X, Zhang Z, Liu J, He Q, Eur. J. Pharm. Sci 2010, 40, 94. [DOI] [PubMed] [Google Scholar]
- [18].Gan CW, Feng SS, Biomaterials 2010, 31, 7748. [DOI] [PubMed] [Google Scholar]
- [19].Niewoehner J, Bohrmann B, Collin L, Urich E, Sade H, Maier P, Rueger P, Stracke JO, Lau W, Tissot AC, Loetscher H, Ghosh A, Freskgård PO, Neuron 2014, 81, 49. [DOI] [PubMed] [Google Scholar]
- [20].Wang J, Jensen UB, V Jensen G, Shipovskov S, Balakrishnan VS, Otzen D, Pedersen JS, Besenbacher F, Sutherland DS, Nanosciencecenter I, Nano Lett 2011, 11, 4985. [DOI] [PubMed] [Google Scholar]
- [21].Uchida Y, Ohtsuki S, Katsukura Y, Ikeda C, Suzuki T, Kamiie J, Terasaki T, J. Neurochem 2011, 117, 333. [DOI] [PubMed] [Google Scholar]
- [22].Choudhury H, Pandey M, Chin PX, Phang YL, Cheah JY, Ooi SC, Mak KK, Pichika MR, Kesharwani P, Hussain Z, Gorain B, Drug Deliv. Transl. Res 2018, 8, 1545. [DOI] [PubMed] [Google Scholar]
- [23].Scherrmann JM, Vascul. Pharmacol 2002, 38, 349. [DOI] [PubMed] [Google Scholar]
- [24].Pardridge WM, Curr. Opin. Pharmacol 2006, 6, 494. [DOI] [PubMed] [Google Scholar]
- [25].Recht L, Torres CO, Smith TW, Raso V, Griffin TW, J. Neurosurg 2009, 72, 941. [DOI] [PubMed] [Google Scholar]
- [26].Clark AJ, Davis ME, Proc. Natl. Acad. Sci 2015, 112, 12486. [DOI] [PMC free article] [PubMed] [Google Scholar]
- [27].Johnsen KB, Burkhart A, Melander F, Kempen PJ, Vejlebo JB, Siupka P, Nielsen MS, Andresen TL, Moos T, Sci. Rep 2017, 7, 10.1038/s41598-017-11220-1. [DOI] [PMC free article] [PubMed] [Google Scholar]
- [28].Paterson J, Webster CI, Drug Discov. Today Technol 2016, 20, 49. [DOI] [PubMed] [Google Scholar]
- [29].Sohet F, Daneman R, Fluids Barriers CNS 2013, 10, 10.1186/2045-8118-10-3. [DOI] [PMC free article] [PubMed] [Google Scholar]
- [30].Aday S, Cecchelli R, Hallier-Vanuxeem D, Dehouck MP, Ferreira L, Trends Biotechnol 2016, 34, 10.1016/j.tibtech.2016.01.001. [DOI] [PubMed] [Google Scholar]
- [31].Hajal C, Campisi M, Mattu C, Chiono V, Kamm RD, Biomicrofluidics 2018, 12, 42213. [DOI] [PMC free article] [PubMed] [Google Scholar]
- [32].Boussommier-Calleja A, Li R, Chen MB, Wong SC, Kamm RD, Trends in cancer 2016, 2, 6. [DOI] [PMC free article] [PubMed] [Google Scholar]
- [33].Aref AR, Campisi M, Ivanova E, Portell A, Larios D, Piel BP, Mathur N, Zhou C, Coakley RV, Bartels A, Bowden M, Herbert Z, Hill S, Gilhooley S, Carter J, Cañadas I, Thai TC, Kitajima S, Chiono V, Paweletz CP, Barbie DA, Kamm RD, Jenkins RW, Lab Chip 2018, 18, 3129. [DOI] [PMC free article] [PubMed] [Google Scholar]
- [34].Lee SWL, Adriani G, Ceccarello E, Pavesi A, Tan AT, Bertoletti A, Kamm RD, Wong SC, Front. Immunol 2018, 9, 10.3389/fimmu.2018.00416. [DOI] [PMC free article] [PubMed] [Google Scholar]
- [35].Pavesi A, Tan AT, Koh S, Chia A, Colombo M, Antonecchia E, Miccolis C, Ceccarello E, Adriani G, Raimondi MT, Kamm RD, Bertoletti A, J. Clin. Investig. Insights 2017, 2, e89762. [DOI] [PMC free article] [PubMed] [Google Scholar]
- [36].Aref AR, Huang RYJ, Yu W, Chua KN, Sun W, Tu TY, Bai J, Sim WJ, Zervantonakis IK, Thiery JP, Kamm RD, Integr. Biol 2013, 5, 381. [DOI] [PMC free article] [PubMed] [Google Scholar]
- [37].Campisi M, Shin Y, Osaki T, Hajal C, Chiono V, Kamm RD, Biomaterials 2018, 180, 117. [DOI] [PMC free article] [PubMed] [Google Scholar]
- [38].Bang S, Lee S-R, Ko J, Son K, Tahk D, Ahn J, Im C, Li Jeon N, Sci. Rep 2017, 7, 10.1038/s41598-017-07416-0. [DOI] [PMC free article] [PubMed] [Google Scholar]
- [39].Maoz BM, Herland A, Fitzgerald EA, Grevesse T, Vidoudez C, Pacheco AR, Sheehy SP, Park TE, Dauth S, Mannix R, Budnik N, Shores K, Cho A, Nawroth JC, Segrè D, Budnik B, Ingber DE, Parker KK, Nat. Biotechnol 2018, 36, 865. [DOI] [PMC free article] [PubMed] [Google Scholar]
- [40].Mattu C, Brachi G, Menichetti L, Flori A, Armanetti P, Ranzato E, Martinotti S, Nizzero S, Ferrari M, Ciardelli G, Acta Biomater 2018, 80, 341. [DOI] [PubMed] [Google Scholar]
- [41].Popielarski SR, Pun SH, Davis ME, Bioconjug. Chem 2005, 16, 1063. [DOI] [PubMed] [Google Scholar]
- [42].Pitek AS, O’Connell D, Mahon E, Monopoli MP, Francesca Baldelli F, Dawson KA, PLoS One 2012, 7, 10.1371/journal.pone.0040685. [DOI] [PMC free article] [PubMed] [Google Scholar]
- [43].Chen MB, Hajal C, Benjamin DC, Yu C, Azizgolshani H, Hynes RO, Kamm RD, Proc. Natl. Acad. Sci 2018, 115, 7022. [DOI] [PMC free article] [PubMed] [Google Scholar]
- [44].Boussommier-Calleja A, Atiyas Y, Haase K, Headley M, Lewis C, Kamm RD, Biomaterials 2019, 198, 180. [DOI] [PMC free article] [PubMed] [Google Scholar]
- [45].Armulik A, Genové G, Mäe M, Nisancioglu MH, Wallgard E, Niaudet C, He L, Norlin J, Lindblom P, Strittmatter K, Johansson BR, Betsholtz C, Nature 2010, 468, 557. [DOI] [PubMed] [Google Scholar]
- [46].Abbott NJ, Rönnbäck L, Hansson E, Nat. Rev. Neurosci 2006, 7, 41. [DOI] [PubMed] [Google Scholar]
- [47].Heltianu C, Serban G, Alexandru V, Gafencu A, Simionescu N, Simionescu M, Eur. J. Cell Biol 1997, 72, 79. [PubMed] [Google Scholar]
- [48].Tabuchi M, Yanatori I, Kawai Y, Kishi F, J. Cell Sci 2010, 123, 756. [DOI] [PubMed] [Google Scholar]
- [49].Toth AE, Nielsen MS, Neural Regen. Res 2018, 13, 1883. [DOI] [PMC free article] [PubMed] [Google Scholar]
- [50].Hanada S, Fujoka K, Inoue Y, Kanaya F, Manome Y, Yamamoto K, in J Phys. Conf. Ser, 2013, p. 12028.
- [51].Offeddu GS, Haase K, Gillrie MR, Li R, Morozova O, Hickman D, Knutson CG, Kamm RD, Biomaterials 2019, 10.1016/j.biomaterials.2019.05.022. [DOI] [PubMed]
- [52].Mrozowska PS, Fukuda M, J. Cell Biol 2016, 213, 355. [DOI] [PMC free article] [PubMed] [Google Scholar]
- [53].Pardridge WM, Triguero D, Yang J, Cancilla PA, J. Pharmacol. Exp. Ther 1990, 253, 884. [PubMed] [Google Scholar]
- [54].Ribecco-Lutkiewicz M, Sodja C, Haukenfrers J, Haqqani AS, Ly D, Zachar P, Baumann E, Ball M, Huang J, Rukhlova M, Martina M, Liu Q, Stanimirovic D, Jezierski A, Bani-Yaghoub M, Sci. Rep 2018, 8, 10.1038/s41598-018-19522-8. [DOI] [PMC free article] [PubMed] [Google Scholar]
- [55].Deng ZJ, Liang M, Monteiro M, Toth I, Minchin RF, Nat. Nanotechnol 2011, 6, 39. [DOI] [PubMed] [Google Scholar]
- [56].Nierenberg D, Khaled AR, Flores O, Reports Pract. Oncol. Radiother 2018, 23, 300. [DOI] [PMC free article] [PubMed] [Google Scholar]
- [57].Barbero F, Russo L, Vitali M, Piella J, Salvo I, Borrajo ML, Busquets-fité M, Grandori R, Bastús NG, Casals E, Semin. Immunol 2017, 34, 52. [DOI] [PubMed] [Google Scholar]
- [58].Otsuka H, Nagasaki Y, Kataoka K, Adv. Drug Deliv. Rev 2003, 55, 403. [DOI] [PubMed] [Google Scholar]
- [59].Hamad I, Al-Hanbali O, Hunter AC, Rutt KJ, Andresen TL, Moein Moghimi S, Moghimi SM, ACS Nano 2010, 4, 6629. [DOI] [PubMed] [Google Scholar]
- [60].Salvati A, Pitek AS, Monopoli MP, Prapainop K, Bombelli FB, Hristov DR, Kelly PM, Åberg C, Mahon E, Dawson KA, Nat. Nanotechnol 2013, 8, 137. [DOI] [PubMed] [Google Scholar]
- [61].Wong AD, Ye M, Levy AF, Rothstein JD, Bergles DE, Searson PC, Front. Neuroeng 2013, 6, 10.3389/fneng.2013.00007. [DOI] [PMC free article] [PubMed] [Google Scholar]
- [62].Osaki T, Shin Y, Sivathanu V, Campisi M, Kamm RD, Adv. Healthc. Mater 2018, 7, 10.1002/adhm.201700489. [DOI] [PubMed] [Google Scholar]
- [63].Cucullo L, Hossain M, Puvenna V, Marchi N, Janigro D, BMC Neurosci 2011, 12, 40. [DOI] [PMC free article] [PubMed] [Google Scholar]
- [64].Zhao Z, Nelson AR, Betsholtz C, V Zlokovic B, Cell 2015, 163, 1064. [DOI] [PMC free article] [PubMed] [Google Scholar]
- [65].Obermeier B, Daneman R, Ransohoff RM, Nat. Med 2013, 19, 1584. [DOI] [PMC free article] [PubMed] [Google Scholar]
- [66].Sweeney MD, Sagare AP, V Zlokovic B, Nat. Rev. Neurol 2018, 14, 133. [DOI] [PMC free article] [PubMed] [Google Scholar]
- [67].Aizer AA, Lee EQ, Neurol. Clin 2018, 36, 557. [DOI] [PubMed] [Google Scholar]
- [68].Ben-David U, Siranosian B, Ha G, Tang H, Oren Y, Hinohara K, craig A, Strathdee J, Dempster NJ, Lyons R, Burns A, Nag G, Kugener B, Cimini P, Tsvetkov YE, Maruvka R, O’Rourke A, Garrity A, Tubelli A, Bandopadhayay P, Tsherniak A, Vazquez F, Wong B, Birger C, Ghandi M, Thorner AR, Bittker JA, Meyerson M, Getz G, Beroukhim R, Golub TR, Nature 2018, 560, 325. [DOI] [PMC free article] [PubMed] [Google Scholar]
- [69].Tannenbaum J, Bennett BT, J. Am. Assoc. Lab. Anim. Sci 2015, 54, 120. [PMC free article] [PubMed] [Google Scholar]
Associated Data
This section collects any data citations, data availability statements, or supplementary materials included in this article.