Abstract
The performance of a depth-of-interaction (DOI) encoding PET detector module with dual-ended readout of LYSO scintillator arrays using large-area SiPM arrays was evaluated. Each SiPM array, with a surface area 50.2 × 50.2 mm2, consists of 12 × 12 C-series SiPMs from SensL (SensL, Inc). The LYSO array, with a total size of 46 × 46 mm2 and a pitch size of 1.0 mm, consists of a 46 × 46 array of 0.945 × 0.945 × 20 mm3 polished LYSO crystals, separated by Toray reflector. Custom front-end electronics were designed to reduce the 288 SiPM signals of one detector module to 9 signals, 8 for position information and 1 for timing information. Schottky diodes were used to block noise from SiPMs that did not detect a significant number of scintillation photons following a gamma interaction. Measurements of noise, signal, signal-to-noise ratio, energy resolution and flood histogram quality were obtained at different bias voltages (26.0 to 31.0 V in 0.5 V intervals) and at two temperatures (5 °C and 20 °C). Clear acrylic plates, 2.0 mm thick, were used as light guides to spread the scintillation photons. Timing resolution, depth of interaction resolution, and the effect of event rate on detector performance were measured at the bias voltage determined to be optimal for the flood histograms. Performance obtained with and without the noise-blocking Shottky diodes was also compared. The results showed that all crystals in the LYSO array can be clearly resolved, and performance improved when using diodes to block noise, and at the lower temperature. The average energy resolution, flood histogram quality, timing resolution and DOI resolution were 23.8 ± 2.0 %, 1.54 ± 0.17, 1.78 ± 0.09 ns and 2.81 ± 0.13 mm respectively, obtained at a bias voltage of 30.0 V and a temperature of 5 °C using the diode readout method. The event rate experiments showed that the flood histogram and energy resolution of the detector were not significantly degraded for an event rate of up to 150 000 counts/s.
1. Introduction
High resolution and high sensitivity positron emission tomography (PET) scanners are powerful functional and molecular imaging tools to image biological processes in vivo (Tai et al 2003 and Slomka et al 2016). Most PET detectors are based on scintillator arrays coupled to photodetector (Lewellen 2008). To simultaneously achieve high spatial resolution and high sensitivity, long crystals with small cross-sectional area are required, and the detectors are best located close to the subject to cover a large solid angle and reduce effect of the non-colinearity of the gamma photons on spatial resolution (Stickel and Cherry 2004). However, PET scanners with compact geometry and long crystals suffer from the parallax error (mispositioning of the line of response), which can be mitigated using detectors with depth-of-interaction (DOI) encoding capability (Stickel and Cherry 2004, Yang et al 2008 and Shao et al 2014).
Various approaches have been proposed to obtain DOI information from PET detectors, including multi-layer crystals, custom reflector designs, the use of the light distribution in monolithic crystals and the dual-ended readout method (Joung et al 2002, Yang et al 2006, Du et al 2008, Thompson and Goertzen 2011, Kolb et al 2014 and Lee and Lee 2015). Compared to other methods, reading out the scintillators from both ends maximizes overall light collection and provides extremely good high DOI resolution, as well as continuous DOI information, by using the energy ratio of the two photodetector signals (Yang et al 2006). The dual-ended readout method has been successfully implemented in several prototype PET scanners where the uniformity of the spatial resolution was significantly improved (Yang et al 2008 and Shao et al 2014).
Silicon photomultipliers (SiPMs) are the most suitable photodetectors for dual-ended readout PET detectors due to their compact size and high gain, compared to photomultiplier tubes (PMTs) and avalanche photodiodes (APDs). DOI detector modules using SiPM arrays or position sensitive SiPMs (PS-SiPM) with small dimensions < 16 × 16 mm2 have been widely investigated (Schmall et al 2013, Shao et al 2014, Du et al 2015 and Du et al 2018). The packing fraction of these SiPM array based detectors is low, however, due to the edge effect (the SiPM arrays need to be larger than the crystal array to decode the edge crystals), resulting in large dead space between modules when constructing PET scanners. A high packing fraction can be achieved using PS-SiPMs, however, it is difficult to build large-area (>20 × 20 mm2) PS-SiPMs and the capacitance of such large-area devices is problematic (Schmall et al 2013 and Du et al 2018).
One way to build higher packing fraction DOI detector modules is using large-area SiPM arrays. In this paper, a DOI detector module based on a 12 × 12 array (50.2 × 50.2 mm2) of SiPMs coupled to both ends of a 46 × 46 array of polished LYSO crystals with 1 mm pitch was designed and evaluated. The proposed detector module has a packing fraction of 84%, and requires just 9 electronic channels for further processing, 8 for position information and 1 for timing information, to read out the 25cm2 detector area. Performance in terms of flood histogram quality, energy resolution and signal-to-noise ratio (SNR) were measured at different bias voltages (26.0 to 31.0 V in 0.5 V intervals) and at two temperatures (5 °C and 20 °C). Timing resolution and DOI resolution were measured at the bias voltage determined to be optimal for the flood histograms. One concern for large-area detectors is the high singles rate that the module must handle without incurring significant dead time losses or mispositioning due to pile up. Therefore, the performance of the module was also evaluated as a function of event rate (Du et al 2015 and Du et al 2018).
2. Materials and Methods
2.1. DOI detector module
The DOI detector module (figure 1) consists of two 12 × 12 arrays of 3 × 3 mm2 C-series SiPMs (MicroFB-30035-SMT) (SensL, Inc), and a 46 × 46 array of 0.945 × 0.945 × 20 mm3 polished LYSO crystals (Crystal Photonics, Inc). The total area of the SiPM arrays is 50.2 × 50.2 mm2, and the center-to-center distance of two SiPMs is 4.2 mm, leaving a 1.2 mm dead space between SiPMs, as shown in figure 2 (a) and (b). Each SiPM pixel has an active area of 3.0 × 3.0 mm2 and contains 4,774 microcells (35 μm) with a 64% fill factor. The C-series SiPMs are fabricated using a p-on-n structure that significantly improves photon detection efficiency (PDE) for blue light. They have a 41% PDE at 420 nm and an over-voltage of 5.0 V (SensL 2014), matching well the emission spectra of widely-used LSO or LYSO crystals in PET (Saoudi et al 1999 and Du et al 2009). The pitch size of the LYSO array is 1.0 mm and Toray reflector (Toray industries, Inc.) was used to optically isolate the crystals.
Figure 1.

Photograph of the DOI detector module with readout electronics, which reduce the 288 SiPM signals to 9 signals (8 for position information and 1 for timing information).
Figure 2.

(a) Photograph and (b) diagram of the 12 × 12 SiPM array. The light blue squares in (b) indicate the active area of SiPMs. (c) photograph of the LYSO array. The two ends of the LYSO array were left open.
To create light sharing among SiPMs, clear acrylic slabs with a thickness of 2.0 mm were used as light guides and coupled between the scintillator arrays and SiPM surface using optical grease BC-630 (Saint-Gobain). 2.0 mm thick clear acrylic slabs were selected by comparing the results obtained using clear acrylic slabs with thicknesses ranging from 1.5 mm to 3.0 mm. The SiPM arrays, crystal array and clear acrylic slabs were assembled together using a 3D printed holder to maintain the relative position of components for different experiments (figure 1).
2.2. Signal multiplexing circuit
Each SiPM pixel has two outputs, a fast output and a standard output (SensL 2014). As the detector was built to achieve high spatial resolution, to simplify the readout electronics, only the standard outputs were used and the fast outputs were left floating. In our custom front-end electronics (figures 1 and 3), the standard outputs were individually amplified. Two different preamplifier circuits were designed and compared, as shown in figure 4. The first one is the standard readout method and the second is the diode readout method. As each SiPM array has 144 elements distributed over a large area, and during any given gamma interaction only a subset of the SiPMs detect scintillation photons, Schottky diodes (NSR0320, ON Semiconductor) were used to block noise from the SiPMs with negligible signals (Anderson and Anderson 2017 and Rudan 2017). To compensate the forward voltage of the diodes, a diode bias voltage of 125 mV was applied (ON Semiconductor 2011). This value was chosen by investigating several diode bias voltages to determine the tradeoff between signal loss and noise reduction.
Figure 3.
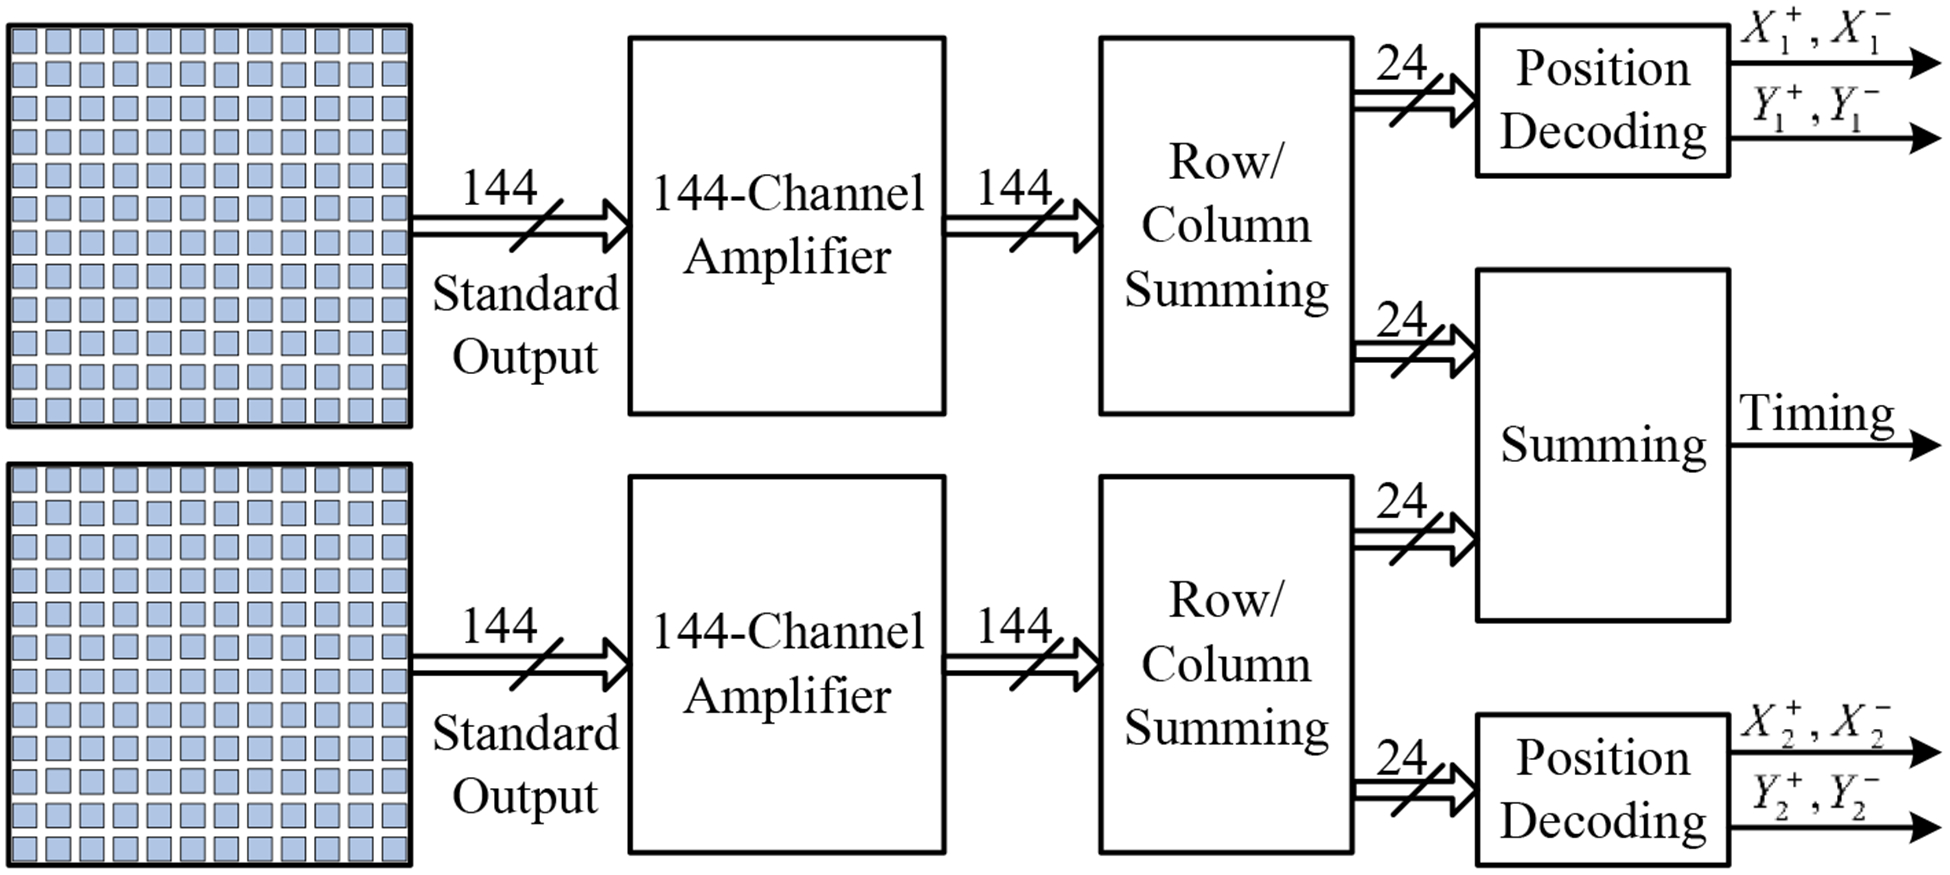
Block diagram of the readout electronics.
Figure 4.

Schematic of the amplifier circuit for a single SiPM pixel. (a) standard readout method and (b) diode readout method. All the 288 SiPMs have their own identical amplifier circuit.
For each SiPM array, the amplified SiPM signals were summed into rows and columns, generating 12 row signals and 12 column signals. The row/column signals were weighted by applying a gain to each row and column proportional to its location along each axis, generating four position signals (Popov 2011). The 8 position signals of one detector module were further amplified and shaped by a spectroscopy amplifier (N586B, CAEN) and digitized by a PowerDAQ board (PD2MFS, United Electronic Industries). The gamma photon interaction position x and y, deposited energy E and DOI information were calculated using the following functions:
| (1) |
| (2) |
| (3) |
where , , , are the four position signals from SiPM array 1 and 2 respectively.
The 24 row signals and 24 column signals were summed together to form one global timing signal and sent to a constant fraction discriminator (CFD) (584, ORTEC) to generate a time stamp and to generate a trigger for the DAQ board.
2.3. Experimental methods
2.3.1. Flood histograms
A 0.5 mm diameter, 50 uCi 68Ge point source, located 150 mm above one end of the LYSO array, was used to irradiate the LYSO crystals. To determine the settings to achieve the best flood histograms, these histograms were measured at different bias voltages (from 26.5 V to 31.0V, in 0.5 V intervals) and a 250 – 750 keV energy window was applied to each crystal to select events. To quantitatively compare the flood histogram quality at different bias voltages, a flood histogram quality metric was calculated following the method described in Du et al 2016. Briefly, the flood histogram quality parameter ki was calculated for all 2,116 crystals in the LYSO array based on the ratio of the crystal separation to the spot size, and the flood histogram was quantified using the geometric mean and the standard deviation for all ki using the following function,
| (4) |
2.3.2. Signal to noise ratio and energy resolution
The data used to generate the flood histogram were also used to calculate the SNR and energy resolution. The signal amplitude for each individual crystal was quantified as the centroid of the Gaussian fit to the 511 keV photopeak of the energy spectrum. The energy resolution was the FWHM to the centroid of the Gaussian fit. The average signal amplitude and the average energy resolution of all crystals in the LYSO array were taken as a measure of the signal and the energy resolution for the whole crystal array respectively (Du et al 2018).
The SNR was calculated following the methods described in Yang et al 2011 and Du et al 2013. Briefly, the noise was measured by periodically triggering the DAQ board using the computer clock and the FWHM of histogram of the summed 8 position signals was treated as the noise. The average SNR was calculated as the ratio of the average signal amplitude to the noise.
2.3.3. DOI measurements
The DOI resolution was measured using a reference detector consisting of a PMT and a 20 × 20 × 0.5 mm3 LSO slab wrapped with teflon tape. A 0.5 mm 68Ge point source was mounted on a translation table with the reference detector to irradiate the crystals from the side at different depths (Du et al 2018). The distance from the point source to the LSO slab was 100 mm and the distance from the point source to the surface of the LYSO array was 80 mm (figure 5 (a)). Due to the large size of the LYSO array, only part of the crystal array can be irradiated and used for DOI analysis, as shown in figure 5. The 276 crystals (12 rows × 23 columns) in the white rectangle (figure 5) were used. The DOI resolution was measured at five depths (from 2 mm to 18 mm, in 4 mm steps) and at two temperatures (5 °C and 20 °C). The bias voltage was the optimal bias voltage determined for the flood histogram (30.0 V for the diode readout method and 28.0 V for the standard readout method). A 250–750 keV energy window was applied to each crystal to select events, and no correction for the source size or beam geometry was made.
Figure 5.
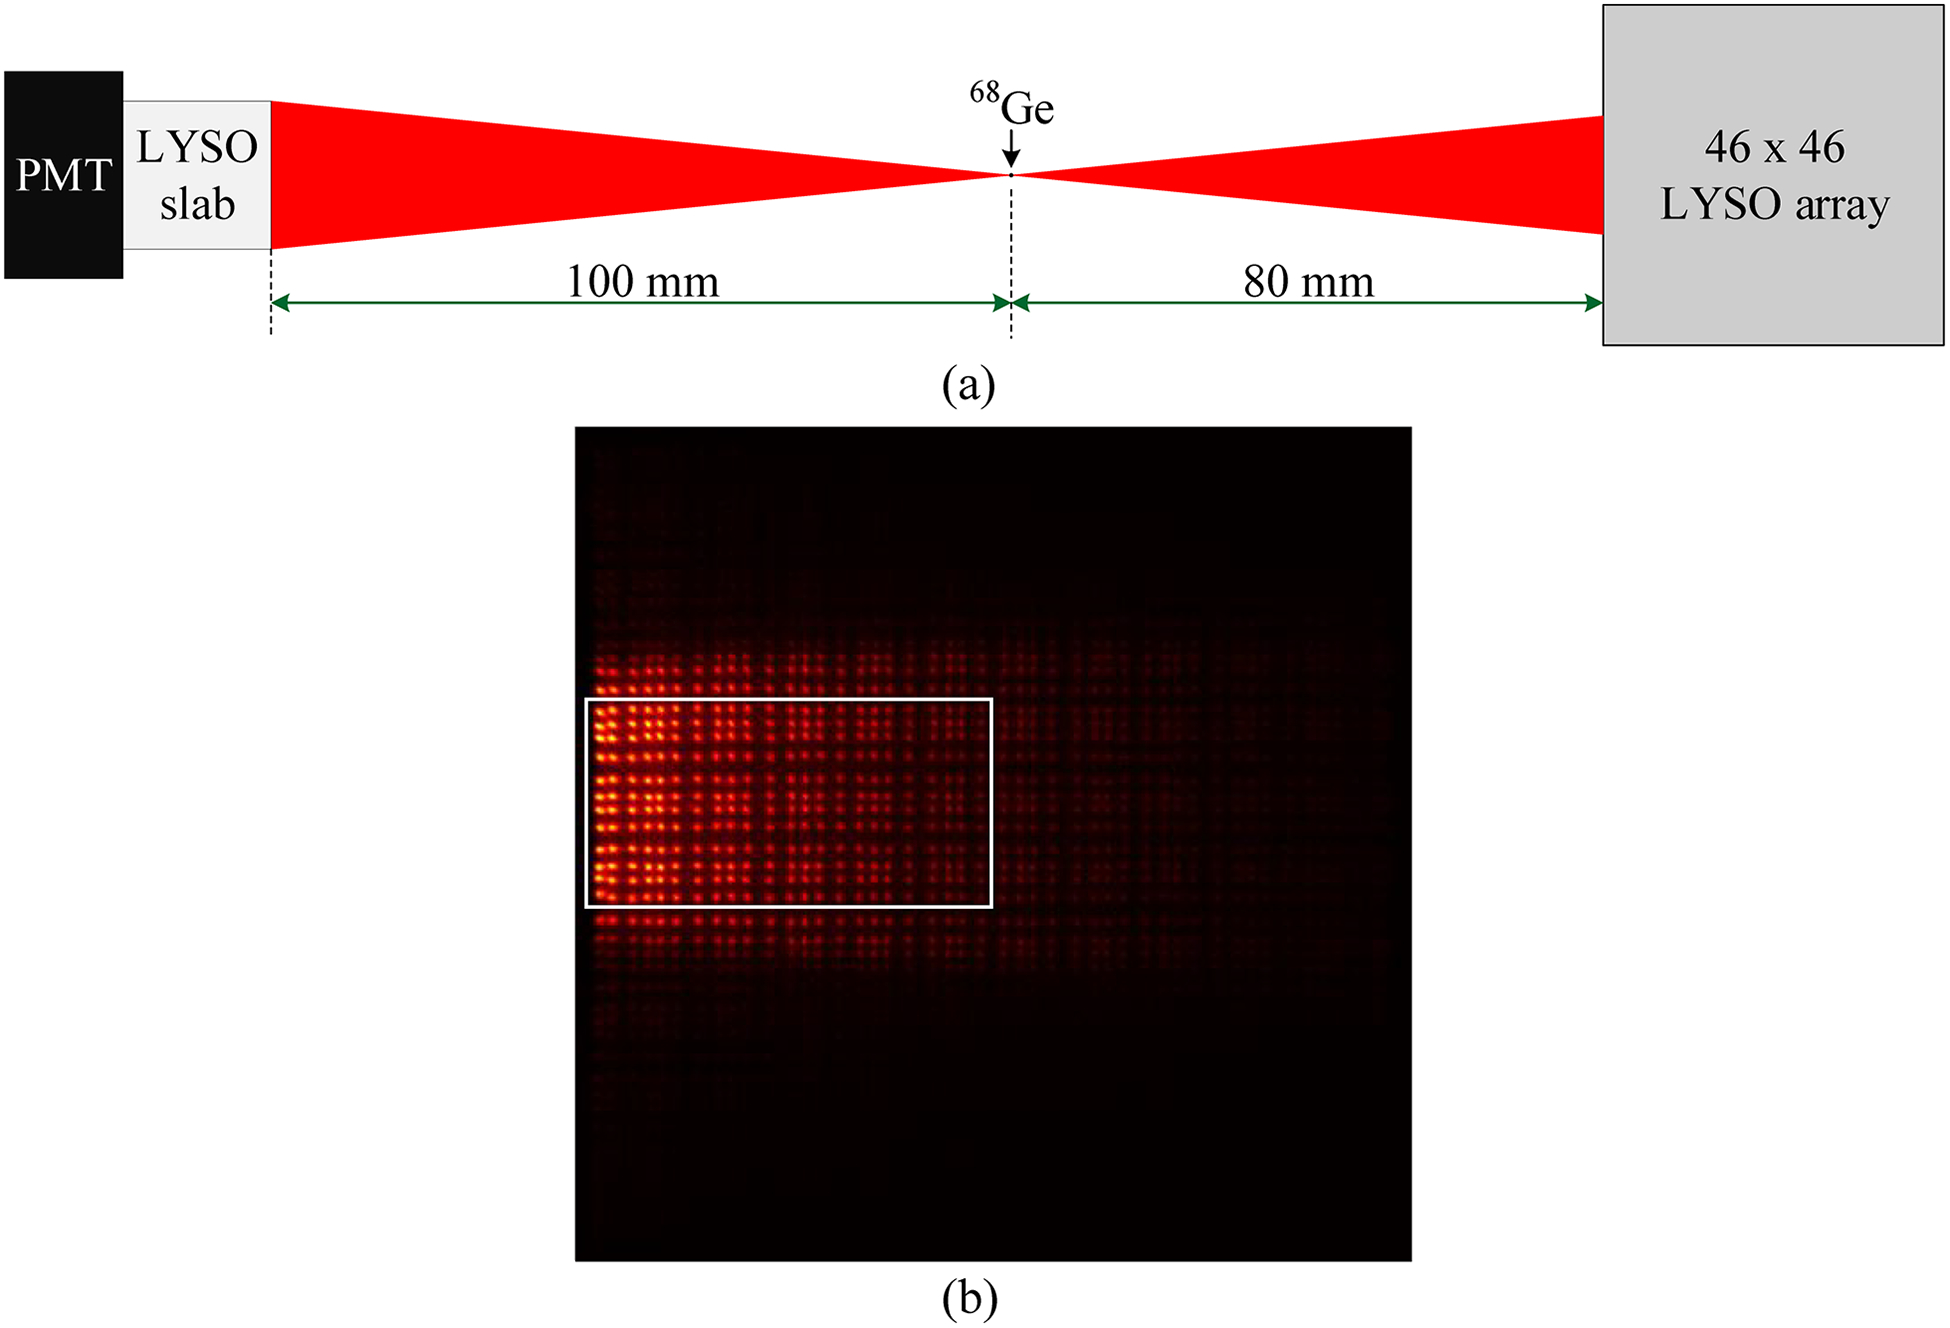
(a) schematic of the DOI setup and (b) flood histogram obtained during DOI resolution measurements. The 276 crystals in the white rectangle were used as being representative of the entire array.
2.3.4. Timing measurements
Timing resolution was also measured at a bias voltage of 30.0 V when the diode readout method was used and 28.0 V when the standard readout method was used, and at 5 °C and 20 °C. A 16 × 16 × 16 mm3 LYSO crystal (wrapped with Teflon) coupled to a Hamamatsu PMT R12844–10 was used as a reference detector. The timing signals from the reference detector and the DOI detector were send to a time-amplitude converter (TAC) and used as a start and stop signal respectively. The TAC output was digitized by the PowerDAQ board together with position signals. The timing resolution of two identical reference detectors was 480 ps ± 16 ps.
The FWHM of the timing spectrum of each crystal was used as the timing resolution and a 250–750 keV energy window was also applied to each crystal to select events. The estimated coincidence timing resolution of two DOI detector modules was calculated by subtracting in quadrature the contribution of the reference detector using the following equation (Du et al 2018):
| (5) |
2.3.5. Effect of event rate
A large-area detector with high detection efficiency and multiplexing electronics must be able to handle the relatively high single event rates that will be encounted in dynamic PET scanning, especially in the early time points immediately after injection. The performance of the proposed detector was measured using a 4 mCi 18F source with a size of 16 × 16 × 8 mm3, located 120 mm from the entry face of the LYSO array. Coincidence event data were acquired using a reference detector, consisting of a PMT R12844–10 and a 16 × 16 × 32 mm3 LYSO. Flood histograms and energy resolution were measured at different event rates and at a temperature of 5° C. The SiPM bias voltage was 30.0 V and 28.0 V for the diode readout method and standard readout method, respectively.
3. Results
3.1. Flood histograms
The flood histograms obtained using the diode readout method and standard readout method are shown in figure 6, and the position profile for the 22nd crystal row are shown in figure 7(a). The bias voltages were set to 30.0 V and 28.0 V for the diode readout method and standard readout method respectively, based on the plot of flood histogram quality versus bias voltage shown in figure 7 (b). Better flood histograms were consistently obtained using the diode readout method, especially for the edge crystals, which were more clearly separated (figure 7). The highest flood histogram quality values for each temperature and readout method are listed in Table I. The flood histograms obtained at 20 °C using the diode readout method was almost the same as that achieved at 5 °C for the standard readout method.
Figure 6.
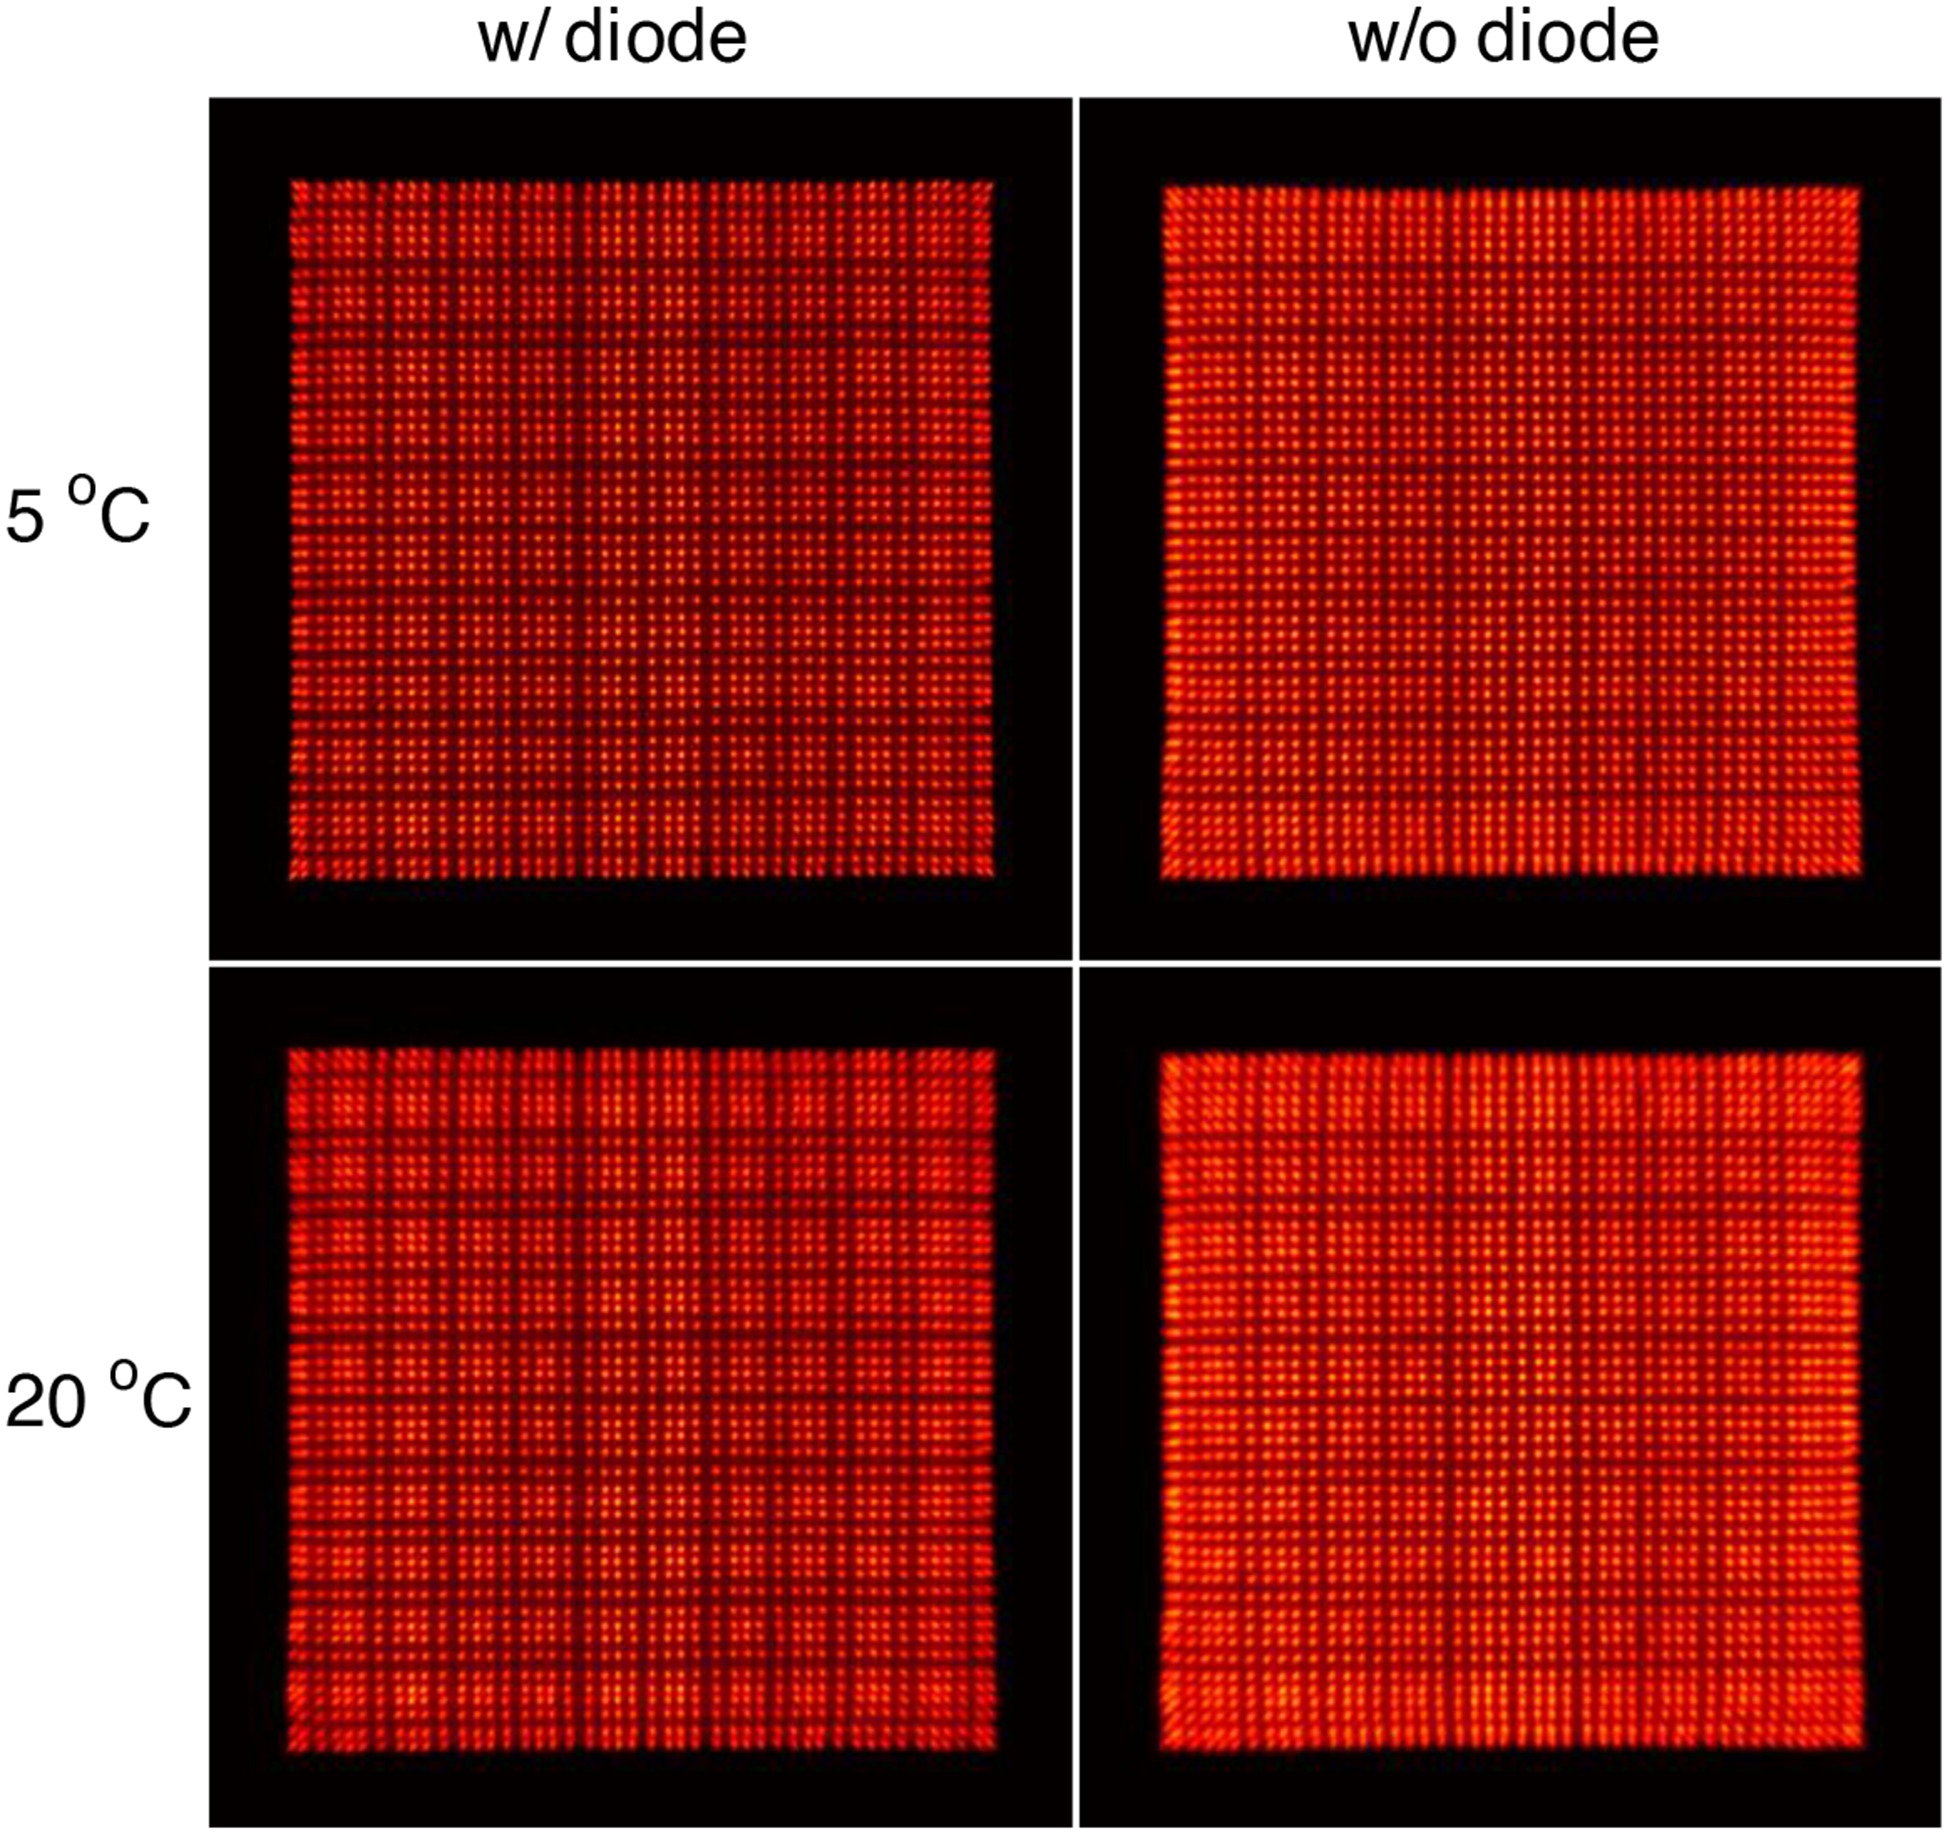
Flood histograms obtained at two different temperatures and using the two different readout methods.
Figure 7.
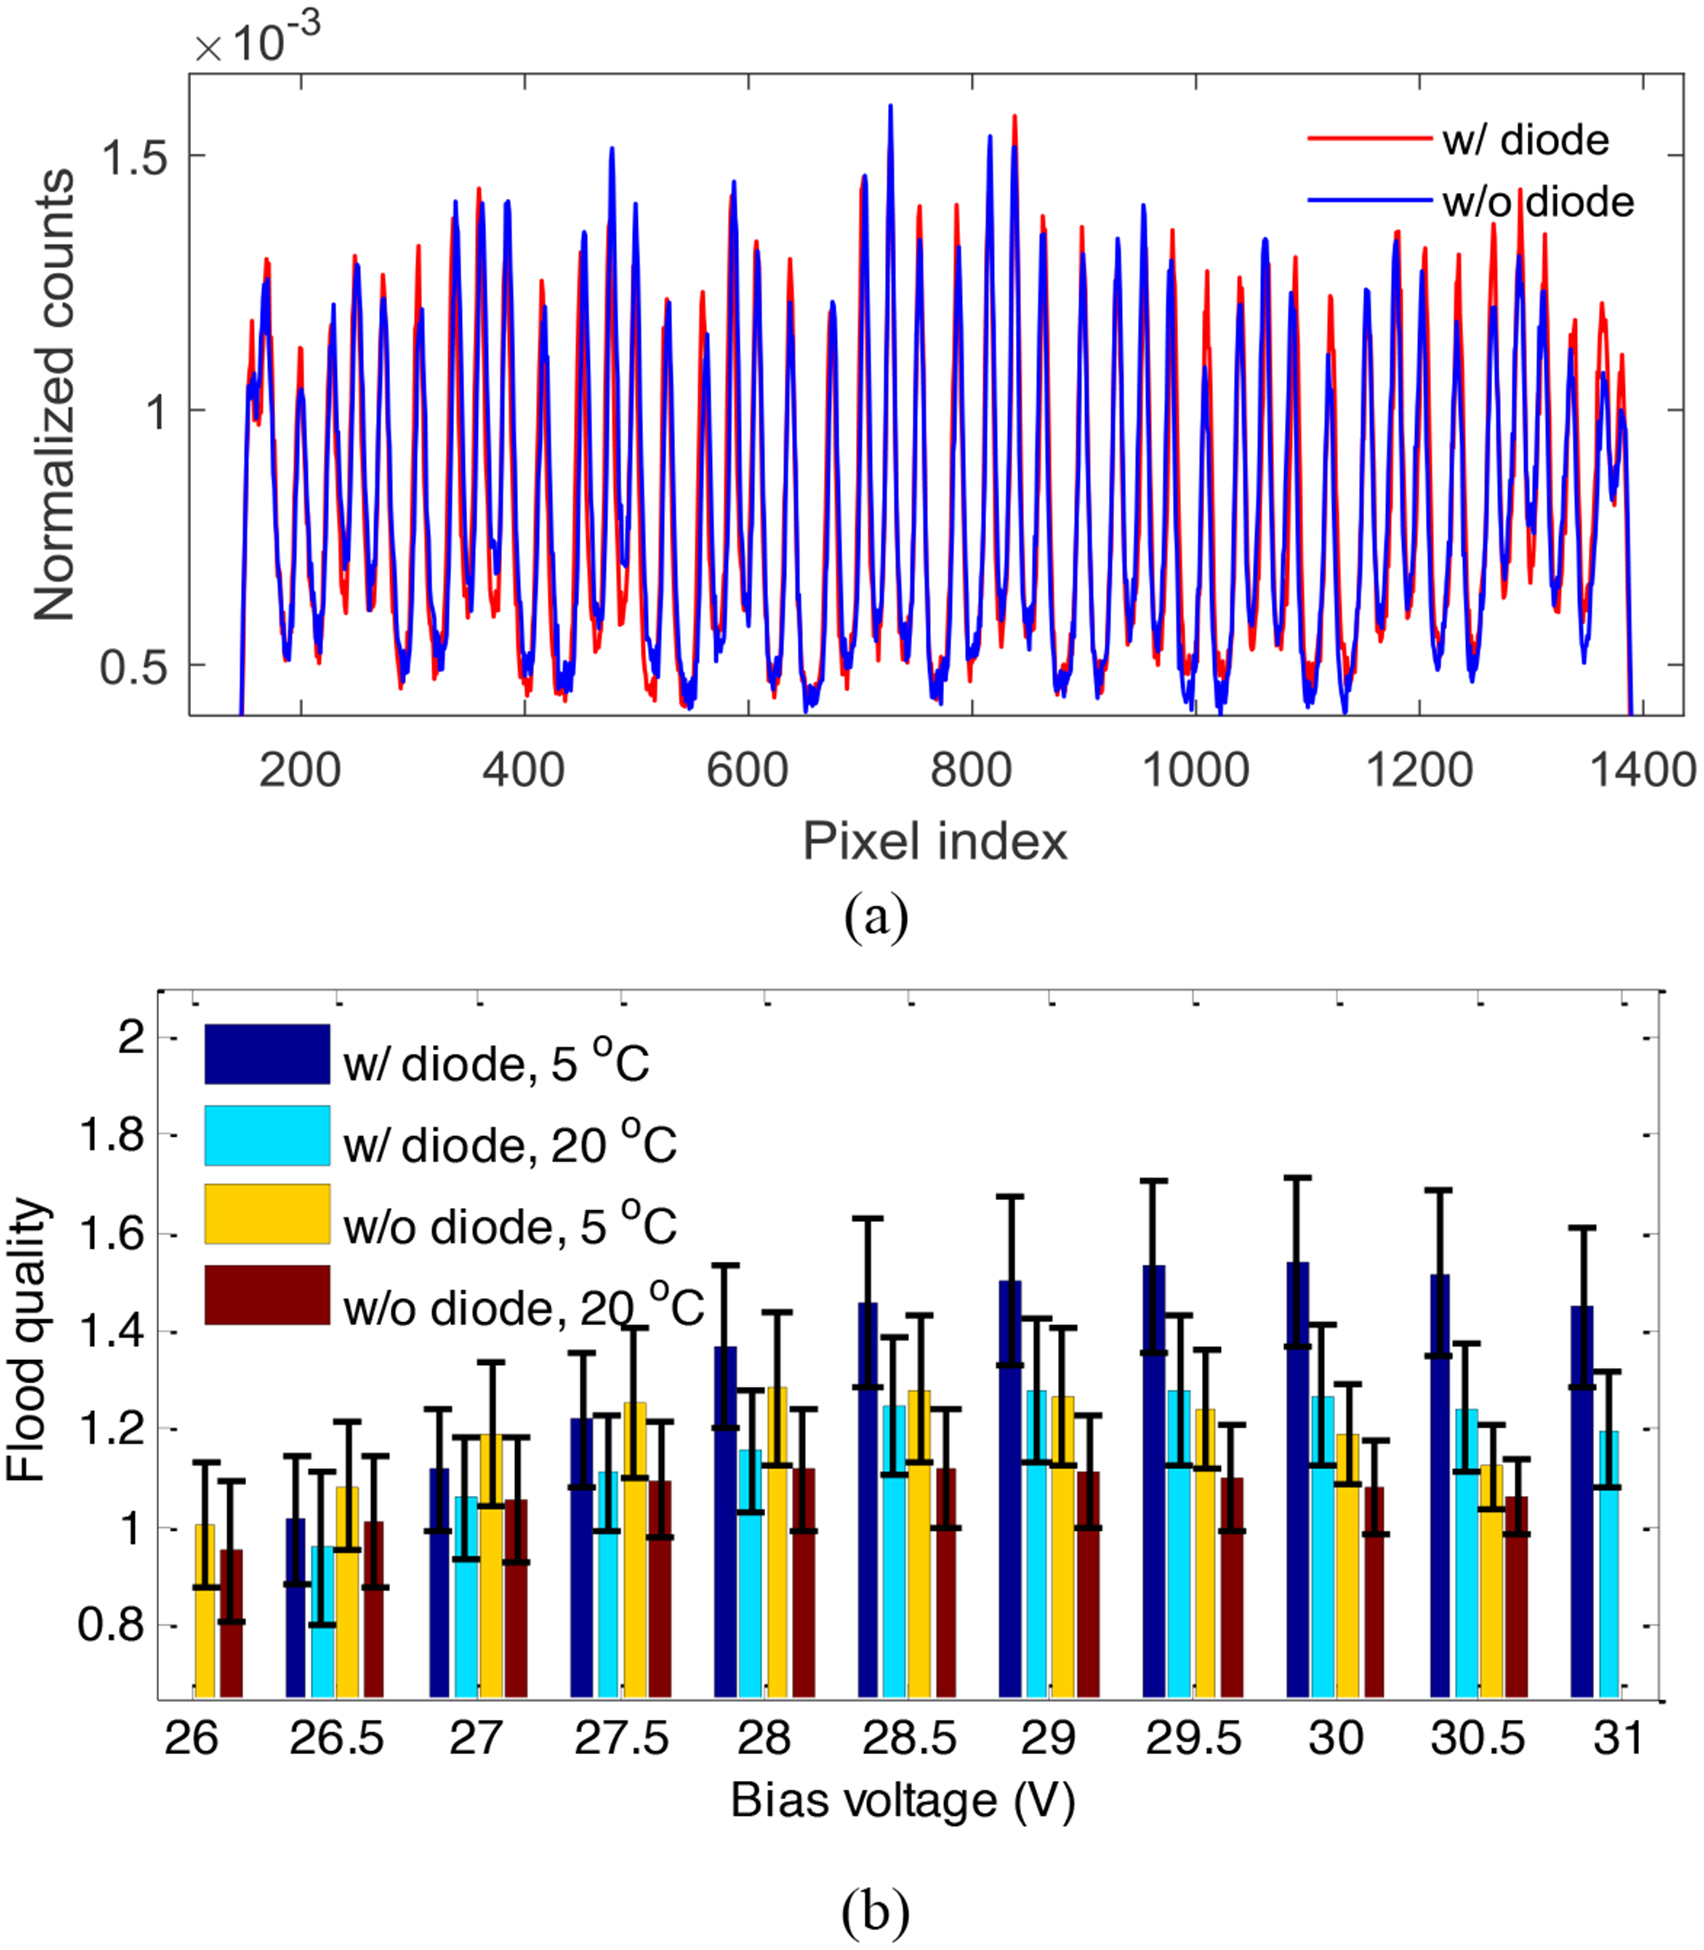
(a) position profile of the 22nd crystal row of the flood histograms at 5 °C shown in figure 6 and (b) the flood histogram quality versus bias voltage, temperature and readout method. The error bars represent the standard deviation across all the crystals.
Table I.
Flood histogram quality
| Flood histogram quality | ||
|---|---|---|
| Temperature (°C) | w/ diode | w/o diode |
| 5 | 1.54 ± 0.17 | 1.29 ± 0.16 |
| 20 | 1.28 ± 0.15 | 1.13 ± 0.12 |
3.2. Signal-to-noise ratio
The noise, average signal amplitude and average SNR of all crystals in the array are shown in figure 8. The noise and signal both increase with increasing bias voltage. The noise obtained at 20 °C was higher than that obtained at 5 °C using the same readout method. The noise (figure 8 (a)) obtained using the diode readout method was smaller than that obtained using the standard readout method, showing that the noise, as expected, was reduced by the Schottky diodes.
Figure 8.
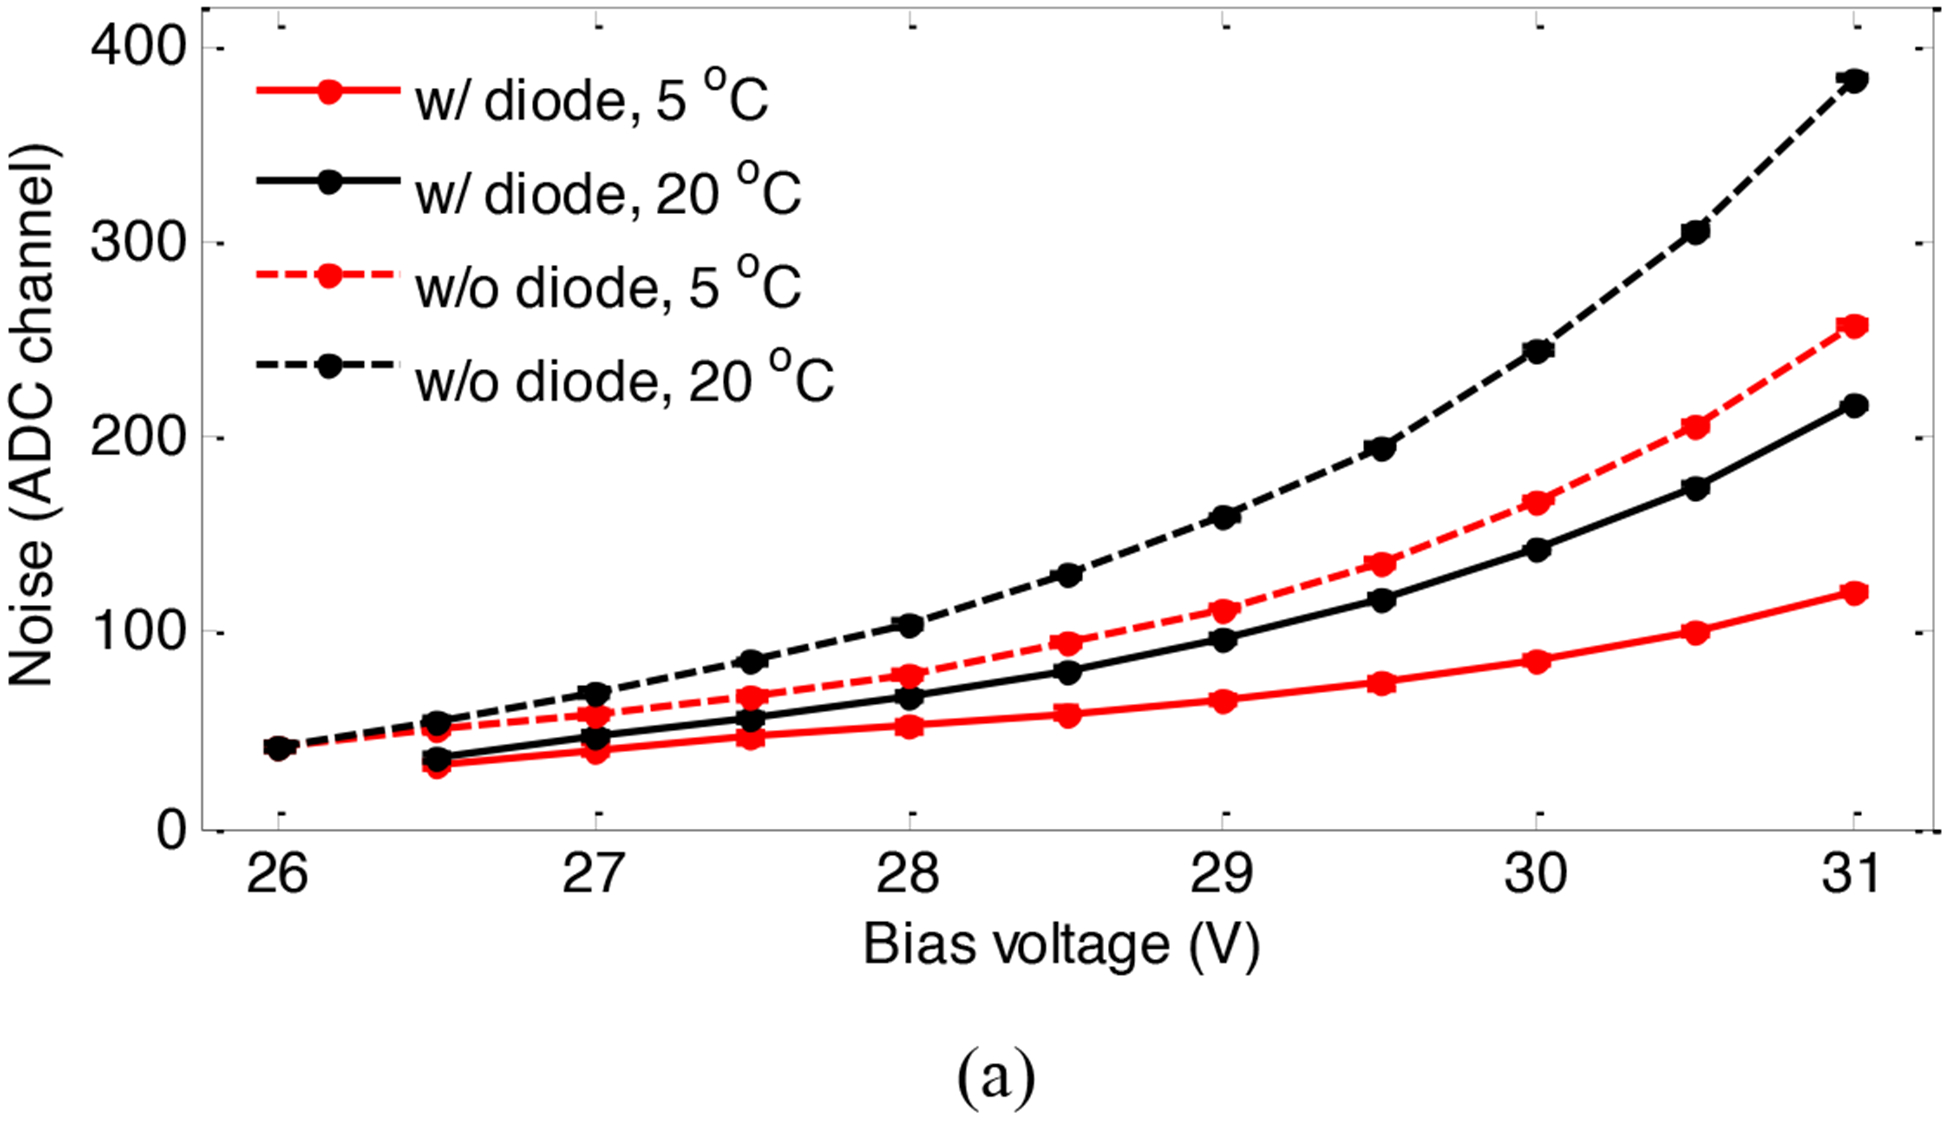
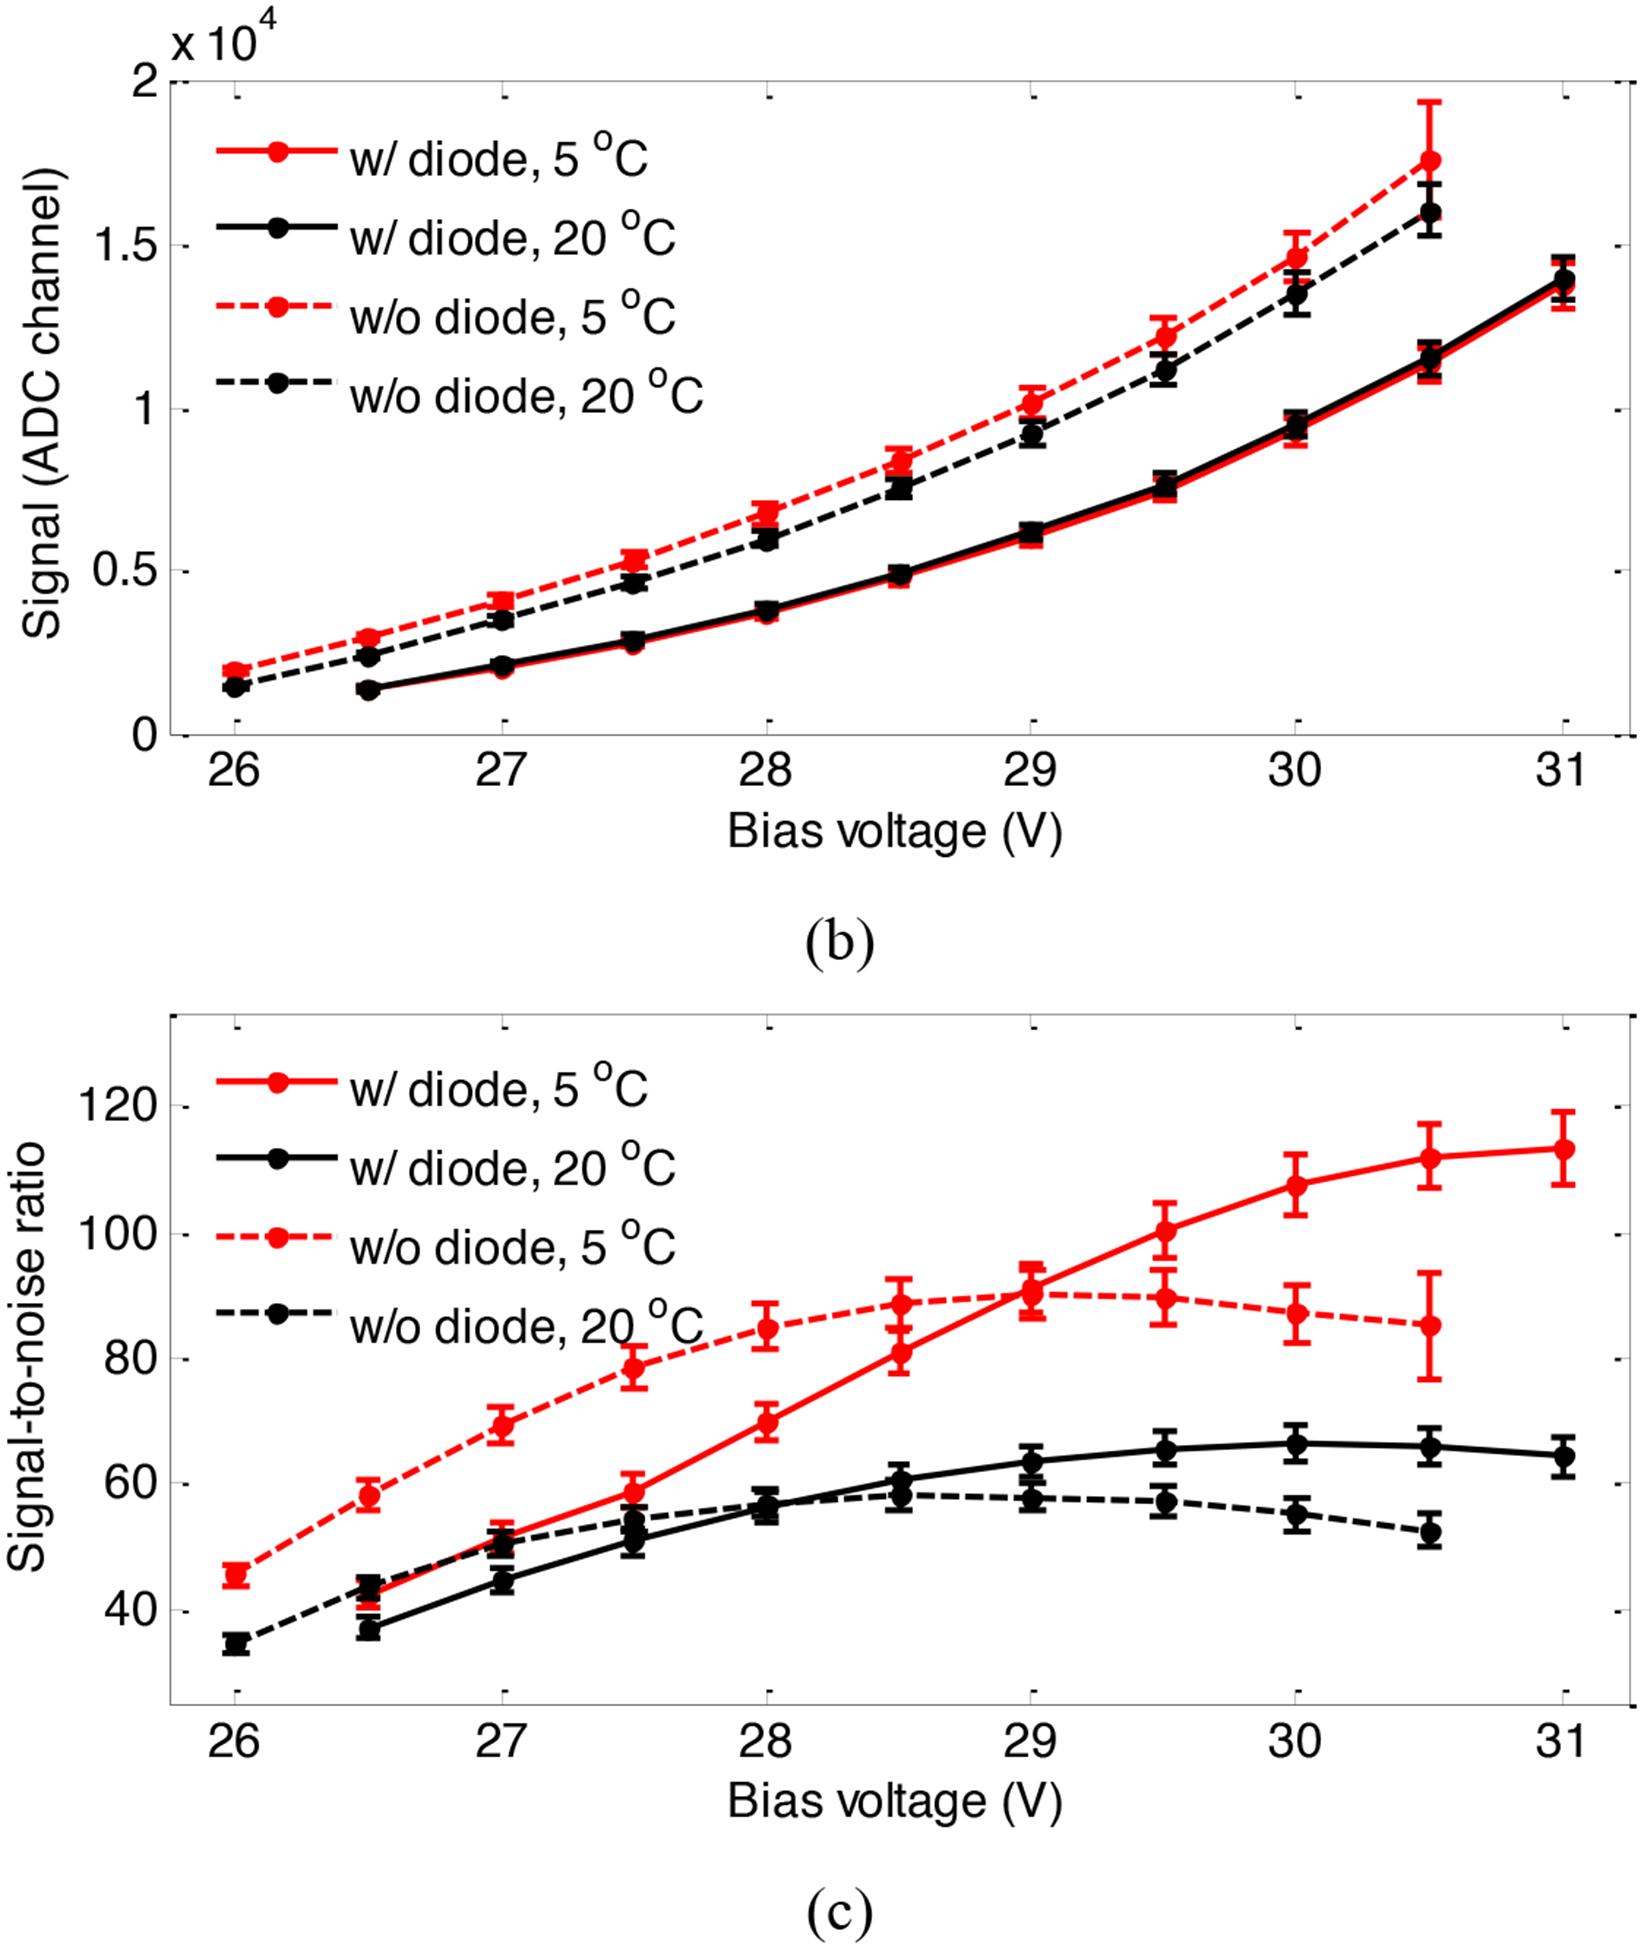
(a) noise, (b) signal and (c) SNR versus bias voltage, temperature and readout method.
The signals obtained using the diode readout method were also smaller than these obtained using standard readout method, because the signals were truncated by the forward voltage of diode (ON Semiconductor 2011). Using the standard readout method, the signals obtained at 20 °C were smaller than these obtained at 5 °C at the same bias voltage, as the breakdown voltage of SiPMs increases with increasing temperature (SensL 2014). The over-voltage (voltage over breakdown voltage) was lower at the higher temperature when the same bias voltage was applied. However, using the diode readout method, the signal obtained at the two temperatures was almost the same, because the forward voltage of the diode was also lower at the higher temperature and for the lower signals (ON Semiconductor 2011).
The SNR increases and then decreases with increasing bias voltage except the one obtained at 5 °C using the diode readout method, which is just reaching its maximum at the high end of the tested bias voltage range. The diode method, as well as lower temperatures, reduce noise, allowing operation at higher bias voltages before the noise dominates the SNR. The SNR obtained using the diode readout was higher than that obtained using standard readout method. The best SNR was obtained at 31.0 V using the diode readout method at 5 °C.
3.3. Energy resolution
The average energy resolutions versus bias voltage are shown in figure 9 (a). In addition, the average energy resolution obtained at the optimal bias voltage for the flood histogram (30.0 V and 28.0 V for the diode readout method and standard readout method respectively) are listed in Table II. The energy resolution decreases with increasing bias voltage since the photon detection efficiency increases as bias voltage increases (SensL 2014). The energy resolution obtained using the standard readout method was better than that obtained using the diode readout method. Energy resolution obtained at 5 °C was better than that obtained at 20 °C, but the temperature effect was very small.
Figure 9.
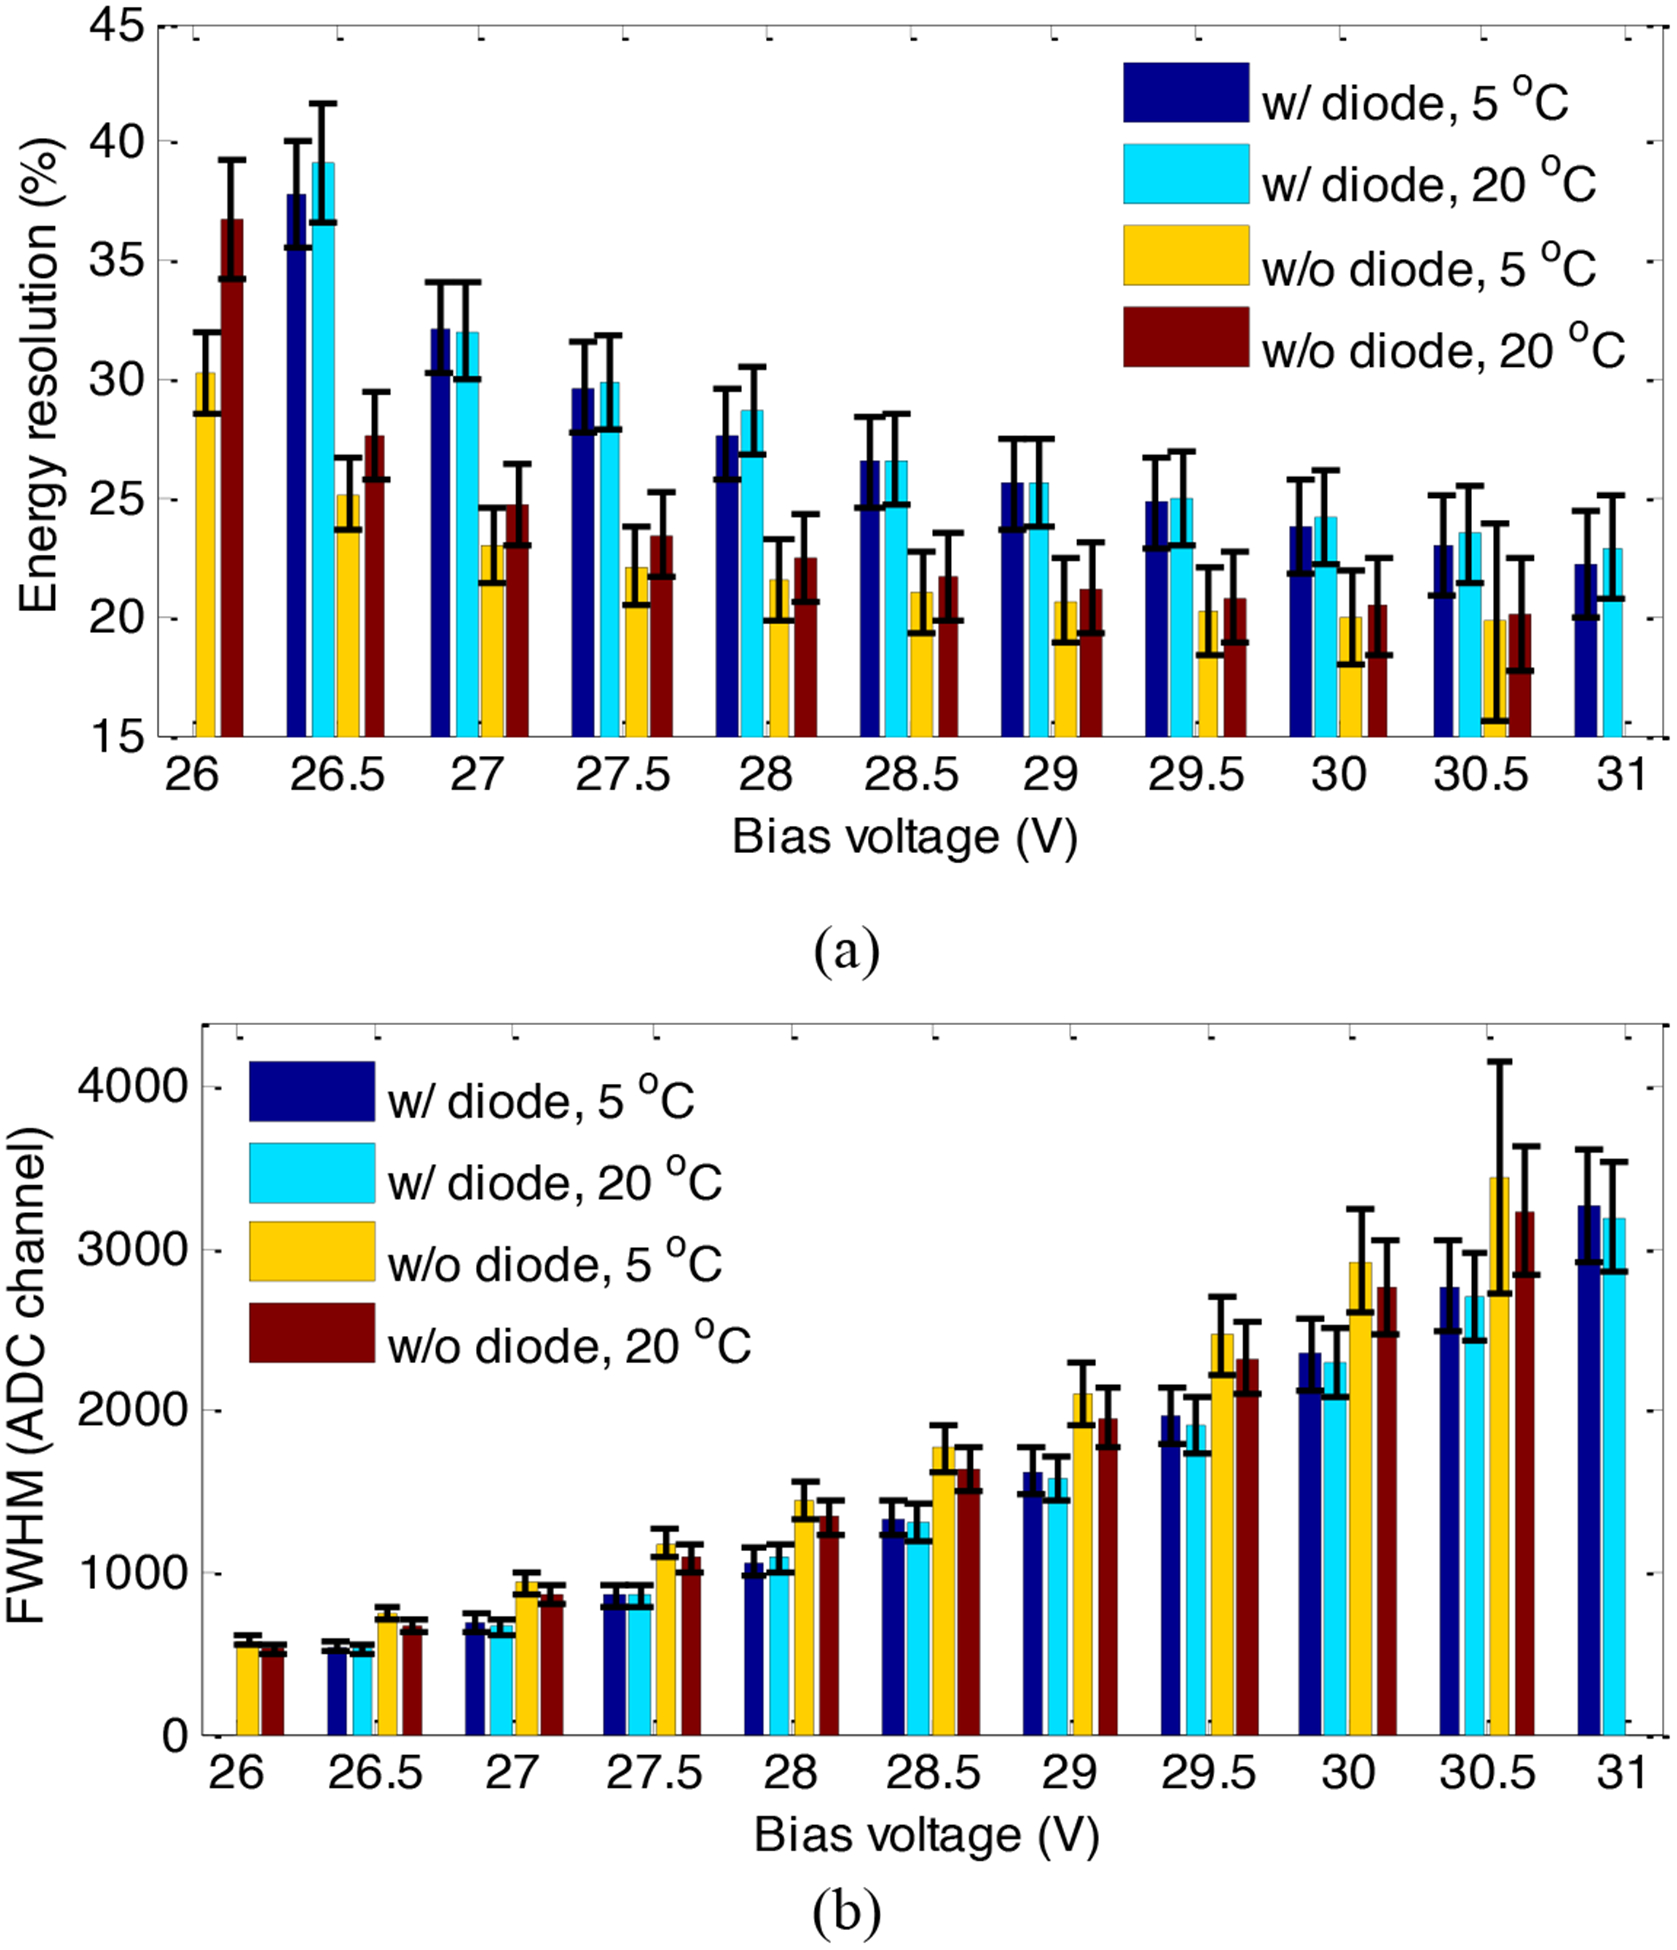
(a) energy resolution and (b) average FWHM versus bias voltage, temperature and readout method.
Table II.
Average energy resolution obtained at the optimal bias voltage for the flood histogram.
| Average energy resolution (%) | ||
|---|---|---|
| Temperature (°C) | w/ diode | w/o diode |
| 5 | 23.82 ± 2.0 | 21.52 ± 1.74 |
| 20 | 24.21 ± 2.0 | 22.44 ± 1.82 |
The average FWHM of the 511 keV photopeak of all crystals are shown in figure 9 (b). The FWHM obtained using the diode readout method was smaller than that obtained using the standard readout method, which means the apparent degradation in energy resolution obtained using the diode readout method is mainly due to the truncation of the signal caused by the forward voltage of the diode, which reduces the denominator in the energy resolution calculation.
3.4. DOI resolution
The DOI response for an edge crystal, calculated using equation 3, is shown in figure 10 (a). The average DOI resolution across the five depths for each crystal measured (see white rectangle in figure 5) is shown in figure 10 (b). These results were obtained using a bias voltage of 28.0 V, temperature of 5 °C and the standard readout method. Figure 11 shows the average DOI resolution across all five depths and all crystals in the same column versus the crystal column order. The DOI resolution degrades as the crystal column order increases, due to the increased detection of scattered photons and divergence of the collimating beam with increasing penetration into the crystal array. The DOI resolution obtained using the diode readout method was worse than that obtained using the standard readout method, due to the effect of the forward bias voltage of the diodes on the SiPM signals (figure 11). The average DOI resolution of all crystals in the first column obtained under different conditions are reported in Table II. The average DOI resolution was < 3 mm.
Figure 10.
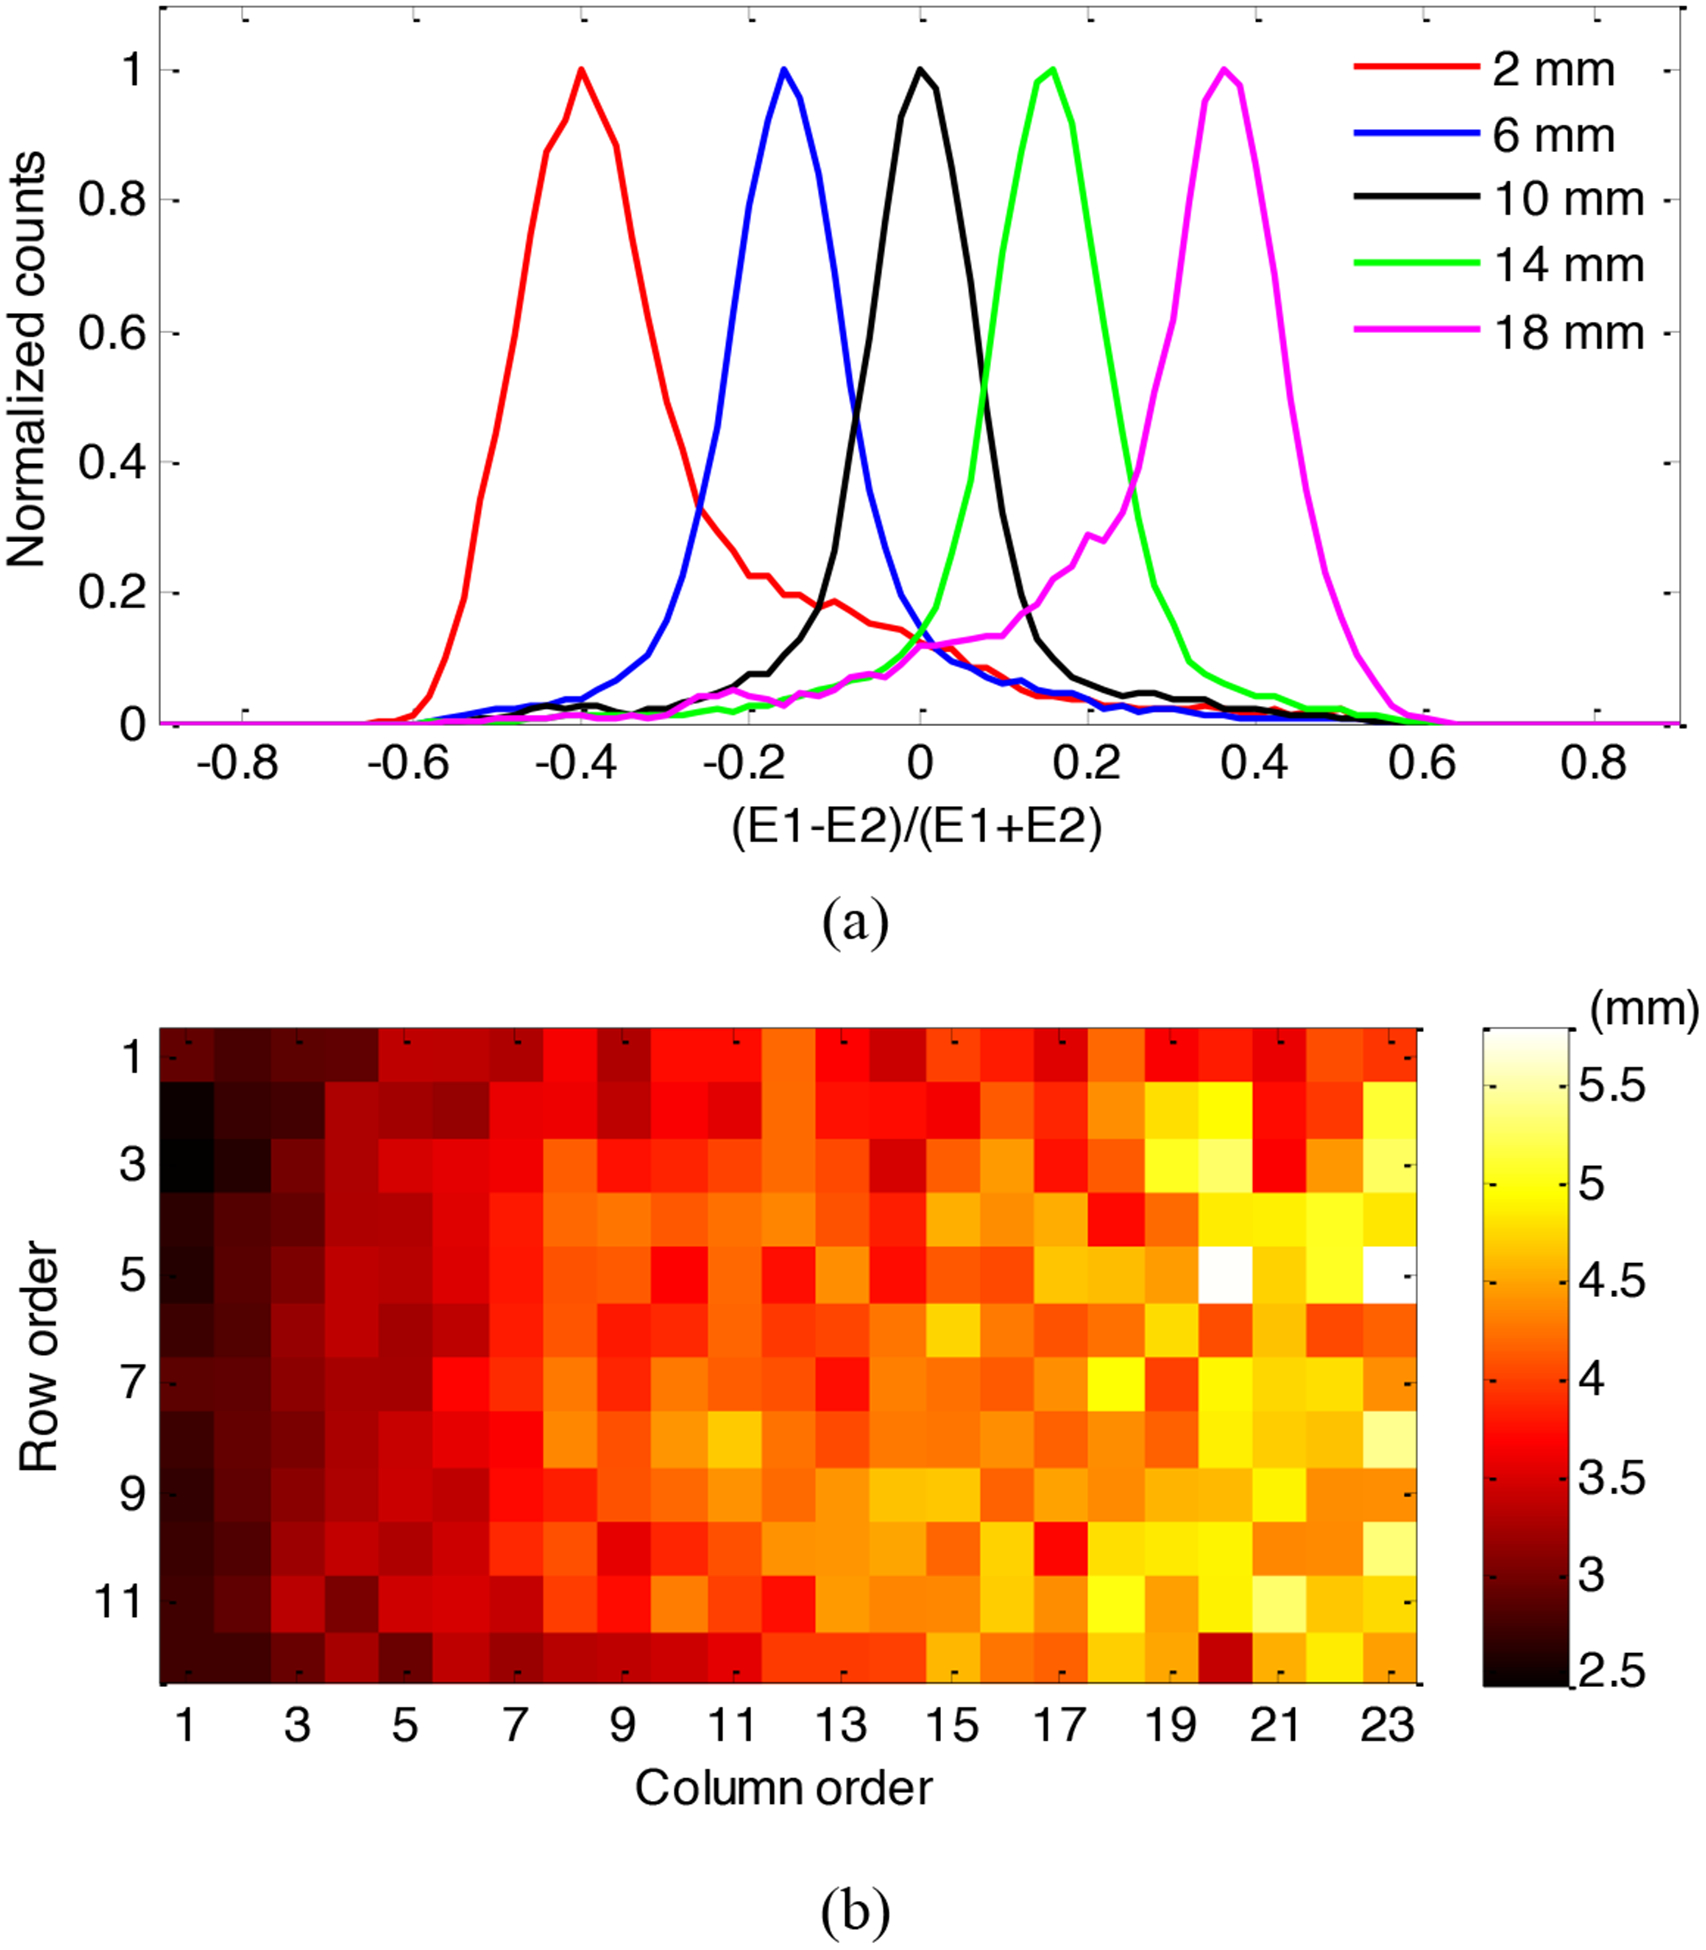
(a) Histogram of DOI ratio of an edge crystal for different depths, and (b) DOI resolution measured for each crystal.
Figure 11.
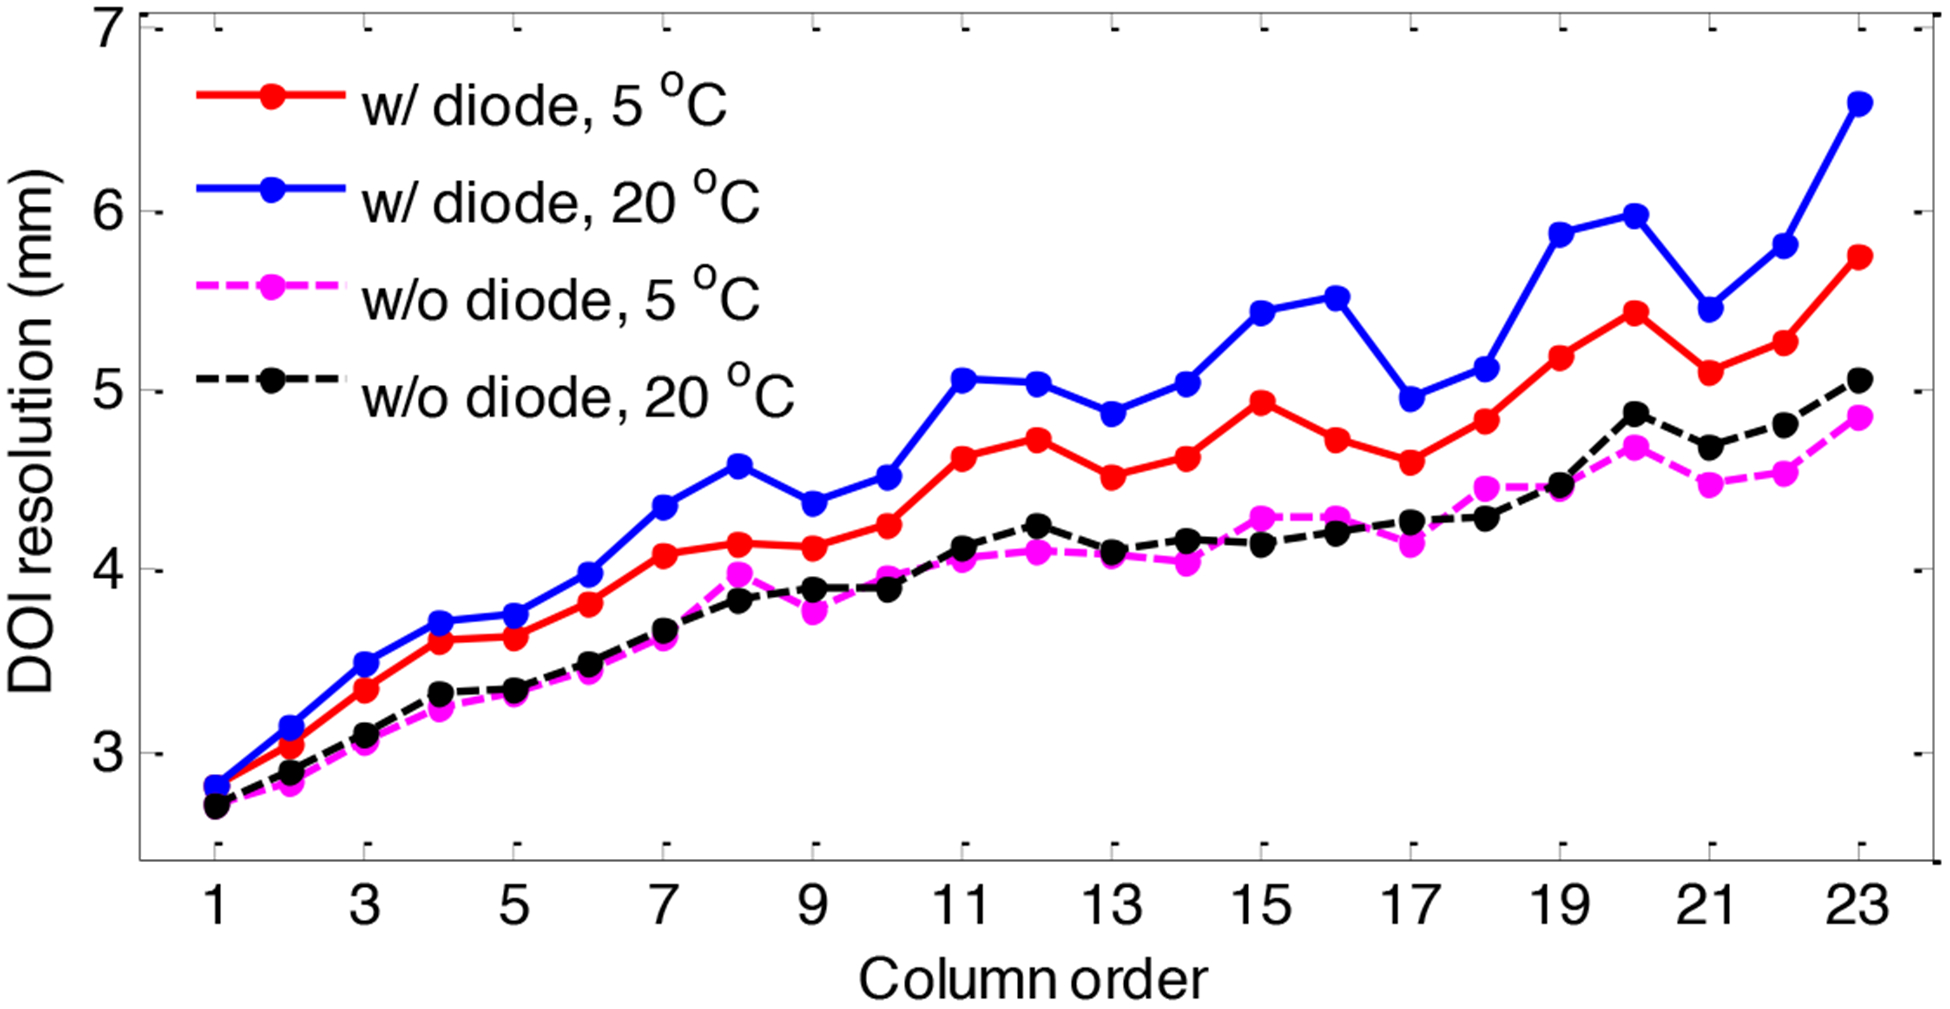
Average DOI resolution for all 23 crystal columns measured.
3.5. Timing resolution
The timing spectra for a corner, edge and center crystal are shown in figure 12. These measurements were obtained at a bias voltage of 30.0 V and a temperature of 5 °C using the diode readout method. The peak positions of the timing spectra were crystal dependent due to the location of the crystals and the different trace length of the signal lines.
Figure 12.
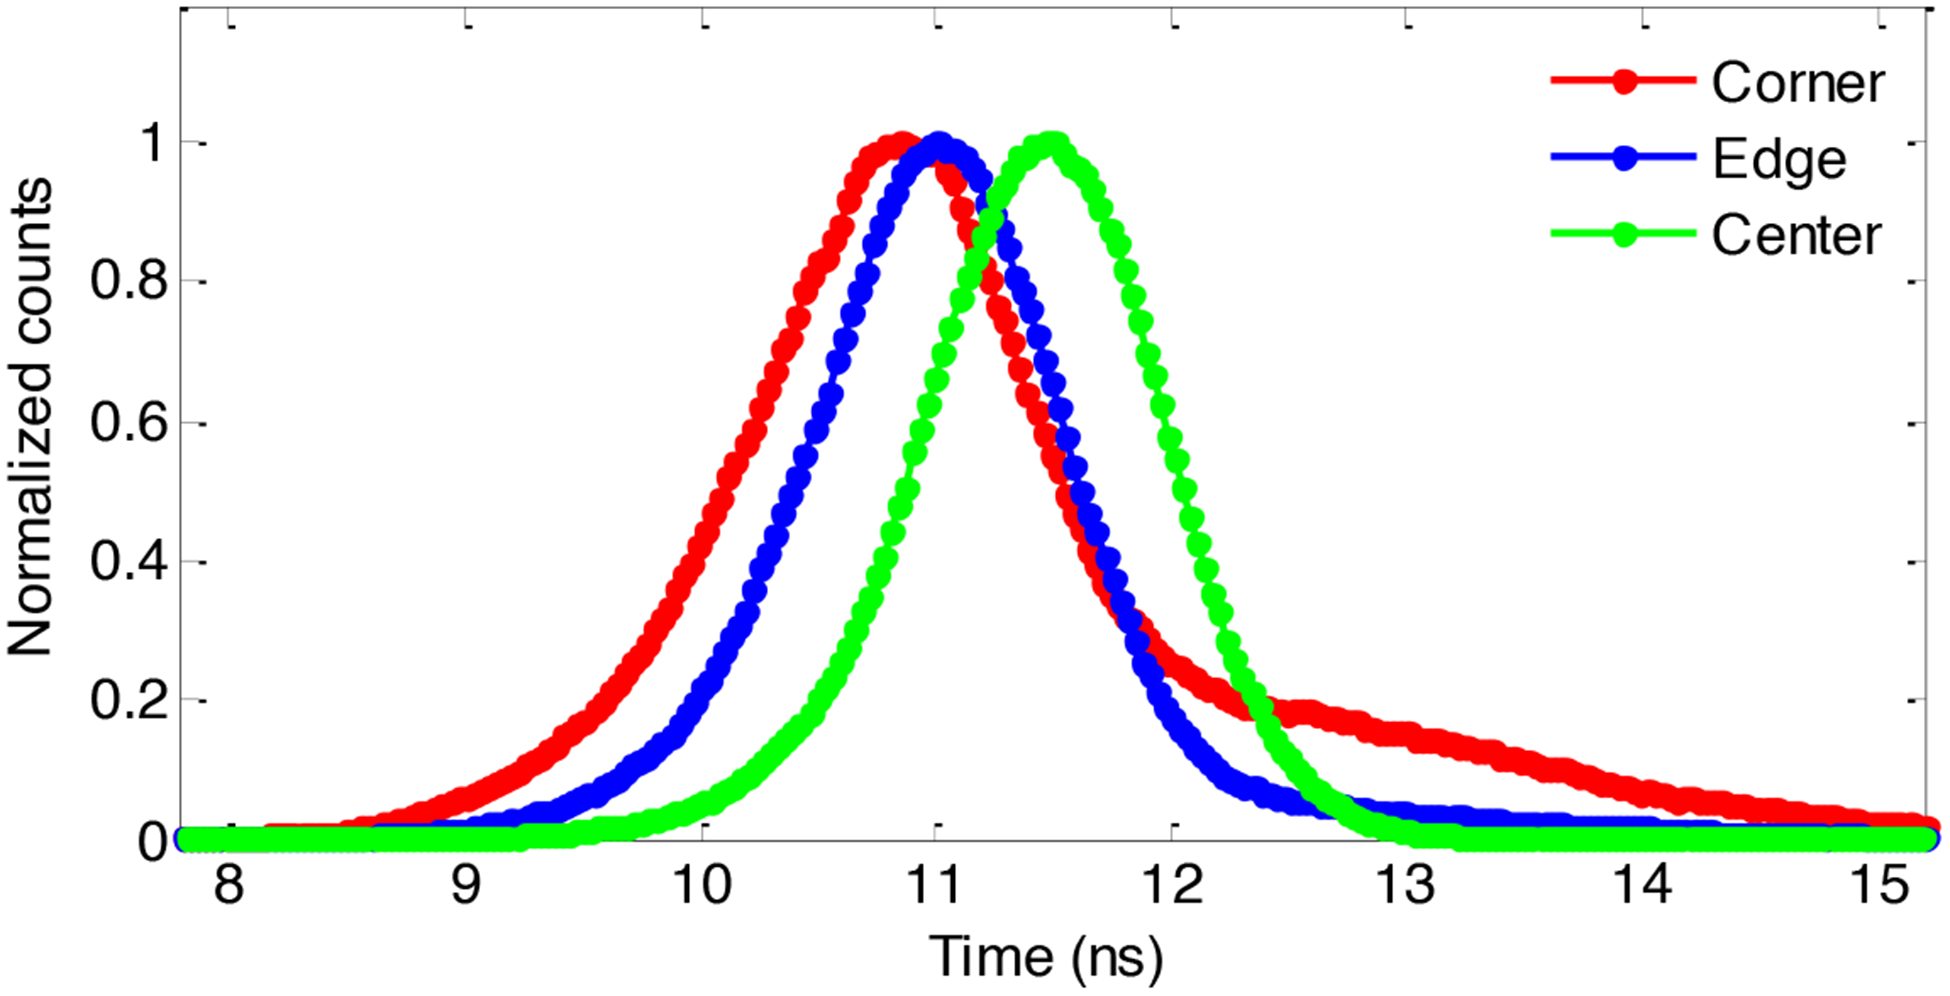
Timing spectra of three crystals, obtained at a bias voltage of 30.0 V and a temperature of 5 °C using the diode readout method.
The average timing resolution across all crystals in the LYSO array are listed in Table III. The timing resolution was improved at the lower temperature and using diode readout method, as noise was reduced (figure 8 (a)).
Table III.
Average DOI resolution of crystals in the first column
| Average DOI resolution (mm) | ||
|---|---|---|
| Temperature (°C) | w/ diode | w/o diode |
| 5 | 2.81 ± 0.13 | 2.69 ± 0.14 |
| 20 | 2.82 ± 0.13 | 2.71 ± 0.09 |
3.6. Event rate effects
The flood histograms obtained at different event rates are shown in figure 13, and the flood histogram quality metric and energy resolution versus event rate are plotted in figure 14 and figure 15 respectively. As expected, pile up causes the flood histograms and energy resolution to deteriorate at higher event rates, however all crystals can be identified (flood histogram quality > 1) up to an event rate of approximately 150,000 counts per second. The diode readout method provides better flood histograms than the standard readout method except at the very highest event rates studied where pileup effects dominate both methods.
Figure 13.
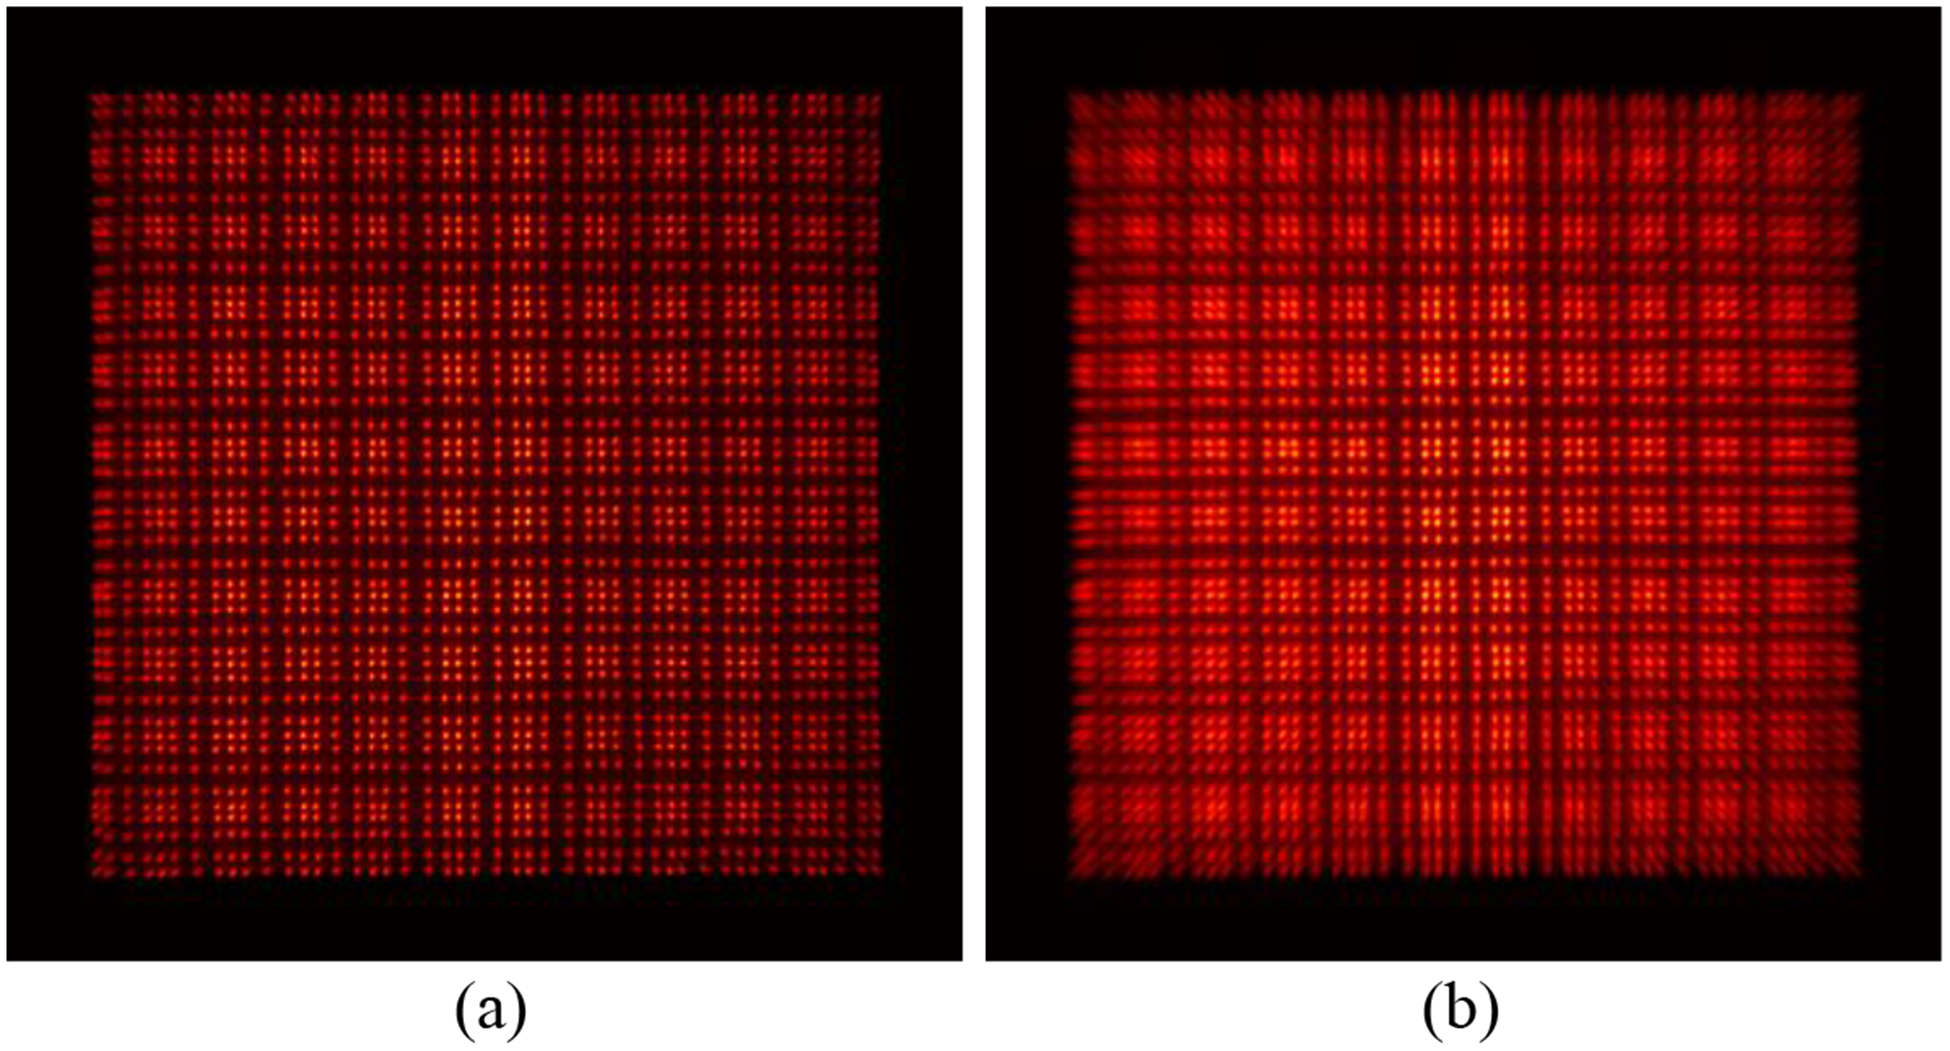
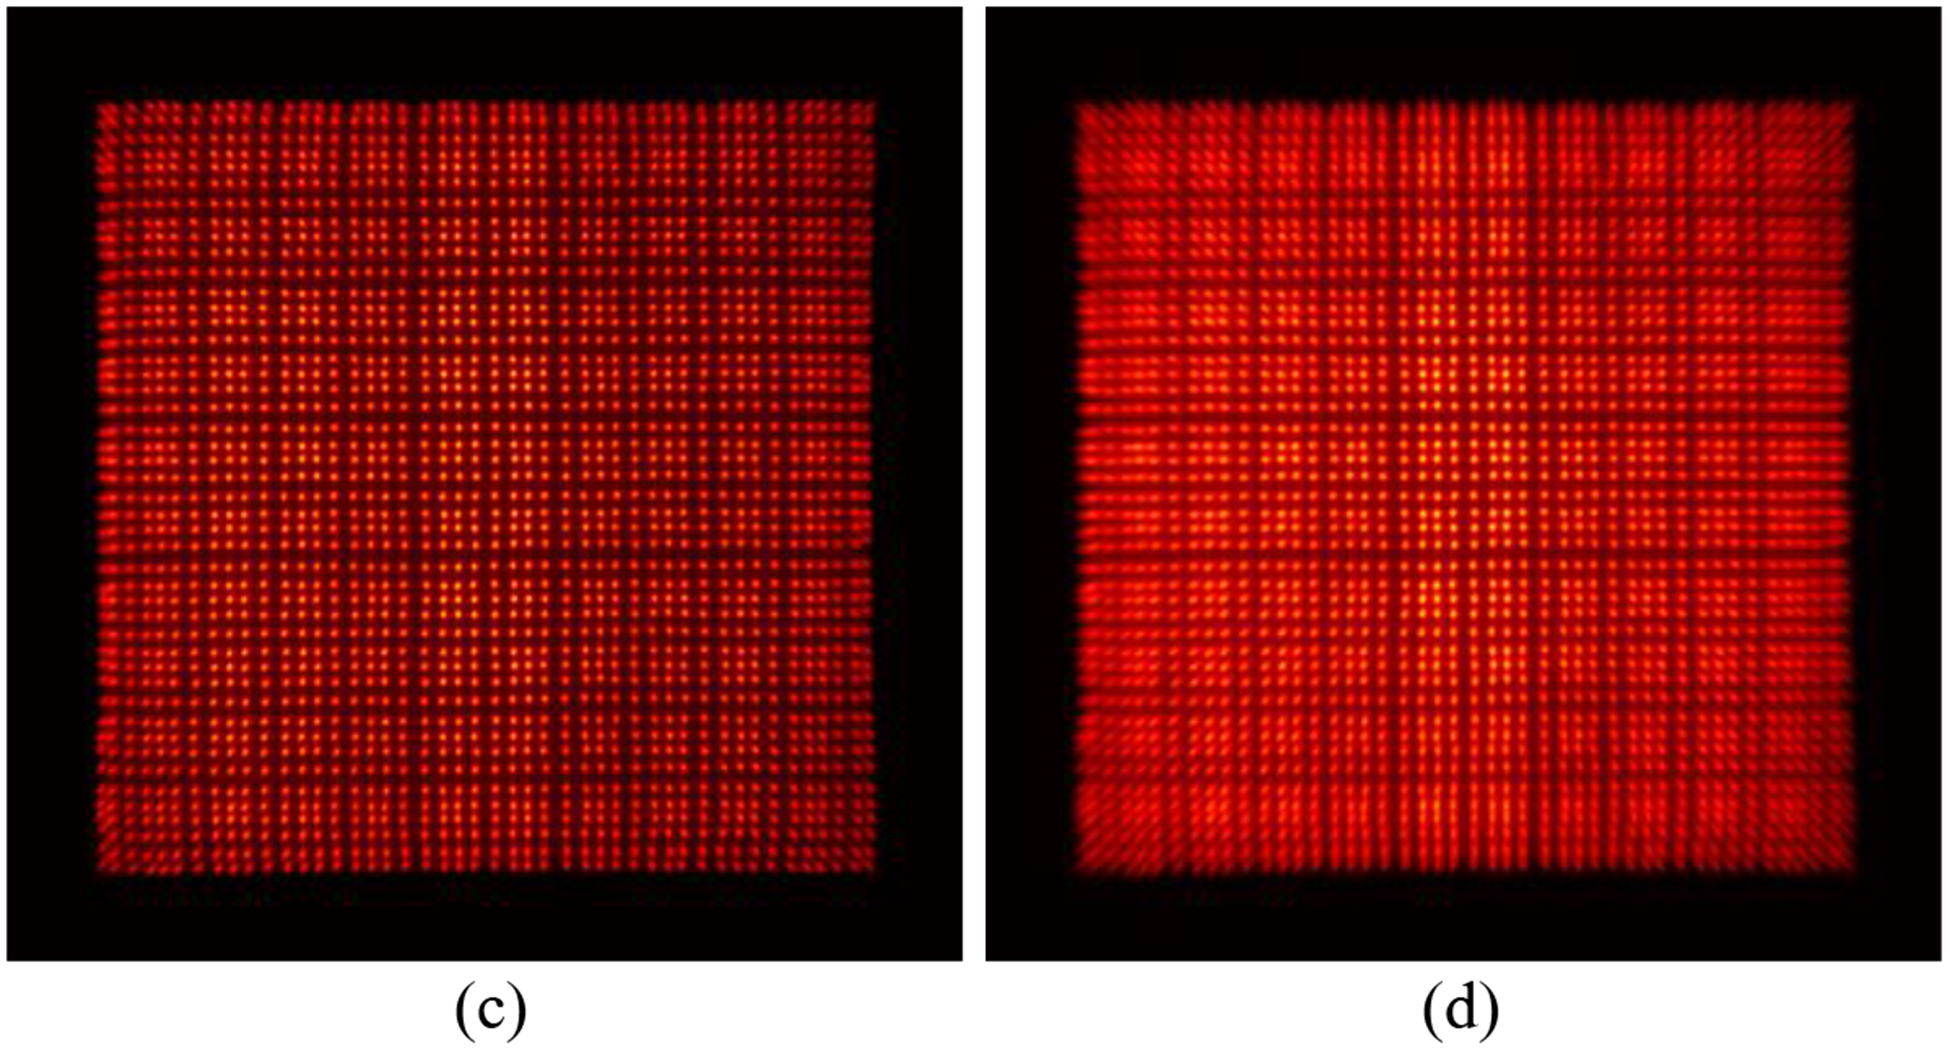
Flood histograms obtained at event rates of (a) 39.8 k/s and (b) 142.0 k/s using diode readout method. Flood histograms obtained at event rates of (c) 29.6 k/s and (d) 131.8 k/s using standard readout method.
Figure 14.
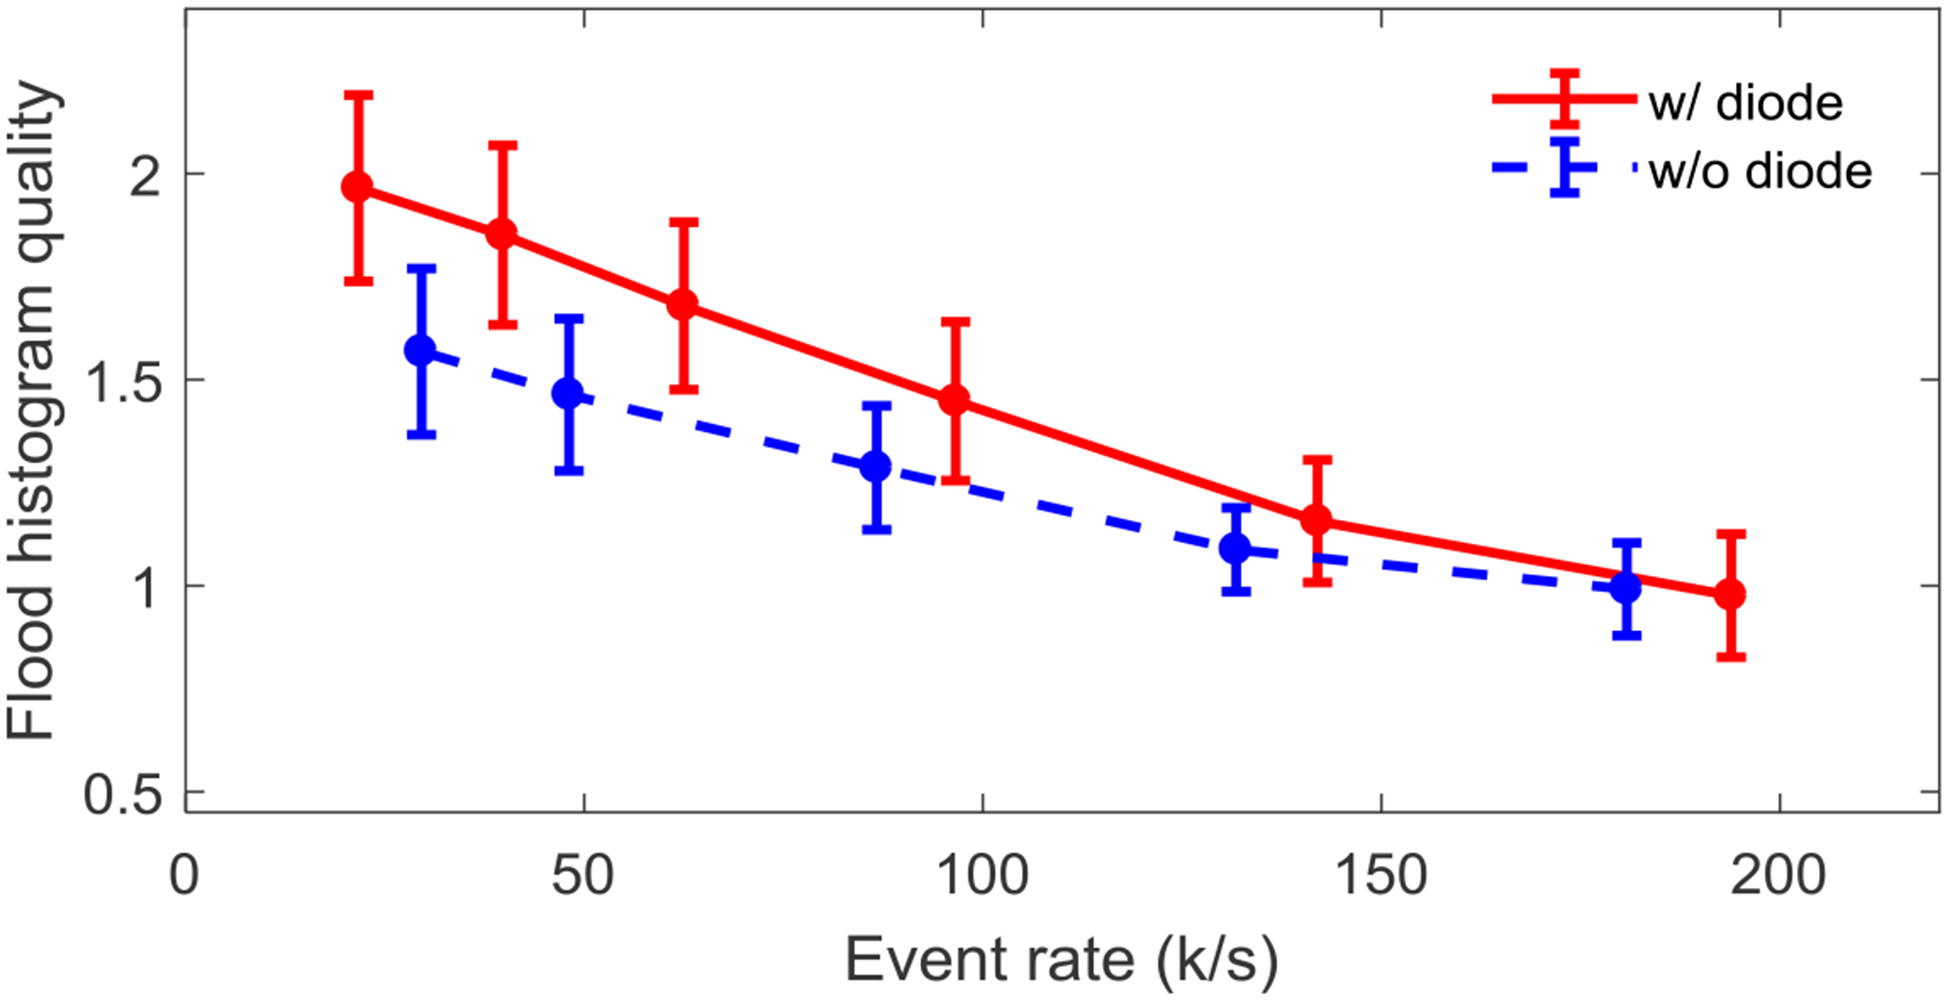
Flood histogram quality versus event rate.
Figure 15.
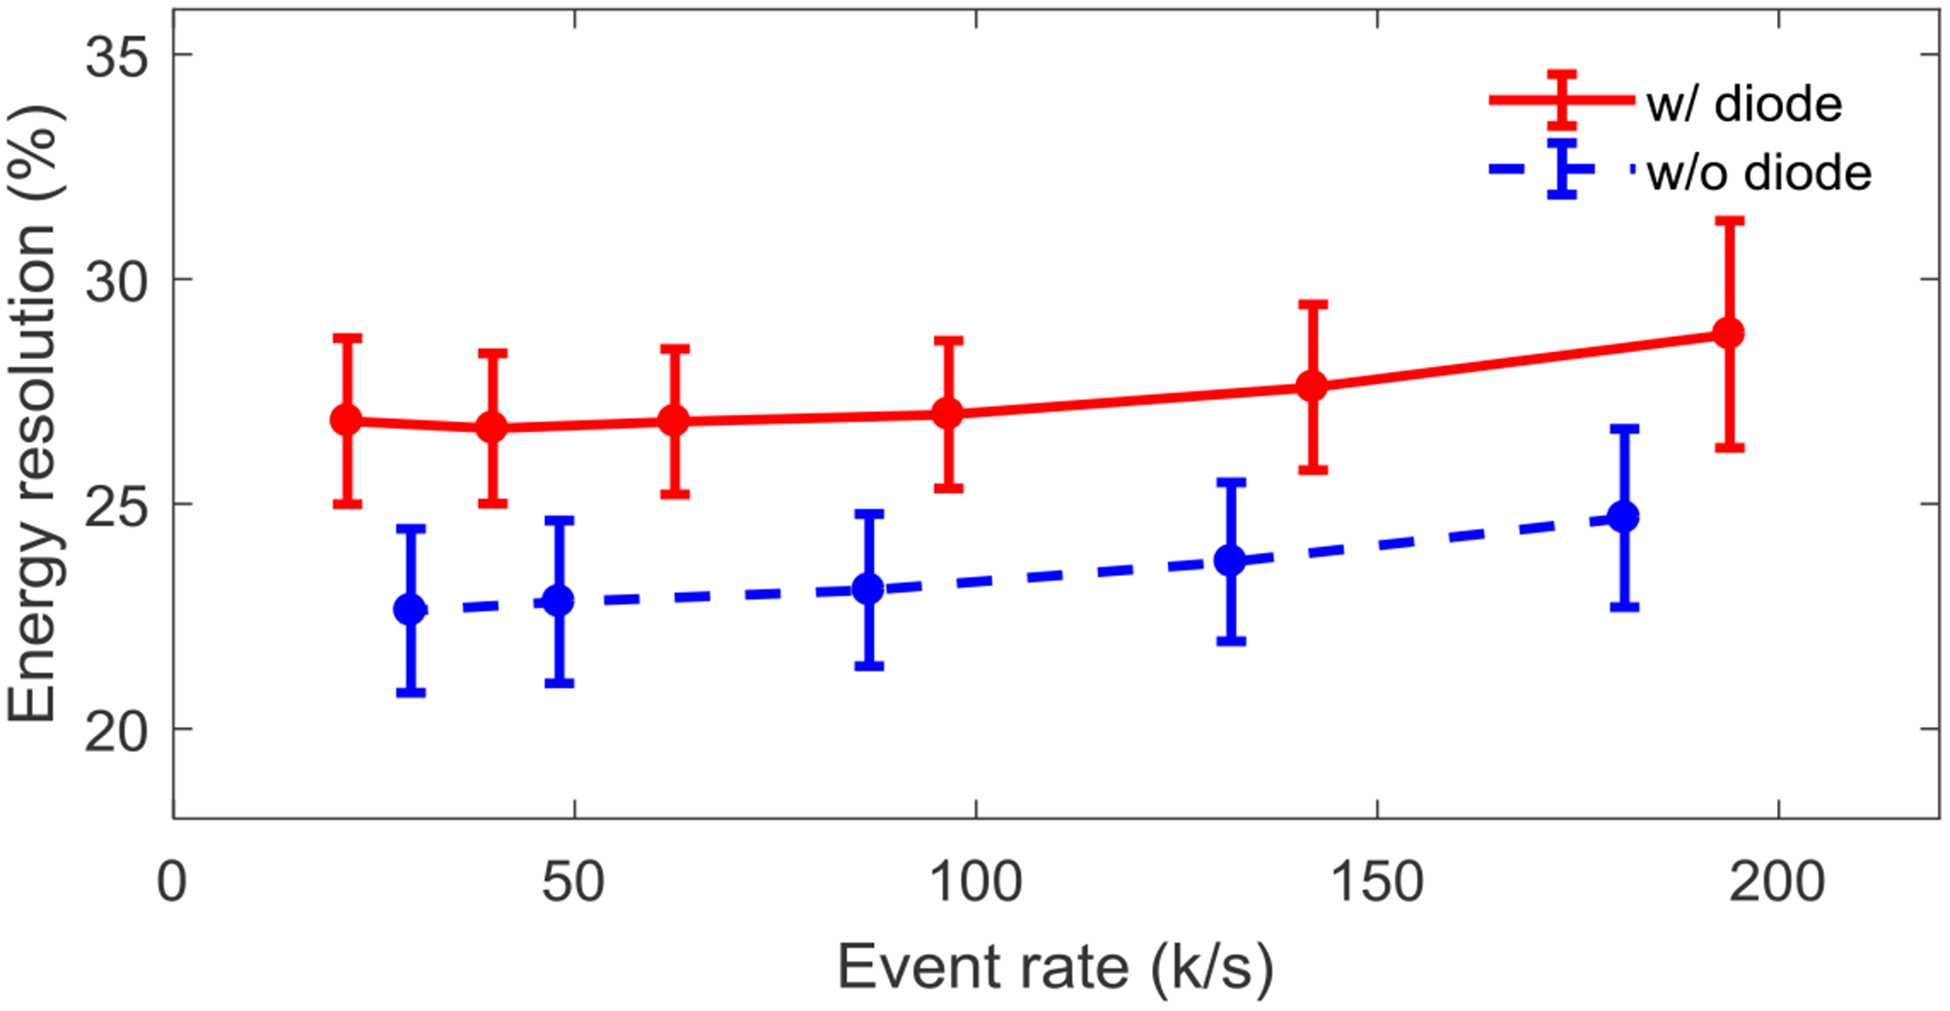
Energy resolution versus event rate.
4. Discussion
The results showed that better performance was obtained at lower temperatures and selection of bias voltage was important to optimize detector performance. Better flood histograms and timing resolution were obtained using the diode readout method, which removed the influence of SiPMs measuring negligible signals. However, better energy resolution and DOI resolution was obtained using the standard readout method.
The flood histogram showed that all the crystals in the LYSO array could be clearly identified (figure 6). The average energy resolution obtained at the optimal bias voltage was less than 25 %, and the DOI resolution was less than 3 mm. The DOI resolution was not as good as that previously obtained using position-sensitive avalanche photodiodes (PS-APDs) (Yang et al 2006 and Ren et al 2014), however, it was not worse than that obtained using other PS-SiPMs or SiPM arrays (Du et al 2018). Further studies are ongoing to investigate why the DOI resolution was not as good as these obtained using PS-APDs.
A coincidence timing resolution of ~1.6 to 1.8 ns was obtained using a constant fraction discriminator and without any dark count suppression technique. This timing resolution is similar or better compared with other recent work using large-area SiPM array and comparable readout methods (Shao et al 2015 and Stolin et al 2014). Better timing resolution could be obtained by optimizing the setup and bias voltage according to the timing resolution, which will be studied in future.
This detector module can handle event rates of ~150,000 counts/s without significant performance degradation (figures 13, 14). Higher event rate capability is expected by using the latest J-series SiPMs from SensL, as the signal pulse shape is shorter (SensL 2014, 2017). The event rate can also be increased by using pile-up recovery electronics and more complicated readout (Wang et al 2003), such as reading out each SiPM signals individually. For most of the envisaged applications, the current counting rate capability already is sufficient.
Our work shows the possibility of developing dual-ended readout detectors based on large-area SiPM arrays and crystal arrays with a pitch size of 1.0 mm (for high resolution) and a length of 20 mm (for high sensitivity). Detector modules developed by others either use SiPM arrays with smaller size or crystal array with larger pitch size or shorter length (e.g. Shao et al 2015 and Stolin et al 2014). Monolithic crystal-based PET detectors with similar size also have been developed and are an attractive approach, however, complicated positioning algorithms, such as neural networks or maximum likelihood, are used to calculate the gamma photon interaction position, and training data or reference data are required (Borghi et al 2016 and Pierce et al 2018). Compared to the monolithic crystal-based PET detectors, detectors based on arrays of pixelated crystals are relatively easy to use and calibrate, and the simple center-of-gravity position algorithms can easily be implemented inside hardware, such as FPGAs.
5. Conclusions
The performance of a DOI encoding PET detector module based on large-area SiPM arrays was characterized in detail with a view to their use in high resolution dedicated organ PET scanners (brain or breast) and small animal PET scanners. The multiplexed readout electronics reduced the 288 SiPM signals to 9 signals, 8 signals for position information and 1 signal for timing information, greatly simplified the subsequent acquisition electronics.
With the attractive performance parameters measured here, relatively cost-effective and simple high-resolution small-animal PET and dedicated scanners for breast and brain imaging could be developed based upon these modules. Our next step is to develop detector modules and electronics that can be tiled on all four sides to eliminate gaps between modules and to develop a partial prototype human brain PET scanner to evaluate the performance at a system level.
Table IV.
Average timing resolution
| Average timing resolution (ns) | ||
|---|---|---|
| Temperature (°C) | w/ diode | w/o diode |
| 5 | 1.63 ± 0.08 | 1.75 ± 0.17 |
| 20 | 1.78 ± 0.09 | 2.04 ± 0.18 |
Acknowledgements
We wish to thank SensL for providing the SiPM arrays used in this work. This work was funded by NIH grants R01 EB019439.
References
- Anderson B and Anderson R 2017. Fundamentals of Semiconductor Devices (2rd) McGraw-Hill Education. [Google Scholar]
- Borghi G, Jan Peet B, Tabacchini V and Schaart DR 2016. 32 mm × 32 mm × 22 mm monolithic LYSO:Ce detector with dual-sided digital photon counter readout for ultrahigh-performance TOF-PET and TOF-PET/MRI Phys. Med. Biol 61 4929–4949. [DOI] [PubMed] [Google Scholar]
- Du H, Yang Y, Glodo J, Wu Y, Shah K and Cherry SR 2008. Continuous depth-of-interaction encoding using phosphor-coated scintillators Phys. Med. Biol 54:1757–1771. [DOI] [PMC free article] [PubMed] [Google Scholar]
- Du J, Bai X, Gola A, Ferri A, Piemonte C, Yang Y and Cherry SR 2018. Performance of a high-resolution depth-encoding PET detector module using linearly-graded SiPM Phys. Med. Biol 63:035035. [DOI] [PMC free article] [PubMed] [Google Scholar]
- Du J, Schmall J, Yang Y, Di K, Dokhale P, Shah K and Cherry SR 2013. A simple capacitive charge-division readout for position-sensitive solid-state photomultiplier array IEEE Trans. Nucl. Sci 60:3188–3197. [DOI] [PMC free article] [PubMed] [Google Scholar]
- Du J, Schmall J, Yang Y, Di K, Roncali E, Mitchell G, Buckley S, Jackson C and Cherry SR 2015. Evaluation of Matrix9 silicon photomultiplier array for small-animal PET Med. Phys 42:585–599. [DOI] [PMC free article] [PubMed] [Google Scholar]
- Du J, Wang Y, Zhang L, Zhou Z, Xu Z and Wang X 2009. Physical properties of LYSO scintillator for NN-PET detectors Proceedings of the 2009 2nd International Conference on Biomedical Engineering and Informatics 1:314–318. [Google Scholar]
- Du J, Yang Y, Bai X, Gola A, Ferri A, Zorzi N, Piemonte C and Cherry SR 2015. Evaluation of linearly-graded SiPMs for high resolution small-animal PET Biomedical Physics & Engineering Express 1:045008. [Google Scholar]
- Du J, Yang Y, Bai X, Judenhofer M, Berg E, Di K, Buckley S, Jackson C and Cherry SR 2016. Characterization of large-area SiPM array for PET applications IEEE Trans. Nucl. Sci 63:8–16. [DOI] [PMC free article] [PubMed] [Google Scholar]
- Joung J, Miyaoka R and Lewellen T 2002. cMiCE: a high resolution animal PET using continuous LSO with a statistics based positioning scheme Nucl. Instrum. Methods A 489:584–598. [Google Scholar]
- Kolb A, Parl C, Mantlik F, Liu C, Lorenz E, Renker D and Pichler B 2014. Development of a novel depth of interaction PET detector using highly multiplexed GAPD cross-strip encoding Med. Phys 41:081916. [DOI] [PubMed] [Google Scholar]
- Lee M and Lee J 2015. Depth-of-interaction measurement in a single-layer crystal array with a single-ended readout using digital silicon photomultiplier Phys. Med. Biol 60:6495–6514. [DOI] [PubMed] [Google Scholar]
- Lewellen TK 2008. Recent developments in PET detector technology Phys. Med. Biol 53: R287–R317. [DOI] [PMC free article] [PubMed] [Google Scholar]
- ON Semiconductor. NSR0320MW2T1G, NSVR0320MW2T1G, NSR0320MW2T3G. Datasheet. 2011 http://www.onsemi.com/pub_link/Collateral/NSR0320MW2T1-D.PDF.
- Pierce L, Pedemonte S, DeWitt D, MacDonald L, Hunter W, Van Leemput K and Miyaoka R 2018. Characterization of highly multiplexed monolithic PET / gamma camera detector modules Phys. Med. Biol 63 075017. [DOI] [PMC free article] [PubMed] [Google Scholar]
- Popov V 2011. Advanced data readout technique for multianode position sensitive photomultiplier tube applicable in radiation imaging detectors JINST 6:C01061. [Google Scholar]
- Ren S, Yang Y and Cherry SR 2014. Effects of reflector and crystal surface on the performance of a depth-encoding PET detector with dual-ended readout Med. Phys 41:072503. [DOI] [PMC free article] [PubMed] [Google Scholar]
- Rudan M 2017. Physics of Semiconductor Devices (2rd) Springer. [Google Scholar]
- Saoudi A, Pepin C, Pékpin C, Houde D and Lecomte R 1999. Scintillation light emission studies of LSO scintillators IEEE Trans. Nucl. Sci 46:1925–1928. [Google Scholar]
- Schmall J, Du J, Yang Y, Dokhale P, McClish M, Christian J, Shah K and Cherry SR 2013. Comparison of large-area position-sensitive solid-state photomultipliers for small animal PET Phys. Med. Biol 57:8119–8134. [DOI] [PubMed] [Google Scholar]
- SensL. C-series low noise, blue-sensitive silicon photomultipliers. Datasheet. 2014 http://sensl.com/downloads/ds/DS-MicroCseries.pdf.
- SensL. J-series high PDE and timing resolution, TSV package. Datasheet. 2017 http://sensl.com/downloads/ds/DS-MicroJseries.pdf.
- Shao Y, Sun X and Lou K 2015. Development of compact DOI-measurable PET detectors for simultaneous PET/MR Imaging EJNMMI Physics 2:A2. [DOI] [PMC free article] [PubMed] [Google Scholar]
- Shao Y, Sun X, Lan K, Bircher C, Lou K and Deng Z 2014. Development of a prototype PET scanner with depth-of-interaction measurement using solid-state photomultiplier arrays and parallel readout electronics Phys. Med. Biol 59:1223–1238. [DOI] [PMC free article] [PubMed] [Google Scholar]
- Slomka P, Pan T, Germano G 2016. Recent advances and future progress in PET instrumentation Seminars in Nuclear Medicine 46:5–19. [DOI] [PubMed] [Google Scholar]
- Stickel J and Cherry SR 2004. High-resolution PET detector design: modelling components of intrinsic spatial resolution Phys. Med. Biol 50:179–195. [DOI] [PubMed] [Google Scholar]
- Stolin A, Majewski S, Jaliparthi G, Raylman R and Proffitt J 2014. Evaluation of imaging modules based on SensL array SB-8 for nuclear medicine applications IEEE Trans. Nucl. Sci 61:2433–2438. [Google Scholar]
- Tai Y, Chatziioannou A, Yang Y, Silverman R, Meadors K, Siegel S, Newport D, Stickel J and Cherry SR 2003. MicroPET II: design, development and initial performance of an improved microPET scanner for small-animal imaging Phys. Med. Biol 48:1519–1537. [DOI] [PubMed] [Google Scholar]
- Thompson C and Goertzen A 2011. Evaluation of a 16:3 signal multiplexor to acquire signals from a SiPM array with dual and single layer LYSO crystal blocks IEEE Trans. Nucl. Sci 58:2175–2180. [Google Scholar]
- Wang Y, Li H, Liu Y, Xing T, Uribe J, Baghaei H, Farrell R and Wong W 2003. A modular low dead-time coincidence system for high-resolution PET cameras IEEE Trans. Nucl. Sci 50:1386–1391. [Google Scholar]
- Yang Y, Dokhale P, Silverman R, Shah K, McClish M, Farrell R, Entine G and Cherry SR 2006. Depth of interaction resolution measurements for a high resolution PET detector using position sensitive avalanche photodiodes Phys. Med. Biol 51:2131–2140. [DOI] [PubMed] [Google Scholar]
- Yang Y, Wu Y, Farrell R, Dokhale P, Shah K and Cherry SR 2011. Signal and noise properties of position-sensitive avalanche photodiodes Phys. Med. Biol 56:6327–6336. [DOI] [PMC free article] [PubMed] [Google Scholar]
- Yang Y, Wu Y, Qi J, James S, Du H, Dokhale P, Shah K, Farrel R and Cherry SR 2008. A prototype PET scanner with DOI-encoding detectors J. Nucl. Med 49:1132–1140. [DOI] [PMC free article] [PubMed] [Google Scholar]


