Abstract
Background:
Approximately one-fourth of all cancer metastases are found in the brain. MRI is the primary technique for detection of brain metastasis, planning of radiotherapy, and the monitoring of treatment response. Progress in tumor treatment now requires detection of new or growing metastases at the small subcentimeter size, when these therapies are most effective.
Purpose:
To develop a deep-learning-based approach for finding brain metastasis on MRI.
Study Type:
Retrospective.
Sequence:
Axial postcontrast 3D T1-weighted imaging.
Field Strength:
1.5T and 3T.
Population:
A total of 361 scans of 121 patients were used to train and test the Faster region-based convolutional neural network (Faster R-CNN): 1565 lesions in 270 scans of 73 patients for training; 488 lesions in 91 scans of 48 patients for testing. From the 48 outputs of Faster R-CNN, 212 lesions in 46 scans of 18 patients were used for training the RUSBoost algorithm (MatLab) and 276 lesions in 45 scans of 30 patients for testing.
Assessment:
Two radiologists diagnosed and supervised annotation of metastases on brain MRI as ground truth. This data were used to produce a 2-step pipeline consisting of a Faster R-CNN for detecting abnormal hyperintensity that may represent brain metastasis and a RUSBoost classifier to reduce the number of false-positive foci detected.
Statistical Tests:
The performance of the algorithm was evaluated by using sensitivity, false-positive rate, and receiver’s operating characteristic (ROC) curves. The detection performance was assessed both per-metastases and per-slice.
Results:
Testing on held-out brain MRI data demonstrated 96% sensitivity and 20 false-positive metastases per scan. The results showed an 87.1% sensitivity and 0.24 false-positive metastases per slice. The area under the ROC curve was 0.79.
Conclusion:
Our results showed that deep-learning-based computer-aided detection (CAD) had the potential of detecting brain metastases with high sensitivity and reasonable specificity.
Each year, 170,000 patients are diagnosed with brain metastases in the U.S., and they account for roughly one-fourth of all cancer metastases.1 As advances in molecularly targeted therapies, immunotherapies, and stereotactic radiation therapy improve the survival of cancer patients, the proportion of patients presenting with brain metastasis is increasing. Indeed, many patients live for years with treated brain metastases without suffering the cognitive impairment produced by whole-brain radiation.2-4 This improved survival represents a significant advance in cancer treatment, but also dramatically increases the importance of accurate detection of brain metastases and the need for precision follow-up. When brain metastases are detected early at a small size,5,6 stereotactic radiosurgery (SRS) and stereotactic radiotherapy (SRT) have been shown to be very effective.7,8 For example, SRT can be performed on new or additional metastases at multiple timepoints without exceeding critical radiation dose thresholds.
These developments make it essential that radiologists find all the metastases in each follow-up brain magnetic resonance imaging (MRI) scan, where a single scan can consist of more than 150 slices. Radiologists are now often asked to track 20 or more metastases that have been treated with SRS at different times over a course of years. Many metastases demonstrate a decrease in size and postcontrast conspicuity after therapy. By comparison, 10 years ago it was rarely necessary to follow more than three or four brain metastases because once this number was exceeded the only available treatment options were whole-brain radiation and then hospice care. This paradigm shift in neuro-oncology has made the task of brain MRI interpretation far more critical, difficult, and time-consuming. Because metastases can grow rapidly in weeks or months between MRI follow-ups, and radiologist workloads are increasing, improving accuracy and efficiency are critical to improving patient safety and outcomes.9-11
The primary obstacles to metastasis detection are their small sizes, similarity with small blood vessels, and low contrast-to-background ratio (CBR) on brain images. Also, although small metastases are often seen only on a single MRI slice, radiologists must scroll back and forth through neighboring slices to differentiate a metastasis from the surrounding vessels, a time-consuming and error-prone process. This search task is complicated by the fact that, prior to detection, it is unknown whether sections of a given brain MRI harbor any metastasis and, if so, the number of metastases.
Because the consequences of missing a metastasis are high for patients, providers, and the healthcare system, and the task is difficult, brain metastasis detection presents an opportunity for computer-aided detection (CAD), such as deep-learning-based approaches. Deep-learning techniques like convolutional neural network (CNN) and its variations have been increasingly used in image classification and segmentation.12-14 Motivated by its successful applications seen in computer vision, CNN-related techniques have been applied to address clinical problems.15-20 For example, CNNs have also been applied to detect and segment breast cancer in mammograms21 and lung cancer in computed tomography.22
As a descendant of CNN, R-CNN (regions with CNN) combines region proposals with CNN to constitute a scalable detection scheme for image analysis.23 R-CNN evolved into Faster R-CNN, which is based on a region proposal network (RPN) that shares full-image convolutional features with a detection network.24 RPN is a deep convolutional neural network that inputs the image feature map from the last convolutional layer of the Faster R-CNN network and outputs a number of “region proposals.” RPN quickly scans an image to calculate the probability of an object is at a location and only the locations with a high probability, ie, region proposals, are further analyzed for detection and classification. These region proposals reduce the computational cost by narrowing down the area of an input image with a high probability of containing the objects of interest, which in our case means brain metastases. With a simple alternating optimization, RPN and Faster R-CNN can be trained to share convolutional features. In brain image analysis, use of these and similar deep-learning techniques have been reported for primary brain tumor detection and segmentation,25,26 and, in a few cases, for brain metastasis detection.27-29
In spite of existing efforts for developing CAD approaches for brain image modeling and analysis, to date no clinically useful CAD system is available to assist radiologists in detecting brain metastases on MRI.30
In this work we designed a deep-learning-based pipeline as a CAD approach for detecting brain metastases on 2D MRI. We aimed to achieve a high sensitivity with a reasonable false-positive rate for assisting users to find metastases.
Materials and Methods
Imaging Data
The study was approved by our Institutional Review Board (IRB). Informed consent was waived by the IRB because this study was a retrospective analysis of existing records. The image data were retrospectively retrieved from our institutional electronic medical records. All study images were deidentified before analysis. Axial 3D spoiled gradient recalled or magnetization prepared rapid gradient echo T1-weighted contrast-enhanced MR images were retrieved for analysis. Patients with one or more brain metastases were selected sequentially during clinical readout. MRI scanners included 1.5T and 3T from two major vendors (General Electric, Milwaukee, WI, and Siemens, Erlangen, Germany). Spatial coverage for all sequences was “whole brain.” The range of acquisition parameters for SPGR sequences were as follows: matrix: 256–512 by 256–512; slice thickness: 0.9846–3.8396 mm (2.6368 ± 0.8204); pixel size: 0.4297–1.0156 mm (0.5855 ± 0.1973 mm); relaxation time (TR): 6–30 msec; echo time (TE): 1.88–11 msec; field of view (FOV): 75–100 mm; flip angle: 10–40°. The range of acquisition parameters for MPRAGE sequences were as follows: matrix: 176–512 by 215–512; slice thickness: 0.8862–2.1504 mm (1.0711 ± 0.2023); pixel size: 0.4688–1.0547 mm (0.9489 ± 0.1013 mm); TR: 1580–2400 msec; TE: 2.49–4.44 msec; TI: 900–1240 msec; FOV: 69–100 mm; flip angle: 8–15°. Our dataset also included a small amount of sampling perfection with application optimized contrasts using different flip angle evolution and volumetric interpolated breathhold examination sequences from other hospitals. The acquisition parameters for SPACE sequences were as follows: matrix: 256–512 by 256–512; slice thickness: 1–2.0078 mm (1.6991 ± 0.4692); pixel size: 0.4980–1 mm (0.6385 ± 0.2414 mm); TR: 600–700 msec; TE: 8.2–12 msec; FOV: 100–100 mm; flip angle: 120–120°. The acquisition parameters for VIBE sequences were as follows: matrix: 448–512 by 512–512; slice thickness: 1.9692–2.0480 mm (2.0086 ± 0.0557); pixel size: 0.4883–0.5078 mm (0.4980 ± 0.0138 mm); TR: 6–7 msec; TE: 2.23–3.48 msec; FOV: 88–100 mm; flip angle: 10–10°.
In total, we retrieved data from 121 metastases patients, with 2053 metastases on 14,530 slices of images from a total of 361 scans. Patients were selected for inclusion in the study from patients known to have definite clinical and imaging diagnosis of brain metastases. Patients with lesions not definitively known to represent metastases were not included. To confirm the diagnoses of brain metastases, we convened a review panel consisting of two radiologists and two oncologists: a neuroradiologist with 20 years of experience (G.S.Y.), an academic general radiologist with 9 years of experience (J.L.), a neuro-oncologist with 25 years of experience (D.A.R), and a neuro-oncologist with 3 years of experience (J.R.M.F.). The panel reviewed all imaging and clinical data relevant to whether lesions on the included brain MRIs represented metastases, including index, immediate prior and follow-up MRIs, clinical oncology and other notes, and pathology reports as available. Pathological confirmation of brain metastasis from brain biopsy or resection was available in 43 patients (36%). In the remaining 78 patients (64%) brain surgery had not been performed and hence brain tissue pathologic diagnosis was not available. Presumably this is because the treating physicians determined that the risks of brain surgery were not justified in light of the high diagnostic certainty of brain metastasis based on clinical and imaging data. All 78 of these patients had a known diagnosis of primary cancer arising elsewhere in the body. After review, the panel unanimously confirmed the clinical diagnosis of brain metastasis in all 78 of these patients. Most patients had multiple scans, while a few of them had one scan. Their primary cancer included lung cancer (53), breast cancer (28), melanoma (22), and other types of cancer (18). The mean and standard deviation of patient ages were 54.4 and 16.76, respectively. There were 46 males and 75 females in the patient cohort. For training and testing of the Faster R-CNN and RUSBoost (MatLab, MathWorks, Natick, MA), we randomly divided patients into training and test sets. Because a subset of patients had had multiple scans over a period of time, in assigning patients to the training and test sets we ensured that all the scans of the same patients were either assigned to the training set or the test set to ensure that no patient occurred in both datasets and to keep the two sets independent.
Major Steps of the CAD System
The proposed CAD pipeline consisted of several steps, including preprocessing, Faster R-CNN for metastasis detection, skull stripping, and RUSBoost for false-positive reduction. The preprocessing steps included intensity normalization and data augmentation. The Faster R-CNN step then analyzed each slice of brain MRI for generating bounding boxes that may contain metastases. Next, skull striping was employed to remove skull from each slice. Finally, RUSBoost was applied to reduce false positives by analyzing 22 radiomics features of each remaining bounding box.
Preprocessing
Before an image was used for training or testing purposes, we applied a series of operations to preprocess the images. As the first step, because the original images were of different matrix sizes, we padded the images with 0’s. We then performed scaling, if necessary, to convert all the images to the same matrix size of 900 × 900. Next, we then performed a per-image mean subtraction to make all the images zero-centered, which is a necessary step because the VGG16 model required all the input images to have a zero mean. Then, as the last step of preprocessing, we employed a left-right flip operation to augment the size of our training data.
Faster R-CNN
In this step, we applied a Faster R-CNN VGG16 model as outlined previously24,31 for metastasis detection. The detailed structure of the model is shown in Fig. 1, and it consisted of five convolutional layers, two deconvolutional layers, one RPN layer, and two fully connected layers. The RPN network uses a 3 × 3 spatial window to scan the feature map to obtain the proposals. It attached nine anchor boxes at a single position—derived from three different aspect ratios at three different scales. The three aspect ratios used here were 0.5 (landscape), 1 (square), and 2 (portrait), and the areas of the rectangular bounding boxes at the three scales were set to 162, 322, and 642 pixels to accommodate the different sizes of brain metastases on the images. Next are two 1 × 1 convolutional layers for classification (cls) and regression (reg), whereas the classification layer determines whether anchors are positive or negative, and the regression layer obtains the exact proposals through bounding box regression correction anchors. Then the ROIPooling layer collected the input feature maps and calculated proposals, integrated this information, extracted the proposal feature maps, and sent them into the subsequent fully connected layer. The proposal feature maps are used to calculate the category of the proposal, and the bounding box regression is used again to obtain the position of the detection box. Finally, the Faster R-CNN generated the bounding boxes and the corresponding scores of the proposals. Its output has two outcomes: one is a rectangular bounding box over a detected brain metastasis and the other is a prediction score, representing the degree of confidence in determining the bounding box as a metastasis. The VGG16 model we used for metastasis CAD had been pretrained on the ImageNet database. As such, it requires that its input be in the RGB format, while our brain MRIs were of grayscale only. So we repeated the mono-channel brain images twice to convert them to the RGB format.
FIGURE 1:
Structure of our deep-learning approach.
One challenge in brain metastasis detection is the small size of the true objects. Further, the metastases may locate at any position in the brain. In optimizing the Faster R-CNN, we found that the stride length of the conv5_3 feature map was too large for most of the brain metastases seen in MRI, and the downsampling ratio of 1/16 used in the VGG16 model could cause a miss in detection so we applied deconvolutional layers to upsample the feature map. We used two deconvolutional layers after the conv5_3 layer to achieve a downsampling ratio of 1:4. In the convolutional layers, the stride is 1, kernel size is 3, and zero padding size 1. In the deconvolutional layers, the stride is 2, kernel size 4, and zero padding size 1.
To train the RPNs, we assigned a binary class label (of being an object or not) to each anchor. A positive label was assigned to two kinds of anchors: 1) the anchor(s) with the highest Intersection over Union (IoU) overlapping with a ground truth box, and 2) an anchor that has an IoU of 70% or more between the bounding box and the ground truth. Here we note that a single bounding box of the ground truth may assign positive labels to multiple anchors. We assigned a negative label to a nonpositive anchor if its IoU was less than 30% for the corresponding ground truth box. Anchors that are neither positive nor negative will not contribute to the training objective. With these definitions, we minimize the following objective function24:
| (1) |
where pi is the predicted probability of the i-th anchor being a brain metastasis, and λ is a balancing parameter, which was set to 10 in this work. The ground truth label was 1 if the anchor was positive and 0 otherwise. Here ti, i = 1, …, 4, are the four parameterized coordinates of the predicted bounding box, and , i = 1, …4, are the coordinates of the bounding box of ground truth associated with a positive anchor. The classification loss Lcls is log loss over two classes, metastases or not. The regression loss Lreg uses the smooth L1 loss function. The optimization method we used here was SGD (Stochastic Gradient Descent), the batch size was 2, total iterations 36,000, and learning rate 0.01. Most patients had multiple scans, while several patients only had one scan.
Our method achieves bounding box regression by a different manner from previous feature map-based methods,31 in which bounding box regression is performed on features pooled from arbitrarily sized regions, and the regression weights are shared by all region sizes. The features used for regression are of the same spatial size (n × n) on the feature maps. To account for varying sizes, a set of k bounding box regressors are learned. Each regressor is responsible for one scale and one aspect ratio, and the k regressors do not share weights, so it can predict bounding boxes of various sizes.
The output for our deep-learning method consists of rectangular object proposals, each with an objectness score (here, the word “objectness” means the presence of an object, or not, in a region of interest, so-called “objectness” of the proposed region24). If the objectness score is larger than 0.85, we determined that it is a brain metastasis and drew a red rectangle on the proposal.
Skull Stripping
As in this work we focused on the metastases in the brain parenchyma and employed FreeSurfer to remove the skull32,33 and, hence, eliminate the false positives that were marked outside the brain mass. The skull strip algorithm combines watershed algorithms and a deformable surface.
False-Positive Reduction by RUSBoost
The false positives within the output of Faster R-CNN, followed by skull stripping, outnumbered the true positives. To reduce false positives, we applied the RUSBoost algorithm as a postprocessing step to improve the performance of the whole CAD pipeline.
The RUSBoost algorithm combines data sampling (random undersampling) and boosting (AdaBoost, adaptive boosting) to handle data imbalance problems.34 In our case, the 2639 false positives from Faster R-CNN constituted the majority class, while the 841 true positives were the minority class. In implementation, RUSBoost undersampled the majority class to make the number of false positives equal to the true positives and then performed AdaBoost on the balanced classes. In this process, a new weak classifier is added in each iteration until a predetermined error rate is reached. Each training sample is given a weight, indicating the probability that it is selected into the next iteration’s training set. If a sample point has been accurately classified, then the probability of being selected in the next training set is reduced; otherwise, its weight is increased. In the AdaBoost, misclassified sample from previous classifier will be used to train the next classifier.
Training and Testing the Pipeline
The ground truth was marked by two radiologists by placing a rectangular box around each metastasis on every slice. All interpretations were performed independently by the two radiologists (G.S.Y. with 20 years of experience and J.L. with 9 years of experience.) To measure the agreement between the two readers, we calculated the Cohen’s kappa coefficient to be 0.901. We randomly selected 73 patients, for a total of 270 scans and 1565 lesions, for training the Faster R-CNN. We assigned the remaining 48 patients, for a total of 91 scans and 488 lesions, for testing the Faster R-CNN. Then, from the 48 output cases of Faster R-CNN, we randomly selected 18 cases, for a total of 46 scans and 212 lesions, for training the RUSBoost. We used the remaining 30 cases, for a total of 45 scans and 276 lesions, for testing the RUSBoost.
We applied a holdout validation for the RUSBoost classification. In each round of cross-validation, the data were partitioned into 75% for training and 25% for validation. The training set was used to train the RUSBoost and the testing set to evaluate the performance. The process was repeated several times, using the average cross-validation error as a performance indicator, which is essentially a 2-fold cross-validation with a 75:25 split ratio.
We tested our method on brain MRIs and compared the results with the ground truth provided by human experts. Computations were carried out on a computer equipped with an Intel Core i7 2.90 GHz CPU and a single NVIDIA GTX 1080 Max-Q GPU with Ubuntu 16.04 LTS system. The total training time of the Faster R-CNN was 20 hours and the running time for applying the trained Faster R-CNN on a single scan was about 1.5 minutes.
Performance Evaluation
We tested our method on brain MRIs and compared the results with the ground truth provided by human experts. To evaluate the overall performance of our method, we calculated the sensitivity and false-positive rate, defined as:
| (2) |
| (3) |
In this work we did not calculate the area under the curve (AUC) of the receiver operating characteristic (ROC) for the step of Faster R-CNN because the true-negative rate cannot be determined, as there are infinitive locations in a brain scan that can be considered metastasis-free. Similarly, since our input data were selected from patients with brain metastases, there are no true-negative patients in the current sample, precluding a patient-by-patient analysis. In the absence of a clearly valid way to compute the AUC of the ROC, we chose to use sensitivity and the rate of false positives per examination to evaluate the performance of CAD. For the step of RUSBoost, because its input contains a known finite number of true-positive boxes and false-positive boxes, we calculated its AUC of the ROC curve.
Results
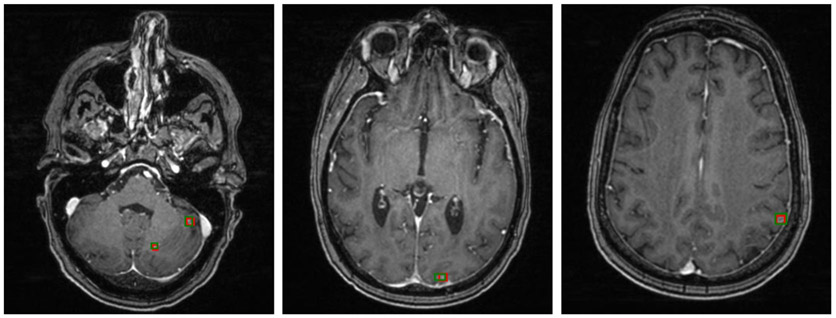
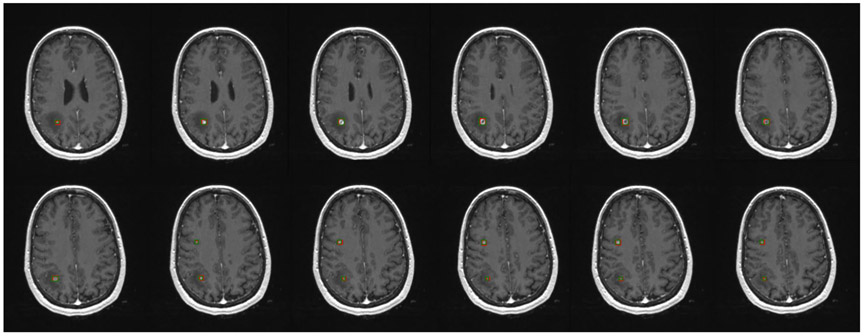
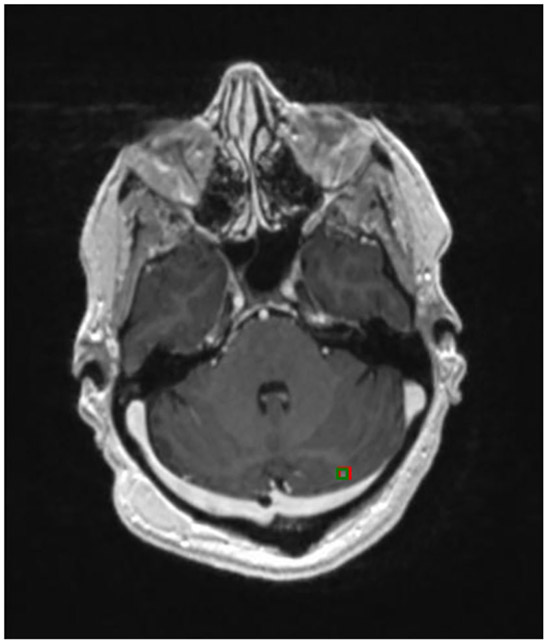
Figure 2 shows three examples of brain metastases on different scans that the Faster R-CNN accurately detected, with red bounding boxes marking the Faster R-CNN results and green bounding boxes representing the ground truth. It shows that the Faster R-CNN method can find metastases that are very small and located throughout different regions in the brain. Figure 3 is an example of a patient with two metastases, the first of which, in the frontal lobe, was detected in all 12 consecutive slices. The second metastasis, located in the parietal lobe, was accurately detected in the five consecutive slices on which the metastasis was observed. These examples illustrate that the method can detect multiple metastases correctly, even when the metastases are of very different shapes and intensities. A more challenging case is shown in Fig. 4, in which a small lesion of the size of 3 mm in diameter was correctly identified by our method.
FIGURE 2:
Detection results of brain metastasis of three different images by our method, marked in red bounding boxes. Ground truth is given by green bounding boxes.
FIGURE 3:
Brain metastases on consecutive slices. Green boxes represent ground truth and red boxes are the predictive output.
FIGURE 4:
Smallest brain metastasis detected by our method (red bounding box).
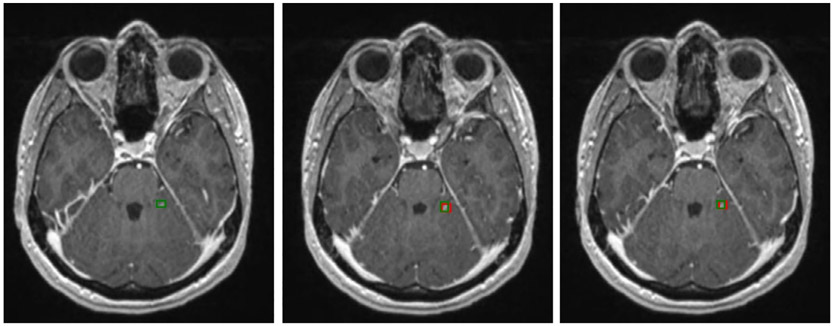
For some small metastases that appeared on multiple slices, our method did not detect the same metastasis on every slice, although it usually found the metastasis on at least one or two slices. Figure 5 illustrates such a case in which our method missed the brain metastasis in the first slice, but detected the metastases on the second and third slices. In this case, the metastasis was small and had very low signal intensity, making it very challenging even for a human expert to detect.
FIGURE 5:
A challenging example of a small brain metastasis found in three consecutive slides by human experts. The metastasis was not detected on the first slice but was successfully detected on the second and third slices by our method.
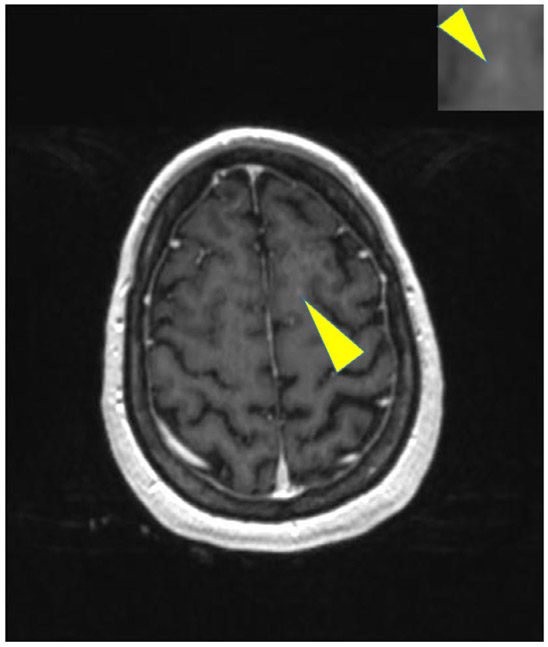
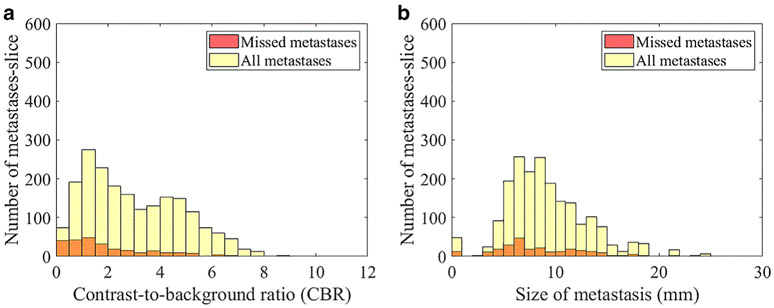
The final model missed only 12 of 276 metastases in the test set of 30 patients. Six of the missed metastases were found from scans of a patient who had more than 25 metastases. All the missed metastases were small and had very low CBR (definition given in Appendix). A missed metastasis is shown in Fig. 6.
FIGURE 6:
An example of missed metastases by our method.
The method achieved a sensitivity of 95.6% (95% confidence interval [CI] [94.0%, 99.1%]) for metastasis detection with a false-positive rate of 19.9 (95% CI [16.9, 23.8]) per scan. If each slice with a detectable metastasis is treated independently, the sensitivity was 87.1% (95% CI [85.5%, 91.3%]) and false-positive rate 0.24 (95% CI [0.19, 0.27]) per slice.
For objects contained in a bounding box, our results showed that the CBR for all detected metastases is 3.15 ± 1.82 and the CBR for the missed metastases was 1.96 ± 1.63, indicating that higher CBR in the image allowed better performance. The histogram is shown in Fig. 7a. Size is another factor that affects the detection rate of metastases. In Fig. 7b, the plot shows that the number of missed metastases decreased as the size of metastases increased. We also evaluated the effect of RUSBoost in impacting the performance of Faster R-CNN and found that, without using RUSBoost, the sensitivity was 97% and the false-positive rate was 27/scans. With the use of RUSBoost, the sensitivity of the whole pipeline was 96% and the false-positive rate was 20/scans.
FIGURE 7:
Number of missed metastasis-slice by CBR (a) and by diameter (b).
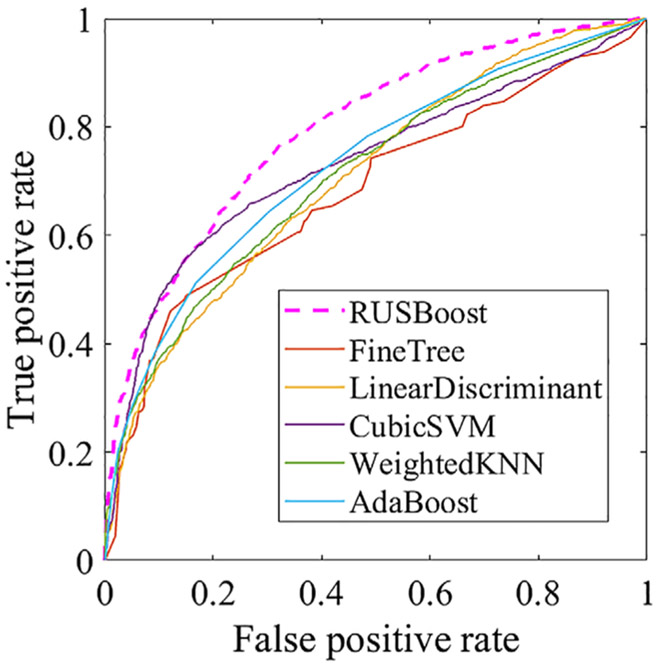
In order to reduce the false-positive rate in the outcome of Faster R-CNN, we compared the performances of RUSBoost with several other classification methods and found that RUSBoost was the most effective. We plotted the ROC curves of RUSBoost vs. those of FineTree,35 CubicSVM (Cubic support vector machine),36 weighted K-nearest neighbor,37 local discriminator,38 and AdaBoost39 (Fig. 8 and Table 1) and found that RUSBoost had the largest AUC.
FIGURE 8:
ROC curves of RUSBoost and several comparison classification methods.
TABLE 1.
AUC of the ROCs of RUSBoost and Several Classification Methods
| Classification method | AUC |
|---|---|
| RUSBoost | 0.7945 |
| Linear Discrimination | 0.7070 |
| Cubic SVM | 0.7316 |
| Weighted KNN | 0.7096 |
| Fine Tree | 0.6831 |
| AdaBoost | 0.7229 |
Discussion
In this work we developed a deep-learning-based CAD tailored to brain metastasis detection on T1-weighted MRI and evaluated its performance in terms of sensitivity and false-positive rate. Accurate detection of brain metastases is of clinical significance for treating and managing cancer patients, as the brain is a common place for cancer to metastasize. However, finding brain metastases is very difficult because of the small sizes, weak signal intensities, and multiple locations of metastatic lesions. As a CAD technique, our method is comparable to previous reports on brain metastasis detection. For example, Sunwoo et al proposed a CAD framework that employed K-mean clustering and template match as preprocessing steps to reduce false positives and then a threelayer artificial neural network to identify metastases in 3D MRI.27 They achieved a sensitivity of 87.3% and a false-positive rate per case of 302. By modeling brain metastases as spherical objects while accounting for the partial volume effect, Ambrosini et al developed a 3D template matching algorithm for finding metastases in MRI.40 The algorithm, employing 3D templates of various radii, obtained a sensitivity of 89.9% with a false-positive rate of 0.22 per slice in the brain parenchyma.40 Pérez-Ramírez et al proposed a template matching approach that first calculated the cross-correlations between 3D templates with brain MRIs for identifying candidate metastases and then each candidate was segmented to compute the degree of anisotropy.41 Candidates with a degree of anisotropy less than a preset threshold were determined to be true metastases. The method attained a performance of a sensitivity of 88.10% and a false-positive rate of 0.05 per slice. Charron et al adapted an existing 3D CNN (DeepMedic) to detect brain metastases and found that, by combining 3D T1, 2D T1, and 2D FLAIR (fluid attenuated inversion recovery), the 3D CNN achieved the best performance for a sensitivity of 98% and 7.2 false positives per scan.28 Grovik et al developed a 2.5D neural network based on GoogLeNet architecture to take multiple MR sequence images, T1-weighted 3D spin echo, T1-weighted 3D axial IR-prepped FSPGR (BRAVO), and 3D CUBE FLAIR as input for brain metastasis detection and obtained an average sensitivity of 83%, a false-positive rate of 8.3 per scan for metastases of all sizes, and false-positive rate of 3.4 per scan for metastases larger than 10 mm3.29
Compared with primary brain tumor detection and other types of abnormality detection, metastases present several unique challenges. The first challenge is that, while primary brain tumors are usually more than a hundred pixels in size, brain metastases can be less than five pixels in many cases. The very high sensitivity of our algorithm (96% in our test set) suggests that the method can successfully deal with this challenge. Our results suggest that brain metastases of smaller sizes and lower CBR are more challenging for the machine-learning model to find (Fig. 7), as they are for human experts.
The second challenge is the similarity between brain metastases and small blood vessels in images, as both may present as a small focus of hyperintensity on a single T1-weighted contrast-enhanced MRI image and small blood vessels may be misclassified as metastases. The false-positive rate of 20 FPs per scan in our test cases indicates that this remains an important challenge. To investigate the cause behind these remaining false positives, we randomly selected eight test scans, which had a total of 256 false positives, and examined the false positives on each scan. We found that 88% of false positives were small blood vessels and the remaining 12% were due to imaging artifacts and other factors. Human experts differentiate between metastases and small blood vessels by examining their morphology in 3D, since metastasis is typically spherical or ovoid and small blood vessels are generally serpentine and can be tracked through multiple adjacent images. We plan to apply 3D morphological analysis as a postprocessing step in our next iteration of the CAD model to distinguish brain metastases from small blood vessels and reduce the false-positive rate.
The third challenge is that there can be multiple brain metastases of various sizes and all need to be fully accounted for by computerized analysis. In future work, we plan to implement automated image preprocessing to improve input data uniformity and construct a new deep-learning network with MRI images.
In this work, we employed RUSBoost to reduce false positives in the output of Faster R-CNN, which contained more false positives than true positives. The hybrid RUSBoost algorithm includes random undersampling and AdaBoost. This is appropriate for improving the performance of classification learners trained with imbalanced data that have a much larger majority class and a much smaller minority class. The random undersampling step iteratively removes examples from the majority class (in our data, the false positives) until the desired class distribution is achieved. We compared RUSBoost with some popular classification algorithms, including support vector machine, decision trees, K-nearest neighbors, discriminant analysis, and AdaBoost and found RUSBoost had the best performance among them.
Although a well-designed CNN alone, with a sufficiently large training dataset, may provide excellent performance, this requires a large and comprehensive labeled training set, which is difficult to obtain in medical imaging. In addition, the accurate performance of CNN relies on having a complex and deep structure that raises the risk of overfitting when trained on small datasets. The results from our current work demonstrate high sensitivity and a false-positive rate that is acceptable for initial proof-of-concept but will need to be reduced prior to clinical translation. We anticipate that the number of false positives can be substantially reduced by geometric modeling approaches to differentiate metastases from small blood vessels, which is a goal of ongoing work.
In a pipeline of detecting abnormalities in brain images, skull stripping can be either placed before or after the detection step. In our current work, we placed skull stripping after Faster R-CNN because our eventual goal was to design a CAD system that can detect metastases anywhere in the brain including the skull, scalp, and facial soft tissues.
The sensitivity of our method to false positives related to blood vessels highlights an important clinical application for a relatively recently developed set of MRI acquisition techniques referred to collectively as “black blood” techniques.42-44 These employ a variety of approaches to selectively suppress the signal intensity of flowing blood without suppressing the signal intensity of static enhancing structures such as brain metastases. In 2013, Yang et al reported a neural network approach for finding brain metastases on black blood imaging, in which a 3D template matching was first used to select regions of interest (ROIs) that potentially contained metastases and then a neural network further analyzed the ROIs to determine the presence of metastases.45 The method obtained a sensitivity of 81.1% and a specificity of 98.2%. Although black blood imaging techniques are very promising, these approaches are currently not widely used in the clinic because of the extra scan time they require. In future, such approaches may prove synergistic to CAD methods in the quest for higher accuracy in diagnosis.
Limitations
Our current work has a limitation in that the pipeline is currently implemented to process each slice of a 3D image stack separately. As such, it may miss certain 3D anatomic context in the 2D analysis, and this context is essential for a human radiologist to detect true-positive metastases and reject false-positive vessels and other structures. This can prove to be valuable information in future CAD development such as 3D CNN approaches. Another limitation is the moderate amount of data used in the current work. With an expanded database, it is expected that deep-learning-based CAD techniques can achieve better performance.
Conclusion
Our results from this initial exploratory CAD investigation demonstrate sensitivity high enough to be clinically useful and a false-positive rate acceptable for proof-of-concept but not yet optimal for clinical translation. Future work includes adapting this method to 3D data and acquiring additional larger training datasets to reduce the false-positive rate and produce a more robust CAD system.
Supplementary Material
Acknowledgments
Contract grant sponsor: National Institutes of Health (NIH); Contract grant numbers: R01LM012434, K99LM012874.
References
- 1.National Institutes of Health. Metastatic brain turmor. 2015. Available from: https://www.nlm.nih.gov/medlineplus/ency/article/000769.htm.
- 2.Linskey ME, Andrews DW, Asher AL, et al. The role of stereotactic radiosurgery in the management of patients with newly diagnosed brain metastases: A systematic review and evidence-based clinical practice guideline. J Neurooncol 2010;96(1):45–68. [DOI] [PMC free article] [PubMed] [Google Scholar]
- 3.Park HS, Chiang VL, Knisely JP, Raldow AC, Yu JB. Stereotactic radiosurgery with or without whole-brain radiotherapy for brain metastases: An update. Expert Rev Anticancer Ther 2011;11(11):1731–1738. [DOI] [PubMed] [Google Scholar]
- 4.Quigley MR, Fuhrer R, Karlovits S, Karlovits B, Johnson M. Single session stereotactic radiosurgery boost to the post-operative site in lieu of whole brain radiation in metastatic brain disease. J Neurooncol 2008; 87(3):327–332. [DOI] [PubMed] [Google Scholar]
- 5.Devoid HM, McTyre ER, Page BR, Metheny-Barlow L, Ruiz J, Chan MD. Recent advances in radiosurgical management of brain metastases. Front Biosci (Schol Ed) 2016;8:203–214. [DOI] [PubMed] [Google Scholar]
- 6.Greto D, Scoccianti S, Compagnucci A, et al. Gamma knife radiosurgery in the management of single and multiple brain metastases. Clin Neurol Neurosurg 2016;141:43–47. [DOI] [PubMed] [Google Scholar]
- 7.Soliman H, Das S, Larson DA, Sahgal A. Stereotactic radiosurgery (SRS) in the modern management of patients with brain metastases. Oncotarget 2016;7(11):12318–12330. [DOI] [PMC free article] [PubMed] [Google Scholar]
- 8.Lippitz B, Lindquist C, Paddick I, Peterson D, O’Neill K, Beaney R. Stereotactic radiosurgery in the treatment of brain metastases: The current evidence. Cancer Treat Rev 2014;40(1):48–59. [DOI] [PubMed] [Google Scholar]
- 9.Klos KJ, O’Neill BP. Brain metastases. Neurologist 2004;10(1):31–46. [DOI] [PubMed] [Google Scholar]
- 10.Oh Y, Taylor S, Bekele BN, et al. Number of metastatic sites is a strong predictor of survival in patients with nonsmall cell lung cancer with or without brain metastases. Cancer 2009;115(13):2930–2938. [DOI] [PubMed] [Google Scholar]
- 11.Yoo H, Jung E, Nam BH, et al. Growth rate of newly developed metastatic brain tumors after thoracotomy in patients with non-small cell lung cancer. Lung Cancer 2011;71(2):205–208. [DOI] [PubMed] [Google Scholar]
- 12.Long J, Shelhamer E, Darrell T, Fully convolutional networks for semantic segmentation. In: Proceedings of the IEEE Computer Society Conference on Computer Vision and Pattern Recognition; 2015, p 3431–3440. [Google Scholar]
- 13.Russakovsky O, Deng J, Su H, et al. Imagenet large scale visual recognition challenge. Int J Comput Vis 2015;115(3):211–252. [Google Scholar]
- 14.Szegedy C, Liu W, Jia Y, et al. Going deeper with convolutions. In: Proceedings of the IEEE Computer Society Conference on Computer Vision and Pattern Recognition; 2015, p 1–9. [Google Scholar]
- 15.Doi K Computer-aided diagnosis in medical imaging: Historical review, current status and future potential. Comput Med Imaging Graph 2007; 31(4–5):198–211. [DOI] [PMC free article] [PubMed] [Google Scholar]
- 16.Gibson E, Li W, Sudre C, et al. NiftyNet: A deep-learning platform for medical imaging. Comput Methods Programs Biomed 2018;158:113–122. [DOI] [PMC free article] [PubMed] [Google Scholar]
- 17.Sharma H, Zerbe N, Klempert I, Hellwich O, Hufnagl P. Deep convolutional neural networks for automatic classification of gastric carcinoma using whole slide images in digital histopathology. Comput Med Imaging Graph 2017;61:2–13. [DOI] [PubMed] [Google Scholar]
- 18.Shen D, Wu G, Zhang D, Suzuki K, Wang F, Yan P. Machine learning in medical imaging. Comput Med Imaging Graph 2015;41:1–2. [DOI] [PubMed] [Google Scholar]
- 19.Suzuki K Overview of deep learning in medical imaging. Radiol Phys Technol 2017;10(3):257–273. [DOI] [PubMed] [Google Scholar]
- 20.Xiao Y, Wu J, Lin Z, Zhao X. A deep learning-based multi-model ensemble method for cancer prediction. Comput Methods Programs Biomed 2018;153:1–9. [DOI] [PubMed] [Google Scholar]
- 21.Rouhi R, Jafari M, Kasaei S, Keshavarzian P. Benign and malignant breast tumors classification based on region growing and CNN segmentation. Expert Syst Appl 2015;42(3):990–1002. [Google Scholar]
- 22.Firmino M, Morais AH, Mendoca RM, Dantas MR, Hekis HR, Valentim R. Computer-aided detection system for lung cancer in computed tomography scans: Review and future prospects. Biomed Eng Online 2014;13:41. [DOI] [PMC free article] [PubMed] [Google Scholar]
- 23.Girshick R, Donahue J, Darrell T, Malik J. Rich feature hierarchies for accurate object detection and semantic segmentation. In: Proceedings of the IEEE Computer Society Conference on Computer Vision and Pattern Recognition; 2014, p 580–587. [Google Scholar]
- 24.Ren S, He K, Girshick R, Sun J, Faster R-CNN. Towards real-time object detection with region proposal networks. IEEE Trans Pattern Anal Mach Intell 2017;39(6):1137–1149. [DOI] [PubMed] [Google Scholar]
- 25.Kamnitsas K, Ledig C, Newcombe VFJ, et al. Efficient multi-scale 3D CNN with fully connected CRF for accurate brain lesion segmentation. Med Image Anal 2017;36:61–78. [DOI] [PubMed] [Google Scholar]
- 26.Menze BH, Jakab A, Bauer S, et al. The multimodal brain tumor image segmentation benchmark (BRATS). IEEE Trans Med Imaging 2015;34 (10):1993–2024. [DOI] [PMC free article] [PubMed] [Google Scholar]
- 27.Sunwoo L, Kim YJ, Choi SH, et al. Computer-aided detection of brain metastasis on 3D MR imaging: Observer performance study. PLoS ONE 2017;12(6):178–265. [DOI] [PMC free article] [PubMed] [Google Scholar]
- 28.Charron O, Lallement A, Jarnet D, Noblet V, Clavier J-B, Meyer P. Automatic detection and segmentation of brain metastases on multimodal MR images with a deep convolutional neural network. Comput Biol Med 2018;95:43–54. [DOI] [PubMed] [Google Scholar]
- 29.Grovik E, Yi D, Iv M, Tong E, Rubin D, Zaharchuk G. Deep learning enables automatic detection and segmentation of brain metastases on multisequence MRI. J Magn Reson Imaging 2020;51(1):175–182. [DOI] [PMC free article] [PubMed] [Google Scholar]
- 30.Fink KR, Fink JR. Imaging of brain metastases. Surg Neurol Int 2013;4 (Suppl 4):S209–S219. [DOI] [PMC free article] [PubMed] [Google Scholar]
- 31.Chen C, Liu, Tuzel O, Xiao J. R-CNN for small object detection In: Comput Vis ACCV. Berlin: Springer; 2016. p 214–230. [Google Scholar]
- 32.Ségonne F, Dale AM, Busa E, et al. A hybrid approach to the skull stripping problem in MRI. Neuroimage 2004;22(3):1060–1075. [DOI] [PubMed] [Google Scholar]
- 33.Sadananthan SA, Zheng W, Chee MW, Zagorodnov V. Skull stripping using graph cuts. Neuroimage 2010;49(1):225–239. [DOI] [PubMed] [Google Scholar]
- 34.Seiffert C, Khoshgoftaar TM, Van Hulse J, Napolitano A. RUSBoost: A hybrid approach to alleviating class imbalance. IEEE Trans Syst Man Cybern Syst 2010;40(1):185–197. [Google Scholar]
- 35.Quinlan JR. Simplifying decision trees. Int J Man-mach Stud 1987;27 (3):221–234. [Google Scholar]
- 36.Cortes C, Vapnik V. Support-vector networks. Mach Learn 1995;20(3): 273–297. [Google Scholar]
- 37.Samworth RJ. Optimal weighted nearest neighbour classifiers. Ann Stat 2012;40(5):2733–2763. [Google Scholar]
- 38.Fisher RA. The use of multiple measurements in taxonomic problems. Ann Eugen 1936;7(2):179–188. [Google Scholar]
- 39.Freund Y, Schapire RE. A decision-theoretic generalization of on-line learning and an application to boosting. J Comp Syst Sci 1997;55(1):119–139. [Google Scholar]
- 40.Ambrosini RD, Wang P, O’Dell WG. Computer-aided detection of metastatic brain tumors using automated three-dimensional template matching. J Magn Reson Imaging 2010;31(1):85–93. [DOI] [PMC free article] [PubMed] [Google Scholar]
- 41.Perez-Ramirez U, Arana E, Moratal D. Brain metastases detection on MR by means of three-dimensional tumor-appearance template matching. J Magn Reson Imaging 2016;44(3):642–652. [DOI] [PubMed] [Google Scholar]
- 42.Komada T, Naganawa S, Ogawa H, et al. Contrast-enhanced MR imaging of metastatic brain tumor at 3 tesla: Utility of T1-weighted SPACE compared with 2D spin echo and 3D gradient echo sequence. Magn Reson Med Sci 2008;7(1):13–21. [DOI] [PubMed] [Google Scholar]
- 43.Park J, Kim EY. Contrast-enhanced, three-dimensional, whole-brain, black-blood imaging: Application to small brain metastases. Magn Reson Med 2010;63(3):553–561. [DOI] [PubMed] [Google Scholar]
- 44.Park J, Kim J, Yoo E, Lee H, Chang J-H, Kim EY. Detection of small metastatic brain tumors: Comparison of 3D contrast-enhanced whole-brain black-blood imaging and MP-RAGE imaging. Invest Radiol 2012; 47(2):136–141. [DOI] [PubMed] [Google Scholar]
- 45.Yang S, Nam Y, Kim MO, Kim EY, Park J, Kim DH. Computer-aided detection of metastatic brain tumors using magnetic resonance black-blood imaging. Invest Radiol 2013;48(2):113–119. [DOI] [PubMed] [Google Scholar]
Associated Data
This section collects any data citations, data availability statements, or supplementary materials included in this article.


