

Abstract
Recombinantly engineered bacterial outer membrane vesicles (OMVs) are promising vaccine delivery vehicles. The diversity of exogenous antigens delivered by OMVs can be enhanced by induced fusion of OMV populations. To date there are no reports of induced fusion of bacterial OMVs. Here we measure the pH and salt-induced aggregation and fusion of OMVs and analyze the processes against the Derjaguin-Landau-Verwey-Overbeek (DLVO) colloidal stability model. Vesicle aggregation and fusion kinetics were investigated for OMVs isolated from native E. coli (Nissle 1917) and lipopolysaccharide (LPS) modified E. coli (ClearColi) strains to evaluate the effect of lipid type on vesicle aggregation and fusion. Electrolytes and low pHs induced OMV aggregation for both native and modified LPS constructs, approaching a calculated fusion efficiency of ~25% (i.e. ~1/4 of collision events lead to fusion). However, high fusion efficiency was achieved for Nissle OMVs solely with decreased pH as opposed to a combination of low pH and increased divalent counterion concentration for ClearColi OMVs. The lipid composition of the OMVs from Nissle negatively impacted fusion in the presence of electrolytes, causing higher deviations from DLVO-predicted critical coagulation concentrations with monovalent counterions. The outcome of the work is a defined set of conditions under which investigators can induce OMVs to fuse and make various combinations of vesicle compositions.
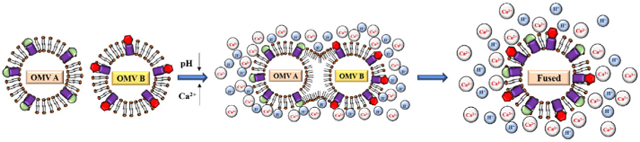
Graphical Abstract
1. Introduction
Pathogen-like particles (PLPs) are increasingly popular vaccine platforms. They are engineered to recapitulate and to resemble the composition and architecture of pathogens through the presentation of multiple antigens and immunostimulatory adjuvants, and can induce potent immune responses [1]. Outer membrane vesicles (OMVs) are a relatively recent example of PLPs with applications as therapeutics, drug delivery platforms, and vaccines [2-5]. OMVs are spherical lipid bilayers about 30–300 nm in diameter that bud constitutively from the outer membrane of bacteria and they can be recombinantly engineered to contain heterologous antigens [6]. While the functionalization of OMVs with a single antigen is well established, the functionalization of OMVs with multiple antigens to further enhance their efficacy as vaccines or vaccine adjuvants is challenging.
Genomic manipulation is commonly used to functionalize OMVs with antigens [7-9]. Unfortunately, low expression efficiency of multiple heterologous proteins in bacteria, and poor control over the relative levels of protein expression, make this approach to OMV functionalization difficult [10,11]. A potential alternative approach may be to make separate single-antigen OMVs and induce their fusion. Direct vesicle fusion has been reported among exosomes from eukaryotes and could be a way to integrate the contents of the lipid bilayer as well as the internal cargo of OMVs [12]. The conditions under which forced vesicle fusion or lipid mixing of synthetic model vesicles occurs are known and could be applied to functionalize the surface of OMVs through the fusion of OMVs containing different antigens [13].
Vesicle fusion requires lipid bilayers to come into contact and mix, overcoming the hydration barrier and repulsive electrostatics [14]. The process of vesicle fusion is affected by membrane composition, pH, ionic strength and valency of the counterion, and temperature - parameters that also determine vesicle aggregation, wherein vesicles adhere, but do not fuse, which is a necessary first step toward vesicle fusion [15-19]. To date, the direct fusion of OMVs has not been reported. In this work, we explored how variations in the salt concentration and pH influenced aggregation and fusion while identifying the conditions under which both were facilitated. In addition, we investigated the effect of membrane lipid composition by using OMVs both with and without lipopolysaccharide or LPS (a “modified-LPS”) isolated from Escherichia coli Nissle strain 1917 (EcN OMVs) and ClearColi (CC OMVs) respectively. By varying the pH as well as the concentration of monovalent and divalent counterions, we observed using dynamic light scattering (DLS) that aggregation of both EcN and CC OMVs occurred at acidic pHs above an experimentally determined isoelectric point (pI ~ 6.2 for EcN OMVs and 5.6 for CC OMVs) and at high salt concentration above a critical coagulation concentration (CCC) which was dependent on the pH and counterion valency. Furthermore, using the octadecyl rhodamine B (R18) lipid mixing assay, we observed that vesicle fusion was induced by acid but was reduced by increased counterion concentration in EcN OMVs while enhanced in CC OMVs, suggesting a deleterious role played by LPS in salt-dependent vesicle fusion of OMVs. Together, these results provide guidelines for the conditions under which OMVs can be fused to produce OMVs with different antigens.
Lastly, to identify ways to optimize the fusion efficiency, or the percentage of vesicle collisions that lead to fusion, and gain greater insight into the process, we compared the experimental aggregation results to predictions from classical Derjaguin-Landau- Verwey-Overbeek (DLVO) Theory to investigate factors that can limit aggregation. Comparing the experimental results with DVLO-predictions for critical coagulation concentrations (CCC) of counterions involved in OMV aggregation revealed the limiting role played by the presence of LPS on vesicle fusion.
2. Materials and methods
Preparation of outer membrane vesicles (OMVs).
OMVs were prepared and isolated as described previously [20]. Briefly, the plasmid pBAD-ClyA-GFP was transformed into the hypervesiculating E. coli strain Nissle 1917 or Clearcoli. An overnight culture of a single colony was sub-cultured into 4 × 60 mL of Luria–Bertani (Sigma Aldrich, L3152-1 KG) medium supplemented with 25 ug/mL of chloramphenicol (Sigma Aldrich, C3175-100MG) and 50 ug/mL of kanamycin (Sigma Aldrich, K1377-1G). The culture was grown to mid-log phase (OD600 ~ 0.4), at which time protein expression was induced with 0.2% l-arabinose (Sigma Aldrich, 10839-10G). Cell-free culture supernatants were collected 16–20 h postinduction and filtered through a 0.2-μm filter. Vesicles were isolated by ultracentrifugation (Beckman-Coulter; TiSW28 rotor; 26,000 rpm; 3 h; 4 °C) and resuspended in 10 mM Tris-HCl buffer (pH ~ 7.6). The concentration of the resuspended OMVs was determined using nanoparticle tracking analysis (NTA) with the Malvern NanoSight NS3000.
Dynamic Light Scattering Measurements.
DLS measurements were made starting with 10 mM Tris-HCl buffer then adjusted for pH and salt concentration. The samples were measured using a volume fraction of about 10−5 which allowed the aggregation dynamics to be on the order of minutes. Additionally, the polydispersity index (PDI) and average particle size was monitored by DLS to track aggregation behavior. Following DLS measurements, hydrodynamic sizes were measured at least 24 h after addition of controlled amount of salt or HCl/NaOH. Additionally, electrochemical properties such as the average Zeta potential and electrophoretic mobility, pertaining to the stability of suspended particles, were also measured. All experiments were performed in triplicate using independently prepared samples. All measurements were carried by a Malvern Zetasizer Nano ZS equipped with a HeNe laser (633 nm). The scattered light was measured at a constant angle of 173°. Analysis of the data was conducted using the DTS Malvern software.
Octadecyl-rhodamine (R18) membrane fusion assay.
Subpopulations of OMVs (~108 vesicles/mL), suspended in 10 mM Tris buffer pH = 7.6 (no additional salt), were labelled with octadecyl-rhodamine B or R18 (Thermo Fischer, O246), a red-emitting fluorophore, at sufficient concentration to quench fluorescence according to previously described procedures [21]. R18 molecules were incorporated into the OMV membrane via sonication for 30 min at the lowest setting using a VWR sonicator (VWR, B2500A-DTH, 210 W Power rating). The unincorporated R18 molecules were separated out via centrifugation through an illustra MicroSpin G-50 column (GE healthcare, 27533001). The labelled population was incubated with an excess of unlabeled OMVs also suspended in 10 mM Tris buffer pH = 7.6 (no additional salt). The mixed sample was then transferred into a 1 mL quartz cuvette, loaded into a fluorimeter (Photon Technology International, Inc.) and time-resolved recording of the fluorescence was initiated. Fusion experiments during which the pH and salt concentrations were varied were conducted using a pre-determined amount of hydrochloric acid (HCl, Sigma Aldrich, H1758) or sodium hydroxide (NaOH, Sigma Aldrich, S8045) (determined via titration). Likewise, changes in salt concentration were conducted by the addition of pre-determined amounts of chloride salts: Sodium (NaCl, S9888), Potassium (KCl, P3911), Calcium (CaCl2, C1016), and Magnesium (MgCl2, M8266) chloride obtained from Sigma Aldrich. Real-time recording of changes in fluorescence intensity was conducted until saturation, after which ~ 3% Triton-X-100 (Sigma Aldrich, X100) was added to burst the vesicles and record the maximum fluorescence intensity. The time at which the pH or the salt concentration was changed was considered time t = 0. Furthermore, using the following formula, the time-resolved fluorescence intensities were converted to fusion efficiencies:
Data and Statistical Analysis.
Curve fitting for the aggregation kinetics and fusion kinetics were all conducted using GraphPad Prism 7.0 employing the one-way association curve. The curve equation is shown below:
where for the fusion experiments,
Y0 is the initial fusion efficiency (%)
Ymax is the maximum fusion efficiency (%)
K is the fusion kinetic rate (seconds−1)
t is time in seconds
The fitted curves allowed determination of the kinetic fusion rates (K) and maximum fusion efficiencies (Ymax). For the aggregation experiments, K is the initial aggregation kinetic rate. One-way multiple comparisons ANOVA tests were conducted using GraphPad Prism. Turkey’s test between pairs of experimental conditions were conducted and differences between experimental results were deemed statistically significant if the p-value found was<0.05.
3. Results and discussion
The aggregation and fusion of model phospholipid-based liposome vesicles is influenced by lipid composition, pH, and counterion type and concentration [22-26]. OMVs are also lipid bilayers, leading to the hypothesis that these environmental parameters may also affect their aggregation and fusion. Dynamic light scattering (DLS) is a common technique to probe the stability of suspended vesicles [27,28]. However, DLS does not unequivocally distinguish between aggregation and vesicle fusion; therefore, the R18 lipid mixing assay was used to confirm OMV fusion [21]. The experimental advantage to the R18 assay is that it directly detects membrane fusion. However, one disadvantage is that only fusions between vesicles that contain R18 and vesicles that do not contain R18 are measured. Therefore, to obtain the true fusion efficiency, or the percentage of collision events that lead to fusion, an excess of unlabeled vesicles was added. The fusion efficiencies reported herein are thus experimentally correct, and approach 25%.
3.1. Aggregation of OMVs is induced by acidic pHs and/or high counterion concentration
Stable suspensions often have strong repulsive interactions that act as barriers to particle aggregation and vesicle fusion [29]. For colloidal systems in an aqueous environment devoid of surfactants, and when the colloids have charged surfaces, strong repulsive electrostatic forces must be considered in addition to the hydration barrier. The surface charge of OMVs is driven by the presence of phosphate head groups (pKa ~ 0) as well as ionizable amino acids in membrane proteins such as histidine (pKa ~ 3–5 depending on location), glutamic acid (pKa ~ 2.2–9.7), lysine (pKa ~ 6.5) and arginine (pKa greater than 9) [30-33]. Vesicle aggregation can be induced through shielding of the surface charge with counterions or by changing the ionization state of the surface by changing the pH [34].
We measured the stability of EcN and CC OMVs under varying pH (Fig. 1) and counterion concentration (Fig. 2 for Na+, Fig. 3 for Ca2+, Figure S1 for K+ and Figure S2 for Mg2+) by measuring the zeta potential, average hydrodynamic diameter and the polydispersity index (PDI). The pH range chosen was 3–10, wide enough to include the pKa of the amino acids present in the membrane proteins that determine the OMV surface charge. OMVs were initially suspended in a 10 mM Tris-HCl buffer solution at neutral pH. The pH was then instantaneously adjusted to a desired value by the addition of a pre-determined amount of HCl and/or NaOH with stirring. To ascertain whether OMV proteins were easily denatured under the conditions used to induce OMV aggregation and fusion, the EcN and CC OMVs were engineered to contain green fluorescent protein (GFP) on the OMV surface. The ratio of the fluorescence intensity before and after pH modification was measured to check for consistency under these environmental conditions. No significant fluorescence was lost at any of the acidic pHs tested (Figure S3). While GFP was used here, other proteins could be used but appropriate reporting procedure should be used to ascertain of protein denaturation. Salt concentrations in the millimolar range were used to mirror previous studies on liposome aggregation, and the concentrations of monovalent counterions (Na+ and K+) were adjusted to equate their ionic strength to that of the divalent counterion (Ca2+ and Mg2+).
Fig. 1.

Colloidal stability of EcN and CC OMVs as a function of pH. A) hydrodynamic size. B) polydispersity index (PDI). C) Zeta potential. Each point represents mean with standard deviation of triplicates.
Fig. 2.

Colloidal stability of EcN and CC OMVs as a function of pH and Na+ concentration. A, B, and C are the hydrodynamic size, polydispersity index (PDI) and Zeta potential, respectively for both EcN and CC OMVs for pH = 3.2 and 5.6. D, E, and F are the hydrodynamic size, polydispersity index (PDI) and Zeta potential, respectively for both EcN and CC OMVs for pH = 7.6 and 10.2. Each point represents mean with standard deviation of triplicates.
Fig. 3.

Colloidal stability of EcN and CC OMVs as a function of pH and Ca2+ concentration. A, B, and C are the hydrodynamic size, polydispersity index (PDI) and Zeta potential, respectively for both EcN and CC OMVs for pH = 3.2 and 5.6. D, E, and F are the hydrodynamic size, polydispersity index (PDI) and Zeta potential, respectively for both EcN and CC OMVs for pH = 7.6 and 10.2. Each point represents mean with standard deviation of triplicates.
Several observations are notable. At neutral pH, suspensions of both CC OMVs and EcN OMVs were stable, but with decreasing pH and increasing counterion concentration, there was a marked increase in both hydrodynamic diameter and PDI, indicative of aggregation and/or vesicle fusion. A sudden increase in PDI occurred under the same conditions where the hydrodynamic size increased, or the sign of the zeta potential changed. We considered that these conditions were an indication of the CCCs of the counterions. In accordance, shielding of the surface charge by counterions or changing the ionization state of the surface by changing the pH reduced the magnitude of the zeta potential, and thereby the repulsive electrostatics, and allowed the particles to interact and aggregate [35].
Additionally, for both LPS and modified-LPS OMVs, a higher concentration of monovalent counterions was needed relative to divalent counterions to induce aggregation. These results are reasonable since increased valency corresponds to an increase in screening power as noted by the Schulze-Hardy rule which states that the CCC is inversely proportional to valency [36]. However, the apparent isoelectric point, or the pH at which the surface charges are equal, was higher for EcN OMVs (pI ~ 6.2, vesicle with LPS) than it was for CC OMVs (pI ~ 5.6, vesicle without LPS). Furthermore, the apparent CCC for counterions in suspensions of EcN OMVs was lower than those for suspensions of CC OMVs.
The LPS in Gram-negative bacteria forms the lipid bilayer of the outer membrane and is made of three parts: a lipid A region buried in the lipid bilayer, a core oligosaccharide region and an O-antigen region [37]. The O-antigen region of the LPS, which is present in the EcN OMVs, hides the negative charges of the LPS phospholipid groups. This O-antigen region is absent in CC OMVs. With the phosphate groups more exposed in the CC OMVs, the apparent pI is lower than EcN OMVs, and more charge screening and ionization is needed to induce aggregation, which likely leads to the higher apparent CCCs for the CC OMVs.
For both types of OMVs, the hydrodynamic diameter dropped at counterion concentrations higher than the apparent CCC under basic conditions (Fig. 2D for Na+, Fig. 3D for Ca2+, Figure S1D for K+ and Figure S2D for Mg2+) and the surface charge became positive (Fig. 2F for Na+, Fig. 3F for Ca2+, Figure S1F for K+ and Figure S2F for Mg2+). This drop in the hydrodynamic size after aggregation is known as “reentrant condensation”, which is accompanied by a reversal in the surface charge [38]. Under acidic pHs, the hydrodynamic size and PDI both decreased with increased counterion concentration. The same occurred for the zeta potential. These results suggest that aggregation occurred at low pH but was reversed by an increase in counterions. In this particular case, the charge reversal that leads to reentrant condensation may be linked to an increased binding of chloride (Cl− ions), which has a binding affinity to lipid vesicles that is comparable to cationic counterions [39].
Both reentrant condensation and charge reversal are evidence of a patchy, heterogeneously charged surface [40]. The heterogeneity allows for more ions to adsorb than are needed to nullify the surface charge, which in turn leads to a resurgence of a strong electrostatic repulsion between particles [41]. From a pharmaceutical perspective, these behaviors indicate the pHs and electrolyte compositions under which OMV formulations will be stable. However, from an OMV antigen functionalization perspective (the focus of this work), reversible aggregation is counterproductive. Furthermore, since vesicle fusion is not a reversible process, one would not expect a decrease in hydrodynamic size. Thus, the switch to a decreasing trend in hydrodynamic size or reentrant condensation points to dominating aggregation effects.
3.2. Fusion of OMVs is induced by acidic pH but the effect of counterion concentration is LPS-dependent
DLS measurements show that aggregation and/or vesicle fusion occur in EcN and CC OMV suspensions under acidic pH and high ionic concentrations up to the apparent CCC. To specifically investigate the occurrence of vesicle fusion, the same conditions as above for the pH and counterion concentrations were evaluated, but this time using the octadecyl rhodamine B (R18) lipid mixing assay. Octadecyl rhodamine B is a self-quenching red fluorescent dye that integrates within the lipid bilayer. In fact, labeling OMVs with R18 means saturating the outer membrane with R18 molecules. This high surface density of R18 causes R18 molecules to be in proximity thus quenching each other’s fluorescence. Following lipid fusion between R18-labelled OMVs and unlabeled OMVs, the surface density of R18 is diluted causing an increase in fluorescence intensity (from dequenching of the R18) is observed and recorded with time. Fusion between either labeled or unlabeled OMVs does not cause dilution of the R18 surface density hence has no effect on the fluorescence intensity. The fusion efficiency, or the percentage of collision events that lead to fusion, is then calculated using the following expression:
| (1) |
Where the maximum fluorescence intensity is obtained by the addition of Triton-X. Each fusion efficiency curve was fit to a first order kinetic model (See Fig. 4). Although vesicle fusion is an apparent second order process, two particles coalescing into one, the excess of one of the reactants, in this case the unlabeled population of OMVs, allows modelling by first order kinetics. The model shown in Equation (2) was used to generate the curves in Fig. 4B:
Fig. 4.

Fusion efficiency curves for EcN-OMVs. A) as a function of pH and time. B) curve fits using Equation (2).
| (2) |
Where for the lipid mixing curves, Ymax is the maximum fusion efficiency, k is the fusion rate constant (sec−1) and t is time in seconds. From these fits, the kinetic parameters for the lipid mixing was extracted and compared under various pHs and ion concentrations to determine the conditions leading to the greatest fusion efficiency.
As shown in Fig. 5, acidic pHs induce the fusion of OMVs. Notably, EcN OMVs had greater lipid mixing (because of vesicle fusion) than CC OMVs, which is not unexpected given that aggregation was less pronounced in CC OMVs and their solvent-exposed negatively charged phosphate groups create a larger electrostatic barrier. However, with increasing divalent counterion, lipid mixing decreased in EcN OMVs but increased in CC OMVs for divalent counterions (Fig. 5C and 5F, as well as Figure S4B, S4D). The decrease in the lipid mixing for EcN OMVs in the presence of Ca2+, which was shown to be fusogenic in previous reports on the fusion of phospholipid vesicles [13,19,42], was unexpected. Since the OMVs differed in the type of lipid present in the membrane, we consider that this observation is a consequence of the full length LPS.
Fig. 5.

Maximum fusion efficiency as a function of pH and counterion concentration. A, B, C represent the maximum fusion efficiencies as a function of pH, Na+, Ca2+ respectively, for EcN OMVs. D, E, F represent the maximum fusion efficiencies as a function of pH, Na+, Ca2+ respectively, for CC OMVs. Each bar and point represent means with standard deviations of triplicates. **** signifies a p-value < 0.0005 and ** signifies p-value < 0.005.
As discussed earlier, LPS has three regions. The core oligosaccharide region is divided into an inner core containing the charged phosphate group linked the to the lipid A region, and an outer core linked to the O-antigen [43]. The inner core region not only mediates interaction with outer membrane proteins (OMPs) but also offer sites for the crosslinking of adjacent LPS molecules with divalent cations [44]. This crosslinking stabilizes the outer membrane, producing a monolayer which reduces the permeability of the membrane by reducing lateral diffusion [45]. Such a monolayer presents an inadvertent steric barrier to phospholipid exchange or lipid mixing between OMVs. Therefore, while acidity triggers fusion of OMVs, the presence of LPS in the outer membrane provides a challenge to lipid mixing in the presence of cationic counterions, making the truncation of LPS, like is present in the CC OMVs, able to aid vesicle fusion. Furthermore, from a vaccine engineering perspective, LPS modification also offers additional benefits. LPS is a TLR4 agonist, which imparts a strong inflammatory response and leads to significant toxicity [46]. OMVs with modified LPS, like those derived from ClearColi, have little or no TLR4 agonist activity, but retain other less toxic TLR agonists, making them more likely to be viable vaccine candidates [47].
3.3. Deviations from DLVO theory suggests LPS is a limiting factor in electrolyte-driven aggregation
The maximum measurable fusion efficiencies reached ~ 25% for EcN OMVs and CC OMVs. These fusion efficiencies are comparable to natural vesicle fusions, such as the pH-induced membrane fusion of influenza virus, which uses fusogenic proteins to actively induce fusion [48,49]. Insight into the rate-limiting steps in OMV fusions may help to further improve the efficiency of the process. As a first step, aggregation was investigated as the limiting step through the comparison of experimental results to predictions from DLVO theory.
Classical DLVO theory models the stability of colloidal dispersions in aqueous environments containing electrolytes with interparticle distances of the order of the Debye’s length [50]. At such distances, particles experience both London-van der Waal attractive forces and electrostatic repulsion forces due to their charged surface. Classical DLVO theory states that the total interaction potential, ψT, between two particles at some distance r from each other is the sum of the attractive London-van der Waals ψvdw and electrostatic repulsion potentials, ψelec.
| (3) |
Expressions for the London-van der Waals interaction potential between particles of various spatial geometries were derived and summarized by Rafael Tadmor [51] and Hamaker [52]. For the fusion of OMVs, we concern ourselves with the interaction potential between two spherical shells of equal radius R, thickness d and a Hamaker constant A. For such a case, the potential is calculated using the following:
| (4) |
The Hamaker constant for lipid bilayers was reported by Israechivili to be ~ 0.8 × 10⁻²⁰ and we use this number as an initial approximation for the OMV membranes [53]. Data reported for the Hamaker constant of liposomes and other lipid bilayer systems, calculated using nephelometry data or estimated using AFM measurements, are in agreement [22]. The thickness of the outer membrane (d) of E. coli is about 13 nm [54].
Counteracting the London van der Waals forces is an electrostatic repulsive force which arises from the interactions between the like-charged surfaces of the dispersed particles. This potential can be either screened or enhanced by the presence of electrolytes in solutions. For such an environment, the electrostatic interaction potential between surfaces is modelled using the solution to the non-linear Poisson-Boltzmann equation:
| (5) |
where,
β = l/kBT where kB is the Boltzmann constant and T is the temperature in Kelvin.
εε0 is the solvent dielectric,
e is the electron charge,
Zi is the valency of the ith ionic species and ni,bulk its bulk concentration in moles/m3
For the OMV experiments, both symmetric salts (NaCl and KCl) and asymmetric salts (CaCl2 and MgCl2) were used. Depending on the salt, Equation (3) becomes:
| (6) |
For 1:1 salt
| (7) |
For 1:2 salt
Where, κ is the Debye’s screening length given by:
| (8) |
NA is Avogadro’s number and I (mol/m3) is the ionic strength of the system given by:
| (9) |
ci is the molar concentration of the electrolyte
Although no exact analytical solutions exist for either Equation (6) or (7), assumptions can be made to derive numerical and asymptotic solutions to these equations for limiting behaviors (very thin and very large diffusive double layers). For OMVs, a large diffusive double layer approach was used in accordance with previous works dealing with liposomal suspensions22. For such systems, the Derjaguin approximation provides a numerical solution to both Equation (6) and (7) assuming either a constant charge or constant potential boundary condition following linearization of the equation. For a constant potential, the solution to the non-linear Poisson-Boltzmann is as follows [55]:
| (10) |
Where ψs is the potential at the surface of the particle.
By computing the total interaction potential (Fig. 6), it is clear that an energy barrier to aggregation is present. The dependency of this energy barrier to the addition of electrolyte is apparent through the observation that at a given concentration below a threshold, the energy barrier is reduced with increasing salt concentration. However, above the threshold, the reverse trend is observed due to charge reversal as previously mentioned (see Figs. 1-3).
Fig. 6.

Total interaction potential of EcN OMVs normalized by the thermal energy (kT) at pH = 7.6. A) as a function of Ca2+s. B) as a function of Na+.
Further numerical predictions are possible for this threshold electrolyte concentration, also known as a critical coagulation concentration (CCC). The CCC can be numerically calculated when the maximum of the total interaction potential is zero. Zhang et al. [56] derived an analytical expression to this effect:
| (11) |
Where
| (12) |
The proportionality of the CCC with the inverse sixth power of the valency of the counterion gives rise to what is known as the Schulze-Hardy rule. Additionally, DLVO-predicted CCCs can be compared to experimentally obtained values based on a kinetic model of particle aggregation also known as Smoluchowski’s Theory [57], which states that the time evolution of the number density of aggregates containing k particles is given by:
| (13) |
Where Jij is the rate at which aggregates containing i and j particles coagulate and Jki is the rate at which aggregates containing i and k particles coagulate.
The coagulation rate J is given by
| (14) |
Where ai is the size of the aggregate containing i particles, aj is the size of the aggregate containing j particles and Wij = Wij = W is the stability ratio.
| (15) |
Where ks,theor is the theoretical rate of coagulation and ks,exp is the experimental rate of coagulation. Smoluchowski derived the coagulation rate by assuming that the coagulation between particles of approximately the same size dominates. Therefore, at early time points, when doublet formation dominates, the theoretical coagulation rate becomes [58]:
| (16) |
Where no is the number concentration of primary particles.
Another useful expression for the stability ratio at interparticle distances of the order of the Debye’s length and particle size about 100 nm or larger [58] thus becomes:
| (17) |
Where ψT(r)″ is the second derivative of the total interaction potential at the interparticle distance r where the interaction potential is at a maximum. With added electrolytes, the maximum potential decreases and so does the stability ratio, leading to a minimum value, a threshold electrolyte concentration or CCC, which is found using the following relationship:
| (18) |
Where K1 ad K2 are constants and ni,bulk is the concentration of the ionic species i involved.
The CCC is defined on a log(W) vs. log(ni,bulk) plot where W = 1, which is the interception of the linear regions. The linear regions depict two regimes, diffusion-limited aggregation (where every collision leads to an aggregate) and reaction-limited aggregation (where a fraction of collisions leads to aggregation). Measurement of particle size by dynamic light scattering (DLS) at early time points (Figs. 7 and 8), when doublet formation occurs, allows calculation of the CCC through determination of the coagulation rate at various electrolyte concentrations and pHs. The aggregation rate is identified through a dimensionless aggregate number [59] given by:
Fig. 7.

Aggregation kinetics of EcN and CC OMVs as a function of pH. A) Time-variation of the aggregate number for EcN OMVs. B) Time-variation of the aggregate number for CC OMVs.
Fig. 8.

Aggregation kinetics of EcN and CC OMVs as a function of Na+ concentration and pH. A and B are time-variation of the aggregate number for EcN OMVs as a function of Na+ and pH = 7.6 and 10.2 respectively. C and D are time-variation of the aggregate number for CC OMVs as a function of Na+ and pH = 7.6 and 10.2 respectively.
| (19) |
Where Do is the average initial hydrodynamic diameter and Dt is the average hydrodynamic diameter at time t. Doublet formation results in an aggregate number of 2. Since OMV solutions are polydisperse and the values entered into Equation (19) are averages for the hydrodynamic size of the ensemble population, the aggregate number will not always be an integer.
Some notable observations are made from the DLS measurements. First, the aggregation in acidic pH was very rapid, producing aggregates within a minute following the addition of HCl (Fig. 7). Unfortunately, resolution of the sizes at times < 60 s was not experimentally possible. Accordingly, aggregation rates for electrolyte-induced aggregation was restricted to basic pHs (Fig. 8 for Na+, Figure S5 for Ca2+, Figure S6 for K+, and Figure S7 for Mg2+). The aggregate number reached a plateau around 6 for acidic suspensions and 2 when electrolytes were included. This saturation behavior was unexpected when put into context with other quantitative work using classical DLVO theory for suspensions of sols and metallic nanoparticles [60,61], which predicted stronger attractive forces between aggregates and thus unsaturated aggregate growth. However, other work with biological colloids do exhibit saturation behavior and those studies base the results on the presence of “extra” DLVO forces such as steric, osmotic, ion dispersion and hydrophobic forces [62-64]. These reports explain the saturation behavior as evidence of an aggregate growth based on singlet capture, which becomes limiting past the initial stage of aggregation [65]. Moreover, interactions between large aggregates of very different sizes are unfavorable since they involve stronger steric barriers that are difficult to overcome, while the electrostatic attractions created by charge heterogeneity are weaker [66]. The difference between the saturation values for pH-only aggregation and aggregation involving electrolytes could also be attributed to the screening of these already weakened electrostatic attractions. The formation of large clusters of OMVs is therefore not as favorable in electrolyte-driven aggregation as it is in pH-only driven aggregation. Collectively, these data suggest that electrolyte-induced aggregation is more favorable for the controlled fusion of OMVs.
Having measured the aggregation kinetics for doublet formation in basic pHs with added electrolytes, the stability ratios were calculated from experimental rates for coagulation using Equation (2). The log–log plot of the stability ratio vs. ion concentration (see Fig. 9 and Figure S8), was used to determine the CCCs. Tables 1 and 2 shows the CCCs for monovalent and divalent ions for EcN OMVs and CC OMVs respectively.
Fig. 9.

Log-log plot of the stability ratio vs. ion concentration for both EcN OMVs and CC OMVs. A) at pH = 7.6. B) at pH = 10.2.
Table 1.
Critical Coagulation Concentration (CCCs) of ions in suspensions of EcN OMVs.
| pH = 7.6 | DLVO-predicted CCC (M) | pH = 10.2 | DLVO-predicted CCC (M) | |
|---|---|---|---|---|
| Na+ | 0.364 | 1.025 | 0.550 | 1.463 |
| K+ | 0.325 | 1.025 | 0.506 | 1.463 |
| Ca2+ | 0.123 | 0.160 | 0.182 | 0.209 |
| Mg2+ | 0.161 | 0.160 | 0.195 | 0.209 |
Table 2.
Critical Coagulation Concentration (CCCs) of Counterions in suspensions of CC OMVs.
| pH = 7.6 | DLVO-predicted CCC (M) | pH = 10.2 | DLVO-predicted CCC (M) | |
|---|---|---|---|---|
| Na+ | 0.872 | 1.025 | 1.032 | 1.463 |
| K+ | 0.819 | 1.025 | 0.987 | 1.463 |
| Ca2+ | 0.163 | 0.160 | 0.207 | 0.209 |
| Mg2+ | 0.170 | 0.160 | 0.214 | 0.209 |
From Tables 1 and 2, classical DLVO theory closely predicted the CCCs of divalent counterions in both EcN and CC-OMVs but failed to predict the CCCs in the presence of monovalent ions. Deviations from classical DLVO behavior for biological colloids are not uncommon given their compositional variability. Ion dispersion forces and membrane fluctuation forces are the main contributors to deviations from classical DLVO theory when electrolyte concentrations are high, or greater than 5 × 10⁻² M, and when lipid bilayer membranes are involved [62]. Ion dispersion forces have a polarizing effect based on the valency and size of the counterion involved [64]. They strongly influence the zeta potential and play a definitive role in determining the strength and nature (attractive vs. repulsive) of the electrostatic interactions. For example, with increasing ionic strength, ion dispersion forces result in a stronger polarizing effect at the particle surface, which leads to attractive electrostatic interactions between particles despite the presence of a hydration barrier. However, these deviations are more pronounced with divalent ions, which have stronger polarization power. The fact that only monovalent ions displayed deviations from classical DLVO suggests an alternate reason for these deviations, such as the membrane fluctuation forces that are inherent to lipid bilayers; the fluidity of the lipid bilayer leads to random polarization of both electrostatic and London dispersion forces [67].
However, membrane fluidity is impaired in the presence of adsorbed electrolytes, reducing force fluctuations and allowing for better agreement with classical DLVO Theory [68]. In addition to the reduced fluidity induced by charge screening, divalent ions also crosslink phospholipids by acting as a bridge between the phosphate groups [69]. This alone is enough to reduce the fluidity of the lipid bilayers in LPS-modified CC OMVs. However, in EcN OMVs, the effects are more pronounced since divalent cations can also interact with the inner core of LPS molecules, introducing crosslinks and causing a greater reduction in membrane fluidity [44]. On the other hand, for monovalent ions, these crosslinks are not possible, and deviations from DLVO theory due to membrane fluctuations are therefore stronger. Nonetheless, we note that our investigation into whether aggregation was the limiting factor in the fusion of OMVs through comparison of the experimental predictions of the CCCs to DLVO-predicted values showed that interactions between OMVs can be modelled by classical DLVO. That said, aggregation being limiting would mean that increased salt concentration until above the CCC would increase fusion efficiency. This trend is reflected in the fusion efficiencies recorded for CC-OMVs in Fig. 5. EcN OMVs, however, displayed the opposite trend pointing to other factors limiting their fusion.
4. Conclusions
Herein we report the conditions under which bacterial outer membrane vesicles spontaneously fuse, and correlate the experimental results to colloid collision and fusion theory, developing the mathematics that are necessary for these new fusion events. Previous reports have hypothesized membrane fusion as a potential route for OMVs to deliver their content to either eukaryotic cells during pathogenic infection or bacterial cells during biofilm formation [70-72] Here, the fusion of bacterial OMVs is specifically investigated and shown to be induced by acidic pH change and modulated by ion composition and concentration, and vesicle lipid composition. With these new insights, OMVs produced from different bacterial sources might be fused to create multi-functional vesicles. This approach offers a unique avenue for the deliberate design of multi-antigen vaccines which would immunologically resemble and recapitulate the composition and architecture of pathogens to elicit protective immune responses. The evaluation of multi-antigen vaccines prepared in this fashion is currently a focus in our lab. Furthermore, for future work beyond pharmaceutical applications, the foundations outlined herein for the colloidal study of OMVs may assist other groups that study OMV roles in bacterial communication, where OMVs interact with bacteria, as well as OMV fusions with eukaryotic cell membranes or synthetic vesicles.
Supplementary Material
Acknowledgments
This research is supported by the National Institutes of Health under Award Numbers R01AI139664 and R21AI137858 to DP. Y. M.D.G. is supported by the Sam Fleming Scholarship and previously by a Kavli Graduate Fellowship.
Footnotes
Appendix A. Supplementary data
Supplementary data to this article can be found online at https://doi.org/10.1016/j.jcis.2020.04.068.
References
- [1].Rosenthal JA, Chen L, Baker JL, Putnam D, DeLisa MP, Pathogen-like Particles: Biomimetic Vaccine Carriers Engineered at the Nanoscale, Curr. Opin. Biotechnol 28 (2014) 51–58, 10.1016/j.copbio.2013.11.005. [DOI] [PubMed] [Google Scholar]
- [2].Kaparakis-Liaskos M, Ferrero RL, Immune Modulation by Bacterial Outer Membrane Vesicles, Nat. Rev. Immunol 15 (6) (2015) 375–387, 10.1038/nri3837. [DOI] [PubMed] [Google Scholar]
- [3].Schulz E, Goes A, Garcia R, Panter F, Koch M, Müller R, Fuhrmann K, Fuhrmann G, Biocompatible Bacteria-Derived Vesicles Show Inherent Antimicrobial Activity, J. Control. Release 290 (June) (2018) 46–55, 10.1016/j.jconrel.2018.09.030. [DOI] [PubMed] [Google Scholar]
- [4].Gujrati V, Kim S, Kim SH, Min JJ, Choy HE, Kim SC, Jon S, Bioengineered Bacterial Outer Membrane Vesicles as Cell-Specific Drug-Delivery Vehicles for Cancer Therapy, ACS Nano 8 (2) (2014) 1525–1537, 10.1021/nn405724x. [DOI] [PubMed] [Google Scholar]
- [5].van der Pol L, Stork M, van der Ley P, Outer Membrane Vesicles as Platform Vaccine Technology, Biotechnol. J 10 (11) (2015) 1689–1706, 10.1002/biot.201400395. [DOI] [PMC free article] [PubMed] [Google Scholar]
- [6].Kulp A, Kuehn MJ, Biological Functions and Biogenesis of Secreted Bacterial Outer Membrane Vesicles, Annu. Rev. Microbiol 64 (2010) 163–184, 10.1146/annurev.micro.091208.073413. [DOI] [PMC free article] [PubMed] [Google Scholar]
- [7].Daleke-Schermerhorn MH, Felix T, Soprova Z, ten Hagen-Jongman CM, Vikstrom D, Majlessi L, Beskers J, Follmann F, de Punder K, van der Wel NN, Baumgarten T, Pham TV, Piersma SR, Jimenez CR, van Ulsen P, de Gier JW, Leclerc C, Jong WSP, Luirinka J, Decoration of Outer Membrane Vesicles with Multiple Antigens by Using an Autotransporter Approach, Appl. Environ. Microbiol 80 (18) (2014) 5854–5865, 10.1128/AEM.01941-14. [DOI] [PMC free article] [PubMed] [Google Scholar]
- [8].Schaar V, De Vries SPW, Perez Vidakovics MLA, Bootsma HJ, Larsson L, Hermans PWM, Bjartell A, Morgelin M, Riesbeck K, Multicomponent Moraxella Catarrhalis Outer Membrane Vesicles Induce an Inflammatory Response and Are Internalized by Human Epithelial Cells, Cell. Microbiol 13 (3) (2011) 432–449, 10.1111/j.1462-5822.2010.01546.x. [DOI] [PubMed] [Google Scholar]
- [9].Lee SR, Kim SH, Jeong KJ, Kim KS, Kim YH, Kim SJ, Kim E, Kim JW, Chang KT, Multi-Immunogenic Outer Membrane Vesicles Derived from a MsbB-Deficient Salmonella Enterica Serovar Typhimurium Mutant, J. Microbiol. Biotechnol 19 (10) (2009) 1271–1279, 10.4014/jmb.0901.055. [DOI] [PubMed] [Google Scholar]
- [10].Rosano GL, Ceccarelli EA, Recombinant Protein Expression in Escherichia Coli: Advances and Challenges, Front. Microbiol. APR (2014, 5) 1–17, 10.3389/fmicb.2014.00172. [DOI] [PMC free article] [PubMed] [Google Scholar]
- [11].Ponomarev VS, Kozhikhova KV, Shulepov ID, Tokareva MI, Ivantsova MN, Mironov MA, Synthesis of Water Soluble Chitosan Derivatives and Their Use for the Stabilization of Liposomal Suspensions *, Russ. Chem. Bull. Int. Ed 63 (7) (2014) 1619–1623. [Google Scholar]
- [12].Ferro-Novick Susan, Jahn Reinhard, Vesicle fusion from yeast to man, Nature 370 (6486) (1994) 191–193, 10.1038/370191a0. [DOI] [PubMed] [Google Scholar]
- [13].Leventis R, Gagné J, Silvius JR, Fuller N, Rand RP, Divalent Cation Induced Fusion and Lipid Lateral Segregation in Phosphatidylcholine-Phosphatidic Acid Vesicles, Biochemistry 25 (22) (1986) 6978–6987, 10.1021/bi00370a600. [DOI] [PubMed] [Google Scholar]
- [14].Lee JY, Schick M, Calculation of Free Energy Barriers to the Fusion of Small Vesicles, Biophys. J 94 (5) (2008) 1699–1706, 10.1529/biophysj.107.119511. [DOI] [PMC free article] [PubMed] [Google Scholar]
- [15].Rapaport D, Hague GR, Pouny Y, Shai Y, PH- and Ionic Strength-Dependent Fusion of Phospholipid Vesicles Induced by Pardaxin Analogues or by Mixtures of Charge-Reversed Peptides, Biochemistry 32 (13) (1993) 3291–3297, 10.1021/bi00064a011. [DOI] [PubMed] [Google Scholar]
- [16].Walter A, Steer CJ, Blumenthal R, Polylysine Induces PH-Dependent Fusion of Acidic Phospholipid Vesicles: A Model for Polycation-Induced Fusion, BBA - Biomembr. 861 (C) (1986) 319–330, 10.1016/0005-2736(86)90434-7. [DOI] [PubMed] [Google Scholar]
- [17].Mora M, Mir F, de Madariaga M.a., Sagristá ML, Aggregation and Fusion of Vesicles Composed of N-Palmitoyl Derivatives of Membrane Phospholipids, Lipids 35 (5) (2000) 513–524, 10.1007/s11745-000-551-9. [DOI] [PubMed] [Google Scholar]
- [18].Stengel G, Simonsson L, Campbell RA, Höök F, Determinants for Membrane Fusion Induced by Cholesterol-Modified DNA Zippers, J. Phys. Chem. B 112 (28) (2008) 8264–8274, 10.1021/jp802005b. [DOI] [PubMed] [Google Scholar]
- [19].Carmona-Ribeiro AM, Chaimovich H, Salt-Induced Aggregation and Fusion of Dioctadecyldimethylammonium Chloride and Sodium Dihexadecylphosphate Vesicles, Biophys. J 50 (4) (1986) 621–628, 10.1016/S0006-3495(86)83501-9. [DOI] [PMC free article] [PubMed] [Google Scholar]
- [20].Kolling GL, Matthews KR, Export of Virulence Genes and Shiga Toxin by Membrane Vesicles of Escherichia Coli O157:H7, Appl. Environ. Microbiol 65 (5) (1999) 1843–1848. [DOI] [PMC free article] [PubMed] [Google Scholar]
- [21].Hoekstra D, de Boer T, Klappe K, Wilschut J, Fluorescence Method for Measuring the Kinetics of Fusion, Biochemistry 1984 (23) (1983) 5675–5681. [DOI] [PubMed] [Google Scholar]
- [22].Sabin J, Prieto G, Messina PV, Ruso JM, Hidalgo-Alvarez R, Sarmiento M, On the Effect of Ca2+ and La(3+)on the Colloidal Stability of Liposomes, Langmuir 21 (24) (2005) 10968–10975, 10.1021/la051397t. [DOI] [PubMed] [Google Scholar]
- [23].Volodkin D, Ball V, Schaaf P, Voegel JC, Mohwald H, Complexation of Phosphocholine Liposomes with Polylysine. Stabilization by Surface Coverage versus Aggregation, Biochim. Biophys. Acta - Biomembr 1768 (2) (2007) 280–290, 10.1016/j.bbamem.2006.09.015. [DOI] [PubMed] [Google Scholar]
- [24].Cametti C, Polyion-Induced Aggregation of Oppositely Charged Liposomes and Charged Colloidal Particles: The Many Facets of Complex Formation in Low-Density Colloidal Systems, Chem. Phys. Lipids 155 (2) (2008) 63–73, 10.1016/j.chemphyslip.2008.07.009. [DOI] [PubMed] [Google Scholar]
- [25].Wilschut J, Hoekstra D, Membrane Fusion: Lipid Vesicles as a Model System, Chem. Phys. Lipids 40 (2–4) (1986) 145–166, 10.1016/0009-3084(86)90068-X. [DOI] [PubMed] [Google Scholar]
- [26].Sennato S, Truzzolillo D, Bordi F, Aggregation and Stability of Polyelectrolyte-Decorated Liposome Complexes in Water-Salt Media, Soft Matter 8 (36) (2012) 9384–9395, 10.1039/c2sm25576f. [DOI] [Google Scholar]
- [27].Hassan PA, Rana S, Verma G, Making Sense of Brownian Motion: Colloid Characterization by Dynamic Light Scattering, Langmuir 31 (1) (2015) 3–12, 10.1021/la501789z. [DOI] [PubMed] [Google Scholar]
- [28].Schneider C, Hanisch M, Wedel B,Jusufi A, Ballauff M, Experimental Study of Electrostatically Stabilized Colloidal Particles: Colloidal Stability and Charge Reversal, J. Colloid Interface Sci 358 (1)(2011)62–67, 10.1016/j.jcis.2011.02.039. [DOI] [PubMed] [Google Scholar]
- [29].Verwey E, Overbeek T, Theory of the Stability of Lyophobic Colloids: On the Interactions of Sol Particles Having an Electrical Double Layer, Elsevier Publishing Company Inc, 1948. [Google Scholar]
- [30].Seelig J, Macdonald PM, Scherer PG, Phospholipid Head Groups as Sensors of Electric Charge in Membranes, Biochemistry 26 (24) (1987) 7535–7541, 10.1021/bi00398a001. [DOI] [PubMed] [Google Scholar]
- [31].Mclaughlin S, The Electrostatic Properties of Membranes, Annu. Rev. Biophys. Biophys. Chem 18 (1989) 113–136, 10.1146/annurev.biophys.18.1.113. [DOI] [PubMed] [Google Scholar]
- [32].Gorman-Lewis D, Martens-Habbena W, Stahl DA, Thermodynamic Characterization of Proton-Ionizable Functional Groups on the Cell Surfaces of Ammonia-Oxidizing Bacteria and Archaea, Geobiology 12 (2) (2014) 157–171, 10.1111/gbi.12075. [DOI] [PubMed] [Google Scholar]
- [33].Martfeld AN, Greathouse DV, Koeppe RE, Ionization Properties of Histidine Residues in the Lipid Bilayer Membrane Environment, J. Biol. Chem 291 (36) (2016) 19146–19156, 10.1074/jbc.M116.738583. [DOI] [PMC free article] [PubMed] [Google Scholar]
- [34].Little TE, Madani H, Lee SP, Kaler EW, Lipid Vesicle Fusion Induced by Phospholipase-C Activity in Model Bile, J. Lipid Res 34 (2) (1993) 211–217. [PubMed] [Google Scholar]
- [35].Leckband D, Israelachvili J, Intermolecular Forces in, Biology. Vol (2001) 34. [DOI] [PubMed] [Google Scholar]
- [36].Lyklema J, Coagulation by Multivalent Counterions and the Schulze-Hardy Rule, J. Colloid Interface Sci 392 (1)(2013) 102–104, https://doi.org/10.1016Zj.jcis.2012.09.066. [DOI] [PubMed] [Google Scholar]
- [37].Frirdich E, Whitfield C, Review: Lipopolysaccharide Inner Core Oligosaccharide Structure and Outer Membrane Stability in Human Pathogens Belonging to the Enterobacteriaceae, J. Endotoxin Res 11 (3) (2005) 133–144, https://doi.org/10.n77/09680519050n0030201. [DOI] [PubMed] [Google Scholar]
- [38].Sennato S, Truzzolillo D, Bordi F, Cametti C, Effect of Temperature on the Reentrant Condensation in Polyelectrolyte- Liposome Complexation, Langmuir 24 (21) (2008) 12181–12188, 10.1021/la8021563. [DOI] [PubMed] [Google Scholar]
- [39].Knecht V, Klasczyk B, Specific Binding of Chloride Ions to Lipid Vesicles and Implications at Molecular Scale, Biophys. J 104 (4) (2013) 818–824, 10.1016/j.bpj.2012.12.056. [DOI] [PMC free article] [PubMed] [Google Scholar]
- [40].Sennato S, Bordi F, Cametti C, Correlated Adsorption of Polyelectrolytes in the “Charge Inversion” of Colloidal Particles, Europhys. Lett 68 (2007) 296–302, 10.1209/epl/i2004-10244-0. [DOI] [Google Scholar]
- [41].Sennato S, Carlini L, Truzzolillo D, Bordi F, Salt-Induced Reentrant Stability of Polyion-Decorated Particles with Tunable Surface Charge Density, Colloids Surfaces B Biointerfaces 137 (2016) 109–120, 10.1016/j.colsurfb.2015.06.011. [DOI] [PubMed] [Google Scholar]
- [42].Wilschut J, Holsappel M, Jansen R, Ca2+-Induced Fusion of Cardiolipin/Phosphatidylcholine Vesicles Monitored by Mixing of Aqueous Contents, BBA - Biomembranes. (1982) 297–301. [DOI] [PubMed] [Google Scholar]
- [43].Lüderitz AO, Tanamoto K, Galanos C, Mckenzie GR, Brade H, Zähringer U, Rietschel T, Kusumoto S, Shiba T, Lipopolysaccharides : Structural Principles and Biologic Activities, Rev. Infect. Dis 6 (4) (1984) 428–431. [DOI] [PubMed] [Google Scholar]
- [44].Whitfield C, Kaniuk N, Frirdich E, Molecular Insights into the Assembly and Diversity of the Outer Core Oligosaccharide in Lipopolysaccharides from Escherichia Coli and Salmonella, J. Endotoxin Res 9 (4) (2003) 244–249, 10.1179/096805103225001440. [DOI] [PubMed] [Google Scholar]
- [45].Nikaido H, Molecular Basis of Bacterial Outer Membrane Permeability Revisited, Microbiol. Mol. Biol. Rev 67 (4) (2003) 593–656, 10.1128/MMBR.67.4.593. [DOI] [PMC free article] [PubMed] [Google Scholar]
- [46].van de Waterbeemd B, Streefland M, van der Ley P, Zomer B, van Dijken H, Martens D, Wijffels R, van der Pol L, Improved OMV Vaccine against Neisseria Meningitidis Using Genetically Engineered Strains and a Detergent-Free Purification Process, Vaccine 28 (30) (2010) 4810–4816, 10.1016/j.vaccine.2010.04.082. [DOI] [PubMed] [Google Scholar]
- [47].Watkins HC, Rappazzo CG, Higgins JS, Sun X, Brock N, Chau A, Misra A, Cannizzo JPB, King MR, Maines TR, Leifer CA, Whittaker GR, DeLisa MP, Putnam D, Safe Recombinant Outer Membrane Vesicles That Display M2e Elicit Heterologous Influenza Protection, Mol. Ther 25 (4) (2017) 989–1002, 10.1016/j.ymthe.2017.01.010. [DOI] [PMC free article] [PubMed] [Google Scholar]
- [48].Costello DA, Whittaker GR, Daniel S, Variations in PH Sensitivity, Acid Stability, and Fusogenicity of Three Influenza Virus H3 Subtypes, J. Virol 89 (1) (2015) 350–360, 10.1128/JVI.01927-14. [DOI] [PMC free article] [PubMed] [Google Scholar]
- [49].Takeda M, Leser GP, Russell CJ, Lamb RA, Influenza virus hemagglutinin concentrates in lipid raft microdomains for efficient viral fusion, Proceedings of the National Academy of Sciences 100 (25) (2003) 14610–14617, 10.1073/pnas.2235620100. [DOI] [PMC free article] [PubMed] [Google Scholar]
- [50].Butler JAV, Theory of the Stability of Lyophobic Colloids, Nature 162 (4113) (1948) 315–316, 10.1038/162315b0. [DOI] [Google Scholar]
- [51].Tadmor R, The London-van Der Waals Interaction Energy between Objects of Various Geometries, J. Phys. Condens. Matter 13 (9) (2001) L195–L202, 10.1088/0953-8984/13/9/101. [DOI] [Google Scholar]
- [52].Hamaker HC, The London–van Der Waals Attraction between Spherical Particles, Physica 4 (10) (1937) 1058–1072, 10.1016/S0031-8914(37)80203-7. [DOI] [Google Scholar]
- [53].Israelachvili JN, Strength of van Der Waals Attraction between Lipid Bilayers, Langmuir 10 (9) (1994) 3369–3370, 10.1021/la00021a077. [DOI] [Google Scholar]
- [54].Bayer ME, Zones of Membrane Adhesion in the Cryofixed Envelope of Escherichia Coli, J. Struct. Biol 107 (3) (1991) 268–280, 10.1016/1047-8477(91)90052-X. [DOI] [PubMed] [Google Scholar]
- [55].Sabín J, Prieto G, Ruso JM, Hidalgo-Álvarez R, Sarmiento F, Size and Stability of Liposomes: A Possible Role of Hydration and Osmotic Forces, Eur. Phys. J. E 20 (4) (2006) 401–408, 10.1140/epje/i2006-10029-9. [DOI] [PubMed] [Google Scholar]
- [56].Zhang Z, Zhao L, Li Y, Chu M, A Modified Method to Calculate Critical Coagulation Concentration Based on DLVO Theory, Math. Probl. Eng 2015 (4) (2015) 1–6, 10.1155/2015/317483. [DOI] [Google Scholar]
- [57].van Dongen PGJ, Ernst MH, Scaling Solutions of Smoluchowski’s Coagulation Equation, J. Stat. Phys 50 (1–2) (1988) 295–329, 10.1007/BF01022996. [DOI] [Google Scholar]
- [58].Marmur A, A Kinetic Theory Approach to Primary and Secondary Minimum Coagulations and Their Combination, J. Colloid Interface Sci 72 (1) (1979) 41–48, 10.1016/0021-9797(79)90178-4. [DOI] [Google Scholar]
- [59].Tawari SL, Koch DL, Cohen C, Electrical Double-Layer Effects on the Brownian Diffusivity and Aggregation Rate of Laponite Clay Particles, J. Colloid Interface Sci 240(1) (2001) 54–66, 10.1006/jcis.2001.7646. [DOI] [PubMed] [Google Scholar]
- [60].Knoblich B, Gerber T, Aggregation in SiO2 Sols from Sodium Silicate Solutions, J. Non. Cryst. Solids 283 (1–3) (2001) 109–113, 10.1016/S0022-3093(01)00356-8. [DOI] [Google Scholar]
- [61].Frens G, Particle Size and Sol Stability in Metal Colloids, Kolloid-Zeitschrift Zeitschrift fur Polym. 250 (7) (1972) 736–741, 10.1007/BF01498565. [DOI] [Google Scholar]
- [62].Boström M, Williams DRM, Ninham BW, Specific Ion Effects: Why DLVO Theory Fails for Biology and Colloid Systems, Phys. Rev. Lett 87 (16) (2001), 10.1103/PhysRevLett.87.168103.168103/1-168103/4. [DOI] [PubMed] [Google Scholar]
- [63].Ninham BW, On Progress in Forces since the DLVO Theory, Adv. Colloid Interface Sci 83 (1) (1999) 1–17, 10.1016/S0001-8686(99)00008-1. [DOI] [Google Scholar]
- [64].Martín-Molina A, Ibarra-Armenta JG, Quesada-Pérez M, Effect of Ion Dispersion Forces on the Electric Double Layer of Colloids: A Monte Carlo Simulation Study, J. Phys. Chem. B 113 (8) (2009) 2414–2421. [DOI] [PubMed] [Google Scholar]
- [65].Long M, Tao S, Vega D, Jiang T, Wen Q, Sophia L, Aggregation of Elongated Colloids in Water. 8 (5) (2016) 444–454, 10.1158/1940-6207.CAPR-14-0359.Nrf2-dependent. [DOI] [Google Scholar]
- [66].Svensson B, Jönsson B, The Interaction between Charged Aggregates in Electrolyte Solution. A Monte Carlo Simulation Study, Chem. Phys. Lett 108 (6) (1984) 580–584, 10.1016/0009-2614(84)85058-7. [DOI] [Google Scholar]
- [67].Monzel C, Sengupta K, Measuring Shape Fluctuations in Biological Membranes. J. Phys. D, Appl. Phys 49 (2016) (24), 10.1088/0022-3727/49/24/243002. [DOI] [Google Scholar]
- [68].Kagawa R, Hirano Y, Taiji M, Yasuoka K, Yasui M, Dynamic Interactions of Cations, Water and Lipids and Influence on Membrane Fluidity, J. Memb. Sci 435 (2013) 130–136, 10.1016/j.memsci.2013.02.006. [DOI] [Google Scholar]
- [69].Pedersen UR, Leidy C, Westh P, Peters GH, The Effect of Calcium on the Properties of Charged Phospholipid Bilayers, Biochim. Biophys. Acta - Biomembr. 1758 (5) (2006) 573–582, 10.1016/j.bbamem.2006.03.035. [DOI] [PubMed] [Google Scholar]
- [70].O’Donoghue EJ, Krachler AM, Mechanisms of Outer Membrane Vesicle Entry into Host Cells, Cell. Microbiol 18 (11) (2016) 1508–1517, 10.1111/cmi.12655. [DOI] [PMC free article] [PubMed] [Google Scholar]
- [71].Jäger J, Keese S, Roessle M, Steinert M, Schromm AB, Fusion of Legionella Pneumophila Outer Membrane Vesicles with Eukaryotic Membrane Systems Is a Mechanism to Deliver Pathogen Factors to Host Cell Membranes, Cell. Microbiol 17 (5) (2015) 607–620, 10.1111/cmi.12392. [DOI] [PubMed] [Google Scholar]
- [72].Beveridge TJ, Makin SA, Kadurugamuwa JL, Li Z, Interactions between Biofilms and the Environment, FEMS Microbiol. Rev 20 (3–4) (1997) 291–303, 10.1016/S0168-6445(97)00012-0. [DOI] [PubMed] [Google Scholar]
Associated Data
This section collects any data citations, data availability statements, or supplementary materials included in this article.