

Abstract
Objectives:
The microbiota-gut-brain axis is an intricate communication network that is emerging as a key modulator of psychological and physiological wellbeing. Recent pioneering work in the field has suggested a possible link between gut microbiome composition with sleep, an evolutionarily conserved behavior demonstrated to play a critical role in health. This study is the first to address relationships between self-reported sleep habits and gut microbiome composition in young, healthy individuals.
Methods:
A total of 28 young, healthy subjects (17 males/11 females; 29.8±10.4 years) that were free of metabolic or cardiovascular disease, and that did not take sleep medication or antibiotics within the past six months were included in the study. Relationships between self-reported sleep quality, obtained using the Pittsburgh Sleep Quality Index (PSQI), with microbial diversity (Shannon Index), the Firmicutes/Bacteroidetes (F/B) ratio, and select bacterial taxa were assessed.
Results:
Alpha diversity (r=−0.50) and F/B ratio (r=−0.47) were inversely associated (P<0.05) with the PSQI score. Ten bacterial taxa were associated (P<0.05) with the PSQI score, including genus-level Blautia (r=−0.57), Ruminococcus (r=−0.39), and Prevotella (r=0.39).
Conclusions:
In young healthy individuals, self-reported sleep quality was positively associated with microbial diversity. We also observed a positive association between sleep quality with F/B ratio, seemingly due to a greater relative abundance of Blautia and Ruminococcus (Firmicutes) and lower proportions of Prevotella (Bacteroidetes) in individuals reporting superior sleep quality. Future studies are encouraged to evaluate mechanistic links between the gut microbiome with sleep, as well as the health implications of this relationship.
Keywords: gut microbiome, microbiota-gut-brain axis, sleep, Prevotella, Blautia
INTRODUCTION
The gut microbiome is inextricably linked to human health and disease. Bidirectional communication pathways between the gut and diverse bodily systems including skeletal muscle [1], liver [2], bone [3], and the brain [4], have been proposed. Gut-brain crosstalk may be mediated by neural, hormonal, or immunological factors [5], all of which may be affected by the highly plastic gut microbiome [6]. The relevance of the microbiota-gut-brain axis is highlighted by studies linking dysregulation of the gut microbiome to altered behavioral patterns [7], autism [8], and other psychological disease states [9, 10]. These findings provide incentive for the continued exploration of relationships between the gut microbiome with other indices of psychological health and wellbeing.
Sleep is a universal biological need that regulates mood, supports learning, and clears metabolic waste from the brain [11]. Sleep behavior is regulated by homeostatic and circadian processes, the latter of which appears to be related to gut microbiome composition [12–14]. For example, circadian gene expression in germ-free mice is markedly dissimilar when compared with conventionally-raised mice [15], possibly due to modulation of circadian rhythmicity via microbial-metabolites (e.g., butyric acid). Meanwhile, four weeks of sleep fragmentation in mice induces proliferation of known butyrate-producing families Lachnospiraceae and Ruminococcaceae [16], which may be a compensatory attempt to mitigate elevated levels of circulating inflammation and insulin resistance seen with sleep deprivation [17] and/or restore sleep quality [18]. In human patients with obstructive sleep apnea, lower quantities of short-chain fatty acid (e.g., butyrate) producing bacteria are associated with elevated circulating inflammation and homocysteine levels [19]. Moreover, two nights of partial sleep deprivation in human subjects increased the Firmicutes/Bacteroidetes ratio and evoked distinct shifts in family-level microbial taxa associated with metabolic perturbation [20]. Collectively, these findings portend to a significant relationship between the gut microbiome and its metabolites with sleep, and highlight the apparent importance of this relationship for regulating inflammation and promoting metabolic health.
While the health implications of attaining adequate sleep are increasingly realized, a comprehensive understanding of the relationship between sleep habits with the gut microbiome is lacking. Though recent observational studies portend to a relationship between both self-reported [21] and objectively measured [22] sleep habits and gut microbiome characteristics, longitudinal sleep restriction is demonstrated to have no overt influence over microbiome composition in rats or humans [23]. To improve our understanding of the relationship between the gut microbiome with sleep habits in healthy individuals, we explored associations between gut microbiome diversity and microbial community profiles, from the phylum to the genus level, with one-month self-reported sleep characteristics using the Pittsburgh Sleep Quality Index [24]. We hypothesized that better subjective sleep quality would be associated with greater microbial diversity and a greater abundance of short-chain fatty acid (e.g., butyrate) producing-bacteria.
METHODS
Participants
A total of 28 young, healthy subjects (17 males/11 females) residing in Chatham County, Georgia, were included in the analysis. Individuals with diabetes mellitus, hypertension (systolic blood pressure ≥ 140 mmHg or diastolic blood pressure ≥ 90 mmHg), cardiovascular disease (clinical history), or those taking sleep medication or reporting antibiotic use within the past six months were excluded from the study. The study was conducted in accordance with the Declaration of Helsinki and was approved by Georgia Southern University’s Institutional Review Board.
Sleep Quality Assessment
On the day of the study visit, subjects arrived to the testing facility where height and body mass were assessed on a wall mounted stadiometer and calibrated digital scale, respectively. Self-reported sleep habits over a one-month time span were characterized using the Pittsburgh Sleep Quality Index (PSQI) [24]. The PSQI is a self-rated questionnaire intended to comprehensively assess sleep quality by generating seven “component” scores: subjective sleep quality, sleep latency, sleep duration, habitual sleep efficiency, sleep disturbances, use of sleeping medication, and daytime dysfunction. By summing component scores in each of these domains, a global PSQI score is generated ranging from 0 to 21, with a lower score indicating healthier sleep quality, and a score of > 5 indicating poor sleep quality [24].
Gut Microbiome Analyses
Stool samples were self-collected at home using a commercially available kit (Ubiome Explorer, San Francisco, CA) in accordance with the specifications laid out by the National Institutes of Health (NIH) Human Microbiome Project [25]. Following a bowel movement, a sterile swab was used to transfer a small amount of fecal matter into a vial containing a lysis and stabilization buffer that preserves the genetic material for transport at ambient temperatures. Samples were sent to Ubiome laboratories (Ubiome, San Francisco, CA) (5) and lysed using bead-beating prior to DNA extraction in a class 1000 clean room using a guanidine thiocyanate silica column-based purification method via a liquid-handling robot. PCR amplification of the 16S rRNA genes was performed with primers containing universal primers amplifying the V4 region (515F: GTGCCAGCMGCCGCGGTAA and 806R: GGACTACHVGGGTWTCTAAT) (7). In addition, the primers contained Illumina tags and barcodes. Samples were barcoded with a unique combination of forward and reverse indexes allowing for simultaneous processing of multiple samples. PCR products were pooled, column-purified, and sized selected through microfluidic DNA fractionation (24). Consolidated libraries were quantified by quantitative real-time PCR using the Kapa iCycler qPCR kit (Bio-Rad, Hercules, CA) on a BioRad Myio before loading into the sequencer. Sequencing was performed in a pair-end modality on a NextSeq 500 platform (Illumina, Sand Diego, CA) rendering 2 × 150 bp pair-end sequences. These DNA sequencing techniques were then used to generate data outputs (.csv file) that provided a comprehensive bacterial taxonomic profile.
Statistical Analyses
Bacterial taxa of interest were systematically identified as those with a ubiquity of ≥ 75% (i.e., observed in at least 21 of 28 subjects) and a mean relative abundance of ≥ 2% in their respective taxonomic levels. These ubiquity-abundance cutoffs are comparable to previous work in the field enumerating core taxonomic members within various body habitats [26]. Alpha diversity, computed as Shannon’s Diversity Index was calculated as previously described [27] and Firmicutes to Bacteroidetes (F/B) ratio was computed. Normality of microbiome and PSQI data were examined using boxplots and Shapiro-Wilks tests. Participant characteristics between normal (PSQI score ≤ 5) and poor (PSQI score > 5) sleepers [24] were compared using independent t-tests. Then, relationships between age, body mass index, and gender with microbiome data were explored. Relationships between alpha diversity, F/B ratio, and relative abundance of bacterial taxa with the global PSQI score were determined using Pearson correlation coefficients for normally distributed data and Spearman’s correlation coefficients for non-normally distributed data. All statistical tests were conducted as nondirectional with α=0.05. Analyses were performed using SPSS statistical package (version 25, SPPS Inc., IBM Company, Armonk, NY).
RESULTS
Participant Characteristics
The mean age of the 28 participants (11 females/17 males) was 29.8 ± 10.4 years and the average body mass was 76.4 ± 12.8 kg. Body mass index (24.7 ± 3.0 kg/m2) was relatively homogenous among participants, with two participants characterized as obese (BMI ≥ 30 kg/m2) and one as underweight (BMI < 18.5 kg/m2). The average PSQI score was 4.6 ± 2.8, which is characteristic of “normal” sleep quality. Characteristics of normal (PSQI score ≤ 5; n = 19) and poor (PSQI score > 5; n = 9) sleepers are compared in Table 1. There were no significant differences between the groups for age (P=0.476), body mass (P=0.659), or body mass index (P=0.673). The proportion of males (66.7%) in the poor sleeper group was statistically equivalent (P=0.576) to the proportion in the normal sleeper group (57.9%). As expected, the composite PSQI score was significantly higher in self-reported poor sleepers (P<0.001).
Table 1.
Characteristics of normal and poor sleepers.
| Normal Sleepers | Poor Sleepers | |
|---|---|---|
| n = 8 females/11 males | n = 3 females/6 males | |
| Age (yrs) | 30.3 ± 10.8 | 28.8 ± 10.0 |
| Body mass (kg) | 75.2 ± 13.2 | 78.9 ± 12.2 |
| BMI (kg/m2) | 24.3 ± 3.0 | 25.5 ± 3.0 |
| PSQI Score | 3.0 ± 1.4* | 8.0 ± 1.7 |
BMI = body mass index; PSQI Score = Pittsburgh Sleep Quality Index Score. Normal sleepers = PSQI score between 0–5; Poor sleepers = PSQI score > 5.
P<0.05 vs. Poor Sleepers.
Relationships Between Sleep Quality With Gut Microbiome Variables
Descriptive statistics for bacterial taxa that met the inclusion criteria at each taxonomic level are listed in Table 2. Four of the taxa, Proteobacteria (phylum), Negativicutes (class), Prevotella (genus), and Ruminococcus (genus), exhibited non-normal distributions. There were no significant relationships between age (r= −0.368 to 0.070; P=0.054 to 0.723), body mass index (r=−0.265 to 0.244; P=0.172 to 0.211), and gender (r=−0.229 to 0.302; P= 0.305 to 0.184) with diversity, F/B ratio, or relative abundance of taxa meeting the inclusion criteria. Both diversity (r=−0.497, P=0.007) and F/B ratio (r=−0.466, P=0.013) were inversely related with the global PSQI scores (Figure 1). Results of the correlational analyses (Table 2) between bacterial relative abundance with the global PSQI scores yielded ten significant relationships (P<0.05). Unique for Prevotella, although the mean relative abundance met the inclusion criteria, 44.4% (n=12) demonstrated a relative abundance < 0.4%. In subjects (n=16) with a Prevotella relative abundance ≥ 2%, the relative abundance of Prevotella explained 25.6% of the variance in global PSQI scores (r=0.530, P=0.042).
Table 2.
Bivariate correlations of select bacterial taxa with the Pittsburgh Sleep Quality Index score.
| Bacterial Taxa | Relative Abundance (%) | r | P-value |
|---|---|---|---|
| Phylum | |||
| Firmicutes | 38.0 ± 10.3 | −0.229 | 0.242 |
| Bacteroidetes* | 34.6 ± 11.8 | 0.553 | 0.002 |
| Proteobacteria | 2.8 ± 1.8 | −0.265† | 0.172 |
| Class | |||
| Clostridia* | 32.0 ± 9.9 | −0.491 | 0.008 |
| Bacteroidia* | 34.6 ± 11.8 | 0.553 | 0.002 |
| Negativicutes* | 2.2 ± 1.5 | 0.474† | 0.011 |
| Order | |||
| Clostridiales* | 32.0 ± 9.9 | −0.491 | 0.008 |
| Bacteroidales* | 34.6 ± 11.8 | 0.553 | 0.002 |
| Family | |||
| Bacteroidaceae | 13.9 ± 9.3 | −0.276 | 0.155 |
| Lachnospiraceae* | 9.6 ± 4.2 | −0.528 | 0.004 |
| Ruminococcaceae | 12.2 ± 5.5 | −0.329 | 0.088 |
| Genus | |||
| Blautia* | 2.2 ± 1.1 | −0.566 | 0.002 |
| Prevotella* | 16.0 ± 19.1 | 0.390† | 0.044 |
| Faecalibacterium | 8.7 ± 4.2 | −0.185 | 0.346 |
| Bacteroides | 13.9 ± 9.3 | −0.275 | 0.156 |
| Ruminococcus* | 2.3 ± 2.6 | −0.394† | 0.038 |
P<0.05;
Spearman Coefficient
Figure 1.
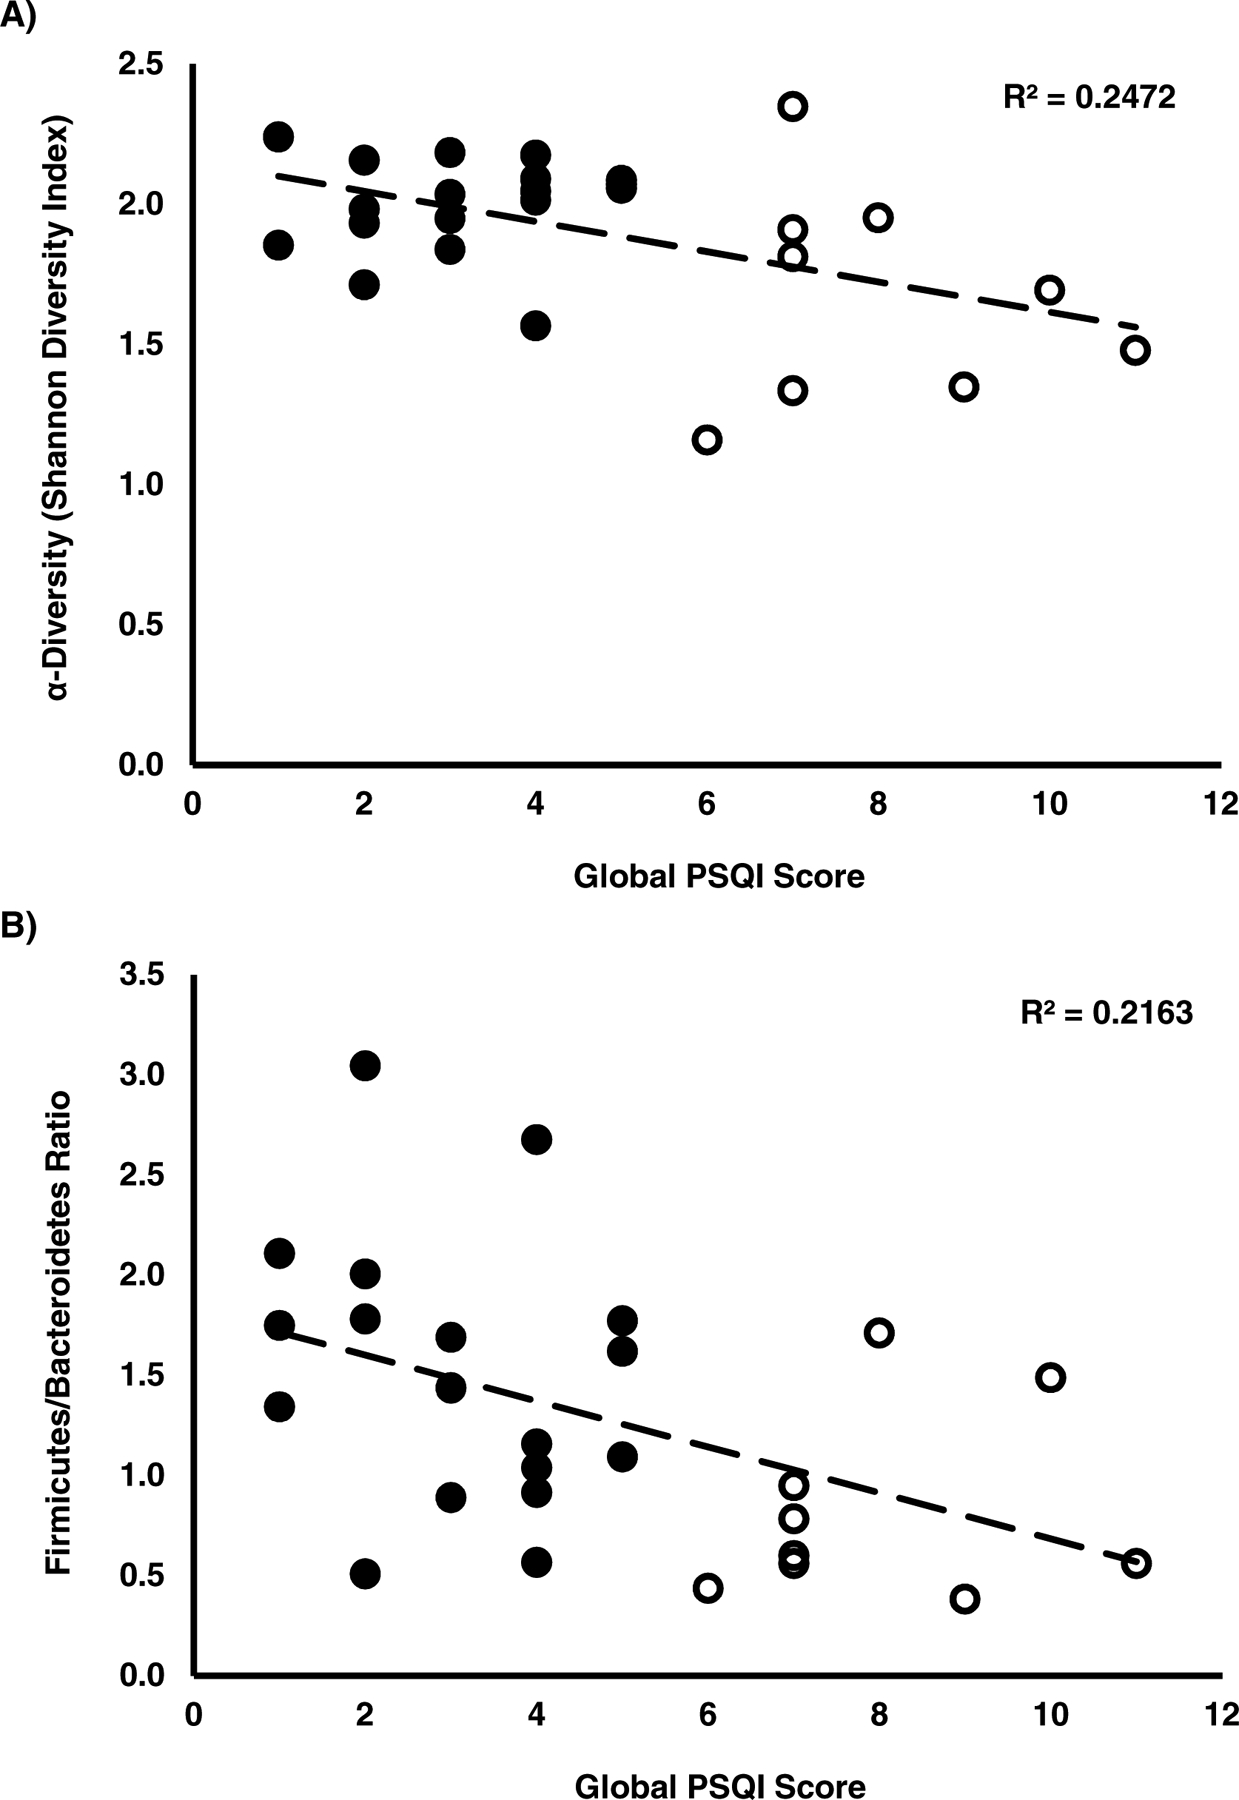
Scatterplots showing associations of the global Pittsburgh Sleep Quality Index (PSQI) score with A) Alpha diversity (Shannon’s Diversity Index) and B) Firmicutes/Bacteroidetes ratio. Black dots represent “normal” sleepers, characterized by a global PSQI score between 0–5, whereas white dots represent “poor” sleepers with a PSQI score > 5 [24]. Trendlines consider all data points.
DISCUSSION
Recent studies have emphasized the significance of the microbiota-gut-brain axis in the development and maintenance of brain function [4]. We conducted the first examination of relationships between gut microbiome composition and self-reported sleep habits in young, healthy individuals. Consistent with our hypothesis, sleep quality was positively associated with microbial diversity, a finding that compliments recent observations of an association between microbiome diversity with actigraphy-measured sleep physiology (e.g., duration and efficiency) [22]. We also observed a positive relationship between sleep quality and F/B ratio. Conversely, Benedict et al. witnessed an increase in the F/B ratio following two-nights of partial sleep deprivation [20]. As the PSQI queries sleep habits over the past month, these contrasting findings may be explained by the duration (i.e., 2-day vs. 1-month) of sleep-induced microbial reconfiguration. Also, in line with our hypothesis, the relative abundances of butyrate-producing genera Blautia and Ruminococcus [28, 29] were positively associated with sleep quality. These findings add to an accumulating body of evidence in animals [12–14, 17] and humans [20, 21, 23], alluding to a link between the gut microbiome, and its metabolites (e.g., butyrate), with sleep physiology.
A healthy microbiome is generally thought to exhibit robust species richness, a characteristic theorized to confer disease protection [30]. Indeed, low species diversity is a hallmark feature of gut microbiota dysbiosis [31], which is implicated in a wide variety of clinical manifestations including metabolic syndrome [32] and cognitive decline [33]. In this context, reduced microbial diversity among poor sleepers in our study, and others [22], provides impetus for the future evaluation of sleep therapies as a means of beneficially modulating gut bacterial contents to improve health. Meanwhile, manipulation of the gut microbiome may also help to improve sleep quality, as was recently observed in an elegant study by Szentirmai and colleagues who observed a 50% increase in non-rapid-eye movement sleep in mice following oral gavage with the butyrate pro-drug, tributyrin [18]. Likewise, we observed a positive association between sleep quality with butyragenic genera, Blautia and Ruminococcus. Belonging to the Firmicutes phylum, both Blautia and Ruminococcus are anaerobic, gram-positive microbes involved in short-chain fatty acid production via microbial fermentation. In cirrhotic patients, Blautia is associated with good cognition and decreased inflammation [34]. Moreover, clinical patients with greater Blautia abundance exhibit reduced death from acute graft-versus host disease [35], possibly due to butyrate-mediated transcriptional inhibition of cytokines and inflammatory proteins [36]. Meanwhile, reduced Ruminococcus genera in patients with Crohn’s disease is associated with elevated levels of inflammatory indicator C-reactive protein [29]. Interpreted together, these findings allude to both a somnogenic and anti-inflammatory role for Blautia and Ruminoccocus, both of which may be arbitrated by butyrate production (Figure 2).
Figure 2.
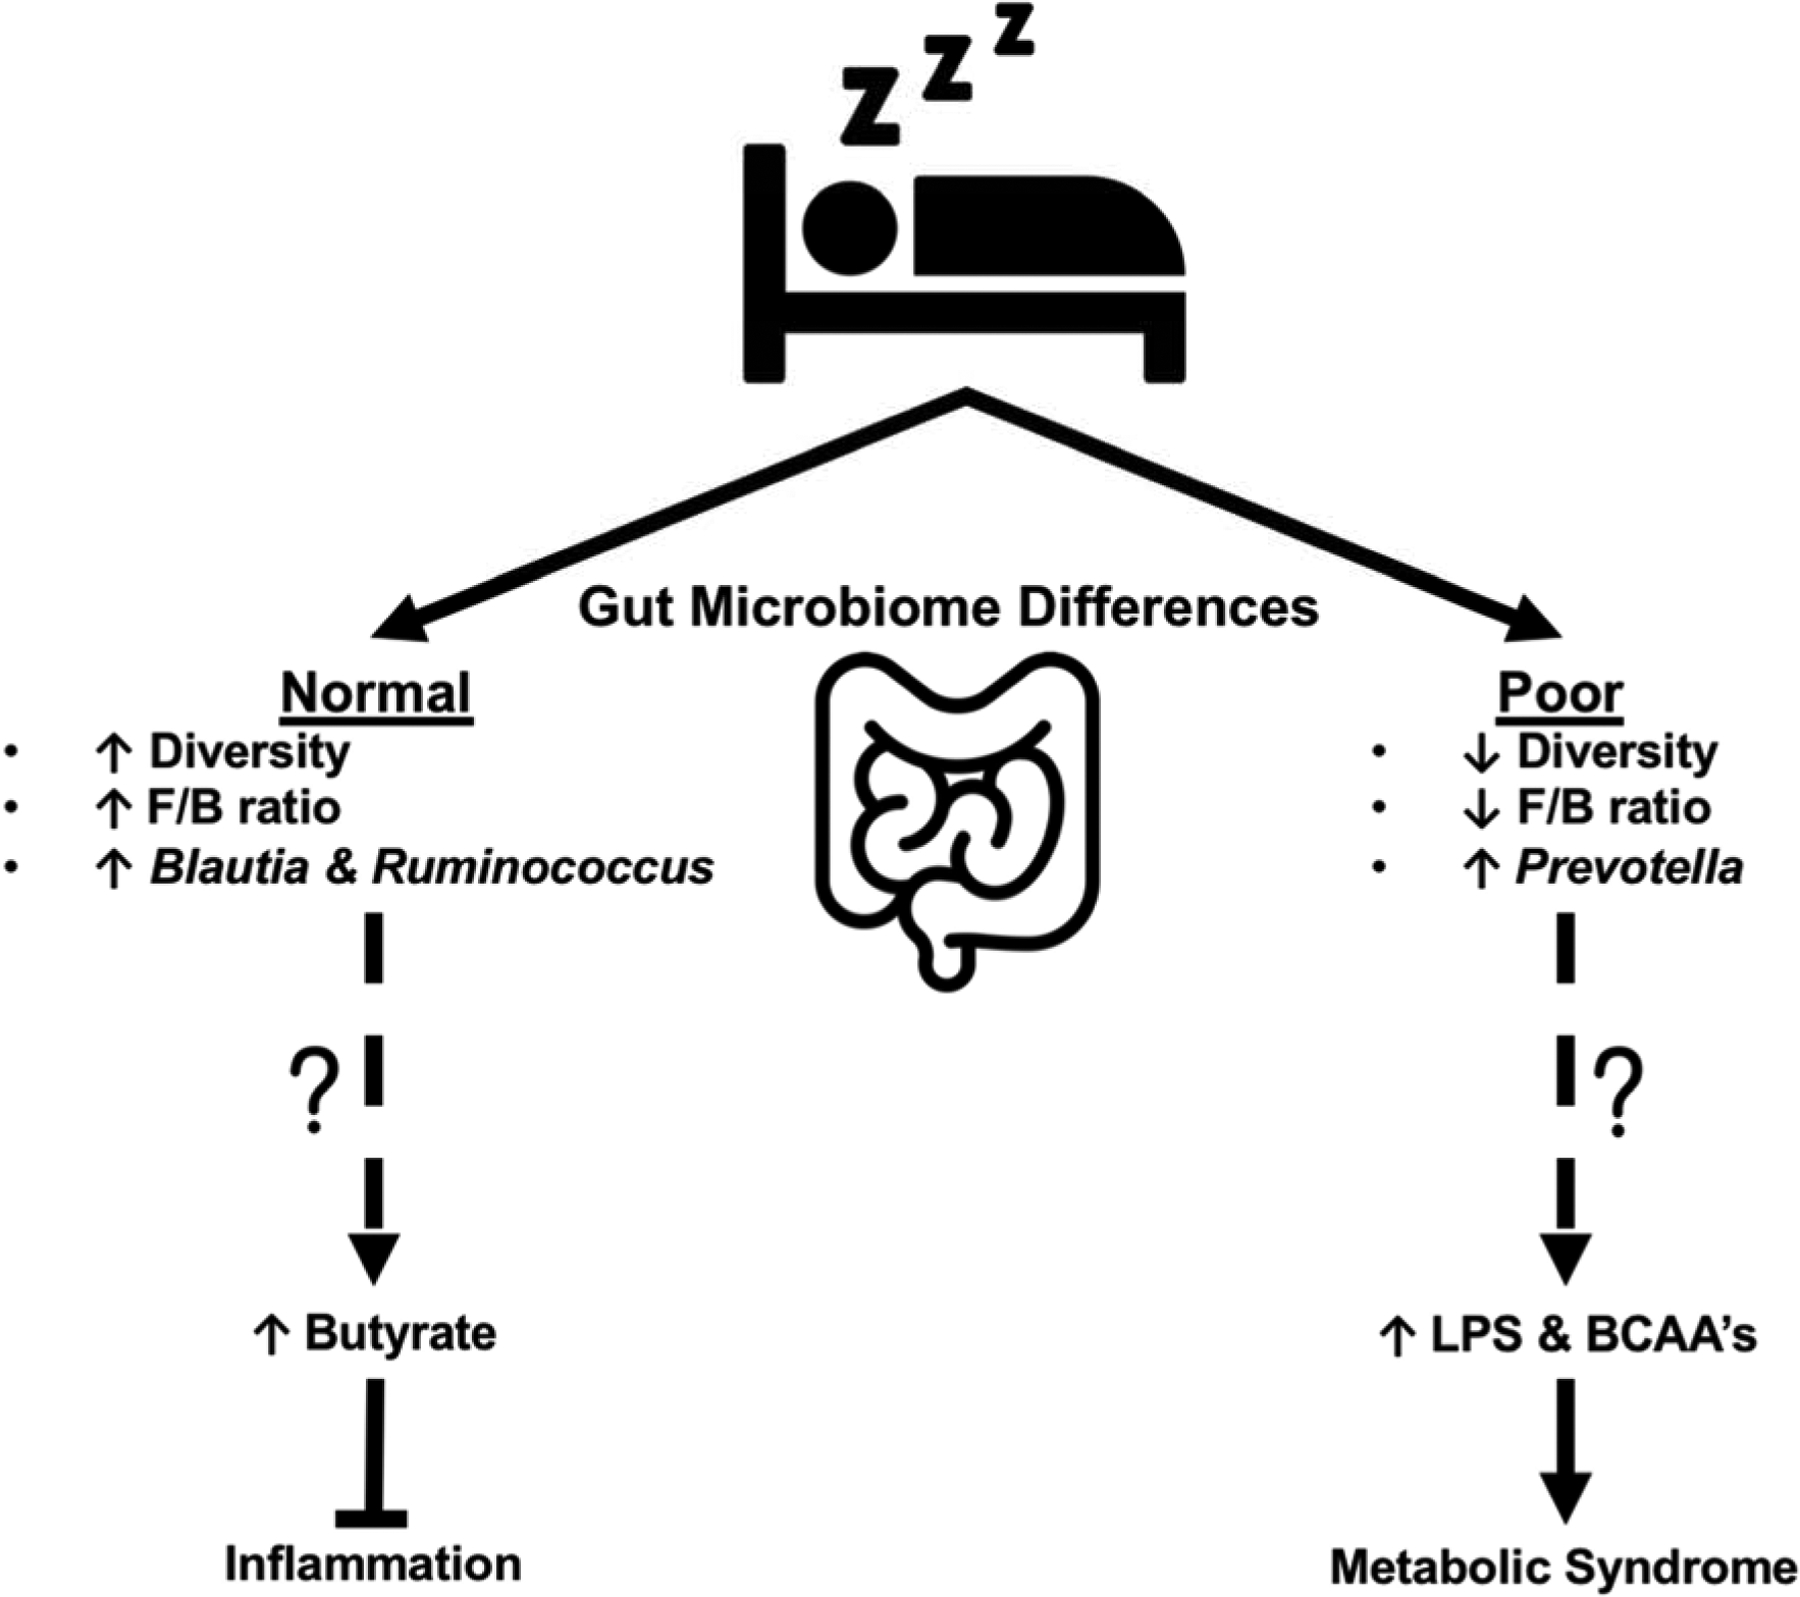
Theoretical model illustrating the possible down-stream implications of gut microbiome differences observed in normal (PSQI 0–5) vs. poor (PSQI > 5) self-reported sleepers [24]. Compared to poor sleepers, the gut microbiome of normal sleeping individuals exhibited greater microbial diversity and an elevated F/B ratio. At the genus level, normal sleepers possessed a greater relative abundance of the butyragenic genera Blautia and Ruminococcus, which may aid in the attenuation of inflammation. Meanwhile, the gut microbiome of poor sleepers was characterized by a greater relative abundance of the genus Prevotella, which has been implicated in endotoxemia (i.e., increased circulating lipopolysaccharide [LPS]), branch chain amino acid (BCAA) production, and metabolic dysfunction.
While sleep quality was positively associated with a likely beneficial greater relative abundance of Blautia and Ruminococcus genera, both acute [20] and chronic [17] sleep disruption are shown to adversely modify gut bacterial composition in a manner that promotes insulin resistance and systemic inflammation. The greater relative abundance of the genus Prevotella in our self-reported poor sleepers may contribute to this metabolic phenotype (Figure 2). Prevotella species are an anaerobic, gram-negative bacteria of the Bacteroidetes phylum that comprise the majority genus in the respiratory system, and thus are generally considered commensal with the human organism [37]. However, in persons with HIV infection, intestinal dysbiosis characterized by increased Prevotella abundance is associated with bacterial translocation and endotoxemia resulting in a state of chronic low-grade inflammation [38, 39]. Furthermore, increased abundance of Prevotella is associated with insulin resistance [40] and obesity [41] in human subjects, which may be a result of Prevotella-mediated biosynthesis of branch chain amino acids [42, 43]. It is worthy to note that like Blautia and Ruminococcus, Prevotella abundance is associated with short-chain fatty acids and succinate concentrations in human subjects [44]. Interestingly, succinic semialdehyde dehydrogenase deficiency (i.e., the enzyme responsible for the conversion of GABA to succinic acid) is associated with cognitive impairment and sleep disturbances [45]. These findings further allude to the formative role that our gut microbes and their metabolites may play in mediating sleep quality, and leave open the possibility that the increased abundance of succinate-producing Prevotella species in poor sleepers may be a compensatory mechanism to restore sleep health.
Recently, associations between gut bacterial taxa and actigraphy-derived sleep measures in healthy individuals have been observed [22]. We utilized the PSQI, which is the gold standard for subjective sleep assessment [24], to interrogate relationships between the gut microbiome with a holistic sleep metric that encompasses many important sleep attributes (e.g., duration, efficiency, disturbance). Relevantly, the PSQI exhibits high internal homogeneity, internal consistency, and test-retest reliability but correlates poorly with objective, actigraphy-derived sleep measures [46]. This may at least partially be explained by the PQSI reflecting inter-individual differences in biologic sleep need through evaluation of cognitive perception [47]. In healthy older adults, Anderson and colleagues observed associations between the PSQI score, gut microbiome composition (Verrucomicrobia and Lentisphaerae phyla), and cognitive flexibility, leading to the supposition that age-related gut dysbiosis may serve as a mechanistic link between inadequate sleep with poor neurocognitive outcomes [21]. Cross-sectional associations between sleep quality and gut microbiome composition observed in the present study, and elsewhere [21, 22], are deserving of confirmation in a larger and more heterogeneous sample. Moreover, future longitudinal observational analyses and/or interventional studies to evaluate the clinical meaningfulness of purported relationships between the gut microbiome with both subjective (e.g., PSQI and/or sleep diaries) and objective sleep measures (e.g., actigraphy and/or polysomnography) in both healthy individuals and in clinical populations are warranted.
In summary, our data are the first to show associations between self-reported sleep habits with gut microbiome composition in young, healthy individuals, the theoretical implications of which are discussed above and summarized in Figure 2. Limitations of our study include its observational nature, a relatively modest sample size and lack of pre-screening psychological assessment, and a failure to characterize many other important sleep attributes (e.g., sleep rhythms, circadian preference, etc.). Nonetheless, the observed greater microbial diversity in participants reporting superior sleep quality is in line with recent objectively measured (i.e., actigraphy) sleep quality findings [22]. We also demonstrated a positive association between sleep quality and F/B ratio, largely owing to a greater relative abundance of Blautia and Ruminococcus (Firmicutes) and lower proportions of Prevotella (Bacteroidetes) in individuals reporting better sleep quality. Whether these emerging gut microbiome-sleep profiles are a cause or a product of sleep habits cannot be deduced by our cross-sectional analyses, but is worthy of future inquiry.
Supplementary Material
HIGHLIGHTS.
Self-reported sleep quality was related to gut microbiome composition in young healthy individuals
Good self-reported sleep quality was positively associated with microbial diversity, Firmicutes to Bacteroidetes ratio, and butyrate-producing genera (Blautia and Ruminococcus)
Poor self-reported sleep quality was positively associated with the genus Prevotella
Acknowledgements
The authors would like to thank Sean Langan and Jadeon Carreker for their assistance with data collection. The authors would like to thank Compound Solutions, Inc. for their generous donation (to Grosicki GJ) that made this study possible.
Funding
This work was supported by National Institute on Aging (K01AG050700) and Boston Claude D. Pepper Older Americans Independence Center (5P30AG031679) grants to MSL, and a USDA grant (58-1950-4-003) to the NEPS laboratory at the Tufts HNRCA.
Footnotes
Publisher's Disclaimer: This is a PDF file of an unedited manuscript that has been accepted for publication. As a service to our customers we are providing this early version of the manuscript. The manuscript will undergo copyediting, typesetting, and review of the resulting proof before it is published in its final form. Please note that during the production process errors may be discovered which could affect the content, and all legal disclaimers that apply to the journal pertain.
Conflict of Interest
None declared
REFERENCES
- [1].Grosicki GJ, Fielding RA, Lustgarten MS. Gut Microbiota Contribute to Age-Related Changes in Skeletal Muscle Size, Composition, and Function: Biological Basis for a Gut-Muscle Axis. Calcif Tissue Int. 2018;102:433–42. [DOI] [PMC free article] [PubMed] [Google Scholar]
- [2].Tripathi A, Debelius J, Brenner DA, Karin M, Loomba R, Schnabl B, et al. The gut-liver axis and the intersection with the microbiome. Nat Rev Gastroenterol Hepatol. 2018;15:397–411. [DOI] [PMC free article] [PubMed] [Google Scholar]
- [3].Quach D, Britton RA. Gut microbiota and bone health. Adv Exp Med Biol. 2017;1033:47–58. [DOI] [PubMed] [Google Scholar]
- [4].Cryan JF, O’Riordan KJ, Cowan CSM, Sandhu KV, Bastiaanssen TFS, Boehme M, et al. The Microbiota-Gut-Brain Axis. Physiological reviews. 2019;99:1877–2013. [DOI] [PubMed] [Google Scholar]
- [5].Carabotti M, Scirocco A, Maselli MA, Severi C. The gut-brain axis: interactions between enteric microbiota, central and enteric nervous systems. Annals of gastroenterology. 2015;28:203–9. [PMC free article] [PubMed] [Google Scholar]
- [6].Gomez A, Sharma AK, Mallott EK, Petrzelkova KJ, Jost Robinson CA, Yeoman CJ, et al. Plasticity in the human gut microbiome defies evolutionary constraints. mSphere. 2019;4:e00271–19. [DOI] [PMC free article] [PubMed] [Google Scholar]
- [7].Borre YE, Moloney RD, Clarke G, Dinan TG, Cryan JF. The impact of microbiota on brain and behavior: mechanisms & therapeutic potential. Adv Exp Med Biol. 2014;817:373–403. [DOI] [PubMed] [Google Scholar]
- [8].Pulikkan J, Mazumder A, Grace T. Role of the gut microbiome in autism spectrum disorders. Adv Exp Med Biol. 2019;1118:253–69. [DOI] [PubMed] [Google Scholar]
- [9].Jiang C, Li G, Huang P, Liu Z, Zhao B. The gut microbiota and Alzheimer’s disease. J Alzheimers Dis. 2017;58:1–15. [DOI] [PubMed] [Google Scholar]
- [10].Bedarf JR, Hildebrand F, Goeser F, Bork P, Wullner U. The gut microbiome in Parkinson’s disease. Der Nervenarzt. 2019;90:160–6. [DOI] [PubMed] [Google Scholar]
- [11].Xie L, Kang H, Xu Q, Chen MJ, Liao Y, Thiyagarajan M, et al. Sleep drives metabolite clearance from the adult brain. Science. 2013;342:373–7. [DOI] [PMC free article] [PubMed] [Google Scholar]
- [12].Liang X, Bushman FD, FitzGerald GA. Rhythmicity of the intestinal microbiota is regulated by gender and the host circadian clock. Proc Natl Acad Sci U S A. 2015;112:10479–84. [DOI] [PMC free article] [PubMed] [Google Scholar]
- [13].Zarrinpar A, Chaix A, Yooseph S, Panda S. Diet and feeding pattern affect the diurnal dynamics of the gut microbiome. Cell Metab. 2014;20:1006–17. [DOI] [PMC free article] [PubMed] [Google Scholar]
- [14].Thaiss CA, Zeevi D, Levy M, Zilberman-Schapira G, Suez J, Tengeler AC, et al. Transkingdom control of microbiota diurnal oscillations promotes metabolic homeostasis. Cell. 2014;159:514–29. [DOI] [PubMed] [Google Scholar]
- [15].Leone V, Gibbons SM, Martinez K, Hutchison AL, Huang EY, Cham CM, et al. Effects of diurnal variation of gut microbes and high-fat feeding on host circadian clock function and metabolism. Cell Host Microbe. 2015;17:681–9. [DOI] [PMC free article] [PubMed] [Google Scholar]
- [16].Vital M, Howe AC, Tiedje JM. Revealing the bacterial butyrate synthesis pathways by analyzing (meta)genomic data. mBio. 2014;5. [DOI] [PMC free article] [PubMed] [Google Scholar]
- [17].Poroyko VA, Carreras A, Khalyfa A, Khalyfa AA, Leone V, Peris E, et al. Chronic sleep disruption alters gut microbiota, induces systemic and adipose tissue inflammation and insulin resistance in mice. Sci Rep. 2016;6:35405. [DOI] [PMC free article] [PubMed] [Google Scholar]
- [18].Szentirmai É, Millican NS, Massie AR, Kapás L. Butyrate, a metabolite of intestinal bacteria, enhances sleep. Sci Rep. 2019;9:7035. [DOI] [PMC free article] [PubMed] [Google Scholar]
- [19].Ko CY, Liu QQ, Su HZ, Zhang HP, Fan JM, Yang JH, et al. Gut microbiota in obstructive sleep apnea-hypopnea syndrome: disease-related dysbiosis and metabolic comorbidities. Clin Sci (Lond). 2019;133:905–17. [DOI] [PMC free article] [PubMed] [Google Scholar]
- [20].Benedict C, Vogel H, Jonas W, Woting A, Blaut M, Schurmann A, et al. Gut microbiota and glucometabolic alterations in response to recurrent partial sleep deprivation in normal-weight young individuals. Mol Metab. 2016;5:1175–86. [DOI] [PMC free article] [PubMed] [Google Scholar]
- [21].Anderson JR, Carroll I, Azcarate-Peril MA, Rochette AD, Heinberg LJ, Peat C, et al. A preliminary examination of gut microbiota, sleep, and cognitive flexibility in healthy older adults. Sleep Med. 2017;38:104–7. [DOI] [PMC free article] [PubMed] [Google Scholar]
- [22].Smith RP, Easson C, Lyle SM, Kapoor R, Donnelly CP, Davidson EJ, et al. Gut microbiome diversity is associated with sleep physiology in humans. PLoS One. 2019;14:e0222394. [DOI] [PMC free article] [PubMed] [Google Scholar]
- [23].Zhang SL, Bai L, Goel N, Bailey A, Jang CJ, Bushman FD, et al. Human and rat gut microbiome composition is maintained following sleep restriction. Proc Natl Acad Sci U S A. 2017;114:E1564–E71. [DOI] [PMC free article] [PubMed] [Google Scholar]
- [24].Buysse DJ, Reynolds CF 3rd, Monk TH, Berman SR, Kupfer DJ. The Pittsburgh Sleep Quality Index: a new instrument for psychiatric practice and research. Psychiatry research. 1989;28:193–213. [DOI] [PubMed] [Google Scholar]
- [25].McInnes P. Manual of Procedures for Human Microbiome Project: Core Sampling Protocol A (HMP Protocol #07–001) In: Health NIo, editor.2010. [Google Scholar]
- [26].Li K, Bihan M, Methé BA. Analyses of the stability and core taxonomic memberships of the human microbiome. PLoS One. 2013;8:e63139. [DOI] [PMC free article] [PubMed] [Google Scholar]
- [27].McCoy CO, Matsen FAt. Abundance-weighted phylogenetic diversity measures distinguish microbial community states and are robust to sampling depth. PeerJ. 2013;1:e157. [DOI] [PMC free article] [PubMed] [Google Scholar]
- [28].Anand S, Kaur H, Mande SS. Comparative In silico Analysis of Butyrate Production Pathways in Gut Commensals and Pathogens. Frontiers in microbiology. 2016;7:1945. [DOI] [PMC free article] [PubMed] [Google Scholar]
- [29].Takahashi K, Nishida A, Fujimoto T, Fujii M, Shioya M, Imaeda H, et al. Reduced Abundance of Butyrate-Producing Bacteria Species in the Fecal Microbial Community in Crohn’s Disease. Digestion. 2016;93:59–65. [DOI] [PubMed] [Google Scholar]
- [30].Le Chatelier E, Nielsen T, Qin J, Prifti E, Hildebrand F, Falony G, et al. Richness of human gut microbiome correlates with metabolic markers. Nature. 2013;500:541–6. [DOI] [PubMed] [Google Scholar]
- [31].Kriss M, Hazleton KZ, Nusbacher NM, Martin CG, Lozupone CA. Low diversity gut microbiota dysbiosis: drivers, functional implications and recovery. Curr Opin Microbiol. 2018;44:34–40. [DOI] [PMC free article] [PubMed] [Google Scholar]
- [32].Festi D, Schiumerini R, Eusebi LH, Marasco G, Taddia M, Colecchia A. Gut microbiota and metabolic syndrome. World J Gastroenterol. 2014;20:16079–94. [DOI] [PMC free article] [PubMed] [Google Scholar]
- [33].Fernandez-Real J-M, Serino M, Blasco G, Puig J, Daunis-i-Estadella J, Ricart W, et al. Gut microbiota interacts with brain microstructure and function. J Clin Endocrinol Metab. 2015;100:4505–13. [DOI] [PubMed] [Google Scholar]
- [34].Bajaj JS, Hylemon PB, Ridlon JM, Heuman DM, Daita K, White MB, et al. Colonic mucosal microbiome differs from stool microbiome in cirrhosis and hepatic encephalopathy and is linked to cognition and inflammation. Am J Physiol Gastrointest Liver Physiol. 2012;303:G675–85. [DOI] [PMC free article] [PubMed] [Google Scholar]
- [35].Jenq RR, Taur Y, Devlin SM, Ponce DM, Goldberg JD, Ahr KF, et al. Intestinal blautia is associated with reduced death from graft-versus-host disease. Biol Blood Marrow Transplant. 2015;21:1373–83. [DOI] [PMC free article] [PubMed] [Google Scholar]
- [36].Canani RB, Costanzo MD, Leone L, Pedata M, Meli R, Calignano A. Potential beneficial effects of butyrate in intestinal and extraintestinal diseases. World journal of gastroenterology. 2011;17:1519–28. [DOI] [PMC free article] [PubMed] [Google Scholar]
- [37].Larsen JM. The immune response to Prevotella bacteria in chronic inflammatory disease. Immunology. 2017;151:363–74. [DOI] [PMC free article] [PubMed] [Google Scholar]
- [38].Vazquez-Castellanos JF, Serrano-Villar S, Latorre A, Artacho A, Ferrus ML, Madrid N, et al. Altered metabolism of gut microbiota contributes to chronic immune activation in HIV-infected individuals. Mucosal Immunol. 2015;8:760–72. [DOI] [PubMed] [Google Scholar]
- [39].Armstrong AJS, Shaffer M, Nusbacher NM, Griesmer C, Fiorillo S, Schneider JM, et al. An exploration of Prevotella-rich microbiomes in HIV and men who have sex with men. Microbiome. 2018;6:198. [DOI] [PMC free article] [PubMed] [Google Scholar]
- [40].Larsen N, Vogensen FK, van den Berg FW, Nielsen DS, Andreasen AS, Pedersen BK, et al. Gut microbiota in human adults with type 2 diabetes differs from non-diabetic adults. PLoS One. 2010;5:e9085. [DOI] [PMC free article] [PubMed] [Google Scholar]
- [41].Hu HJ, Park SG, Jang HB, Choi MK, Park KH, Kang JH, et al. Obesity alters the microbial community profile in Korean adolescents. PLoS One. 2015;10:e0134333. [DOI] [PMC free article] [PubMed] [Google Scholar]
- [42].Pedersen HK, Gudmundsdottir V, Nielsen HB, Hyotylainen T, Nielsen T, Jensen BAH, et al. Human gut microbes impact host serum metabolome and insulin sensitivity. Nature. 2016;535:376. [DOI] [PubMed] [Google Scholar]
- [43].Liu Y, Wang Y, Yueqiong N, Cheung C, Lam K, Wang Y, et al. Gut microbiome fermentation determines the efficacy of exercise for diabetes prevention. Cell Metab. 2019. [DOI] [PubMed] [Google Scholar]
- [44].Benítez-Páez A, Kjølbæk L, Gómez Del Pulgar EM, Brahe LK, Astrup A, Matysik S, et al. A multi-omics approach to unraveling the microbiome-mediated effects of arabinoxylan oligosaccharides in overweight humans. mSystems. 2019;4. [DOI] [PMC free article] [PubMed] [Google Scholar]
- [45].Pearl PL, Wiwattanadittakul N, Roullet JB, Gibson KM. Succinic Semialdehyde Dehydrogenase Deficiency In: Adam MP, Ardinger HH, Pagon RA, Wallace SE, Bean LJH, Stephens K, et al. , editors. GeneReviews((R)). Seattle (WA)1993. [PubMed] [Google Scholar]
- [46].Grandner MA, Kripke DF, Yoon IY, Youngstedt SD. Criterion validity of the Pittsburgh Sleep Quality Index: Investigation in a non-clinical sample. Sleep Biol Rhythms. 2006;4:129–39. [DOI] [PMC free article] [PubMed] [Google Scholar]
- [47].Watson NF, Badr MS, Belenky G, Bliwise DL, Buxton OM, Buysse D, et al. Recommended amount of sleep for a healthy adult: A joint consensus statement of the American Academy of Sleep Medicine and Sleep Research Society. Sleep. 2015;38:843–4. [DOI] [PMC free article] [PubMed] [Google Scholar]
Associated Data
This section collects any data citations, data availability statements, or supplementary materials included in this article.