

Abstract
Objective:
Intracortical microelectrode implants can generate a tissue response hallmarked by glial scarring and neuron cell death within 100–150 μm of the biomaterial device. Many have proposed that any performance decline in intracortical microstimulation (ICMS) due to this foreign body tissue response could be offset by increasing the stimulation amplitude. The mechanisms of this approach are unclear, however, as there has not been consensus on how increasing amplitude affects the spatial and temporal recruitment patterns of ICMS.
Approach:
We clarify these unknowns using in vivo two-photon imaging of mice transgenically expressing the calcium sensor GCaMP6s in Thy1 neurons or virally expressing the glutamate sensor iGluSnFr in neurons. Calcium and neurotransmitter activity are tracked in the neuronal somas and neuropil during long-train stimulation in Layer II/III of somatosensory cortex.
Main results:
Neural calcium activity and glutamate release are dense and strongest within 20–40 μm around the electrode, falling off with distance from the electrode. Neuronal calcium increases with higher amplitude stimulations. During prolonged stimulation trains, a sub-population of somas fail to maintain calcium activity. Interestingly, neuropil calcium activity is 3-fold less correlated to somatic calcium activity for cells that drop-out during the long stimulation train compared to cells that sustain activity throughout the train. Glutamate release is apparent only within 20 μm of the electrode and is sustained for at least 10s after cessation of the 15 and 20 μA stimulation train, but not lower amplitudes.
Significance:
These results demonstrate that increasing amplitude can increase the radius and intensity of neural recruitment, but it also alters the temporal response of some neurons. Further, dense glutamate release is highest within the first 20 μm of the electrode site even at high amplitudes, suggesting that there may be spatial limitations to the amplitude parameter space. The glutamate elevation outlasts stimulation, suggesting that high-amplitude stimulation may affect neurotransmitter re-uptake. This ultimately suggests that increasing the amplitude of ICMS device stimulation may fundamentally alter the temporal neural response, which could have implications for using amplitude to improve the ICMS effect or “offset” the effects of glial scarring.
Keywords: Neuromodulation, Calcium imaging, Brain stimulation, Brain-computer interface, GCaMP6, iGluSnFr
1. Introduction
While brain-machine interface technology has been successfully translated to the clinic, a persistent challenge for users is a lack of somatosensory feedback to guide movements [1–4]. These interfaces often require implantation of biomaterials into the brain to detect signals from nearby cells. More recently, intracortical microstimulation (ICMS) through implanted biomaterials has enabled tactile and proprioceptive feedback for brain-machine interfaces in both non-human primate [5,6] and human [7–9] studies. Although there are new stimulation modalities such as optogenetics [10], single photon optogenetics’s spatial selectivity is limited by a large diffusion radius of photon scatter in tissue, genetic manipulation requirement, lack of spatially selective promoters, trade-offs in virus diffusion radius and transduction rates, and poor uniform expression patterns due to issues with multiplicity of inserted genes and position effects from random insertion location caused by promoter enhancers and inhibitors [11]. Though other new stimulation modalities demonstrate potential for driving neural activity with greater spatial resolution [12], the most common feedback modality remains intracortical microstimulation (ICMS), which uses extracellular electrodes to deliver current to neuronal populations within the somatosensory cortex.
Biocompatibility issues that can impact the 50–150 μm micro-environment of passive recording microelectrodes such as glial scarring [13–28], vascular injury [13,16,29–41], metabolic stress [29], and neurodegeneration [13,30,42–44] can also impact ICMS microelectrodes. Particularly, many studies have shown that ICMS implants and subsequent stimulation can generate neural loss and changes to vascularization [45–55]. In non-human primate models, neural loss and single unit recordings with ICMS electrodes are similar in magnitude as passive recording devices [56,57]. The corresponding increase of distance to the nearest excitable neural element due to neurodegeneration is thought to cause an increase in the stimulation threshold [50,58,59]. In turn, this means an increase in stimulation amplitude or charge injection is necessary to achieve similar levels of neural response, which can ultimately damage both the device and the tissue [11,43,59]. This has led to substantial biomaterial research to safely inject greater charge into the tissue without damaging the electrode or the tissue [11,59–75]. The conventional hypothesis is that, up to the stimulation safety limit [68], increasing stimulation amplitude will allow activation of more distant neurons from the electrode. This hypothesis is sometimes interpreted to suggest that the tissue response is only problematic for recording electrodes, since stimulating electrodes can always be “turned up” to offset the tissue response. However, empirical evidence suggests increasing amplitude will not always improve performance. Namely, increasing amplitude can alter the nature of perceived sensations in ICMS in a highly variable way from one electrode to another, instead of simply increasing the perceived intensity of the stimulus [8,76]. The biological correlates of this phenomena are not fully understood nor how this amplitude response is altered by neural loss and glial scarring surrounding the electrode [51,56,77–80]. This work is focused on understanding the biological correlates of the amplitude response prior to the formation of the glial scar with respect to one of the most common intracortical microelectrode biomaterials, silicon and iridium oxide. In order to better inform next-generation ICMS technologies, it is necessary to decouple the biomaterial and biological aspects of the amplitude response of neurostimulation.
There is a long history of research on understanding the biology of the amplitude response of neurostimulation. Early electrophysiology and modeling studies established a current-distance relationship for ICMS, in which increasing the amplitude of stimulation increases the radius of suprathreshold depolarization, recruiting a wider range of neurons [81–85]. More recent modeling studies have shown that this current-distance relationship can accurately predict ICMS discrimination in non-human primates [86]. Slab models that consider distinct recruitment properties of Pyramidal neurons and interneurons suggest that interneuron recruitment is dense around the electrode while Pyramidal cells are more sparsely recruited [87]. The field’s ability to understand the biology of neurostimulation was revolutionized by the development of voltage-sensitive dyes, calcium sensors, and optical intrinsic imaging methods, which all have been used to corroborate the current-distance relationship [88–90]. Using neuronal calcium imaging, Histed et al. showed that ICMS in layer II/III of cortex engages antidromic activation of horizontal fibers within the layer, resulting in sparse, distributed activation of neurons that does not rely upon synaptic transmission [76]. This result stands in contrast to other in vivo imaging studies that show that ICMS results in activation densely localized around the stimulation source, and recruits abundant orthodromic, trans-synaptic activity [88,91,92]. Resolving these conflicting reports is essential to understanding the localization of clinical ICMS.
The temporal extent of ICMS has also been explored. Studies using in vivo electrophysiology [93], optical intrinsic imaging [94], and voltage and calcium imaging [88,89,95,96] suggest that pulses of ICMS result in initial excitation of local neural populations followed by a brief period of loss of neural activity. For trains of pulses, neurons close to the electrode can follow the train at high (≤500 Hz) and low (≤10 Hz) frequency stimulation, while distant neurons can fail to follow the train [88,93,95,96]. This is possibly due to conduction failure [92,97], inhibitory interneuron inputs [88,89], virtual anode formation [95], or potassium build-up [98]. Recent modeling efforts of antidromic activation in Deep Brain Stimulation suggest failure at high frequencies is driven by hyperpolarizing afterpotentials in the cell body [99]. Elucidating the mechanisms that determine whether a cell will fail or not could help to guide how train duration and frequency are used to maximized clinical efficacy of ICMS.
The present study therefore seeks to address several contentious aspects of the current ICMS model: 1) spatially, does stimulation amplitude increase recruitment of somas and neuropil density around the electrode, 2) temporally, does increasing stimulation amplitude drive some neurons to fail over long trains of stimulation, and 3) does increasing stimulation amplitude increase the area and distance of recruited neural elements? To answer these questions, we use two-photon microscopy imaging of mice expressing either the calcium sensor GCaMP6s or the glutamate sensor iGluSnFr in neurons to measure the somatic and neuropil response to ICMS. We show that somas, neuropil, and glutamate release exhibit greatest activation within the first 20–40 μm of the electrode with rapid spatial drop off, indicative of a dense activation pattern [81,95]. In contrast, somas more distant to the electrode are less likely to sustain calcium activity during long-train ICMS, however, the probability of sustained calcium activity can be increased with higher amplitude stimulation. During 15–20 μA long-train stimulation, glutamate release at the electrode site is sustained for at least 10s post-stimulation, revealing disruption of glutamate re-up-take. Finally, we correlate neuropil calcium activity to somatic activity of cells that do and do not show activity drop off. The neuropil is 3-fold more correlated with somas that sustain activity, with stronger correlations for higher amplitudes of stimulation. Thus, while increasing the amplitude of stimulation may elevate the spatial extent of neural recruitment, it also modulates the temporal response and glutamate neurotransmission. This suggests that increasing ICMS device amplitude may have unintended effects, which has implications for using amplitude to improve the ICMS effect or to compensate for glial scarring.
2. Materials and methods
2.1. Animals and virus injection
All subjects were mature (> 8 weeks and > 25 g) male mice. Animals were housed in 12 h light/dark cycles with free access to food and water. For experiments measuring neuronal calcium activity, transgenic mice expressing the calcium sensor GCaMP6S under the control of the Thy-1 promoter were used (4 animals; C57BL/6J-Tg (Thy1-GCaMP6s)GP4.3Dkim/J; Jackson Laboratories, Bar Harbor, ME) [100]. For experiments measuring glutamate release, C57BL/6J mice were used (3 animals; Jackson Laboratories). Between 3 and 8 weeks prior to electrode implantation, these mice received intracortical viral injections of the glutamate sensor iGluSnFr with neuronal expression controlled by the hSyn promoter. The vector, pAAV.hSyn.iGluSnFr.WPRE.SV40, was a gift from Loren Looger (Addgene viral prep # 98929-AAV1; http://n2t.net/addgene:98929; RRID:Addgene_98929) [101]. After a unilateral craniotomy under ketamine/xylazine anesthesia (75 mg/kg to 7 mg/kg, respectively), virus was bolus injected into visual, somatosensory, and motor corticies under aseptic conditions as previously described [102]. Virus was injected with a glass micropipette controlled by a pressure injector at < 1 μL per site. The bolus was directed to layer II/III of cortex, which was controlled by a stereotactic manipulator. The craniotomy was sealed with a silicone elastomer (KwikSil, World Precision Instruments) and a coverglass. A metal frame was cemented to the skull to allow awake imaging at later time points in order to confirm the injection locations and map the implantation locations. The animal was allowed to recover and buprenorphine and baytril (5 mg/kg and 10 mg/kg, respectively) were administered for 72 h post-surgery. All experimental protocols were approved by the University of Pittsburgh Division of Laboratory Animal Resources and Institutional Animal Care and Use Committee in accordance with the standards for humane animal care as set by the Animal Welfare Act and the National Institutes of Health Guide for the Care and Use of Laboratory Animals.
2.2. Electrodes and implantation
For all stimulation experiments, acute single-shank 16-channel Michigan style functional silicon probes with 703 μm2 electrode sites were used (A1×16–3mm-100–703; NeuroNexus, Ann Arbor, MI). All iridium sites used for stimulation were activated prior to use based on previously published protocols [103], and all sites showed < 500kOhm 1 kHz impedance. Implantation followed a previously published acute preparation that has been optimized for studying electrode implantation under two-photon microscopy [18,21,25,29,30,95,102,104–106]. Briefly, animals were anesthetized with ketamine/xylazine (75 mg/kg to 7 mg/kg, respectively) and head-fixed in a stereotaxic frame. The animal was maintained with an O2 line and a heating pad. Anesthesia updates were applied approximately every hour with 45 mg/kg keta-mine. The scalp was removed, and a stainless steel bone screw was placed over the motor cortex and used as a ground and counter electrode for all electrical stimulation. Bilateral craniotomies (3–5 mm2) were performed over visual and somatosensory cortices and the dura mater was removed with fine forceps. Electrodes were implanted into a region of somatosensory cortex with limited vascular coverage to avoid bleeding [107]. Implantation was performed at a 30° angle with an oil-hydraulic Microdrive (MO-81, Naishige, Japan) at 200 μm/s to a final depth of 250–300 μm (layer II/III). The surface of the brain was kept hydrated with sterile saline throughout the imaging period.
2.3. Stimulation paradigms
Stimulation was performed with a TDT IZ2 stimulator controlled by an RZ5D system (Tucker-Davis technologies, Alachua, FL). Stimulation waveform was selected to be within the range of effective pulse widths of non-human primate stimulation [6,108], but to also mimic the cathode-leading, triphasic square waveforms used in clinical ICMS [7]. The waveform consisted of a 100 μs cathodic phase, a 50 μs interphase period of zero amplitude, and a 200 μs anodic phase that was half the amplitude of the cathodic phase. All amplitudes are reported as the amplitude of the cathodic phase, and were either 5 μA (0.5 nC/phase), 10 μA (1 nC/phase), 15 μA (1.5 nC/phase), or 20 μA (2 nC/phase). Stimulation was delivered for 30s and there was at least a 1.5 min period between stimulation trials as previously reported [95]. For all stimulations, a stainless steel bone screw that was in contact with motor cortex was used for a ground and counter electrode.
2.4. Mesoscale and two-photon imaging
Mesoscale imaging was performed during stimulation to visualize a3.7 mm × 3.0 mm field of view (the entire craniotomy). This was done with an MVX-10 epifluorescence microscope (Olympus, Tokyo, Japan) and a CCD camera with a 50 ms exposure time (Retiga R1, QI Imaging). All other imaging was performed with a two-photon microscope that provided superior XYZ resolution (Bruker, Madison, WI). The microscope used an OPO laser (Insight DS+; Spectra Physics; Menlo Park, CA) that was tuned to a 920 nm wavelength and kept below 40 mW throughout the study to prevent tissue burning. All imaging was performed with a 16 × 0.8 NA water immersion objective (Nikon Instruments; Melville, NY) with a 3 mm working distance. Resonance scanning mode was used to collect images at 30 Hz in a 407 × 407 μm2 ROI (512 × 512 pixels). Image collection was triggered by the TDT system and included 10s baseline and 20s post-stimulation image collection periods.
2.5. Image analysis and statistics
2.5.1. Stimulation session inclusion
For each analysis, we analyzed 5 biological replicates. Each stimulation session consisted of one stimulation train of 5, 10, 15, and 20 μA. For GCaMP6 analyses, we used 4 animals, with only one animal receiving 2 stimulation sessions. These sessions were carried out using separate stimulation sites and considered independent as previously shown in Histed’s work [76]. For iGluSnFr analyses, we used 3 animals, with 2 animals receiving 2 stimulation sessions. These repeated stimulation sessions were conducted in separate implantation sites and so considered to be independent. For each session, there was minimal axial tissue displacement, and the same cells or landmarks could be identified through stimulation amplitude time series.
2.5.2. GCaMP6 soma quantification
For each session, cells were manually outlined using a 2D projection image of the standard deviation of fluorescence across each stimulation amplitude using ImageJ (NIH) [95]. For each outlined cell, the mean fluorescence activity of the cell over time was extracted. All subsequent analysis was done in Matlab (Mathworks, Boston, MA). Fluorescence was transformed to dF/F0 by using the mean cellular fluorescence during the 10s pre-stimulation time as baseline. All cellular traces were filtered using a low-pass 10th order finite impulse response filter with a cutoff frequency of 2 Hz to remove artifacts. A threshold for a GCaMP calcium activity spike was established for each cell as the mean of the pre-stimulus intensity +2 standard deviations. Cells that showed suprathreshold fluorescence for at least 1 s during the stimulation were counted as responsive. Cells that maintained calcium activity for at least 0.5s during the last 2s of stimulation were considered “Steady State” cells, while all others were considered “Onset” cells. Cells that never achieved a spike during, before, or after any of the stimulation sessions were discounted. The Peak dF/F0 signal was established as the maximum intensity during the first 2 s of stimulation for each amplitude. The use of 2-s as an onset cutoff was selected based as to the dynamics of the GCaMP6s sensor (under the expression pattern of the 4.3 subtype), which can take 1–2s to fully resolve [100]. The Cumulative dF/F0 was established as the summed dF/F0 over the entire stimulation period for each amplitude. The distance of each cell’s centroid position from the electrode site was determined by distance transformation, and cells were subsequently placed in 20 μm bins radiating from the circumference of the electrode site. All comparisons between cells by distance and amplitude group or Onset/Steady State categorization were done by a two-way ANOVA with multiple comparisons accounted for by the Tukey’s post-hoc test and an alpha level of 0.05. For comparisons with distance, amplitude group, and Onset/Steady State categorization as factors, three-way ANOVA analysis with Tukey’s post-hoc tests were used.
2.5.3. GCaMP6 neuropil quantification
The neuropil is comprised of axons, dendrites, unlabeled glial cells, and out-of-plane neuronal somas. To quantify changes in fluorescence of the neuropil, we masked out all cell bodies identified in 3.3.2. and quantified the mean fluorescence of the remaining tissue in 20 μm bins radiating out from the circumference of the electrode site [76,92,95]. Neuropil fluorescence was expressed as dF/F0 in the same fashion as 3.5.2. Peak dF/F0, Cumulative dF/F0, and change in Mean dF/F0 from 0–2s to 28–30s of stimulation were calculated as described in 3.5.2. Comparisons were made by two-way ANOVAs with Tukey’s post-tests. The Pearson’s Coefficient of Correlation (R) was also determined between each cell and the equidistant neuropil bin corresponding to that cell. In some analyses, the correlation between each cell and all neuropil bins was also explored. Comparisons of R between distances and amplitude groups was executed by two-way ANOVA with Tukey’s post-hoc tests, while comparisons of R between Onset/Steady State categorizations were executed with one-way ANOVA with Tukey’s post-hoc tests.
2.5.4. iGluSnFr neuropil quantification
While iGluSnFr showed high expression in a sparse set of cortical cells, most expression was in the neuropil tissue. While there was high background iGluSnFr activity, the dF/F0 values observed (< 0.4) were consistent with other reports of iGluSnFr during stimulation [101,109–112]. As such, changes in iGluSnFr dF/F0 were quantified in 20 μm radial bins as described in 3.5.3. Cumulative dF/F0 during stimulation and change in Mean dF/F0 from 0–2s to 28–30s of stimulation were quantified and compared between distance bins and stimulation amplitude by two-way ANOVA with Tukey’s post-hoc tests.
3. Results
3.1. Mesoscale imaging shows dense and dynamic neuronal calcium activity during ICMS
Our objective in the present study was to understand how increasing ICMS amplitude affected the spatial and temporal calcium activity of somas and neuropil. To accomplish this, we implanted single shank, planar electrodes into the somatosensory cortex of transgenic mice that preferentially express the calcium sensor GCaMP6s in excitatory neurons [100,113–115] (Fig. 1A). Subsequently, we applied a 30s train of 100 Hz, asymmetric square waves with a 100 μs, 15 μA cathodic phase, a 50 μs interphase period, and a 200 μs, 7.5 μA anodic phase to layer II/III of cortex. Peak calcium activity typically occurred within the first 2 s, as would be expected given the kinetics of GCaMP6s (Fig. 1B). Spatially, neural recruitment was dense around the electrode, falling off exponentially with distance. Interestingly, the GCaMP activity gradually decreased over the 30s stimulation period (Fig. 1B and C). We further explored the spatial fall off in a group of 4 mice. After subtracting the average background fluorescence, we averaged images across the entire 30s stimulation period for 5, 10, 15, and 20 μA stimulation (Fig. 1D). There was high variation in the baseline fluorescence between stimulation sessions, leading to high variability in raw fluorescence during stimulation (Fig. 1E). This could be partly accounted for by normalizing the fluorescence intensity to the fluorescence of the first bin (0–60 μm from the electrode) (Fig. 1F). Here, a clear trend from 0 to 20 μA is observable, and a two-way ANOVA test confirmed that there were statistically significant main effects for distance from the electrode as well as stimulation amplitude (p < 0.0001). There are inherent limitations to this mesoscale approach. In addition to high variability in baseline fluorescence, the poor resolution of the fluorescent light source makes it very challenging to distinguish between somatic and neuropil responses. Furthermore, there is no ability to distinguish between cortical layers with this modality.
Fig. 1.
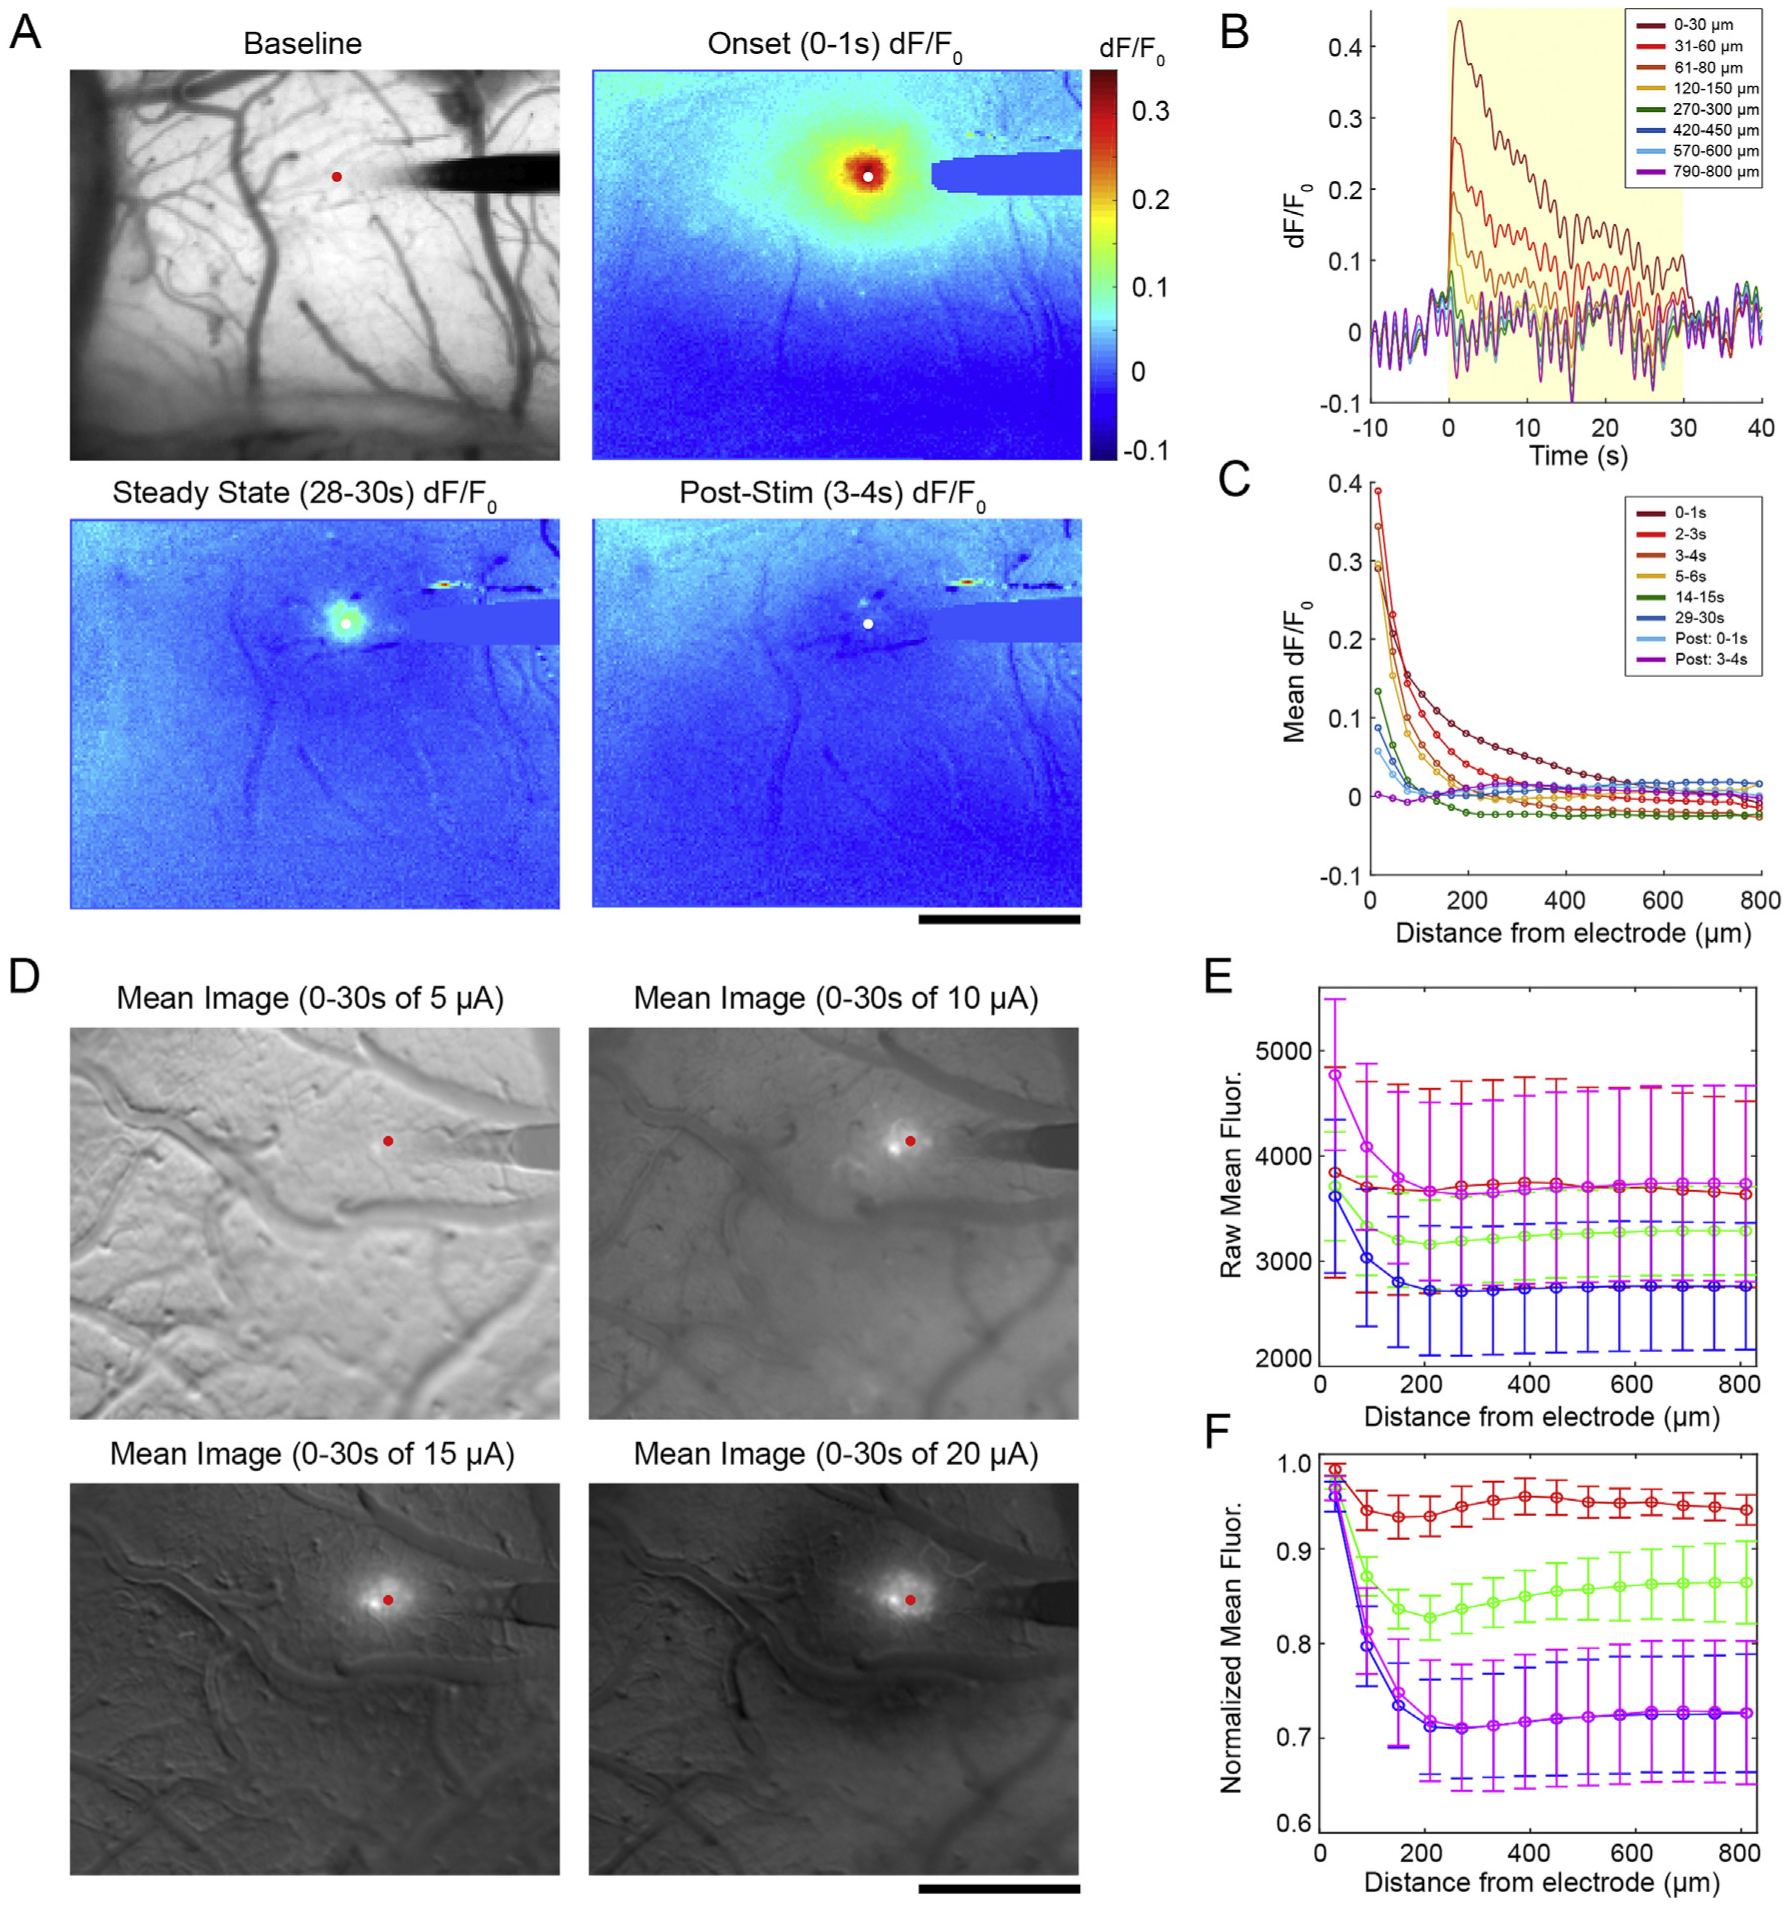
Mesoscale imaging of the Layer II/III neuronal response to ICMS. A) Representative fluorescence and dF/F0 images before, during, and after a 15 μA stimulation. B) dF/F0 traces over time at different bins radiating from the electrode site. The yellow box indicates the period of stimulation on. C) The Mean dF/F0 across all bins at several time points. D) After baseline subtraction, the average fluorescence over the 30s stimulation window was taken. E) Raw fluorescence was measured in 60 μm bins around the electrode with very high error due to high fluctuations in the baseline state of the animals. F) High variability was partly accounted for by normalizing fluorescence to the first bin for each stimulation trial. Significant group effects for distance and amplitude were detected by two-way ANOVA (n = 4, p < 0.0001) with no significant post-hoc tests. Data shown as mean ± SEM. All scale bars are 500 μm.
3.2. Two-photon imaging shows dense somatic calcium activity during ICMS
To achieve sufficient spatial resolution to distinguish between somatic and neuropil responses in Layer II/III of somatosensory cortex, we performed our ICMS experiment with two-photon microscopy (Fig. 2A). We observed progressive recruitment of neurons as the amplitude of stimulation was increased. While most individual cells also showed elevated dF/F0 with increasing amplitude, some cells preferred entrainment at lower stimulation amplitude (Fig. 2B and C). For 217 quantified cells, 11.52% and 23.04% had a greater cumulative response to the 5 μA and 10 μA stimulations, respectively, compared to 20 μA stimulation, but on average there was an increase in the Cumulative dF/F0 with increasing stimulation amplitude for somas (Fig. 2D; two-way ANOVA significant main effects for amplitude p < 0.05e-3 and distance p < 0.01e-60 as well as the interaction p < 0.001). Tukey’s post-hoc tests showed that the cells within 40 μm of the electrode had significantly higher Cumulative dF/F0 at 20 μA and 15 μA stimulation compared to 10 μA (p < 0.0001 and p < 0.005, respectively) and 5 μA stimulation (p < 0.0001). Additionally, Cumulative dF/F0 in cells within 20 μm of the electrode for amplitudes greater than 10 μA was elevated compared to cells between 60 and 220 μm from the electrode in the same stimulation groups (p < 0.05). Cells between 20 and 40 μm from the electrode at 20 μA also had an elevated Cumulative dF/F0 compared to all more distant cells within 220 μm (p < 0.05). A similar trend was observed for the Peak dF/F0 of cells during the first 4 s of stimulation. Two-way ANOVA analysis showed that there were significant main effects for amplitude (p < 0.01e-9) and distance (p < 0.01e-22) but no significant interaction effects (Fig. 2E). Peak dF/F0 was elevated for 15 and 20 μA stimulation compared to 5 μA stimulation within 40 μm of the electrode (p < 0.01). Across distance, the only significant differences were between cells in the 20 μm bin and more distant bins, though there was no consistent pattern (p < 0.05). Overall, these results indicate that somatic calcium activity during ICMS was increased with increasing amplitude, but the spatial distribution was densest within the first 40 μm for all groups.
Fig. 2.
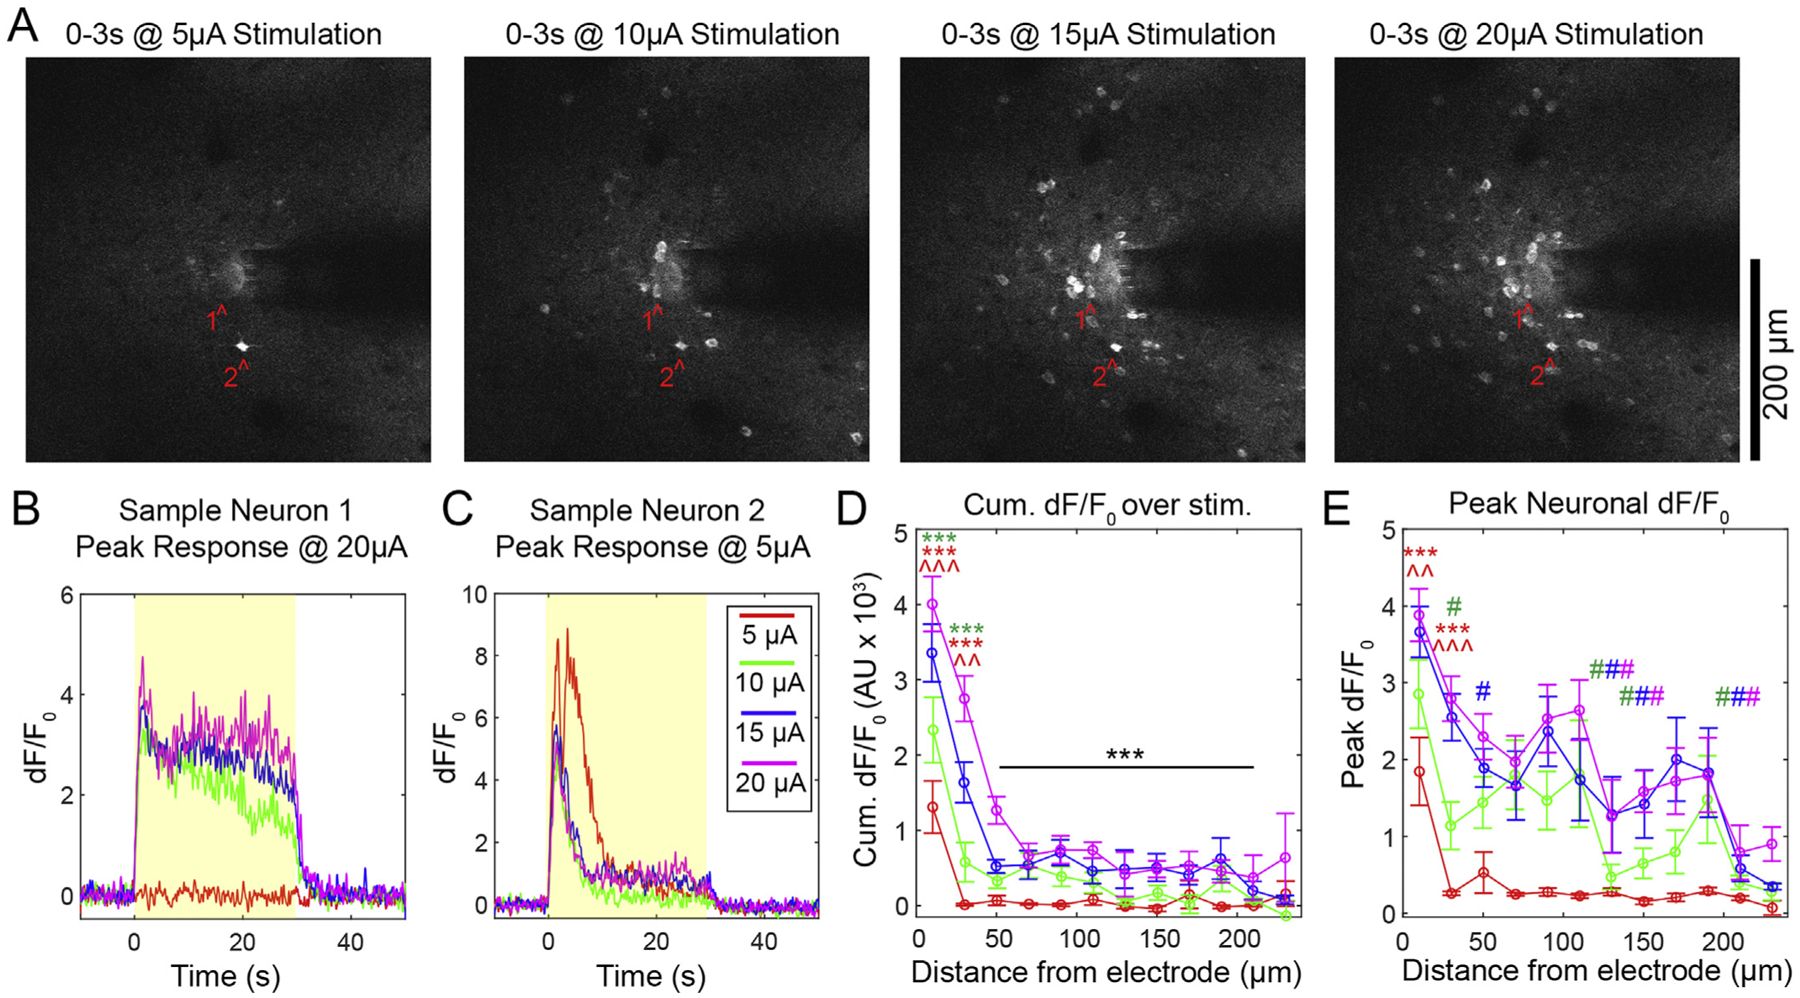
Dense somatic calcium activity during ICMS in layer II/III. A) Representative images of onset fluorescence during 5, 10, 15, and 20 μA stimulation. All images are mean projections from the first 3 s of stimulation. B–C) Representative dF/F0 traces from neurons 1 and 2 highlighted in A). Yellow boxes indicate the stimulation period. D) Cumulative dF/F0 as a function of distance from the electrode grouped by stimulation amplitude. Significant post-hoc tests between amplitudes at the same distance indicated by * for 20 μA and ^ for 15 μA, where the color corresponds to the amplitude that is being compared (3 symbols = p < 0.0001; 2 symbols = p < 0.005). Post-hoc tests between distances for the same amplitude: black *** indicates significantly different from 20 μm for all amplitudes (p < 0.05). E) Peak dF/Fp during the first 4 s of stimulation. Between amplitude post hoc tests indicated by * for 20 μA and ^ for 15 μA where the color corresponds to the amplitude that is being compared (3 symbols = p < 0.0001; 2 symbols = p < 0.01). Between distance bins post-hoc tests: significant comparisons to 20 μm shown by # (the color corresponds to the amplitude of comparison, p < 0.05). n = 217 cells across 4 animals with a total of 5 stimulation sessions. All data presented as mean ± SEM.
3.3. Somatic calcium activity is more reliable with increasing amplitude
Spatially, neurons were recruited densely within the first 40 μm around the electrode during stimulation onset. Throughout the 30s stimulation train, a sub-population of neurons failed to maintain activation (Fig. 3), as our group has previously described [95]. Somas that showed suprathreshold dF/F0 for the duration of the stimulation train were classified as “Steady State” (SS), while suprathreshold cells that did not sustain activity through the duration of the stimulation train were classified as “Onset” (ON) (Fig. 3A and B). As a percentage of all active somas, there were more SS neurons closer to the electrode than far away, with a higher percent of SS neurons at higher amplitudes (two-way ANOVA significant effects for distance: p < 0.05e-3 and amplitude: p < 0.05e-5). Tukey’s post-hoc comparisons show that there was a higher percentage of SS cells ≤60 μm compared to > 60 μm for all amplitudes (p < 0.05). We selected 60 μm as a cutoff as there are roughly equal cells on either side of 60 μm (109 v. 106 cells). Within 60 μm of the electrode, there was a greater percent of SS cells during the 20 μA stimulation compared to the 5 μA stimulation (p < 0.0001), and a greater percent during the 15 μA stimulation compared to the 10 and 5 μA stimulations (p < 0.005 and p < 0.05, respectively). Beyond 60 μm from the electrode, there was a greater percent of SS cells during the 20 and 15 μA stimulations compared to the 5 μA stimulation (p < 0.005 and p < 0.05, respectively).
Fig. 3.
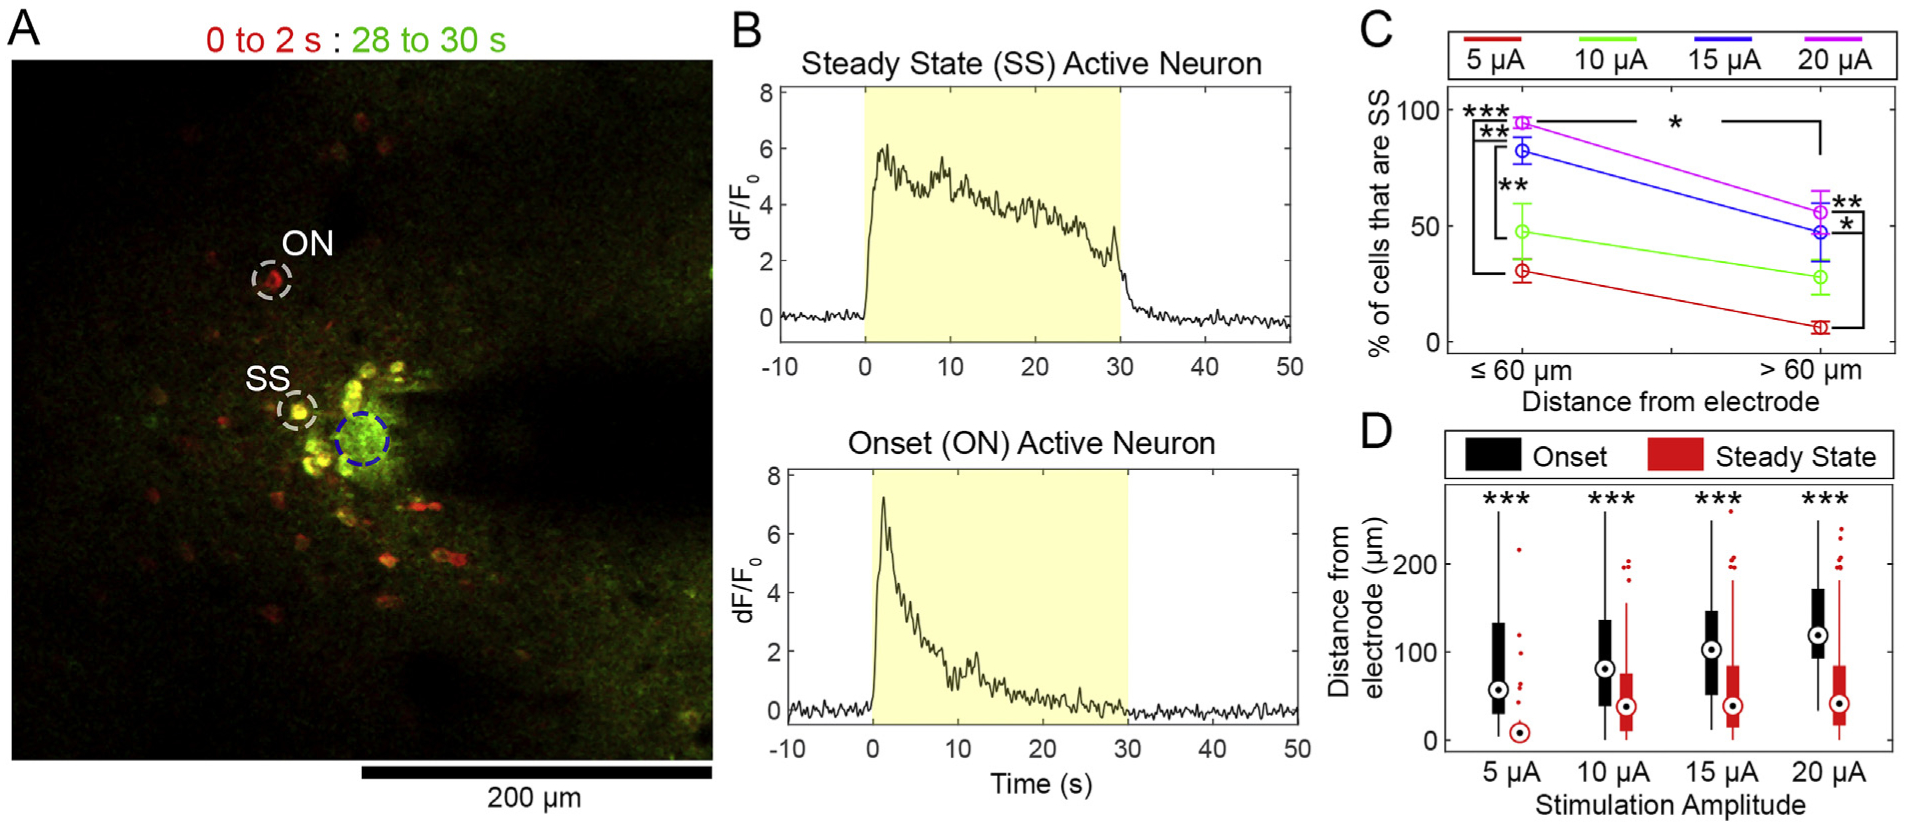
Proximity to the stimulation source and increased amplitude result in a greater percentage of Steady State Somas. A) Overlaid mean fluorescence from 0–2s (red) and 28–30s (green) at 20 μA stimulation. Yellow cells are Steady State (SS), while red cells are onset (ON). B) dF/F0 traces of the representative SS and ON cells from A). The yellow box indicates the stimulation period. C) Quantification of the percent of cells in ≤60 μm and > 60 μm bins grouped by amplitude. D) Box-and-whisker plots show the median (central dot), 25th percentile (bottom of bar), and 75th percentile (top of bar) position of ON (black) and SS (red) cell distances from the electrode site. For C) and D), significant Tukey’s post-hoc tests indicated by *: p < 0.05, **: p < 0.005, ***: p < 0.0001. n = 5 stimulation sessions from 4 animals. Data presented as mean ± SEM.
To more closely analyze the spatial distribution of SS and ON cells, we plotted the cellular density for each distance bin normalized to the total cell density across the imaging plane, which is to say that the sum of the normalized densities from 0 to 240 μm is set as 1 (Fig. 4A). This was done to compare the pattern of spatial fallout independently of the absolute number of cells. Normalized densities for each stimulation session (n = 5) were averaged together. This normalization accounted for potential variation in the number of cells and allowed the analysis to focus on spatial distribution. SS cells largely coincided with a dense-type distribution, while ON cells were more distributed. The discrepancy between the distributions were confirmed with a three-way ANOVA, which revealed significant effects for distance (p < 0.01e-67) and the interactions of amplitude and distance (p < 0.01e-3), SS/ON classification and distance (p < 0.01e-35), and SS/ON classification, distance, and amplitude (p < 0.05). To explore the spatial falloff of the SS and ON cells independent of amplitude, we pooled SS and ON cells across all amplitudes (Fig. 4B). This is justified given that we observed no statistically significant effect of amplitude. The change in distribution was confirmed with a two-way ANOVA showing a statistically significant interaction effect between SS/ON classification and distance (p < 0.01e-17). Supporting this, Tukey’s post-hoc tests showed that there was a statistically significant elevation in normalized cell density within 20 μm of the electrode for SS cells compared to ON cells. Together, these results show that there is a sub-population of cells that do not maintain elevated calcium during long-trains of stimulation (ON cells). These cells are more uniformly distributed, and interestingly, are more likely to be SS with increasing amplitude.
Fig. 4.
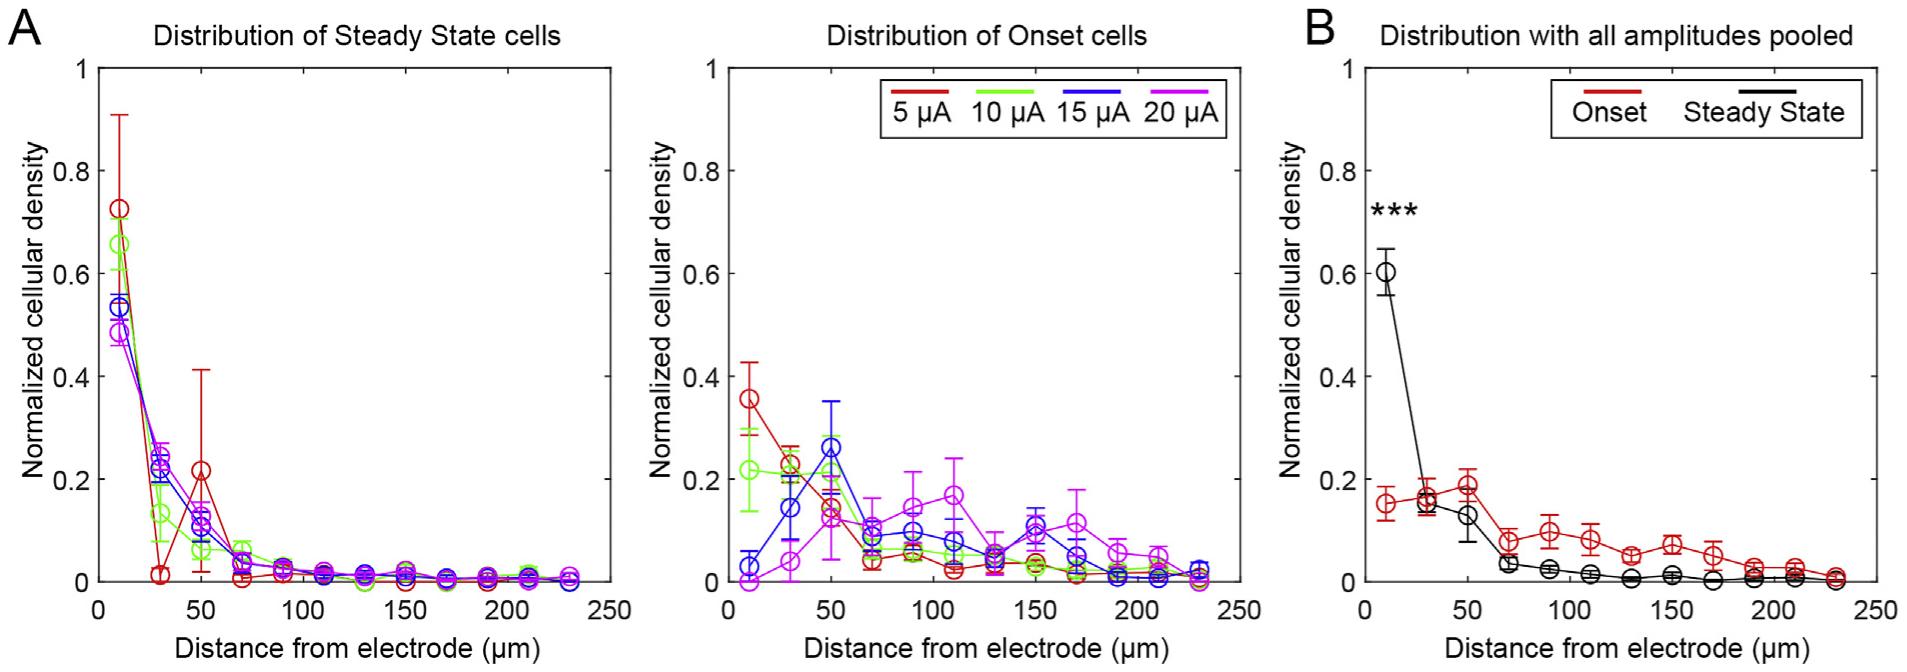
Onset cells are more uniformly distributed than Steady State Cells. A) Cell densities for SS (left) and ON (right) cells in each distance bin were normalized to the total cell density across the imaging plane (ie, the sum of normalized densities from 0 to 240 μm is set as 1). Three-way ANOVA analysis indicated that there were significant effects for distance and the interaction between distance and SS/ON classification, distance and amplitude, and distance, amplitude, and SS/ON classification. B) Cells from all amplitudes were pooled together to examine the normalized densities of all ON and SS cells. Two-way ANOVA confirmed that there was a statistically significant interaction between SS/ON classification and distance, with significant post-hoc tests indicated by *** (p < 0.01e-3). n = 5 stimulation sessions from 4 animals. All data presented as mean ± SEM.
3.4. Neuropil calcium activity is dense and shows little decay during stimulation
Given that the time constant of activation of neuropil is faster than that of somas [83,92,98], we hypothesized that it would have distinct recruitment properties to the somatic population. To measure the dF/F0 of neuropil, we first masked out the somas quantified in Figs. 2–4. We then averaged dF/F0 in the same 20 μm bins used for soma quantification (Fig. 5A). The Peak dF/F0 over the first 2s of stimulation was measured and compared between groups and across time (Fig. 5B). Similar to trends for somatic calcium activity, Peak dF/F0 increased with higher amplitude stimulation. Two-way ANOVA analysis confirmed this, with significant effects for both amplitude (p < 0.01e-7) and distance (p < 0.05e-6). Post-hoc comparisons between amplitudes at the same distance show that the 20 μA group had a significantly increased neuropil Peak dF/F0 compared to the 5 μA group between 0 and 20 μm from the electrode. The 20 μA group at 20 μm also had elevated neuropil calcium activity compared to the same group at 100–240 μm.
Fig. 5.
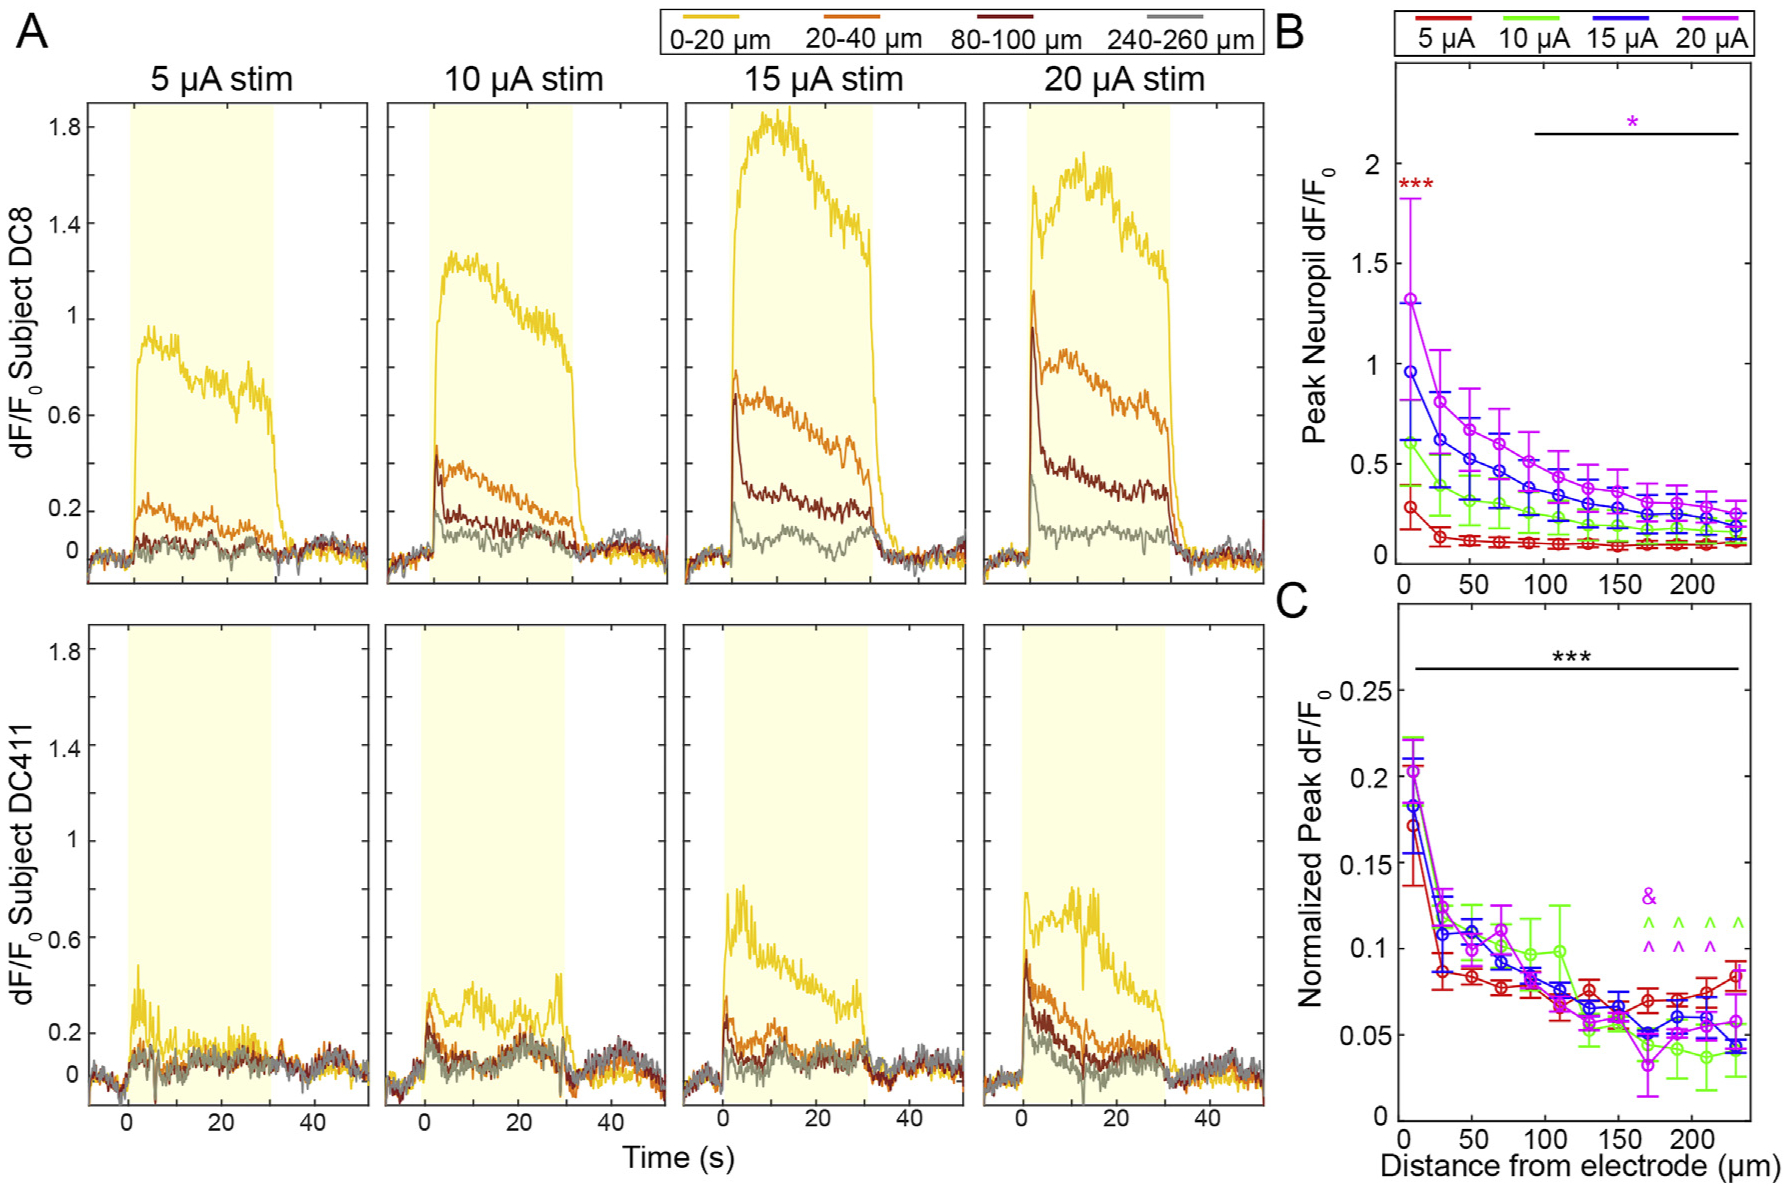
Neuropil is densely and increasingly activated with higher amplitude stimulation. A) Representative time-series dF/F0 responses from two animals. The yellow boxes indicate the stimulation period. B) Peak neuropil dF/F0 measurements during the first 2s of stimulation show increases with higher amplitudes. Two-way ANOVA confirms this (p < 0.01e-7). Pair-wise comparisons show that the 20 μA group has a significantly higher Peak than the 5 μA group at 0–20 μm (p < 0.0005) and the 20 μA group at 0–20 μm is significantly higher than the 20 μA group at 100–240 μm (p < 0.05). C) Normalizing Peak dF/F0 for each distance bin by the total Peak dF/F0 across all bins shows identical spatial fall off of Peak dF/F0 for all stimulation groups (two-way ANOVA distance effect, p < 0.01e-59). In post-hoc comparisons, neuropil within 20 μm was significantly brighter for all amplitudes compared to more distant neuropil (*** indicates p < 0.05). There was also significantly increased neuropil Peak dF/F0 at 40 μm (^) and 80 μm (&) for the amplitudes indicated by the symbol color (p < 0.05). n = 5 stimulation sessions in 4 animals. All data presented as mean ± SEM.
To specifically quantify how Peak dF/F0 changed as a function of distance from the electrode site, we normalized the peak neuropil dF/F0 for each bin to the summed Peak dF/F0 across the imaging plane for each stimulation amplitude, which is to say that the sum of the normalized Peak dF/F0’s from 0 to 240 μm is set as 1 (Fig. 5C). These values were averaged across all stimulation sessions. The normalized data shows that there was an almost identical spatial falloff for all stimulation groups. This was confirmed by two-way ANOVA, which showed a significant effect only for distance (p < 0.01e-59). Post-hoc tests showed that Peak dF/F0 at 20 μm was greater than all other bins, and Peak dF/F0 at 40 μm was greater than many bins > 140 μm from the electrode.
The neuropil GCaMP fluorescence is an amalgam of axonal, dendritic, and out-of-plane soma contributions, and does not necessarily show all-or-none activation that would be expected of isolated somas. As such, Steady State/Onset binary classifications are not as relevant in the neuropil. Nonetheless, we observed a gradual decrease in the neuropil dF/F0 intensity during stimulation for some animals (Fig. 6A and B). Mean dF/F0 during the onset period (0–2s of stimulation) (Fig. 6C) and steady state period (28–30s of stimulation) (Fig. 6D) for each distance bin showed similar spatial fall off, and there was a slight observable decrease in Mean dF/F0 by the end of stimulation. However, a three-way ANOVA showed significant effects for amplitude: p < 0.05e-9, distance: p < 0.05e-21, and the interaction of amplitude and distance: p < 0.005, but not for SS/ON groups or any interaction with SS/ON groups. This suggests that there was no statistically discernible decrease in neuropil activity over this period. To confirm this, we also examined the difference in Mean dF/F0 over time (Fig. 6E). There was a subtle decrease in neuropil intensity for all amplitudes at all distances from the electrode, except for 20 μA within 20 μm of the electrode, which showed both decreases (3 animals) and gains (2 animals) of dF/F0. It is possible that increasing dF/F0 for those animals was due to glutamate build-up at the interface (Fig. 7), though our evidence suggests that all animals would show elevated glutamate levels. Interestingly, the drop in dF/F0 was not significantly different in comparison between any amplitude or distance from the electrode. These experiments show that the neuropil and somas share many of the same trends during stimulation, but they do not explain the extent of the relationship.
Fig. 6.
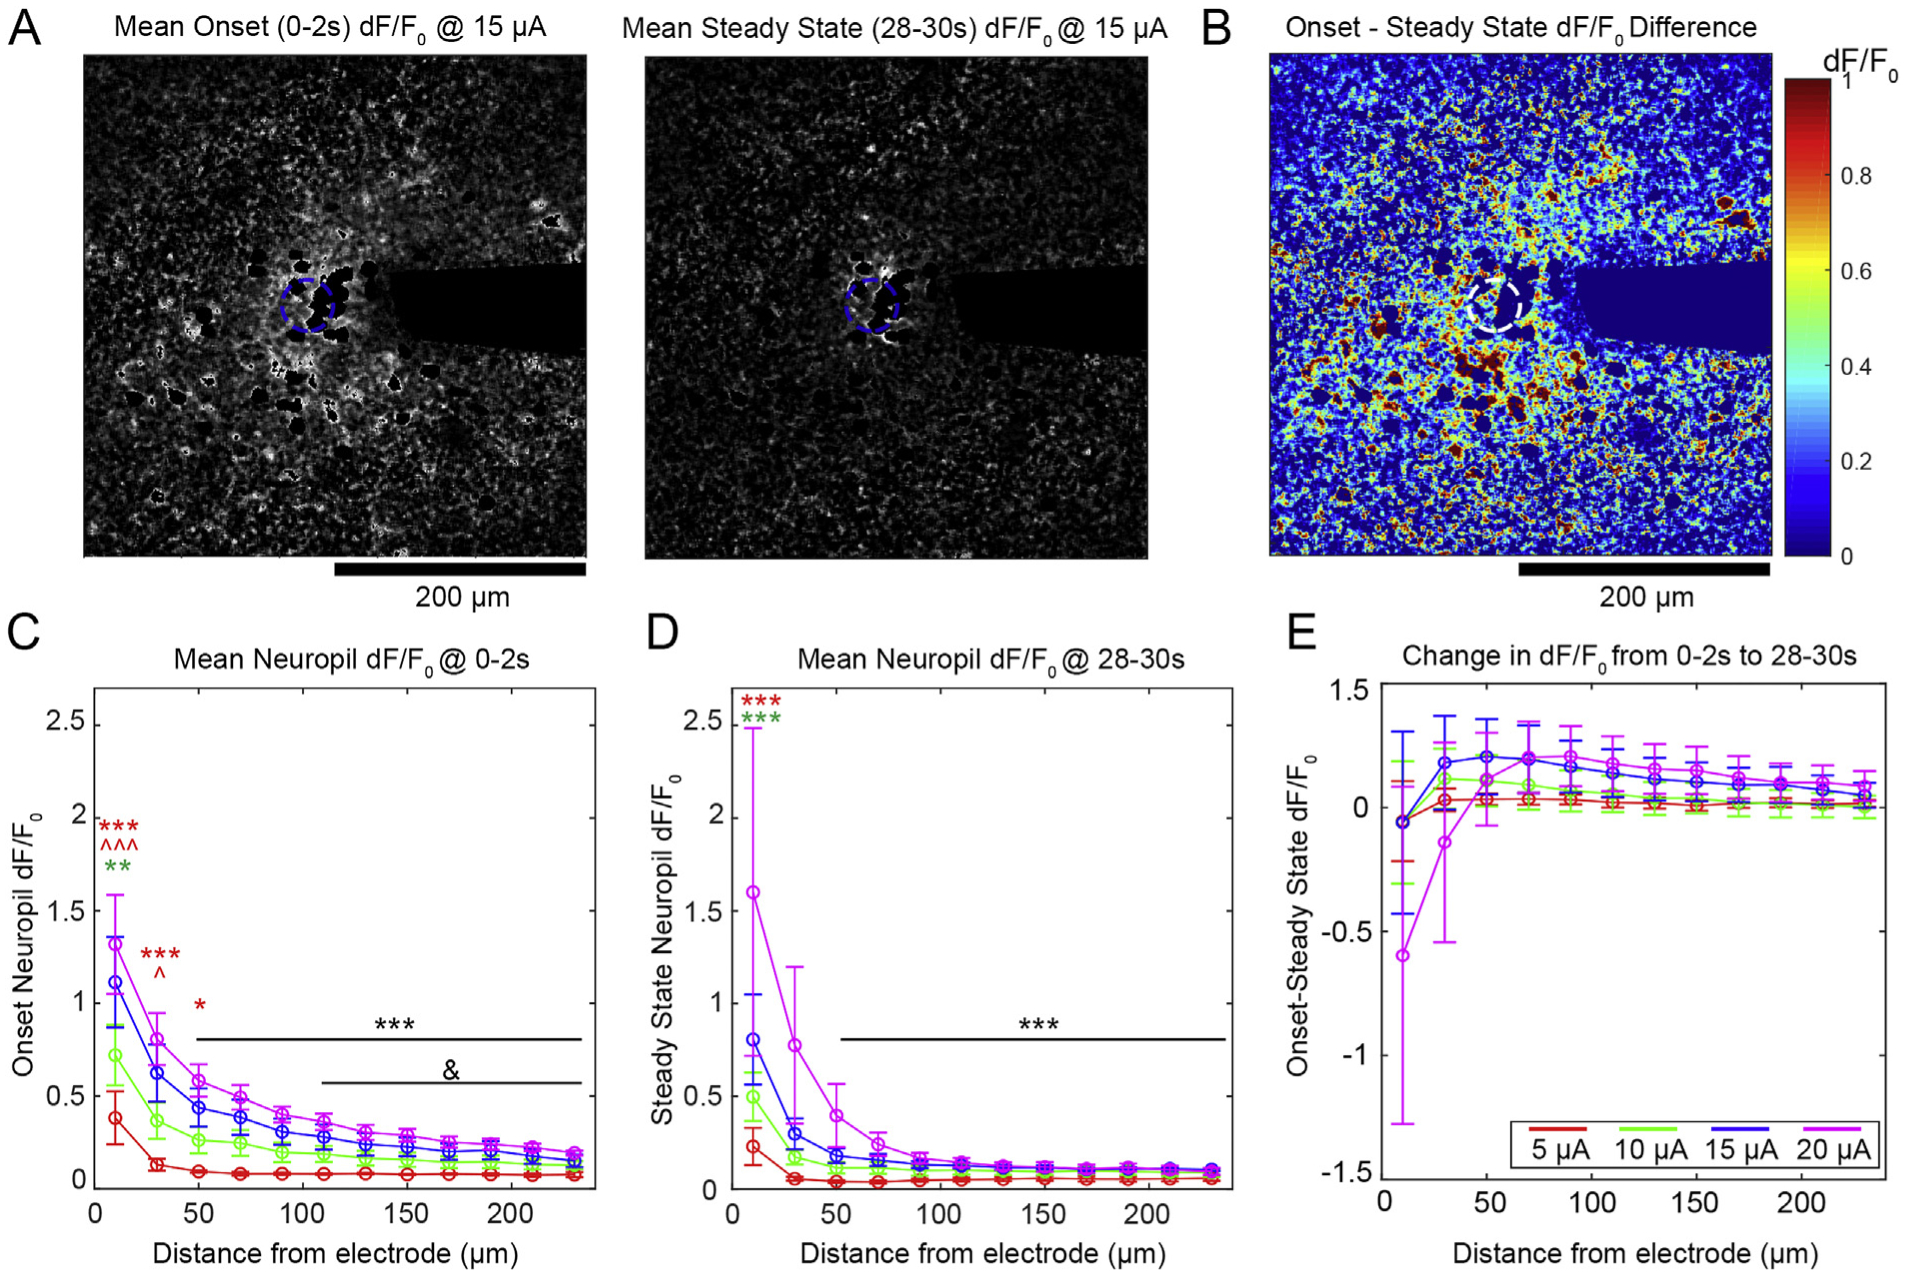
Neuropil activity is largely stable over long-duration stimulation. A) Representative images of neuropil dF/F0 at onset (left) and steady state (right). B) The difference of dF/F0 of the images in A) shows a drop in neuropil activity throughout the frame of imaging. C-D) There is a similar spatial fall off in dF/F0 for the ON and SS groups. Significant comparisons between amplitude indicated by colored symbols, where the color represents the group being compared and * and ^ represent 20 and 15 μA, respectively (3 symbols: p < 0.01e-3, 2 symbols: p < 0.0005, 1 symbol: p < 0.05). Black symbols indicate significant comparisons to the 10–20 μA groups at 20 μm (***) or to the 20 μA group at 40 μm (&): p < 0.05. E) The difference between ON and SS Mean dF/F0. All groups show a change in dF/F0 over time, though there is no significant difference between groups. All data presented as mean ± SEM.
Fig. 7.
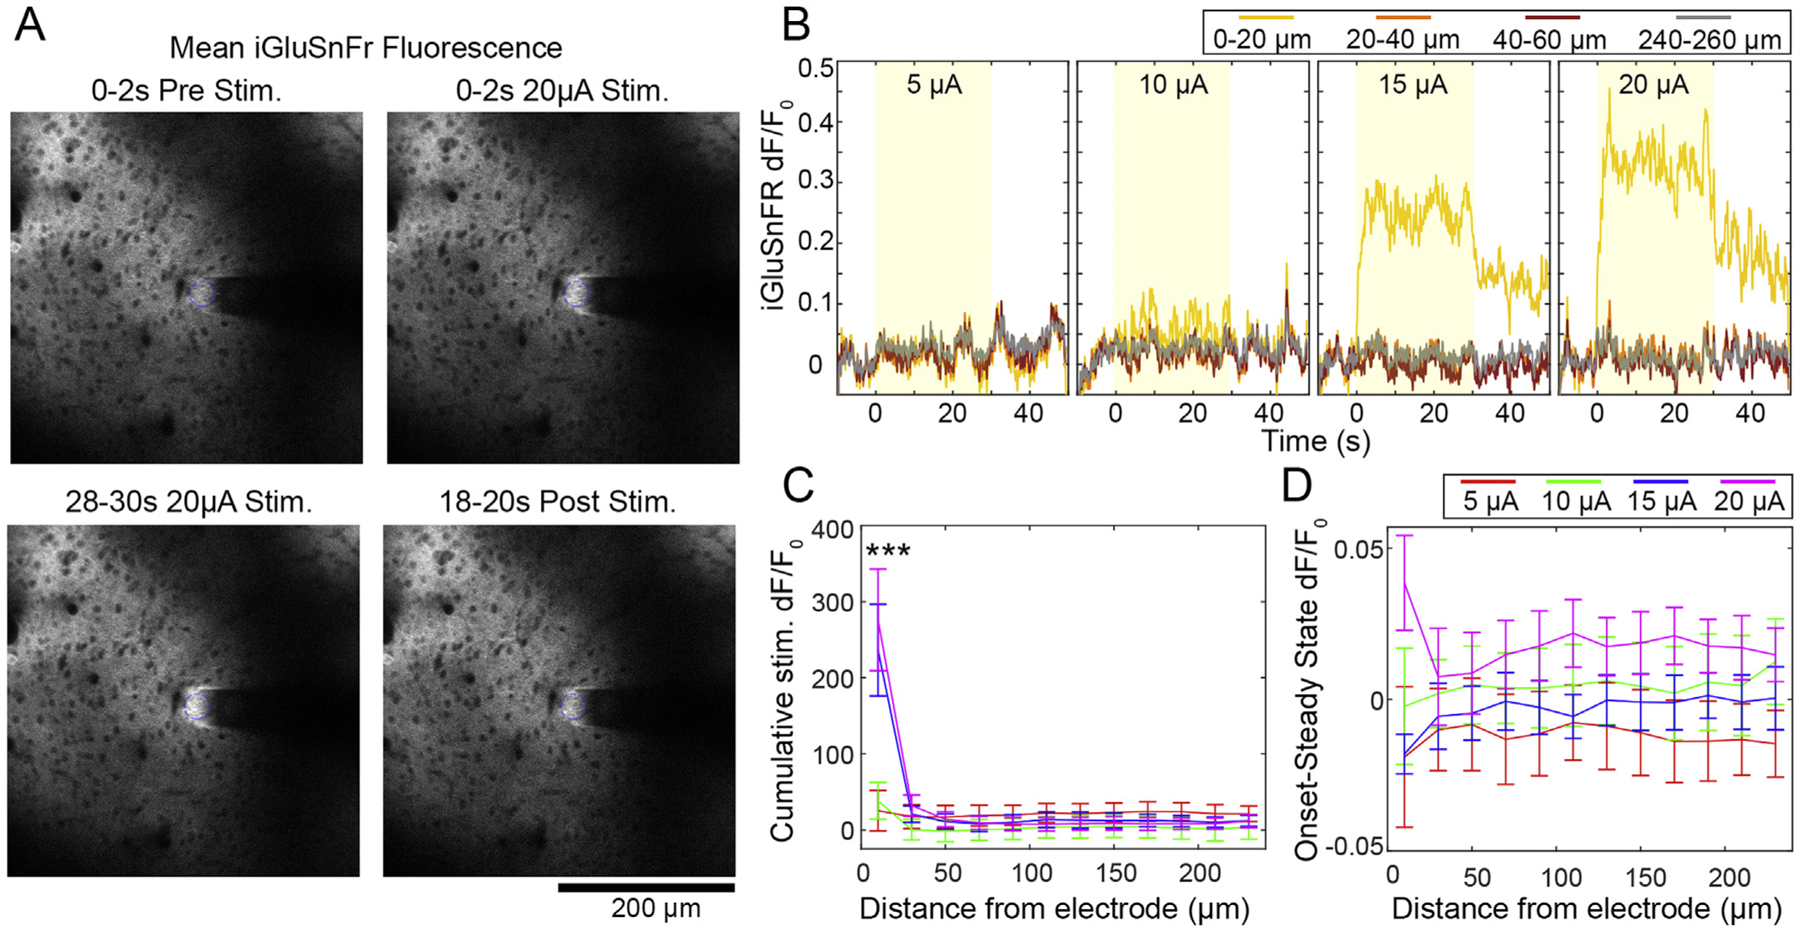
Glutamate release during stimulation is only detectable relative to baseline within 20 μm of the electrode, and sustains beyond the 30s stimulation train. A) Representative images before, during, and after 20 μA stimulation in a mouse transfected with iGluSnFr controlled by the hSyn promoter. B) Representative traces show strong and abrupt increase of glutamate at 15 and 20 μA that is sustained throughout the stimulation period (indicated by the yellow box). Note that glutamate does not fully return to baseline within 20s after stimulation. C) The Cumulative dF/F0 of glutamate over distance confirms the abrupt nature of glutamate release at high amplitude stimulation. *** indicates significant Tukey’s post-hoc test between 15–20 μAat 20 μm compared to all other amplitude and distance groups (p < 0.01e-3). D) Difference in dF/F0 between 0–2s and 28–30s of stimulation is < 0.05 dF/F0 with no statistical difference between any groups, suggesting no decrease in glutamate over the stimulation period. n = 5 stimulation sessions from 3 animals. All data presented as mean ± SEM.
3.5. Glutamate release is local and sustained, showing that axonal activation is maintained through stimulation
These data suggest that there is somatic drop off despite more stable neuropil activity. This may suggest that there is persistent activation of axons in the neuropil that fails to fully propagate to the somas. To further explore the spatial and temporal dynamics of axonal activation, we repeated our stimulation experiments in mice that received viral injections of the glutamate sensor iGluSnFr controlled by the hSyn promotor (Fig. 7A). This enabled us to specifically measure the spatial and temporal extent of axonal glutamate release during ICMS. The hSyn promoter is widely expressed in both excitatory and inhibitory cells, and enables more general measurement of glutamate release [109,116–118]. Interestingly, increased glutamate release was only apparent during 15–20 μA stimulation and was always most pronounced within 20 μm of the electrode (Fig. 7B). This was confirmed by measuring the Cumulative dF/F0 of glutamate during stimulation (Fig. 7C). A two-way ANOVA showed effects for amplitude: p < 0.0001, distance: p < 0.05 e–22, and the interaction: p < 0.05e-9. There were significant Tukey’s post-hoc comparisons between 15 and 20 μA at 20 μm compared to all other amplitude and distance groups (p < 0.01e-3). By subtracting Mean dF/F0 during the SS period from the ON period (Fig. 7D), we confirmed that the glutamate did not substantially change during stimulation, and there was no significant difference between stimulation groups or across distance from the electrode. These data demonstrate that there is sustained excitatory synaptic activation within 20 μm of the electrode that is likely driving some of the soma and neuropil activity observed in sections 4.1–4.4. We noted that the glutamate signal was slow to return to baseline (Figs. 7B, 15 and 20 μA). Several groups have also noted that glutamate reuptake can be slowed by repeated electrical stimulation. Specifically, > 10 Hz reduces glutamate clearance rate, which may explain our 100 Hz stimulation results situations [109,110,112,116].
3.6. Steady state soma calcium activity is strongly correlated with excitatory neuropil calcium activity, while onset calcium activity is not
Both the onset somas and neuropil showed some decay in activity over the course of the stimulation. To evaluate the relationship between the activity decay across ON, SS, and non-activated cells, we calculated the Pearson’s Coefficient of Correlation (R) between the time course of dF/F0 of each cell and the time course of the Mean dF/F0 of the neuropil bin in which the cell resided. For example, in Fig. 8A and B, we see that Soma 1 and its corresponding neuropil bin both increase dF/F0 in a similar fashion, albeit to a different magnitude. As such, the cell and the neuropil are highly correlated (0.98 at 5 μA and 0.92 at 10 μA). On the other hand, Soma 2 does not show calcium activity during the 5 μA stimulation despite an increase in neuropil (R = 0.16). The same cell responds to a 10 μA stimulation, and strongly correlates with neuropil calcium activity (R = 0.97). Soma-to-Neuropil correlations were binned by cells ≤60 μm and > 60 μm, which gave roughly balanced cell counts (109 v. 106), and compared (Fig. 8C). There was higher Soma-to-Neuropil R closer to the electrode and at higher amplitudes (two-way ANOVA significant effects for distance: p < 0.01e-40 and amplitude: p < 0.05e-68). Tukey’s post-hoc tests show that all amplitude groups were more correlated with 60 μm of the electrode (p < 0.05e-5). At both distance bins, 10–20 μA stimulations showed higher soma-to-neuropil correlations than the 5 μA group (p < 0.05e-5), and 15–20 μA stimulations were higher than the 10 μA stimulation (p < 0.005). Importantly, we did not observe any negative correlations, indicating that there was little evidence of anti-correlated activity between the somatic and neuropil compartments. This supports Figs. 2, 5 and 6 which show that the somatic and neuropil compartments have the same increasing trend with amplitude.
Fig. 8.
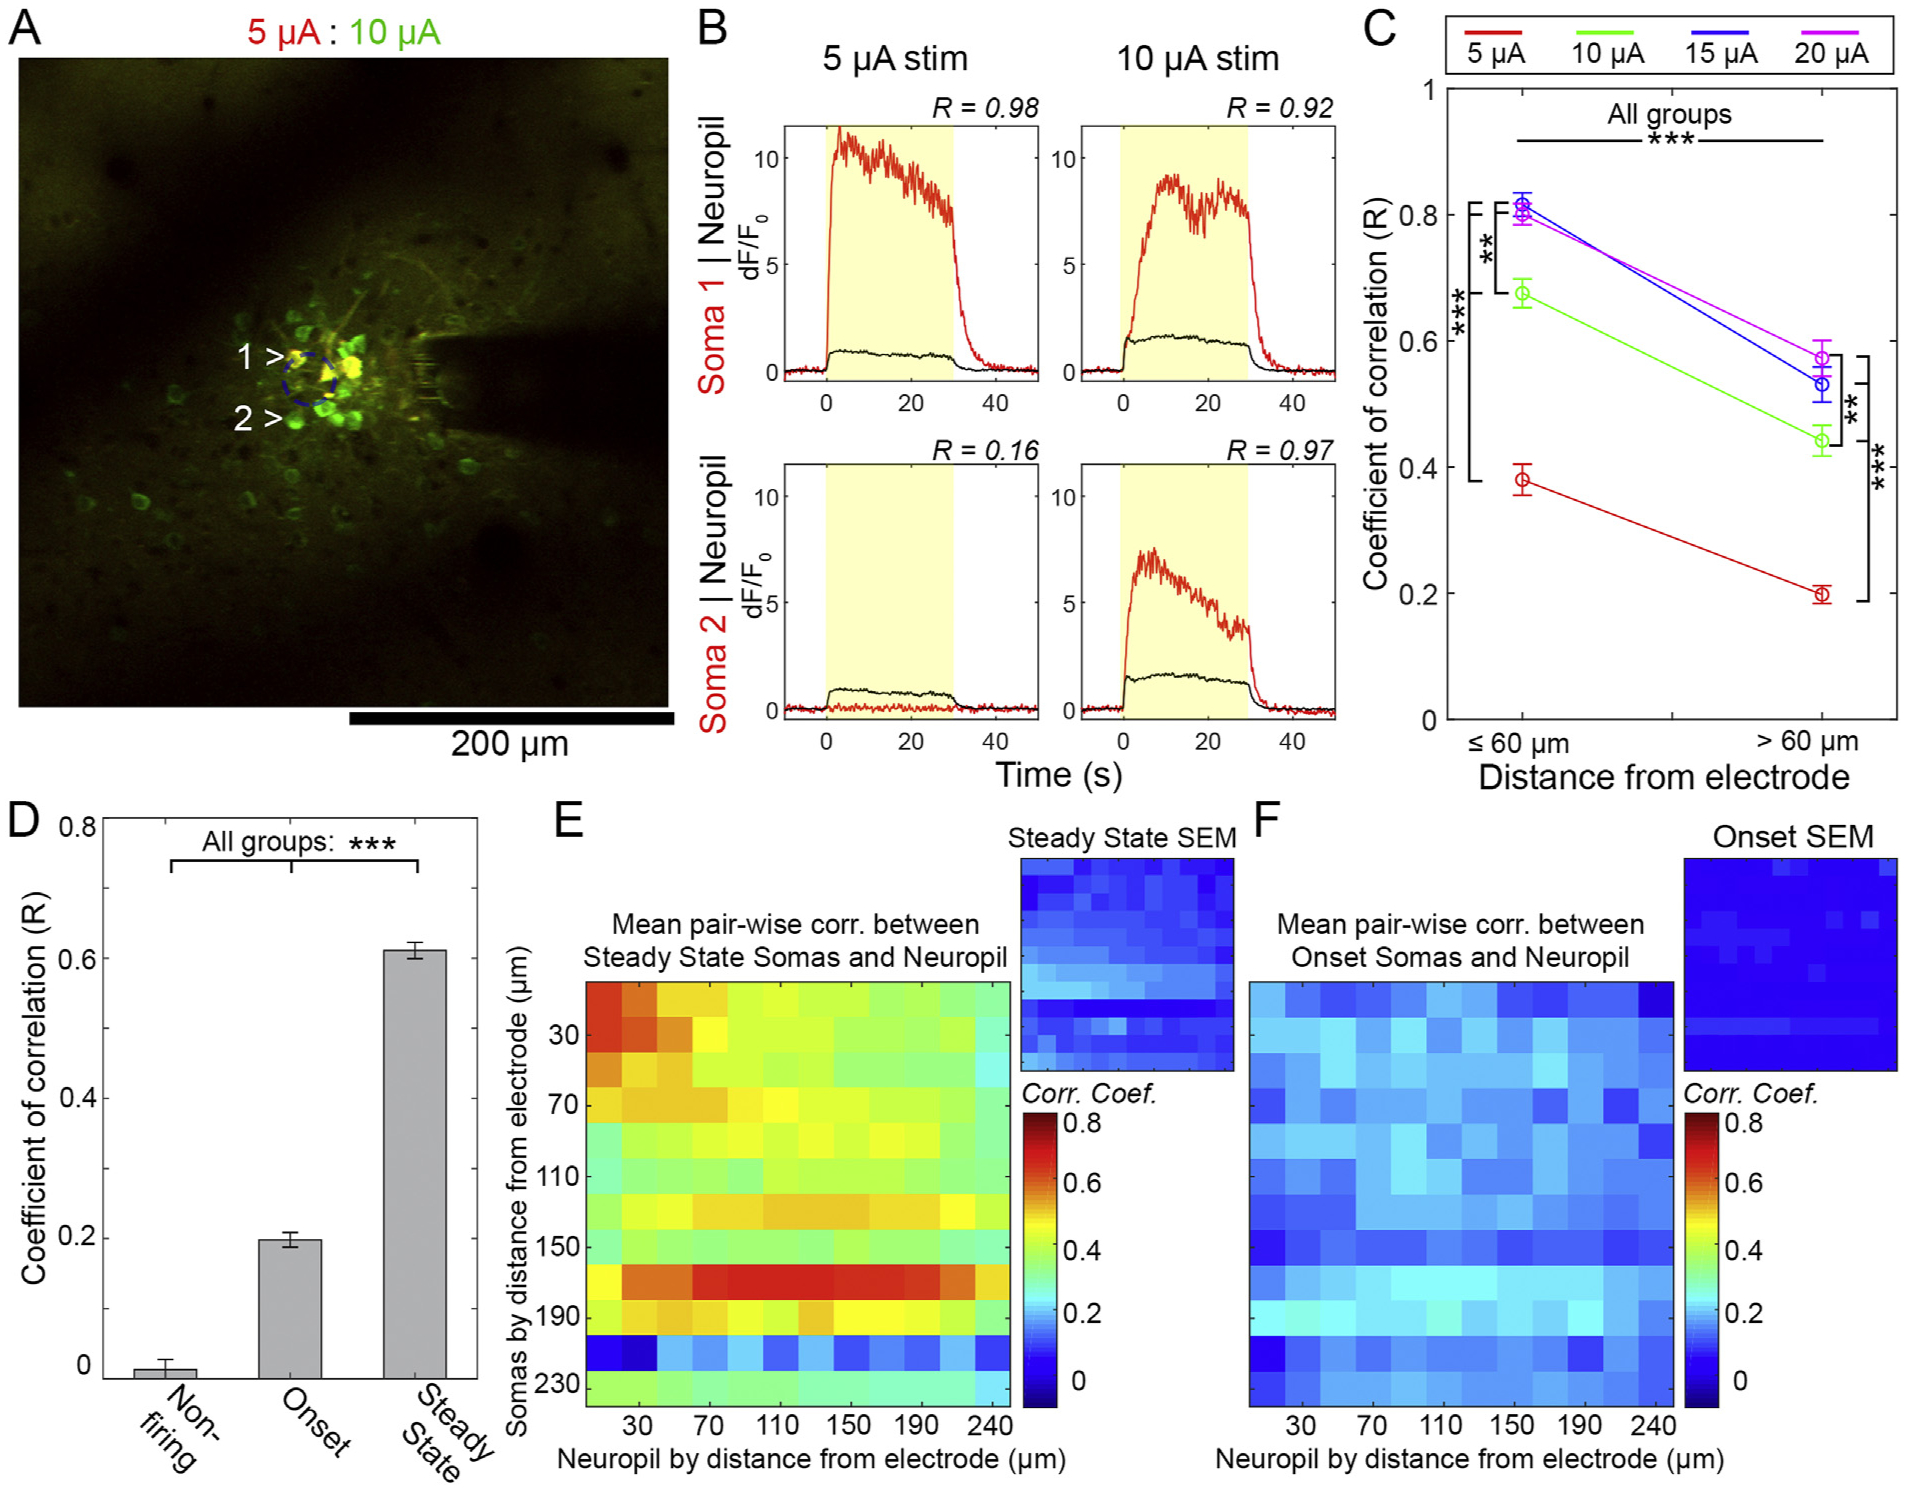
Somatic Steady State activation is highly correlated with neuropil activity. A) Overlay of neuronal response to 5 μA (red) and 10 μA (green) stimulation. B) Representative soma-to-neuropil Rs of cells identified in A). C). The mean R of somas with neuropil in the same bin, with results pooled within (n = 109) and beyond (n = 106) 60 μm of the electrode. Significant Tukey’s post-hoc tests indicated by ***: p < 0.05e-5 and **: p < 0.005. D) The soma-to-neuropil R was pooled 316), and SS (n = 404) classifications. *** denotes significant Tukey’s post-hoc tests p < 0.05e-6. E-F) Mean and SEM of pairwise correlations between Somatic and Neuropil activity for each distance bin. All results averaged across all animals and stimulation sessions. Analysis shown for Steady State (E) and Onset cells (F) (n = 5 from 4 animals). All data presented as mean ± SEM.
Given that SS/ON classification also showed a strong spatial dependence, we reasoned that a soma’s temporal fidelity may have bearing on its neuropil correlation. To specifically determine if there is a relationship between the dF/F0 time course of cells with different SS/ON classifications and their corresponding neuropil dF/F0 time courses, we pooled somas across all distances and stimulation groups and classified them as non-active (n = 140), ON (n = 316), or SS (n = 404) (Fig. 8D). There was a significant effect across classification (one-way ANOVA, p < 0.05 e–159), and post-hoc tests showed significant differences between all groups (p < 0.05e-6). This shows that, independent of stimulation amplitude or distance, the neuropil correlates best with cells that are active throughout the stimulation period.
To determine if somas might correlate better with neuropil bins closer to the electrode, we quantified the soma-to-neuropil pairwise correlations for each soma (pooled from all sessions and stimulation amplitudes) and averaged them for each bin (Fig. 8E and F). For SS somas (Fig. 8E), the overall strongest correlations were for cells and neuropil closest to the electrode. Beyond that region, soma-to-neuropil correlation was broad across space, and was roughly centered along the diagonal, which is the case explored in Fig. 8C and D. For ON somas (Fig. 8F), the correlation was weak across the board with no discernible pattern. Taken together, this suggests that onset somas fail to follow the stimulation despite sustained activation of neuropil and axons.
4. Discussion
Given that implanting electrode biomaterials (for stimulation and recording) can result in scar tissue formation within 50–150 μm of the electrode that alters the electrical connectivity of the electrode and neural tissue, it is essential to determine the spatial and temporal extent of neural activation during ICMS. Using two-photon microscopy of the Thy1 cortical neural calcium response to electrical stimulation, we show that neural calcium activity is densely recruited within 40 μm around the electrode site during ICMS, and that calcium activity largely increases with amplitude in this region for both the somatic and neuropil compartments. Over long trains of stimulation, there is a uniform drop in neuropil calcium activity across space, while somatic calcium experiences a greater drop out with distance from the electrode. The drop in somatic calcium can be reduced by increasing stimulation amplitude. While the somatic compartment experiences a reduction in activity, neuropil activity was largely stable and correlates to SS soma activity 3X greater than ON soma activity, which has a much more abrupt drop in activity than the surrounding neuropil. Finally, we imaged extracellular glutamate release to identify the region where ICMS is activating axon terminals. Glutamate release is most pronounced within 20 μm of the electrode at 2 nC/ph stimulation, and sustains throughout the entire stimulation period. Perhaps more importantly, there is continued elevation of glutamate for at least 10s post-stimulation. Ultimately, we show that the neural GCaMP response to ICMS is dense, and that while increasing the amplitude of stimulation may increase the region of neural recruitment, it also changes the temporal calcium and glutamate response to stimulation. This may have important implications for using amplitude to increase the ICMS effect or to compensate for chronic glial scarring.
4.1. Neural activity density increases with amplitude
Increasing stimulation amplitude from 5 to 20 μA resulted in consistently dense activation of neuronal soma (Fig. 2) and neuropil (Fig. 5) around the electrode in Layer II/III of somatosensory cortex. Our optical results (Fig. 3) confirm Stoney’s hypothesis from 1968 [81], and agrees with more recent electrophysiology and modeling data [82,83,85,93,119,120], as well as in vivo imaging studies [88–90,95,96]. Specifically, we showed that the somatic calcium activity (Fig. 2) densities and number of activated soma increased as a function of amplitude. This goes in contrast to Histed et al.’s report, which suggested that activation within the amplitude range 4–25 μA will be sparse, distributed, and not biased toward the electrode’s tip [76]. It is worth noting that, while both the current study and Histed’s used the same amplitude range and in vivo imaging in Layer II/III of cortex, the Histed study used a range of animal models, anesthetics, and electrode types as well as a different calcium sensor (non-viral OGB), waveform shape, and a 250 Hz stimulation frequency. Furthermore, high impedance glass and tungsten electrodes were used, which distribute charge very differently than our 30 μm diameter disk electrodes with < 500kOhm impedances [121,122]. While these differences make any comparison difficult, there are potential key differences that may explain the discrepancy of the studies. Lastly, pervious behavioral ICMS research and models indicate that increasing both amplitude and frequency improves detection thresholds [108]. However, our results indicate that amplitude increases the number and average distance of both onset and steady-state neurons from the electrode. In contrast, increasing frequency largely activates the same number of neurons, but decreases the number of onset neurons and reduces the average distance of steady state neurons from the electrode [95]. Therefore, amplitude and frequency act differently on nearby neurons. Together, these studies highlight that many factors will shape the spatial response to ICMS, and clinicians must be careful to plan their interventions accordingly.
4.2. Somatic calcium activity decrease during long stimulation trains
Many groups have shown that electrical stimulation in cortex results in excitation followed by a period of low activity [88–90,93,94,96]. This can be clearly observed in Fig. 1 with mesoscale imaging. However, there were large variability in fluorescent calcium activity > 500 μm due to previously well characterized Resting State oscillations [123–125], Nevertheless, these results and previous studies have shown that some neural elements near the electrode fail to follow trains of stimulation [95,98]. While mesoscale epifluorescent imaging is unable to distinguish multiple neural elements, two-photon microscopy can be used to more clearly distinguish between the soma and neuropil.
Using in vivo two-photon microscopy, we show a uniform activation pattern for cells that were only activated during the onset of stimulation (Figs. 2 and 3). This “uniform” pattern was similar in appearance to the “sparse” pattern noted by Histed [76]. However, the number of onset neurons within 20 μm of the electrode decreased as stimulation amplitude increased during long stimulation trains (Fig. 4A). Furthermore, these effects were overshadowed by the simultaneous activation of onset and steady state cells that were more densely arranged (Fig. 3). Clearly, the chance of decreased neural activity near the implant (< 60 μm) is reduced with increased stimulation amplitude (Fig. 3C). However, the number and the average distance of transiently onset activated neurons increase with amplitude (Fig. 3). These findings demonstrate that the mechanism of onset and steady state neuronal somas differ in an amplitude dependent manner.
4.3. Relationship between somatic and Neuropil activity
The mechanism of onset neuronal cell body activation and cessation of calcium activity under continuous stimulation remains poorly understood. However, it is known that the time constant of calcium transients in the neuropil is shorter than for the soma [76]. Taken together with the fact that onset somas are generally distant to the electrode site, it is likely that axons in the neuropil are antidromicly back-propagating to the onset cell somas. This is supported by studies showing that pharmaceutical block of synaptic transition minimally impacted neuropil or somatic activation [76,126].
There are a number of fundamental causes for why these antidromicly activated onset cells might fail to entrain with the stimulation. First, axonal propagation could fail due to extracellular potassium buildup and/or intracellular sodium and calcium buildup [98,127,128], fatigue [90], abrupt geometric shifts in the axonal arborization [97], or due to virtual anode formation [129]. These cellular limitations may confer an entrainment preference to cells. Our previous study ultimately showed that above 10 Hz, the onset response between 30 and 250 Hz is largely dense around the electrode. In contrast, 10 Hz stimulation led to a slow (~seconds), uniform or sparse and distributed activation pattern that was dominated by steady state activation [95]. While it is tempting to suggest that all steady state activated neurons were primarily activated directly by the stimulation current, spiking probability of excitatory neurons using optogenetics has been reported to significantly decrease for frequencies > 15 Hz [130]. This may imply that some neurons are simply unable to be entrained at frequencies greater than 10 Hz.
If entrainment failure was the primary determinant of a cell being steady state or onset, we would expect to see a drop off in calcium activity of both the neuropil as well as soma intensity. We would also expect to see cessation of glutamate release if cells were demonstrating entrainment failure. Additionally, we would expect to see more cells fail to follow the stimulation at higher amplitudes, when in fact we saw fewer cells fail. Another potential cause of entrainment failure is inhibition. Inhibition has previously been shown to shape the temporal and spatial response to cortical stimulation [88,89,91]. In fact, when a GABA receptor antagonist is applied to cortical slices before stimulation, the horizontal activation grows from 100 μm in radius to > 250 μm [88,89]. Because GABA receptors are localized to the dendrite and soma compartments of the neuron, inhibitory post-synaptic potentials will sum in there [131,132]. This explains why groups have shown that somatic calcium activity and neuropil activity can be independent of one another [126,133,134]. Therefore, we expect that if inhibition were driving failure of soma entrainment in our experiment, we would see dramatic drop off of somatic dF/F0, but not neuropil, which is the main finding of our correlation analysis (Fig. 8).
The correlation analysis shows that neuropil activity was highly correlated with the behavior of steady state cells compared to onset cells and non-active cells (Fig. 8C and D). This suggests that the neuropil mostly exhibited a “steady state” response. Steady state disposition was strongest closest to the electrode and at higher amplitudes (Fig. 8C), but it should be noted the neuropil was more correlated with steady state cells at all distances from the electrode (Fig. 8E and F). Importantly, none of the correlations were negative, showing little evidence that the two compartments could show opposite behavior. These findings demonstrate that at least a portion of neurites are being activated throughout the stimulation train, while some distant somas fail to entrain. In turn, this suggests that these onset neurons may be more likely to fail to entrain over the stimulation duration because of inhibition or inactivation, rather than conduction failure or hyperpolarization of all axons from virtual anodes [135]. However, we did observe some decline in neuropil activity over time (Fig. 6), and so it is possible that despite the bulk “steady state” behavior of the neuropil, there could still be some “onset” axonal fibers in the neuropil that are causing onset activity in cells. To achieve a more complete picture, future experiments can target high-resolution microscopy that can identify individual fibers in the neuropil, and connect them to their somas.
This then suggests that many axons were still entrained to the stimulation despite many somas failing to entrain. In this scenario, axons of glutaminergic cells would still release, as we also observed (Fig. 7). We saw that glutamate release was only significantly elevated compared to baseline within the first 20–40 μm of the electrode. Thus, the only detectable axons showing sustained glutamate release were in this vicinity, even at 20 μA stimulation. In turn, this suggests that the effective direct stimulation radius of ICMS is much smaller than is revealed by the calcium activity, which would indicate that direct electrical stimulation is a very focal event, and well within the region of glial scarring for chronic electrode implants. Interestingly, we also saw that glutamate did not return to baseline within 20s post-stimulation, while the GCaMP activity returned to baseline within 5s. It has previously been shown that stimulation > 10 Hz reduces glutamate clearance rate, which may explain our 100 Hz stimulation results [109,110,112,116]. The frequency dependent delay in glutamate clearance could also partially explain why GCaMP activity decreased over time, while iGluSnFr activity remained more or less plateaued over the stimulation duration. The fact that GCaMP activity resolved much faster than excitatory neurotransmitters were cleared may speak to the ketamine anesthesia. Ketamine is an NMDA receptor antagonist, which would prevent glutamate from reaching its target to yield sustained GCaMP activation [136,137].
If inhibition is truly driving soma failure, it is unclear why increasing the stimulation amplitude resulted in a reduction in somatic failure. Perhaps the inhibitory population is more susceptible to propagation failure due to their high degree of branching and geometric complexity [127] or perhaps higher amplitudes skew the excitatory-inhibitory balance [138]. While the current study cannot conclusively demonstrate that inhibition is the main driver of somatic failure, our evidence strongly suggests that it is a contributor to the effect. If amplitude is also driving change in excitatory-inhibitory balance, this is a further source of concern that using amplitude to increase ICMS effect or to offset the effects of glial scarring could have unintended effects.
4.4. The role of distance on the activation of neuronal elements
If inhibitory activity can impact the density and distance of neural activation during electrical stimulation, it begs the question: What is the effective direct excitation radius of electrical stimulation during long stimulation pulse trains? Due to the complex interaction of topics discussed in 4.1–5.3, researchers have suggested that examining neuropil activity is more representative of current spread in the cortex during ICMS [139]. Examining the peak neuropil activation shows that amplitude increases the density and distance of activation (Fig. 5B). Normalizing the neuropil activity confirms that increasing the stimulation amplitude increases the neuropil activity without greatly impacting the activity fall-off scale (Fig. 5C). These results might suggest that neuropil activity closely represents current spread and proportionally increases as a function of stimulation amplitude. However, examining the neuropil activity in the first 2 s and last 2 s of a 30 s stimulation pulse train shows that an inhibitory component cannot be disregarded (Fig. 6). Even then, this suggests that stimulation at 40 μm of tissue might directly be activated by 5 μA up to several 100s of microns of tissue at 20 μA. The unexpected result is that significant glutamate activity could only be detected in the first 20 μm from the electrode, even with 20 μA stimulation amplitudes. It should be noted that iGluSnFr has substantial background signal and background activity, however, the iGluSnFr activity > 40 μm from the electrode is similar to the pre-stimulation activity. Furthermore, glutamate levels do not decrease during the 30 s stimulation period (Fig. 7), implying that glutamate is not exhausted even during high amplitude stimulation. This further implies that axons are consistently recruited throughout the long stimulation period. It should be noted that stable iGluSnFr activity does not translate to stable synaptic release rate, since the glutamate uptake rate is regulated by the firing frequency [109]. However, the fact that the glutamate signal is not actively decaying during stimulation suggests some glutamate release. Moreover, given the layer II/III examination, it is not surprising that there is limited distant iGluSnFr activity, given that excitatory projections in Layer II/III are predominantly laminar and out of plane of the experimental imaging field. In any case, these results highlight that the primary excitatory neurotransmitter activity is highly proximal to the stimulation microelectrode (< 20 μm) even at very high stimulation amplitudes. In turn, this implies that electrical stimulation directly interacts with neuronal elements in a highly localized region of tissue even if it leads to a distributed pattern of neuronal activation.
4.5. Implications on biocompatibility and biomaterial design of ICMS microelectrodes
The major implication of this study is that the densest recruitment of neuronal elements occurs within 20 μm of the device, even if amplitude is increased. While those neural elements can, in turn, propagate to generate a complex, sparse, and distant neuronal activation pattern. This supports the notion that it is important to elevate consideration for biocompatibility of microelectrode design and biomaterial selection for ICMS microelectrodes. Glial scar formation and neuronal element (soma and neurite) loss within the 10–150 μm radius of an electrode could lead to loss of tissue excitability with electrical stimulation even at high stimulation amplitudes. However, the exact level of glial scarring and neuronal element loss required to maintain ICMS tissue excitability remains to be evaluated in longitudinal studies. Intervention strategies that have been explored for recording microelectrodes including footprint size [12,24,140–143], electrode site size [11,24,144], electrode site material [145–147], array shape [148], volumetric density across the array’s footprint [11,42], strength [24,148], compliance/flexibility [23,24,149–153], elasticity/softness [60,151,154–156], electrical properties [157–160], device insertion speed [40,41], tip shape [40], surface chemistry modifications [18,24,161–163], and drug delivery [13,21,104,164–174]. Our results suggest that these strategies may be equally important for ICMS microelectrode functionality. Further studies are necessary to evaluate how novel biomaterials and device designs alter the spatiotemporal activation of neurons and neuronal elements compared to standard iridium oxide microelectrode sites on silicon substrates.
4.6. Limitations and future directions
In vivo imaging has become an essential tool for understanding the neural response to ICMS. While in vivo imaging gives unprecedented ability to simultaneously record spatial and temporal information, it is based on optical sensors that are often slower than electrophysiological activity in neurons. While several groups have characterized a strong quantitative relationship between optically observed calcium events and electrophysiological action potentials [100,113,114,123], it should be noted that calcium events can also be precipitated by injury [43,175,176]. While our stimulation parameters were selected based on well-characterized safety constraints, these safety studies are largely based on post-mortem analyses and may not capture sub-lethal cellular injury data [121,177–179]. Nonetheless, new tools are emerging with voltage, calcium, and neurotransmitter sensors that have rise and fall times < 10 ms [180–182]. The current study used a GCaMP6s model, with rise and fall times on the scale of hundres of milliseconds to a second [100]. This was selected as it has robust dF/F0 during activation, and therefore can cleanly detect neuronal activation. Further, due to our long-train stimulation, the slower biophysics of GCaMP6S was not an impediment to any of our analyses. Our study was also limited by limiting our plane of imaging to a single cortical layer. This precludes the ability to visualize much orthodromic activation and transmission during ICMS, but prevents imaging artifacts that can come with 3D imaging in a breathing animal with an open craniotomy [88,89,92]. Also, it should be noted that the glutamate results presented here are based on the sensitivity of the iGluSnFr [183]. Lastly, it should be noted that other forms of calcium activity may contribute to GCaMP signaling than action potential generation. Future studies may be able to employ light-sheet microscopy or 3 photon microscopy that might enable more rapid, volumetric imaging to collect a more complete picture [184,185]. Our study was also limited by the acute preparation, which necessitated the use of ketamine anesthesia. Ketamine is an NMDA antagonist, and therefore likely reduced any orthodromic, transsynaptic activity that would have otherwise been present in our study [136,137]. Due to our dense activation pattern, it is likely that we did not fully block orthodromic activity. However, as clinical ICMS is done in an awake population, future studies should focus on chronic awake models to gain the most relevant insights. Current studies are aimed at characterizing the contribution of individual neuronal subtypes to these activation patterns as well as repeating this studying with iGABASnFr [186].
Our findings strongly suggest that inhibition plays a defining role in the neural calcium response to ICMS. This may account for the dip in activity < 500 μm from electrode site observed under widefield imaging (Fig. 1D–F). Future in vivo imaging studies can take advantage of calcium sensors driven by inhibitory interneuron promotors to dissect out the role of inhibition in stimulation [100]. In addition to probing mechanisms, an inhibitory interneuron model could be used to optimize ICMS stimulation paradigms that engage inhibitory cells to define new roles for clinical brain stimulation. In particular, how temporal patterning of electrical stimulation drives spatial patterns of neuronal activity remains to be elucidated [187].
Finally, we have shown that modulating amplitude has a more complicated effect than simply altering the radius of neural activation. This suggests that increasing amplitude to circumvent the glial scar in chronic ICMS may not behave according to the simple model proposed by Stoney. It should be noted, however, that this study was performed in an acute implantation context and so it cannot directly assess the effect of amplitude on changes to current flow that may result from varying degrees of glial scar formation. Instead, this study examined the “optimal situation” without glial scar formation. Future studies can tackle this using chronic preparations that we have previously described [28,43,105,106].
In addition to those biocompatibility considerations, there are also engineering considerations in the geometric surface area and the shape of the electrode site as well as other stimulation parameters. Namely, electrodes of the same surface area but with greater perimeter experience variations in current density during stimulation. Models show that this could lead to more robust recruitment of neurites [122,188]. All experiments in the present work were conducted with planar, disk electrodes. It should be noted that current clinical deployments of ICMS use electrodes with exposed tip sites [5,7,8]. Work to compare stainless steel multi-electrode arrays, silicone multi-electrode arrays, and tungsten wire tip electrodes for ICMS in non-human primates has shown that all electrodes perform comparably in evoking motor responses [57]. Future work should compare these different device geometries with in vivo imaging to determine if they exhibit similar calcium and glutamate signatures as observed in the present study.
5. Conclusions
Using in vivo two-photon imaging of calcium and glutamate activity, we have shown that ICMS densely recruits neurons and causes excitatory glutamate release within 20–40 μm of the electrode. The neural and glutamate response rapidly falls off as a function of distance from the electrode. In all cases, the response is stronger with higher amplitude. During long trains of stimulation, there is a population of more distant neuronal somas that fails to follow the stimulation. Despite this, the surrounding neuropil shows sustained activation, and glutamate shows sustained release, even beyond cessation of stimulation. This shows that ICMS can reliably activate neuropil, while adjoining somas fail to maintain activation. Importantly, this suggests that while increasing the amplitude of ICMS can increase the radius of neural activation, it will also affect the temporal pattern of stimulation and neurotransmitter release in the local environment around the electrode. This may instruct the development of stimulation paradigms and electrode designs that are robust against glial scarring and neurodegeneration around chronically implanted electrodes.
Supplementary Material
Acknowledgments
We would like to thank Alberto L. Vazquez for assistance and training for the viral injections and Kevin C. Stieger for critical review of the manuscript. This work was supported by NIH R01NS094396, R01NS105691, and R21NS108098.
Footnotes
Appendix A. Supplementary data
Supplementary data to this article can be found online at https://doi.org/10.1016/j.biomaterials.2020.119767.
References
- [1].Collinger JL, Wodlinger B, Downey JE, Wang W, Tyler-Kabara EC,Weber DJ, McMorland AJ, Velliste M, Boninger ML, Schwartz AB, High-performance neuroprosthetic control by an individual with tetraplegia, Lancet 381 (9866) (2012) 557–564. [DOI] [PMC free article] [PubMed] [Google Scholar]
- [2].Wang W, Collinger JL, Degenhart AD, Tyler-Kabara EC, Schwartz AB, Moran DW, Weber DJ, Wodlinger B, Vinjamuri RK, Ashmore RC, Kelly JW, Boninger ML, An electrocorticographic brain interface in an individual with tetraplegia, PLoS One 8 (2) (2013) e55344. [DOI] [PMC free article] [PubMed] [Google Scholar]
- [3].Wodlinger B, Downey JE, Tyler-Kabara EC, Schwartz AB, Boninger ML, Collinger JL, Ten-dimensional anthropomorphic arm control in a human brain-machine interface: difficulties, solutions, and limitations, J. Neural Eng 12 (1) (2015) 016011. [DOI] [PubMed] [Google Scholar]
- [4].Simeral JD, Kim SP, Black MJ, Donoghue JP, Hochberg LR, Neural control of cursor trajectory and click by a human with tetraplegia 1000 days after implant of an intracortical microelectrode array, J. Neural Eng 8 (2) (2011) 025027. [DOI] [PMC free article] [PubMed] [Google Scholar]
- [5].Tabot GA, Dammann JF, Berg JA, Tenore FV, Boback JL, Vogelstein RJ, Bensmaia SJ, Restoring the sense of touch with a prosthetic hand through a brain interface, Proc. Natl. Acad. Sci. U. S. A 110 (45) (2013) 18279–18284. [DOI] [PMC free article] [PubMed] [Google Scholar]
- [6].Kim S, Callier T, Tabot GA, Gaunt RA, Tenore FV, Bensmaia SJ, Behavioral assessment of sensitivity to intracortical microstimulation of primate somatosensory cortex, Proc. Natl. Acad. Sci 112 (49) (2015) 15202. [DOI] [PMC free article] [PubMed] [Google Scholar]
- [7].Flesher SN, Collinger JL, Foldes ST, Weiss JM, Downey JE, Tyler-Kabara EC, Bensmaia SJ, Schwartz AB, Boninger ML, Gaunt RA, Intracortical microstimulation of human somatosensory cortex, Sci. Transl. Med (2016) aaf8083. [DOI] [PubMed] [Google Scholar]
- [8].Armenta Salas M, Bashford L, Kellis S, Jafari M, Jo H, Kramer D, Shanfield K,Pejsa K, Lee B, Liu CY, Andersen RA, Proprioceptive and cutaneous sensations in humans elicited by intracortical microstimulation, eLife 7 (2018) e32904. [DOI] [PMC free article] [PubMed] [Google Scholar]
- [9].Hiremath SV, Tyler-Kabara EC, Wheeler JJ, Moran DW, Gaunt RA,Collinger JL, Foldes ST, Weber DJ, Chen W, Boninger ML, Wang W, Human perception of electrical stimulation on the surface of somatosensory cortex, PLoS One 12 (5) (2017) e0176020. [DOI] [PMC free article] [PubMed] [Google Scholar]
- [10].Boyden ES, Zhang F, Bamberg E, Nagel G, Deisseroth K, Millisecond-timescale, genetically targeted optical control of neural activity, Nat. Neurosci 8 (9) (2005) 1263. [DOI] [PubMed] [Google Scholar]
- [11].Wellman SM, Eles JR, Ludwig KA, Seymour JP, Michelson NJ,McFadden WE, Vazquez AL, Kozai TDY, A materials roadmap to functional neural interface design, Adv. Funct. Mater 28 (12) (2018) 201701269. [DOI] [PMC free article] [PubMed] [Google Scholar]
- [12].Stocking KC, Vazquez AL, Kozai TDY, Intracortical neural stimulation with untethered, ultrasmall carbon fiber electrodes mediated by the photoelectric effect, IEEE (Inst. Electr. Electron. Eng.) Trans. Biomed. Eng 66 (8) (2019) 2402–2412. [DOI] [PubMed] [Google Scholar]
- [13].Golabchi A, Wu B, Li X, Carlisle DL, Kozai TDY, Friedlander RM, Cui XT, Melatonin improves quality and longevity of chronic neural recording, Biomaterials 180 (2018) 225–239. [DOI] [PMC free article] [PubMed] [Google Scholar]
- [14].Lind G, Linsmeier CE, Schouenborg J, The density difference between tissue and neural probes is a key factor for glial scarring, Sci. Rep 3 (2013) 11830–11838. [DOI] [PMC free article] [PubMed] [Google Scholar]
- [15].Wellman SM, Li L, Yaxiaer Y, McNamara IN, Kozai TDY, Revealing spatial and temporal patterns of cell death, glial proliferation, and blood-brain barrier dysfunction around implanted intracortical neural interfaces, Front. Neurosci 13 (2019) 493. [DOI] [PMC free article] [PubMed] [Google Scholar]
- [16].Wellman SM, Kozai TDY, In vivo spatiotemporal dynamics of NG2 glia activity caused by neural electrode implantation, Biomaterials 164 (2018) 121–133. [DOI] [PMC free article] [PubMed] [Google Scholar]
- [17].Wellman SM, Cambi F, Kozai TDY, The role of oligodendrocytes and their progenitors on neural interface technology: a novel perspective on tissue regeneration and repair, Biomaterials 183 (2018) 200–217. [DOI] [PMC free article] [PubMed] [Google Scholar]
- [18].Eles JR, Vazquez AL, Snyder NR, Lagenaur CF, Murphy MC, Kozai TDY,Cui XT, Neuroadhesive L1 coating attenuates acute microglial attachment to neural electrodes as revealed by live two-photon microscopy, Biomaterials 113 (2017) 279–292. [DOI] [PMC free article] [PubMed] [Google Scholar]
- [19].Salatino JW, Ludwig KA, Kozai TDY, Purcell EK, Glial responses to implanted electrodes in the brain, Nature BME 1 (2017) 862–877. [DOI] [PMC free article] [PubMed] [Google Scholar]
- [20].Kozai TDY, Eles JR, Vazquez AL, Cui XT, Two-photon imaging of chronically implanted neural electrodes: sealing methods and new insights, J. Neurosci. Methods 256 (2016) 46–55. [DOI] [PMC free article] [PubMed] [Google Scholar]
- [21].Kozai TDY, Jaquins-gerstl AS, Vazquez AL, Michael AC, Cui XT, Dexamethasone retrodialysis attenuates microglial response to implanted probes in vivo, Biomaterials 87 (2016) 157–169. [DOI] [PMC free article] [PubMed] [Google Scholar]
- [22].Kozai TDY, Jaquins-Gerstl A, Vazquez AL, Michael AC, Cui XT, Brain tissue responses to neural implants impact signal sensitivity and intervention strategies, ACS Chem. Neurosci 6 (1) (2015) 48–67. [DOI] [PMC free article] [PubMed] [Google Scholar]
- [23].Kozai TDY, Gugel Z, Li X, Gilgunn PJ, Khilwani R, Ozdoganlar OB,Fedder GK, Weber DJ, Cui XT, Chronic tissue response to carboxymethyl cellulose based dissolvable insertion needle for ultra-small neural probes, Biomaterials 35 (34) (2014) 9255–9268. [DOI] [PubMed] [Google Scholar]
- [24].Kozai TDY, Langhals NB, Patel PR, Deng X, Zhang H, Smith KL, Lahann J, Kotov NA, Kipke DR, Ultrasmall implantable composite microelectrodes with bioactive surfaces for chronic neural interfaces, Nat. Mater 11 (12) (2012) 1065–1073. [DOI] [PMC free article] [PubMed] [Google Scholar]
- [25].Kozai TDY, Vazquez AL, Weaver CL, Kim S-G, Cui XT, In vivo two-photon microscopy reveals immediate microglial reaction to implantation of microelectrode through extension of processes, J. Neural Eng 9 (6) (2012) 066001–066001. [DOI] [PMC free article] [PubMed] [Google Scholar]
- [26].Bedell HW, Hermann JK, Ravikumar M, Lin S, Rein A, Li X, Molinich E, Smith PD, Selkirk SM, Miller RH, Sidik S, Taylor DM, Capadona JR, Targeting CD14 on blood derived cells improves intracortical microelectrode performance, Biomaterials 163 (2018) 163–173. [DOI] [PMC free article] [PubMed] [Google Scholar]
- [27].Cody PA, Eles JR, Lagenaur CF, Kozai TDY, Cui XT, Unique electrohysiological and impedance signatures between encapsulation types: an analysis of biological Utah array failure and benefit of a biomimetic coating in a rat model, Biomaterials 161 (2018) 117–128. [DOI] [PMC free article] [PubMed] [Google Scholar]
- [28].Eles J, Vazquez A, Kozai TDY, Cui X, Meningeal inflammatory response and fibrous tissue remodeling around intracortical implants: an in Vivo two-photon imaging study, Biomaterials 195 (2018) 111–123. [DOI] [PMC free article] [PubMed] [Google Scholar]
- [29].Michelson NJ, Vazquez AL, Eles JR, Salatino JW, Purcell EK, Williams JJ,Cui XT, Kozai TDY, Multi-scale, multi-modal analysis uncovers complex relationship at the brain tissue-implant neural interface: new Emphasis on the Biological Interface, J. Neural Eng 15 (2018) 033001. [DOI] [PMC free article] [PubMed] [Google Scholar]
- [30].Kozai TDY, Li X, Bodily LM, Caparosa EM, Zenonos GA, Carlisle DL, Friedlander RM, Cui XT, Effects of caspase-1 knockout on chronic neural recording quality and longevity: insight into cellular and molecular mechanisms of the reactive tissue response, Biomaterials 35 (36) (2014) 9620–9634. [DOI] [PMC free article] [PubMed] [Google Scholar]
- [31].Kozai TDY, Langhals NB, Patel PR, Deng X, Zhang H, Smith KL, Lahann J, Kotov NA, Kipke DR, Ultrasmall implantable composite microelectrodes with bioactive surfaces for chronic neural interfaces, Nat. Mater 11 (12) (2012) 1065–1073. [DOI] [PMC free article] [PubMed] [Google Scholar]
- [32].Kozai TDY, Marzullo TC, Hooi F, Langhals NB, Majewska AK, Brown EB, Kipke DR, Reduction of neurovascular damage resulting from microelectrode insertion into the cerebral cortex using in vivo two-photon mapping, J. Neural Eng 7 (4) (2010) 046011. [DOI] [PMC free article] [PubMed] [Google Scholar]
- [33].Bennett C, Mohammed F, Álvarez-Ciara A, Nguyen MA, Dietrich WD,Rajguru SM, Streit WJ, Prasad A, Neuroinflammation, oxidative stress, and blood-brain barrier (BBB) disruption in acute Utah electrode array implants and the effect of deferoxamine as an iron chelator on acute foreign body response, Biomaterials 188 (2019) 144–159. [DOI] [PMC free article] [PubMed] [Google Scholar]
- [34].Nolta NF, Christensen MB, Crane PD, Skousen JL, Tresco PA, BBB leakage, astrogliosis, and tissue loss correlate with silicon microelectrode array recording performance, Biomaterials 53 (2015) 753–762. [DOI] [PubMed] [Google Scholar]
- [35].Potter KA, Jorfi M, Householder KT, Foster EJ, Weder C, Capadona JR, Curcumin-releasing mechanically adaptive intracortical implants improve the proximal neuronal density and blood-brain barrier stability, Acta Biomater. 10 (5) (2014) 2209–2222. [DOI] [PubMed] [Google Scholar]
- [36].Hammer DX, Lozzi A, Abliz E, Greenbaum N, Agrawal A, Krauthamer V, Welle CG, Longitudinal vascular dynamics following cranial window and electrode implantation measured with speckle variance optical coherence angiography, Biomed. Opt. Express 5 (8) (2014) 2823–2836. [DOI] [PMC free article] [PubMed] [Google Scholar]
- [37].Saxena T, Karumbaiah L, Gaupp EA, Patkar R, Patil K, Betancur M,Stanley GB, Bellamkonda RV, The Impact of chronic blood-brain barrier breach on intracortical electrode function, 20th ed. Biomaterials 34 (2013) 4703–4713. [DOI] [PubMed] [Google Scholar]
- [38].Potter KA, Buck AC, Self WK, Callanan ME, Sunil S, Capadona JR, The effect of resveratrol on neurodegeneration and blood brain barrier stability surrounding intracortical microelectrodes, Biomaterials 34 (29) (2013) 7001–7015. [DOI] [PubMed] [Google Scholar]
- [39].Kozai TDY, Vazquez AL, Weaver CL, Kim SG, Cui XT, In vivo two-photon microscopy reveals immediate microglial reaction to implantation of microelectrode through extension of processes, J. Neural Eng 9 (6) (2012) 066001. [DOI] [PMC free article] [PubMed] [Google Scholar]
- [40].Bjornsson CS, Oh SJ, Al-Kofahi YA, Lim YJ, Smith KL, Turner JN, De S,Roysam B, Shain W, Kim SJ, Effects of insertion conditions on tissue strain and vascular damage during neuroprosthetic device insertion, J. Neural Eng 3 (3) (2006) 196–207. [DOI] [PubMed] [Google Scholar]
- [41].Johnson MD, Kao OE, Kipke DR, Spatiotemporal pH dynamics following insertion of neural microelectrode arrays, J. Neurosci. Methods 160 (2) (2007) 276–287. [DOI] [PubMed] [Google Scholar]
- [42].McConnell GC, Rees HD, Levey AI, Gutekunst CA, Gross RE,Bellamkonda RV, Implanted neural electrodes cause chronic, local inflammation that is correlated with local neurodegeneration, J. Neural Eng 6 (5) (2009) 56003. [DOI] [PubMed] [Google Scholar]
- [43].Eles J, Vazquez A, Kozai TDY, Cui X, In vivo imaging of neuronal calcium during electrode implantation: spatial and temporal mapping of damage and recovery, Biomaterials 174 (2018) 79–94. [DOI] [PMC free article] [PubMed] [Google Scholar]
- [44].Biran R, Martin DC, Tresco PA, Neuronal cell loss accompanies the brain tissue response to chronically implanted silicon microelectrode arrays, Exp. Neurol 195 (1) (2005) 115–126. [DOI] [PubMed] [Google Scholar]
- [45].Chakravarty MM, Hamani C, Martinez-Canabal A, Ellegood J, Laliberte C, Nobrega JN, Sankar T, Lozano AM, Frankland PW, Lerch JP, Deep brain stimulation of the ventromedial prefrontal cortex causes reorganization of neuronal processes and vasculature, Neuroimage 125 (2016) 422–427. [DOI] [PubMed] [Google Scholar]
- [46].Pudenz RH, Bullara LA, Jacques S, Hambrecht FT, Electrical stimulation of the brain. III. The neural damage model, Surg. Neurol 4 (4) (1975) 389–400. [PubMed] [Google Scholar]
- [47].Pudenz RH, Bullara LA, Dru D, Talalla A, Electrical stimulation of the brain. II. Effects on the blood-brain barrier, Surg. Neurol 4 (2) (1975) 265–270. [PubMed] [Google Scholar]
- [48].Agnew WF, Yuen TG, Pudenz RH, Bullara LA, Electrical stimulation of the brain. IV. Ultrastructural studies, Surg. Neurol 4 (5) (1975) 438–448. [PubMed] [Google Scholar]
- [49].Campbell A, Wu C, Chronically implanted intracranial electrodes: tissue reaction and electrical changes, Micromachines 9 (9) (2018) 430. [DOI] [PMC free article] [PubMed] [Google Scholar]
- [50].Grill WM, Reichert W, Signal Considerations for Chronically Implanted Electrodes for Brain Interfacing, Indwelling Neural Implants: Strategies for Contending with the In Vivo Environment. CRC Press/Taylor & Francis, Boca Raton (FL), 2008, pp. 42–58. [Google Scholar]
- [51].McCreery D, Pikov V, Troyk PR, Neuronal loss due to prolonged controlled-current stimulation with chronically implanted microelectrodes in the cat cerebral cortex, J. Neural Eng 7 (3) (2010) 036005. [DOI] [PMC free article] [PubMed] [Google Scholar]
- [52].McCreery DB, Yuen TG, Agnew WF, Bullara LA, A characterization of the effects on neuronal excitability due to prolonged microstimulation with chronically implanted microelectrodes, IEEE Trans. Biomed. Eng 44 (10) (1997) 931–939. [DOI] [PubMed] [Google Scholar]
- [53].Mccreery DB, Agnew WF, Yuen TGH, Bullara L, Charge-density and charge per phase as cofactors in neural injury induced by electrical-stimulation, IEEE Tech. Bio. Med. Eng 37 (10) (1990) 996–1001. [DOI] [PubMed] [Google Scholar]
- [54].McCreery DB, Agnew WF, Yuen TG, Bullara LA, Comparison of neural damage induced by electrical stimulation with faradaic and capacitor electrodes, Ann. Biomed. Eng 16 (5) (1988) 463–481. [DOI] [PubMed] [Google Scholar]
- [55].Yuen TG, Agnew WF, Bullara LA, Jacques S, McCreery DB, Histological evaluation of neural damage from electrical stimulation: considerations for the selection of parameters for clinical application, Neurosurgery 9 (3) (1981) 292–299. [PubMed] [Google Scholar]
- [56].Rajan AT, Boback JL, Dammann JF, Tenore FV, Wester BA, Otto KJ, Gaunt RA, Bensmaia SJ, The effects of chronic intracortical microstimulation on neural tissue and fine motor behavior, J. Neural Eng 12 (6) (2015) 066018. [DOI] [PMC free article] [PubMed] [Google Scholar]
- [57].Ferroni CG, Maranesi M, Livi A, Lanzilotto M, Bonini L, Comparative performance of linear multielectrode probes and single-tip electrodes for intracortical microstimulation and single-neuron recording in macaque monkey, Front. Syst. Neurosci 11 (2017) 84–84. [DOI] [PMC free article] [PubMed] [Google Scholar]
- [58].Wellman SM, Eles JR, Ludwig KA, Seymour JP, Michelson NJ,McFadden WE, Vazquez AL, Kozai TDY, A materials roadmap to functional neural interface design, Adv. Funct. Mater 28 (12) (2017) 1701269. [DOI] [PMC free article] [PubMed] [Google Scholar]
- [59].Kozai TDY, Alba NA, Zhang H, Kotov NA, Gaunt RA, Cui XT, Nanostructured coatings for improved charge delivery to neurons, in: De Vittorio M, Martiradonna L, Assad J (Eds.), Nanotechnology and Neuroscience: Nano-Electronic, Photonic and Mechanical Neuronal Interfacing, Springer New York, New York, NY, 2014, pp. 71–134. [Google Scholar]
- [60].Du ZJ, Kolarcik CL, Kozai TDY, Luebben SD, Sapp SA, Zheng XS,Nabity JA, Cui XT, Ultrasoft microwire neural electrodes improve chronic tissue integration, Acta Biomater. 53 (2017) 46–58. [DOI] [PMC free article] [PubMed] [Google Scholar]
- [61].Du ZJ, Luo X, Weaver CL, Cui XT, Poly(3,4-ethylenedioxythiophene)-ionic liquid coating improves neural recording and stimulation functionality of MEAs, J. Mater. Chem. C 3 (25) (2015) 6515–6524. [DOI] [PMC free article] [PubMed] [Google Scholar]
- [62].Kolarcik CL, Catt K, Rost E, Albrecht IN, Bourbeau D, Du Z, Kozai TDY,Luo X, Weber DJ, Cui XT, Evaluation of poly(3,4-ethylenedioxythiophene)/carbon nanotube neural electrode coatings for stimulation in the dorsal root ganglion, J. Neural Eng 12 (2015) 016008. [DOI] [PMC free article] [PubMed] [Google Scholar]
- [63].Lai HY, Liao LD, Lin CT, Hsu JH, He X, Chen YY, Chang JY, Chen HF,Tsang S, Shih YYI, Design, simulation and experimental validation of a novel flexible neural probe for deep brain stimulation and multichannel recording, J. Neural Eng 9 (3) (2012). [DOI] [PubMed] [Google Scholar]
- [64].Luo X, Weaver CL, Zhou DD, Greenberg R, Cui XT, Highly stable carbon nanotube doped poly(3,4-ethylenedioxythiophene) for chronic neural stimulation, Biomaterials 32 (24) (2011) 5551–5557. [DOI] [PMC free article] [PubMed] [Google Scholar]
- [65].Cui XT, Zhou DD, Poly (3,4-ethylenedioxythiophene) for chronic neural stimulation, IEEE Trans. Neural Syst. Rehabil. Eng 15 (4) (2007) 502–508. [DOI] [PubMed] [Google Scholar]
- [66].Beebe X, Rose TL, Charge injection limits of activated iridium oxide electrodes with 0.2 ms pulses in bicarbonate buffered saline (neurological stimulation application), IEEE Tech. Bio. Med. Eng 35 (6) (1988) 494–495. [DOI] [PubMed] [Google Scholar]
- [67].Dymond AM, Characteristics of the metal-tissue interface of stimulation electrodes, IEEE Tech. Bio. Med. Eng. BME 23 (4) (1976) 274–280. [DOI] [PubMed] [Google Scholar]
- [68].Cogan SF, Ludwig KA, Welle CG, Takmakov P, Tissue damage thresholds during therapeutic electrical stimulation, J. Neural Eng 13 (2) (2016) 021001. [DOI] [PMC free article] [PubMed] [Google Scholar]
- [69].Cogan SF, Ehrlich J, Plante TD, Smirnov A, Shire DB, Gingerich M, Rizzo JF, Sputtered iridium oxide films for neural stimulation electrodes, J. Biomed. Mater. Res. B 89B (2) (2009) 353–361. [DOI] [PMC free article] [PubMed] [Google Scholar]
- [70].Cogan SF, Neural stimulation and recording electrodes, Annu. Rev. Biomed. Eng 10 (1) (2008) 275–309. [DOI] [PubMed] [Google Scholar]
- [71].Cogan S, Peramunage D, Smirnov A, Ehrlich J, McCreery D,Manoonkitiwongsa P, Polyethylenedioxythiophene (PEDOT) coatings for neural stimulation and recording electrodes, Mater. Res. Soc. Meet (2007) Abstr. QQ2. 7). [Google Scholar]
- [72].Cogan SF, Troyk PR, Ehrlich J, Plante TD, Detlefsen DE, Potential-biased, asymmetric waveforms for charge-injection with activated iridium oxide (AIROF) neural stimulation electrodes, IEEE Trans. Biomed. Eng 53 (2) (2006) 327–332. [DOI] [PubMed] [Google Scholar]
- [73].Cogan SF, Plante TD, Ehrlich J, Sputtered iridium oxide films (SIROFs) for low-impedance neural stimulation and recording electrodes, Conf. Proc. IEEE Eng. Med. Biol. Soc 6 (2004) 4153–4156. [DOI] [PMC free article] [PubMed] [Google Scholar]
- [74].Cogan SF, Guzelian AA, Agnew WF, Yuen TG, McCreery DB, Over-pulsing degrades activated iridium oxide films used for intracortical neural stimulation, J. Neurosci. Methods 137 (2) (2004) 141–150. [DOI] [PubMed] [Google Scholar]
- [75].Meyer RD, Cogan SF, Nguyen TH, Rauh RD, Electrodeposited iridium oxide for neural stimulation and recording electrodes, IEEE Trans. Neural Syst. Rehabil. Eng 9 (1) (2001) 2–11. [DOI] [PubMed] [Google Scholar]
- [76].Histed MH, Bonin V, Reid RC, Direct activation of sparse, distributed populations of cortical neurons by electrical microstimulation, Neuron 63 (4) (2009) 508–522. [DOI] [PMC free article] [PubMed] [Google Scholar]
- [77].Platia EV, Brinker JAJP, Electrophysiology C, Time course of transvenous pacemaker stimulation impedance, capture threshold, and electrogram amplitude vol. 9, (1986), pp. 620–625 5. [DOI] [PubMed] [Google Scholar]
- [78].Koivuniemi A, Wilks SJ, Woolley AJ, Otto KJ, Multimodal, longitudinal assessment of intracortical microstimulation, Prog. Brain Res (2011) 131–144 Elsevier. [DOI] [PMC free article] [PubMed] [Google Scholar]
- [79].Gittis A, Probing new targets for movement disorders, Sci. Adv 361 (6401) (2018) 462–462. [DOI] [PubMed] [Google Scholar]
- [80].Sridharan A, Rajan SD, Muthuswamy J, Long-term changes in the material properties of brain tissue at the implant–tissue interface, J. Neural Eng 10 (2013) 066001. [DOI] [PMC free article] [PubMed] [Google Scholar]
- [81].Stoney SD Jr., W.D. Thompson, H. Asanuma, Excitation of pyramidal tract cells by intracortical microstimulation: effective extent of stimulating current, J. Neurophysiol 31 (5) (1968) 659–669. [DOI] [PubMed] [Google Scholar]
- [82].Tehovnik EJ, Electrical stimulation of neural tissue to evoke behavioral responses, J. Neurosci. Methods 65 (1) (1996) 1–17. [DOI] [PubMed] [Google Scholar]
- [83].Tehovnik EJ, Tolias AS, Sultan F, Slocum WM, Logothetis NK, Direct and indirect activation of cortical neurons by electrical microstimulation, J. Neurophysiol 96 (2) (2006) 512–521. [DOI] [PubMed] [Google Scholar]
- [84].McIntyre CC, Grill WM, Selective microstimulation of central nervous system neurons, Ann. Biomed. Eng 28 (3) (2000) 219–233. [DOI] [PubMed] [Google Scholar]
- [85].Ranck JB Jr., Which elements are excited in electrical stimulation of mammalian central nervous system: a review, Brain Res. 98 (3) (1975) 417–440. [DOI] [PubMed] [Google Scholar]
- [86].Kim S, Callier T, Bensmaia S, A computational model that predicts behavioral sensitivity to intracortical microstimulation, J. Neural Eng 14 (2016) 016012. [DOI] [PMC free article] [PubMed] [Google Scholar]
- [87].Overstreet C, Klein J, Tillery S, Computational modeling of direct neuronal recruitment during intracortical microstimulation in somatosensory cortex, J. Neural Eng 10 (2013) 066016. [DOI] [PubMed] [Google Scholar]
- [88].Tanaka Y, Nomoto T, Shiki T, Sakata Y, Shimada Y, Hayashida Y, Yagi T, Focal activation of neuronal circuits induced by microstimulation in the visual cortex, J. Neural Eng 16 (3) (2019) 036007. [DOI] [PubMed] [Google Scholar]
- [89].Osanai M, Tanaka S, Takeno Y, Takimoto S, Yagi T, Spatiotemporal properties of the action potential propagation in the mouse visual cortical slice analyzed by calcium imaging, PLoS One 5 (10) (2010) e13738. [DOI] [PMC free article] [PubMed] [Google Scholar]
- [90].Brock AA, Friedman RM, Fan RH, Roe AW, Optical imaging of cortical networks via intracortical microstimulation, J. Neurophysiol 110 (11) (2013) 2670–2678. [DOI] [PMC free article] [PubMed] [Google Scholar]
- [91].Hussin AT, Boychuk JA, Brown AR, Pittman QJ, Teskey GC, Intracortical microstimulation (ICMS) activates motor cortex layer 5 pyramidal neurons mainly transsynaptically, Brain Stimul. 8 (4) (2015) 742–750. [DOI] [PubMed] [Google Scholar]
- [92].Tehovnik EJ, Slocum WM, Two-photon imaging and the activation of cortical neurons, Neuroscience 245 (2013) 12–25. [DOI] [PubMed] [Google Scholar]
- [93].Butovas S, Schwarz C, Spatiotemporal effects of microstimulation in rat neo-cortex: a parametric study using multielectrode recordings, J. Neurophysiol 90 (5) (2003) 3024–3039. [DOI] [PubMed] [Google Scholar]
- [94].Zhang J, Zhang S, Yu C, Zheng X, Xu K, Intrinsic optical imaging study on cortical responses to electrical stimulation in ventral posterior medial nucleus of thalamus, Brain Res. 1684 (2018) 40–49. [DOI] [PubMed] [Google Scholar]
- [95].Michelson NJ, Eles JR, Vazquez AL, Ludwig KA, Kozai TDY, Calcium activation of cortical neurons by continuous electrical stimulation: frequency dependence, temporal fidelity, and activation density, J. Neurosci. Res 97 (5) (2019) 620–638. [DOI] [PMC free article] [PubMed] [Google Scholar]
- [96].Margalit SN, Slovin H, Spatio-temporal characteristics of population responses evoked by microstimulation in the barrel cortex, Sci. Rep 8 (1) (2018) 13913. [DOI] [PMC free article] [PubMed] [Google Scholar]
- [97].Swadlow HA, Kocsis JD, Waxman SG, Modulation of impulse conduction along the axonal tree, Annu. Rev. Biophys. Bioeng 9 (1980) 143–179. [DOI] [PubMed] [Google Scholar]
- [98].Radivojevic M, Jäckel D, Altermatt M, Müller J, Viswam V, Hierlemann A, Bakkum DJ, Electrical identification and selective microstimulation of neuronal compartments based on features of extracellular action potentials, Sci. Rep 6 (2016) 31332. [DOI] [PMC free article] [PubMed] [Google Scholar]
- [99].Yi G, Grill W, Frequency-dependent antidromic activation in thalamocortical relay neurons: effects of synaptic inputs, J. Neural Eng 15 (2018) 056001. [DOI] [PMC free article] [PubMed] [Google Scholar]
- [100].Chen Q, Cichon J, Wang W, Qiu L, Lee S.-Jin R., Campbell Nolan R., DeStefino N, Goard Michael J., Fu Z, Yasuda R, Looger Loren L., Arenkiel Benjamin R., Gan W-B, Feng G, Imaging neural activity using thy1-GCaMP transgenic mice, Neuron 76 (2) (2012) 297–308. [DOI] [PMC free article] [PubMed] [Google Scholar]
- [101].Marvin JS, Borghuis BG, Tian L, Cichon J, Harnett MT, Akerboom J,Gordus A, Renninger SL, Chen TW, Bargmann CI, Orger MB, Schreiter ER, Demb JB, Gan WB, Hires SA, Looger LL, An optimized fluorescent probe for visualizing glutamate neurotransmission, Nat. Methods 10 (2) (2013) 162–170. [DOI] [PMC free article] [PubMed] [Google Scholar]
- [102].Eles JR, Vazquez AL, Kozai TDY, Cui XT, In vivo imaging of neuronal calcium during electrode implantation: spatial and temporal mapping of damage and recovery, Biomaterials 174 (2018) 79–94. [DOI] [PMC free article] [PubMed] [Google Scholar]
- [103].Eick S, Wallys J, Hofmann B, Van Ooyen A, Schnakenberg U, Ingebrandt S,Offenhäusser A, Iridium oxide microelectrode arrays for in vitro stimulation of individual rat neurons from dissociated cultures, Front. Neuroeng 2 (16) (2009). [DOI] [PMC free article] [PubMed] [Google Scholar]
- [104].Eles JR, Vazquez AL, Kozai TDY, Cui XT, Meningeal inflammatory response and fibrous tissue remodeling around intracortical implants: an in vivo two-photon imaging study, Biomaterials 195 (2019) 111–123. [DOI] [PMC free article] [PubMed] [Google Scholar]
- [105].Kozai TDY, Eles JR, Vazquez AL, Cui XT, Two-photon imaging of chronically implanted neural electrodes: sealing methods and new insights, J. Neurosci. Methods 258 (2016) 46–55. [DOI] [PMC free article] [PubMed] [Google Scholar]
- [106].Wellman SM, Kozai TDY, In vivo spatiotemporal dynamics of NG2 glia activity caused by neural electrode implantation, Biomaterials 164 (2018) 121–133. [DOI] [PMC free article] [PubMed] [Google Scholar]
- [107].Kozai TDY, Marzullo TC, Hooi F, Langhals NB, Majewska AK, Brown EB, Kipke DR, Reduction of neurovascular damage resulting from microelectrode insertion into the cerebral cortex using in vivo two-photon mapping, J. Neural Eng 7 (2010) 046011. [DOI] [PMC free article] [PubMed] [Google Scholar]
- [108].Kim S, Callier T, Bensmaia SJ, A computational model that predicts behavioral sensitivity to intracortical microstimulation, J. Neural Eng 14 (1) (2017) 016012. [DOI] [PMC free article] [PubMed] [Google Scholar]
- [109].Armbruster M, Hanson E, Dulla CG, Glutamate clearance is locally modulated by presynaptic neuronal activity in the cerebral cortex, J. Neurosci 36 (40) (2016) 10404–10415. [DOI] [PMC free article] [PubMed] [Google Scholar]
- [110].Hefendehl JK, LeDue J, Ko RWY, Mahler J, Murphy TH, MacVicar BA, Mapping synaptic glutamate transporter dysfunction in vivo to regions surrounding Aβ plaques by iGluSnFR two-photon imaging, Nat. Commun 7 (1) (2016) 13441. [DOI] [PMC free article] [PubMed] [Google Scholar]
- [111].Marvin JS, Scholl B, Wilson DE, Podgorski K, Kazemipour A, Müller JA,Schoch S, Quiroz FJU, Rebola N, Bao H, Little JP, Tkachuk AN, Cai E, Hantman AW, Wang SSH, DePiero VJ, Borghuis BG, Chapman ER,Dietrich D, DiGregorio DA, Fitzpatrick D, Looger LL, Stability, affinity, and chromatic variants of the glutamate sensor iGluSnFR, Nat. Methods 15 (11) (2018) 936–939. [DOI] [PMC free article] [PubMed] [Google Scholar]
- [112].Parsons MP, Vanni MP, Woodard CL, Kang R, Murphy TH, Raymond LA, Real-time imaging of glutamate clearance reveals normal striatal uptake in Huntington disease mouse models, Nat. Commun 7 (2016) 11251–11251. [DOI] [PMC free article] [PubMed] [Google Scholar]
- [113].Akerboom J, Chen T-W, Wardill TJ, Tian L, Marvin JS, Mutlu S, Calderón NC, Esposti F, Borghuis BG, Sun XR, Gordus A, Orger MB,Portugues R, Engert F, Macklin JJ, Filosa A, Aggarwal A, Kerr R, Takagi R,Kracun S, Shigetomi E, Khakh BS, Baier H, Lagnado L, Wang SSH,Bargmann CI, Kimmel BE, Jayaraman V, Svoboda K, Kim DS, Schreiter ER,Looger LL, Optimization of a GCaMP calcium indicator for neural activity imaging, J. Neurosci. : Off. J. Soc. Neurosci 32 (40) (2012) 13819–13840. [DOI] [PMC free article] [PubMed] [Google Scholar]
- [114].Dana H, Chen TW, Hu A, Shields BC, Guo C, Looger LL, Kim DS, Svoboda K, Thy1-GCaMP6 transgenic mice for neuronal population imaging in vivo, PLoS One 9 (9) (2014) e108697. [DOI] [PMC free article] [PubMed] [Google Scholar]
- [115].Sugino K, Hempel CM, Miller MN, Hattox AM, Shapiro P, Wu C, Huang ZJ, Nelson SB, Molecular taxonomy of major neuronal classes in the adult mouse forebrain, Nat. Neurosci 9 (1) (2006) 99. [DOI] [PubMed] [Google Scholar]
- [116].Romanos J, Benke D, Saab AS, Zeilhofer HU, Santello M, Differences in glutamate uptake between cortical regions impact neuronal NMDA receptor activation, Commun. Biol 2 (2019) 127. [DOI] [PMC free article] [PubMed] [Google Scholar]
- [117].Kügler S, Kilic E, Bähr M, Human synapsin 1 gene promoter confers highly neuron-specific long-term transgene expression from an adenoviral vector in the adult rat brain depending on the transduced area, Gene Ther. 10 (4) (2003) 337–347. [DOI] [PubMed] [Google Scholar]
- [118].Nathanson JL, Yanagawa Y, Obata K, Callaway EM, Preferential labeling of inhibitory and excitatory cortical neurons by endogenous tropism of adeno-associated virus and lentivirus vectors, Neuroscience 161 (2) (2009) 441–450. [DOI] [PMC free article] [PubMed] [Google Scholar]
- [119].Rattay F, The basic mechanism for the electrical stimulation of the nervous system, Neuroscience 89 (2) (1999) 335–346. [DOI] [PubMed] [Google Scholar]
- [120].Rattay F, Modeling the excitation of fibers under surface electrodes, IEEE (Inst. Electr. Electron. Eng.) Trans. Biomed. Eng 35 (3) (1988) 199–202. [DOI] [PubMed] [Google Scholar]
- [121].Cogan SF, Ludwig KA, Welle CG, Takmakov P, Tissue damage thresholds during therapeutic electrical stimulation, J. Neural Eng 13 (2016) 021001. [DOI] [PMC free article] [PubMed] [Google Scholar]
- [122].Wei XF, Grill WM, Analysis of high-perimeter planar electrodes for efficient neural stimulation, Front. Neuroeng 2 (2009) 15. [DOI] [PMC free article] [PubMed] [Google Scholar]
- [123].Ma Y, Shaik MA, Kozberg MG, Kim SH, Portes JP, Timerman D, Hillman EMC, Resting-state hemodynamics are spatiotemporally coupled to synchronized and symmetric neural activity in excitatory neurons, Proc. Natl. Acad. Sci 113 (52) (2016) E8463–E8471. [DOI] [PMC free article] [PubMed] [Google Scholar]
- [124].Murphy MC, Chan KC, Kim S-G, Vazquez AL, Macroscale variation in resting-state neuronal activity and connectivity assessed by simultaneous calcium imaging, hemodynamic imaging and electrophysiology, Neuroimage 169 (2018) 352–362. [DOI] [PMC free article] [PubMed] [Google Scholar]
- [125].Vazquez AL, Murphy MC, Kim S-G, Neuronal and physiological correlation to hemodynamic resting-state fluctuations in health and disease, Brain Connect. 4 (9) (2014) 727–740. [DOI] [PMC free article] [PubMed] [Google Scholar]
- [126].Kerr JND, Greenberg D, Helmchen F, Imaging input and output of neocortical networks in vivo, Proc. Natl. Acad. Sci. U.S.A 102 (39) (2005) 14063. [DOI] [PMC free article] [PubMed] [Google Scholar]
- [127].Debanne D, Information processing in the axon, Nat. Rev. Neurosci 5 (4) (2004) 304–316. [DOI] [PubMed] [Google Scholar]
- [128].Meeks JP, Mennerick S, Selective effects of potassium elevations on glutamate signaling and action potential conduction in hippocampus, J. Neurosci 24 (1) (2004) 197–206. [DOI] [PMC free article] [PubMed] [Google Scholar]
- [129].Kozai TDY, Alba NA, Zhang H, Kotov NA, Gaunt RA, Cui XT,Nanostructured Coatings for Improved Charge Delivery to Neurons, Nanotechnology and Neuroscience: Nano-Electronic, Photonic and Mechanical Neuronal Interfacing, Springer New York, New York, NY, 2014, pp. 71–134. [Google Scholar]
- [130].Bitzenhofer SH, Ahlbeck J, Wolff A, Wiegert JS, Gee CE, Oertner TG,Hanganu-Opatz IL, Layer-specific optogenetic activation of pyramidal neurons causes beta-gamma entrainment of neonatal networks, Nat. Commun 8 (2017) 14563. [DOI] [PMC free article] [PubMed] [Google Scholar]
- [131].Serwanski DR, Miralles CP, Christie SB, Mehta AK, Li X, De Blas AL, Synaptic and nonsynaptic localization of GABAA receptors containing the alpha5 subunit in the rat brain, J. Comp. Neurol 499 (3) (2006) 458–470. [DOI] [PMC free article] [PubMed] [Google Scholar]
- [132].Lorenzo LE, Russier M, Barbe A, Fritschy JM, Bras H, Differential organization of gamma-aminobutyric acid type A and glycine receptors in the somatic and dendritic compartments of rat abducens motoneurons, J. Comp. Neurol 504 (2) (2007) 112–126. [DOI] [PubMed] [Google Scholar]
- [133].Kerr JND, Denk W, Imaging in vivo: watching the brain in action, Nat. Rev. Neurosci 9 (2008) 195. [DOI] [PubMed] [Google Scholar]
- [134].Lee S, Meyer JF, Park J, Smirnakis SM, Visually driven neuropil activity and information encoding in mouse primary visual cortex, Front. Neural Circuits 11 (50) (2017). [DOI] [PMC free article] [PubMed] [Google Scholar]
- [135].Xiao Y, Agnesi F, Bello EM, Zhang S, Vitek JL, Johnson MD, Deep brain stimulation induces sparse distributions of locally modulated neuronal activity, Sci. Rep 8 (1) (2018) 2062. [DOI] [PMC free article] [PubMed] [Google Scholar]
- [136].Michelson NJ, Kozai TDY, Isoflurane and ketamine differentially influence spontaneous and evoked laminar electrophysiology in mouse V1, J. Neurophysiol 120 (5) (2018) 2232–2245. [DOI] [PMC free article] [PubMed] [Google Scholar]
- [137].McGirr A, LeDue J, Chan AW, Xie Y, Murphy TH, Cortical functional hyperconnectivity in a mouse model of depression and selective network effects of ketamine, Brain 140 (8) (2017) 2210–2225. [DOI] [PubMed] [Google Scholar]
- [138].Isaacson JS, Scanziani M, How inhibition shapes cortical activity, Neuron 72 (2) (2011) 231–243. [DOI] [PMC free article] [PubMed] [Google Scholar]
- [139].Tehovnik EJ, Slocum WM, Two-photon imaging and the activation of cortical neurons, Neuroscience 245 (2013) 12–25. [DOI] [PubMed] [Google Scholar]
- [140].Patel PR, Na K, Zhang H, Kozai TDY, Kotov NA, Yoon E, Chestek CA,Insertion of linear 8.4 μ m diameter 16 channel carbon fiber electrode arrays for single unit recordings, J. Neural Eng 12 (4) (2015) 046009. [DOI] [PMC free article] [PubMed] [Google Scholar]
- [141].Seymour JP, Kipke DR, Neural probe design for reduced tissue encapsulation in CNS, Biomaterials 28 (25) (2007) 3594–3607. [DOI] [PubMed] [Google Scholar]
- [142].Patel PR, Zhang H, Robbins MT, Nofar JB, Marshall SP, Kobylarek MJ, Kozai TDY, Kotov NA, Chestek CA, Chronic in vivo stability assessment of carbon fiber microelectrode arrays, J. Neural Eng 13 (6) (2016) 066002. [DOI] [PMC free article] [PubMed] [Google Scholar]
- [143].Guitchounts G, Markowitz JE, Liberti WA, Gardner TJ, A carbon-fiber electrode array for long-term neural recording, J. Neural Eng 10 (4) (2013) 046016. [DOI] [PMC free article] [PubMed] [Google Scholar]
- [144].Seymour JP, Langhals NB, Anderson DJ, Kipke DR, Novel multi-sided, microelectrode arrays for implantable neural applications, Biomed. Microdevices 13 (3) (2011) 441–451. [DOI] [PMC free article] [PubMed] [Google Scholar]
- [145].Kozai TDY, Catt K, Du Z, Na K, Srivannavit O, Haque R-UM, Seymour J, Wise KD, Yoon E, Cui XT, Chronic in vivo evaluation of PEDOT/CNT for stable neural recordings, IEEE Trans. Biomed. Eng 63 (2016) 111–119. [DOI] [PMC free article] [PubMed] [Google Scholar]
- [146].Ludwig KA, Uram JD, Yang J, Martin DC, Kipke DR, Chronic neural recordings using silicon microelectrode arrays electrochemically deposited with a poly(3,4-ethylenedioxythiophene) (PEDOT) film, J. Neural Eng 3 (1) (2006) 59–70. [DOI] [PubMed] [Google Scholar]
- [147].Alba NA, Du ZJ, Catt KA, Kozai TDY, Cui XT, In vivo electrochemical analysis of a PEDOT/MWCNT neural electrode coating, Biosensors 5 (2015) 618–646. [DOI] [PMC free article] [PubMed] [Google Scholar]
- [148].Kozai TDY, Catt K, Li X, Gugel ZV, Olafsson VT, Vazquez AL, Cui XT, Mechanical failure modes of chronically implanted planar silicon-based neural probes for laminar recording, Biomaterials 37 (2015) 25–39. [DOI] [PMC free article] [PubMed] [Google Scholar]
- [149].Lee HC, Ejserholm F, Gaire J, Currlin S, Schouenborg J, Wallman L,Bengtsson M, Park K, Otto KJ, Histological evaluation of flexible neural implants; flexibility limit for reducing the tissue response? J. Neural Eng 14 (3) (2017) 036026. [DOI] [PubMed] [Google Scholar]
- [150].Sohal HS, Clowry GJ, Jackson A, O’Neill A, Baker SN, Mechanical flexibility reduces the foreign body response to long-term implanted microelectrodes in rabbit cortex, PLoS One 11 (10) (2016) e0165606. [DOI] [PMC free article] [PubMed] [Google Scholar]
- [151].Kozai TDY, Kipke DR, Insertion shuttle with carboxyl terminated self-assembled monolayer coatings for implanting flexible polymer neural probes in the brain, J. Neurosci. Methods 184 (2) (2009) 199–205. [DOI] [PMC free article] [PubMed] [Google Scholar]
- [152].Khilwani R, Gilgunn PJ, Kozai TDY, Ong XC, Korkmaz E, Gunalan PK,Cui XT, Fedder GK, Ozdoganlar OB, Ultra-miniature ultra-compliant neural probes with dissolvable delivery needles: design, fabrication and characterization, Biomed. Microdevices 18 (6) (2016) 97. [DOI] [PubMed] [Google Scholar]
- [153].Nicolai E, Michelson N, Settell M, Hara S, Trevathan J, Asp A, Stocking K, Lujan J, Kozai T, Ludwig KJM, Design choices for next-generation neurotechnology can impact motion artifact in electrophysiological and fast-scan cyclic voltammetry measurements, 9 (10) (2018) 494. [DOI] [PMC free article] [PubMed] [Google Scholar]
- [154].Harris JP, Capadona JR, Miller RH, Healy BC, Shanmuganathan K, Rowan SJ, Weder C, Tyler DJ, Mechanically adaptive intracortical implants improve the proximity of neuronal cell bodies, J. Neural Eng 8 (6) (2011) 066011. [DOI] [PMC free article] [PubMed] [Google Scholar]
- [155].Ware T, Simon D, Liu C, Musa T, Vasudevan S, Sloan A, Keefer EW, Rennaker RL 2nd, Voit W, Thiol-ene/acrylate substrates for softening intracortical electrodes, J. Biomed. Mater. Res. B Appl. Biomater 102 (1) (2014) 1–11. [DOI] [PubMed] [Google Scholar]
- [156].Kolarcik CL, Luebben SD, Sapp SA, Hanner J, Snyder N, Kozai TDY,Chang E, Nabity JA, Nabity ST, Lagenaur CF, Elastomeric and soft conducting microwires for implantable neural interfaces, Soft Matter 11 (24) (2015) 4847–4861. [DOI] [PMC free article] [PubMed] [Google Scholar]
- [157].Cui X, Martin DC, Electrochemical deposition and characterization of poly (3, 4-ethylenedioxythiophene) on neural microelectrode arrays, Sens. Actuators B Chem 89 (1–2) (2003) 92–102. [Google Scholar]
- [158].Cui X, Martin DC, Fuzzy gold electrodes for lowering impedance and improving adhesion with electrodeposited conducting polymer films, Sens. Actuators A Phys 103 (3) (2003) 384–394. [Google Scholar]
- [159].Cui X, Hetke JF, Wiler JA, Anderson DJ, Martin DC, Electrochemical deposition and characterization of conducting polymer polypyrrole/PSS on multichannel neural probes, Sens. Actuators A Phys 93 (2001) 8–18. [Google Scholar]
- [160].Kozai TDY, Catt K, Du Z, Kyounghwan N, Srivannavit O, Haque RM, Seymour JP, Yoon E, Cui XT, Chronic in vivo evaluation of PEDOT/CNT for stable neural recordings, IEEE Trans. Biomed. Eng 63 (1) (2015) 111–119, 10.1109/TBME.2015.2445713. [DOI] [PMC free article] [PubMed] [Google Scholar]
- [161].Kolarcik CL, Bourbeau D, Azemi E, Rost E, Zhang L, Lagenaur CF, Weber DJ,Cui XT, In vivo effects of L1 coating on inflammation and neuronal health at the electrode-tissue interface in rat spinal cord and dorsal root ganglion, Acta Biomater 8 (10) (2012) 3561–3575. [DOI] [PMC free article] [PubMed] [Google Scholar]
- [162].Azemi E, Lagenaur CF, Cui XT, The surface immobilization of the neural adhesion molecule L1 on neural probes and its effect on neuronal density and gliosis at the probe/tissue interface, Biomaterials 32 (3) (2011) 681–692. [DOI] [PMC free article] [PubMed] [Google Scholar]
- [163].Zhong Y, Bellamkonda RV, Controlled release of anti-inflammatory agent [alpha]-MSH from neural implants, J. Control. Release 106 (3) (2005) 309–318. [DOI] [PubMed] [Google Scholar]
- [164].Nesbitt KM, Varner EL, Jaquins-Gerstl A, Michael AC, Microdialysis in the rat striatum: effects of 24 h dexamethasone retrodialysis on evoked dopamine release and penetration injury, ACS Chem. Neurosci 6 (1) (2015) 163–173. [DOI] [PMC free article] [PubMed] [Google Scholar]
- [165].Hue CD, Cho FS, Cao S, Dale Bass CR, Meaney DF, Morrison Iii B,Dexamethasone potentiates in vitro blood-brain barrier recovery after primary blast injury by glucocorticoid receptor-mediated upregulation of ZO-1 tight junction protein, J. Cereb. Blood Flow Metab 35 (7) (2015) 1191–1198. [DOI] [PMC free article] [PubMed] [Google Scholar]
- [166].Nesbitt KM, Jaquins-Gerstl A, Skoda EM, Wipf P, Michael AC,Pharmacological mitigation of tissue damage during brain microdialysis, Anal. Chem 85 (17) (2013) 8173–8179. [DOI] [PMC free article] [PubMed] [Google Scholar]
- [167].Luo X, Matranga C, Tan S, Alba N, Cui XT, Carbon nanotube nanoreservior for controlled release of anti-inflammatory dexamethasone, Biomaterials 32 (26) (2011) 6316–6323. [DOI] [PMC free article] [PubMed] [Google Scholar]
- [168].Jaquins-Gerstl A, Shu Z, Zhang J, Liu Y, Weber SG, Michael AC, Effect of dexamethasone on gliosis, ischemia, and dopamine extraction during microdialysis sampling in brain tissue, Anal. Chem 83 (20) (2011) 7662–7667. [DOI] [PMC free article] [PubMed] [Google Scholar]
- [169].Leprince L, Dogimont A, Magnin D, Demoustier-Champagne S, Dexamethasone electrically controlled release from polypyrrole-coated nanostructured electrodes,J. Mater. Sci. Mater. Med 21 (3) (2010) 925–930. [DOI] [PubMed] [Google Scholar]
- [170].Zhong Y, Bellamkonda RV, Dexamethasone-coated neural probes elicit attenuated inflammatory response and neuronal loss compared to uncoated neural probes, Brain Res. 1148 (2007) 15–27. [DOI] [PMC free article] [PubMed] [Google Scholar]
- [171].Wadhwa R, Lagenaur CF, Cui XT, Electrochemically controlled release of dexamethasone from conducting polymer polypyrrole coated electrode, J. Control. Release 110 (3) (2006) 531–541. [DOI] [PubMed] [Google Scholar]
- [172].Kim DH, Martin DC, Sustained release of dexamethasone from hydrophilic matrices using PLGA nanoparticles for neural drug delivery, Biomaterials 27 (15) (2006) 3031–3037. [DOI] [PubMed] [Google Scholar]
- [173].Spataro L, Dilgen J, Retterer S, Spence AJ, Isaacson M, Turner JN, Shain W, Dexamethasone treatment reduces astroglia responses to inserted neuroprosthetic devices in rat neocortex, Exp. Neurol 194 (2) (2005) 289–300. [DOI] [PubMed] [Google Scholar]
- [174].Shain W, Spataro L, Dilgen J, Haverstick K, Retterer S, Isaacson M,Saltzman M, Turner JN, Controlling cellular reactive responses around neural prosthetic devices using peripheral and local intervention strategies, IEEE Trans. Neural Syst. Rehabil. Eng 11 (2) (2003) 186–188. [DOI] [PubMed] [Google Scholar]
- [175].Geddes DM, Cargill RS 2nd, LaPlaca MC, Mechanical stretch to neurons results in a strain rate and magnitude-dependent increase in plasma membrane permeability, J. Neurotrauma 20 (10) (2003) 1039–1049. [DOI] [PubMed] [Google Scholar]
- [176].Wolf JA, Stys PK, Lusardi T, Meaney D, Smith DH, Traumatic axonal injury induces calcium influx modulated by tetrodotoxin-sensitive sodium channels, J. Neurosci 21 (6) (2001) 1923–1930. [DOI] [PMC free article] [PubMed] [Google Scholar]
- [177].Merrill DR, Bikson M, Jefferys JG, Electrical stimulation of excitable tissue: design of efficacious and safe protocols, J. Neurosci. Methods 141 (2) (2005) 171–198. [DOI] [PubMed] [Google Scholar]
- [178].Rousche PJ, Normann RA, Chronic intracortical microstimulation (ICMS) of cat sensory cortex using the Utah Intracortical Electrode Array, IEEE Trans. Rehabil. Eng. : Publ. IEEE Eng. Med. Biol. Soc 7 (1) (1999) 56–68. [DOI] [PubMed] [Google Scholar]
- [179].Shannon RV, A model of safe levels for electrical stimulation, IEEE Trans. Biomed. Eng 39 (4) (1992) 424–426. [DOI] [PubMed] [Google Scholar]
- [180].Patriarchi T, Cho JR, Merten K, Howe MW, Marley A, Xiong WH, Folk RW, Broussard GJ, Liang R, Jang MJ, Zhong H, Dombeck D, von Zastrow M,Nimmerjahn A, Gradinaru V, Williams JT, Tian L, Ultrafast neuronal imaging of dopamine dynamics with designed genetically encoded sensors, Science 360 (6396) (2018). [DOI] [PMC free article] [PubMed] [Google Scholar]
- [181].Helassa N, Podor B, Fine A, Török K, Design and mechanistic insight into ultrafast calcium indicators for monitoring intracellular calcium dynamics, Sci. Rep 6 (2016) 38276. [DOI] [PMC free article] [PubMed] [Google Scholar]
- [182].Bando Y, Sakamoto M, Kim S, Ayzenshtat I, Yuste R, Comparative evaluation of genetically encoded voltage indicators, Cell Rep. 26 (3) (2019) 802–813 e4. [DOI] [PMC free article] [PubMed] [Google Scholar]
- [183].Xie Y, Chan AW, McGirr A, Xue S, Xiao D, Zeng H, Murphy TH, Resolution of high-frequency mesoscale intracortical maps using the genetically encoded glutamate sensor iGluSnFR, J. Neurosci 36 (4) (2016) 1261–1272. [DOI] [PMC free article] [PubMed] [Google Scholar]
- [184].Wolf S, Supatto W, Debrégeas G, Mahou P, Kruglik SG, Sintes J-M,Beaurepaire E, Candelier R, Whole-brain functional imaging with two-photon light-sheet microscopy, Nat. Methods 12 (2015) 379. [DOI] [PubMed] [Google Scholar]
- [185].Wang T, Ouzounov DG, Wu C, Horton NG, Zhang B, Wu CH, Zhang Y, Schnitzer MJ, Xu C, Three-photon imaging of mouse brain structure and function through the intact skull, Nat. Methods 15 (10) (2018) 789–792. [DOI] [PMC free article] [PubMed] [Google Scholar]
- [186].Marvin JS, Shimoda Y, Malgoire V, Leite M, Kawashima T, Jensen TP, Knott EL, Novak O, Podgorski K, Leidenheimer N.J.J.b., A Genetically Encoded Fluorescent Sensor for in Vivo Imaging of GABA, (2018), p. 322578. [DOI] [PubMed] [Google Scholar]
- [187].Grill WM, Temporal pattern of electrical stimulation is a new dimension of therapeutic innovation, Curr. Opin. Biomed. Eng 8 (2018) 1–6. [DOI] [PMC free article] [PubMed] [Google Scholar]
- [188].Golestanirad L, Elahi B, Molina Arribere A, Mosig J, Pollo C, Graham S, Analysis of fractal electrodes for efficient neural stimulation, Front. Neuroeng 6 (3) (2013). [DOI] [PMC free article] [PubMed] [Google Scholar]
Associated Data
This section collects any data citations, data availability statements, or supplementary materials included in this article.