

Abstract
Manipulation of individual molecules with optical tweezers provides a powerful means of interrogating the structure and folding of proteins. Mechanical force is not only a relevant quantity in cellular protein folding and function, but also a convenient parameter for biophysical folding studies. Optical tweezers offer precise control in the force range relevant for protein folding and unfolding, from which single-molecule kinetic and thermodynamic information about these processes can be extracted. In this review, we describe both physical principles and practical aspects of optical tweezers measurements and discuss recent advances in the use of this technique for the study of protein folding. In particular, we describe the characterization of folding energy landscapes at high resolution, studies of structurally complex multidomain proteins, folding in the presence of chaperones, and the ability to investigate real-time cotranslational folding of a polypeptide.
Keywords: optical tweezers, protein folding, co-translational folding, molecular chaperones
1. INTRODUCTION
It has been slightly more than two decades since the feasibility of using mechanical force as an agent of protein denaturation was first demonstrated (1–3). It is not a coincidence that all three of these publications, which appeared simultaneously, utilized the giant muscle protein titin. This protein’s nearly 250 immunoglobulin-like and fibronectin domains arranged in a linear fashion, for a total molecular weight of almost 3 MDa, greatly facilitated its grabbing and tethering between the surface of two beads in an optical tweezers instrument, or between the tip of an atomic force microscope cantilever and a surface, making it possible for the first time to investigate the response of a protein to mechanical denaturation.
The use of force as denaturant was met originally with skepticism. Critics argued that force is not physiological and therefore not a valid agent for unfolding proteins. This criticism seemed to imply that the means traditionally used by scientists to investigate the folding and unfolding transitions of proteins (temperature and chemical denaturants, such as urea or guanidinium chloride) were instead more natural or biologically relevant. In the intervening years, the systematic study of molecular machines by single-molecule approaches and, in particular, the discovery of unfoldases—specialized molecular machines that employ the energy derived from the hydrolysis of adenosine triphosphate (ATP) to generate mechanical force to denature proteins in the cell—have elicited a renewed interest in understanding the mechanical response of proteins beyond those that are already known to be involved in mechanical tasks (e.g., titin, myosin, actin, fibronectin).
There are numerous advantages to studying protein folding by using force, one molecule at a time. First, the direction along which the force is applied in a mechanical unfolding experiment establishes a well-defined reaction coordinate. Along this privileged spatial direction, parameters of the reaction such as the distance to the transition state, the height of the energy barrier, and the energy difference between the initial (folded) and the final (unfolded) states can be determined. Second, unlike its bulk counterparts (urea, temperature), force is a selective denaturant capable of acting on one part of the molecule without directly affecting another. This locality has made it possible to investigate, for example, the energetic coupling during the folding or unfolding of different regions of a protein (4). Third, the use of force as a denaturant, which typically requires studying the folding process at the single-molecule level, makes it possible to avoid complications such as aggregation that often plague folding studies in bulk.
To date, two different methods are mainly used to investigate the mechanical response of proteins to force: optical tweezers and atomic force microscopy. There are advantages peculiar to each of these techniques. Optical tweezers are the more versatile of the two, in terms of both the range of forces that can be exerted on the proteins and the ability to control those forces. Another approach, termed magnetic tweezers, provides access to a similar force range but has been less frequently used for protein folding studies due to its limited temporal and spatial resolution. Recent studies, however, have showcased its potential (5, 6). This review describes only recent advances in protein folding using optical tweezers.
2. INSTRUMENTATION AND THEORY
2.1. Optical Tweezers Overview
Optical tweezers exploit the property of electromagnetic radiation to exert force on matter. The physical description of this phenomenon falls into different regimes depending on the size of the object compared with the wavelength of light. For a Gaussian beam propagating near an object much smaller than the wavelength of light, the object can be treated as a Raleigh scatterer: The electric field of the incident radiation induces an electric dipole moment on the object, which is then attracted toward the higher intensities of the field—that is, to the center of a Gaussian beam. The force acting on the object is proportional to its polarizability and to the intensity gradient of the beam (7).
In most biological optical tweezers applications, macromolecules are tethered to functionalized beads (made of silica or polystyrene) with diameters on the order of the wavelength of light and with an index of refraction larger than that of the surrounding medium. In this case, the force acting on the beads can be explained by using ray or geometric optics. Consider a bead centered on the axis of a Gaussian beam focused through a high-numerical-aperture lens (Figure 1a). Photons carry momentum. As they impinge on the surface of the bead, they are refracted symmetrically, and the transmitted beam is not deflected (Figure 1a, left). However, if the bead is displaced from the center of the beam, the refraction is asymmetric and the beam of photons is now deflected, experiencing a rate of change of momentum, or force (Figure 1a, right). Conservation of linear momentum requires, then, that the bead experience an equal but opposite force that tends to restore the bead position to the center of the beam (Figure 1a).
Figure 1.
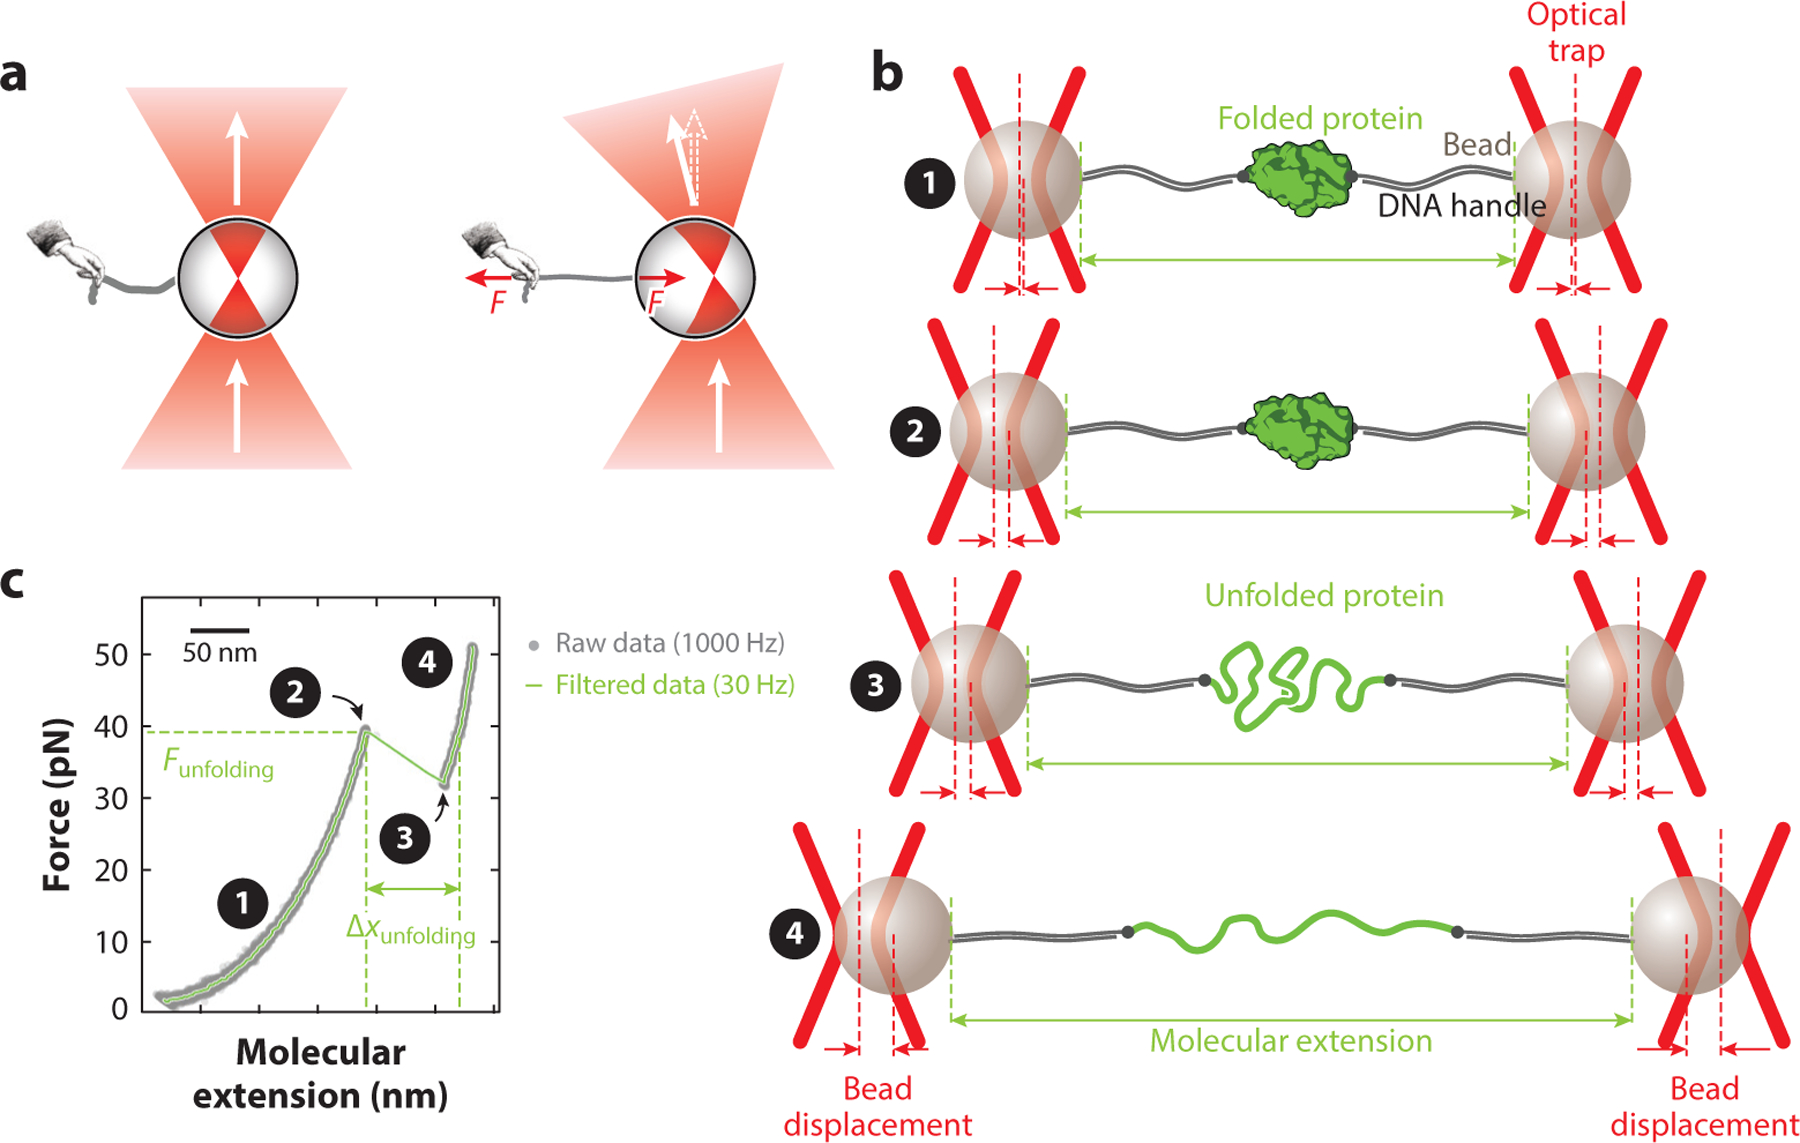
Manipulation of single molecules using optical tweezers. (a) Light from a tightly focused laser beam (red) passes through a bead. When the center of the bead is aligned with the laser focus (left), all rays hit the bead surface at a right angle, and the light does not change direction. When the center of the bead is not aligned with the laser focus (right), the change in momentum of the light elicits an equal and opposite change in momentum of the bead, resulting in a force F that attracts the bead to the laser focus. (b) Schematic of a protein tethered between two trapped beads via DNA handles (not drawn to scale). At low forces, the protein remains in the folded state (① and ②). However, an increase in force results in stretching of the DNA handles, increasing the molecular extension of the assembly between the beads. Unfolding of the protein results in a further increase in extension (③). Further increasing the force results in stretching of the DNA and the unfolded protein (④). Note that the bead displacement is proportional to the applied force, because the traps behave as harmonic springs. (c) Example of a typical force–extension curve, generated by applying a continuously increasing force to a tethered protein; gray dots represent data at 1,000 Hz, and the green curve represents data filtered to 30 Hz. The numbers are as in panel b. The curvature is due to the entropic elasticity of the DNA (region ①) and DNA plus unfolded protein (region ④). Unfolding of the tethered protein is apparent as a discontinuity in the curve (rip; from point ② to point ③).
Similarly, conservation of momentum results in trapping along the beam axis. Some of the photons hitting the bead are reflected from the bead surface, resulting in a force pushing the bead along the direction of light propagation. This force is, however, eventually balanced by that arising from the forward scattering of the beam by the bead. As a result, the bead attains an equilibrium trapped position on the beam axis located slightly beyond the focal point along the direction of propagation of the light. This is the principle of the optical tweezers, first demonstrated and implemented by Ashkin and coworkers (8).
The potential energy associated with a nearly Gaussian beam is locally harmonic, and the trap can be modeled as a Hookean spring. The restoring force to the bead is F = −κx, where x is the displacement of the bead from the beam center and κ is the trap stiffness. In general, the trap stiffness depends on laser power and on bead radius and is a crucial parameter required to measure the forces applied to the trapped object. Although there are multiple methods to calibrate the trap stiffness, the most common method is to record the Brownian fluctuations of a trapped untethered bead. In the limit in which friction forces dominate over inertial forces (the overdamped limit), the power spectrum of fluctuations (i.e., the mean quadratic displacement of the bead in the trap per unit hertz), σ, is described by the fluctuation-dissipation theorem according to
| 1. |
Here, γ is the drag coefficient of the bead, given by Stokes’s law (6πηr, where r is the bead radius and η is the dynamic viscosity of the medium), and f is the frequency. The value f0 is called the corner frequency of the bead/trap system, and it is the inverse of the relaxation time of the bead in the trapping potential. The corner frequency is the ratio of the stiffness of the trap, κ, and the drag coefficient of the bead, γ. Fitting of the experimentally recorded bead fluctuations to this Lorentzian function allows for the determination of the trap stiffness. An example power spectrum is shown in Figure 2. Data collection faster than the corner frequency will give correlated measurements of bead position, rather than reporting on properties of the biological system under study. Generally, data are collected at frequencies lower than the corner frequency, although exceptions do exist (9). It follows that the time resolution of a particular experiment is determined by the trap stiffness and the drag coefficient of the trapped object. However, for a Brownian-limited instrument (10), the spatial resolution of the experiment is independent of the trap stiffness and depends instead on the details of the biological system, such as its mechanical compliance. This point is discussed in Section 2.3.
Figure 2.
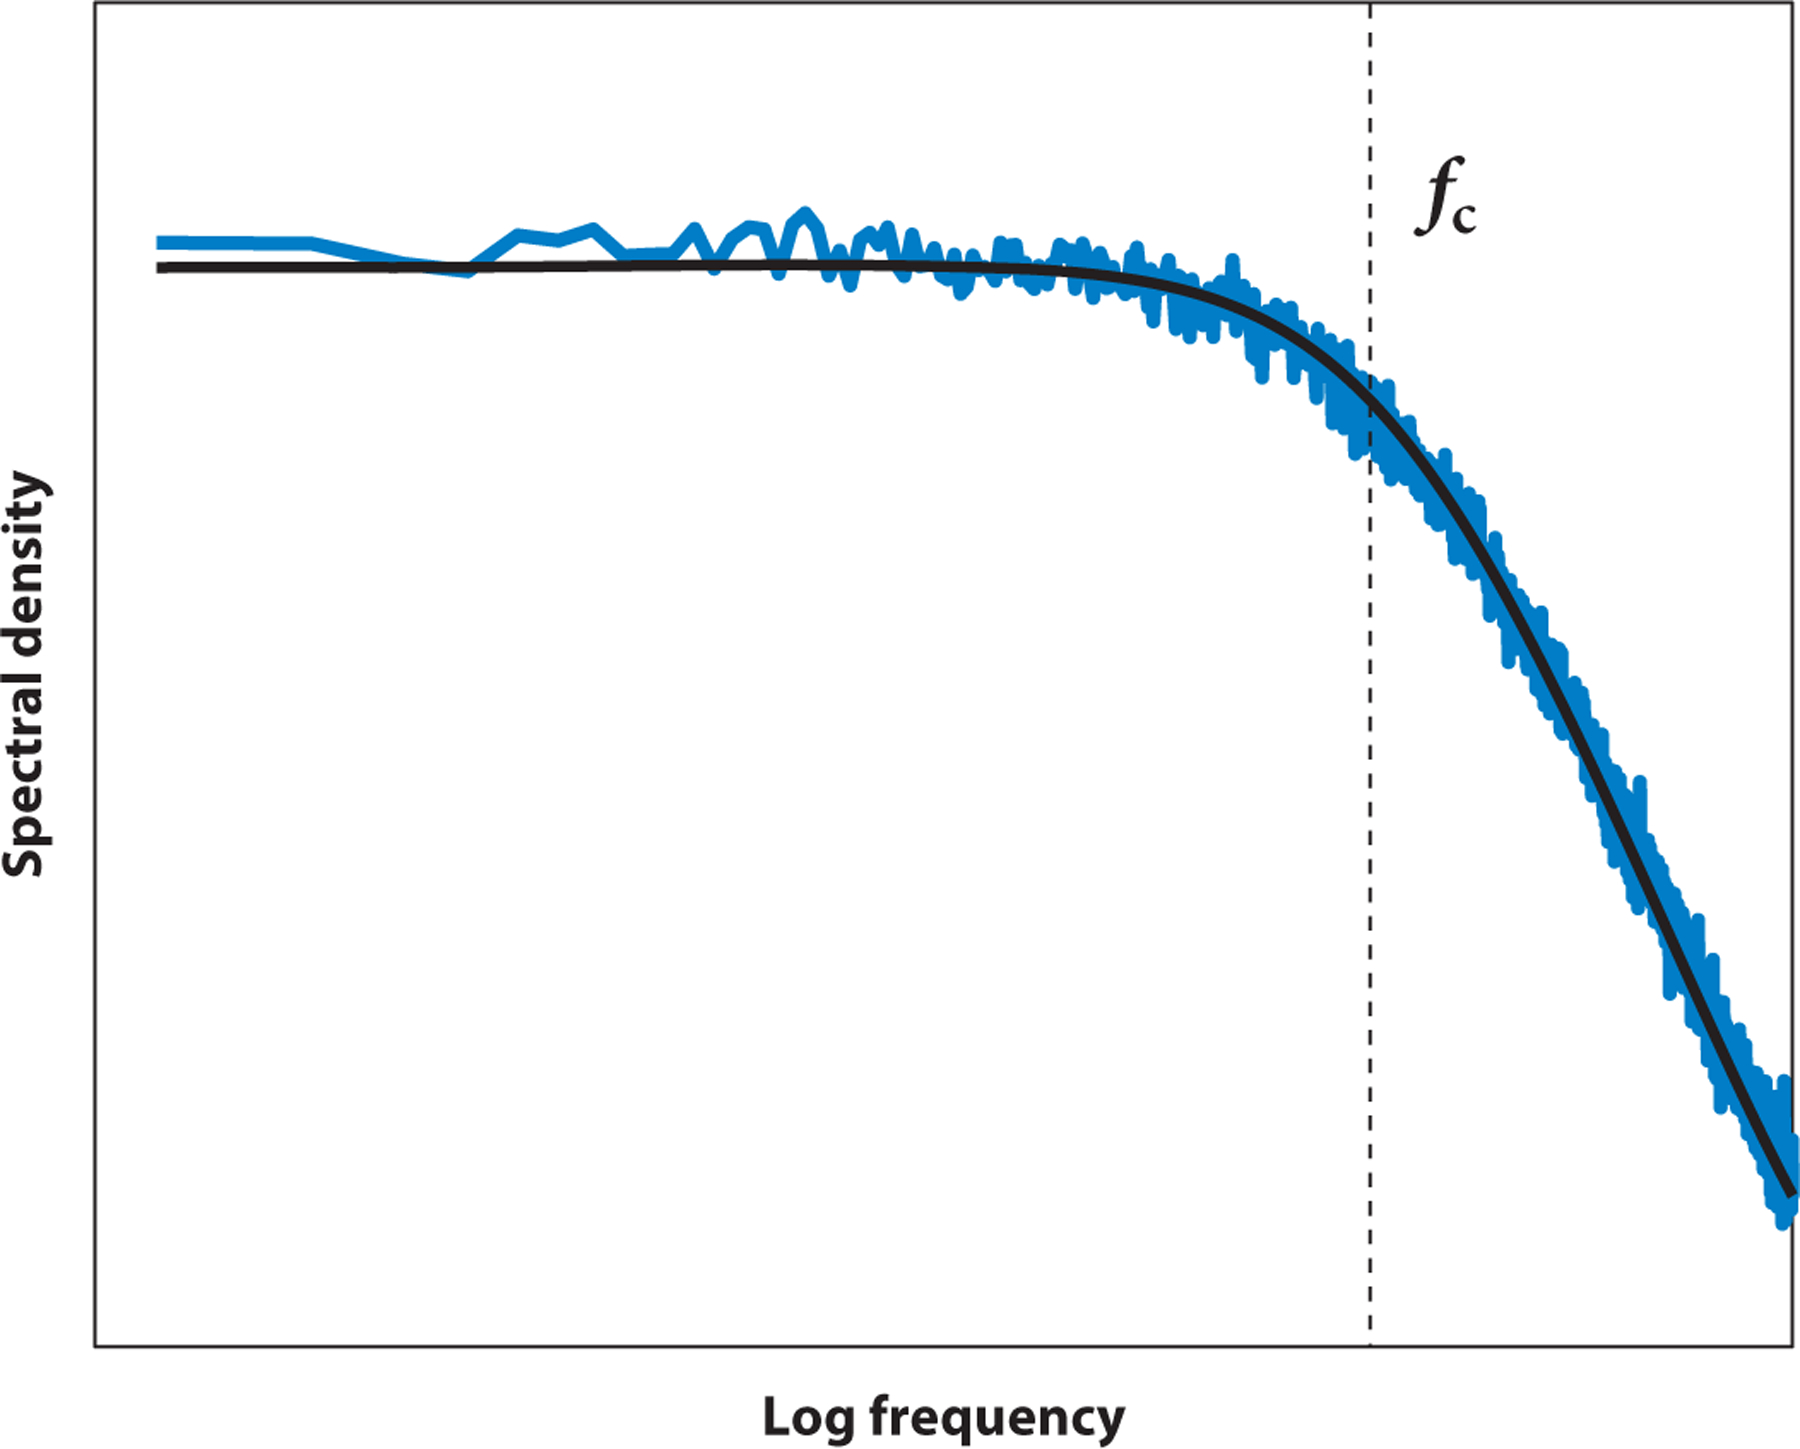
Example of a typical power spectrum of an optically trapped bead. A power spectrum of the fluctuations of an optically trapped bead is shown in blue, and the fit to a Lorentzian function is shown in black. At frequencies below the characteristic corner frequency fc, the spectrum is almost constant. At higher frequencies, it decreases as 1/f 2.
2.2. The Effect of Force on Energy Landscapes
In optical tweezers experiments, the tunable parameter is the force applied to the molecule of interest, and the readout is a change in molecular length. Therefore, the free energy surface characterized in these experiments is one dimensional, with the molecular extension as the reaction coordinate. For a simple one-barrier system, we can characterize this free energy landscape with four parameters: (a) Δx, the difference in molecular lengths x1 and x2 of two different states, 1 and 2, of the system along the reaction coordinate; (b) the difference in free energy between states 1 and 2; (c) the location of the barrier, corresponding to the distance to transition states Δx1‡ or Δx2‡; and (d) the height of the energy barrier, ΔG‡ (Figure 3). The free energy difference between the states determines the equilibrium populations, while the height of the barrier dictates the rate at which spontaneous transitions between the states occur.
Figure 3.
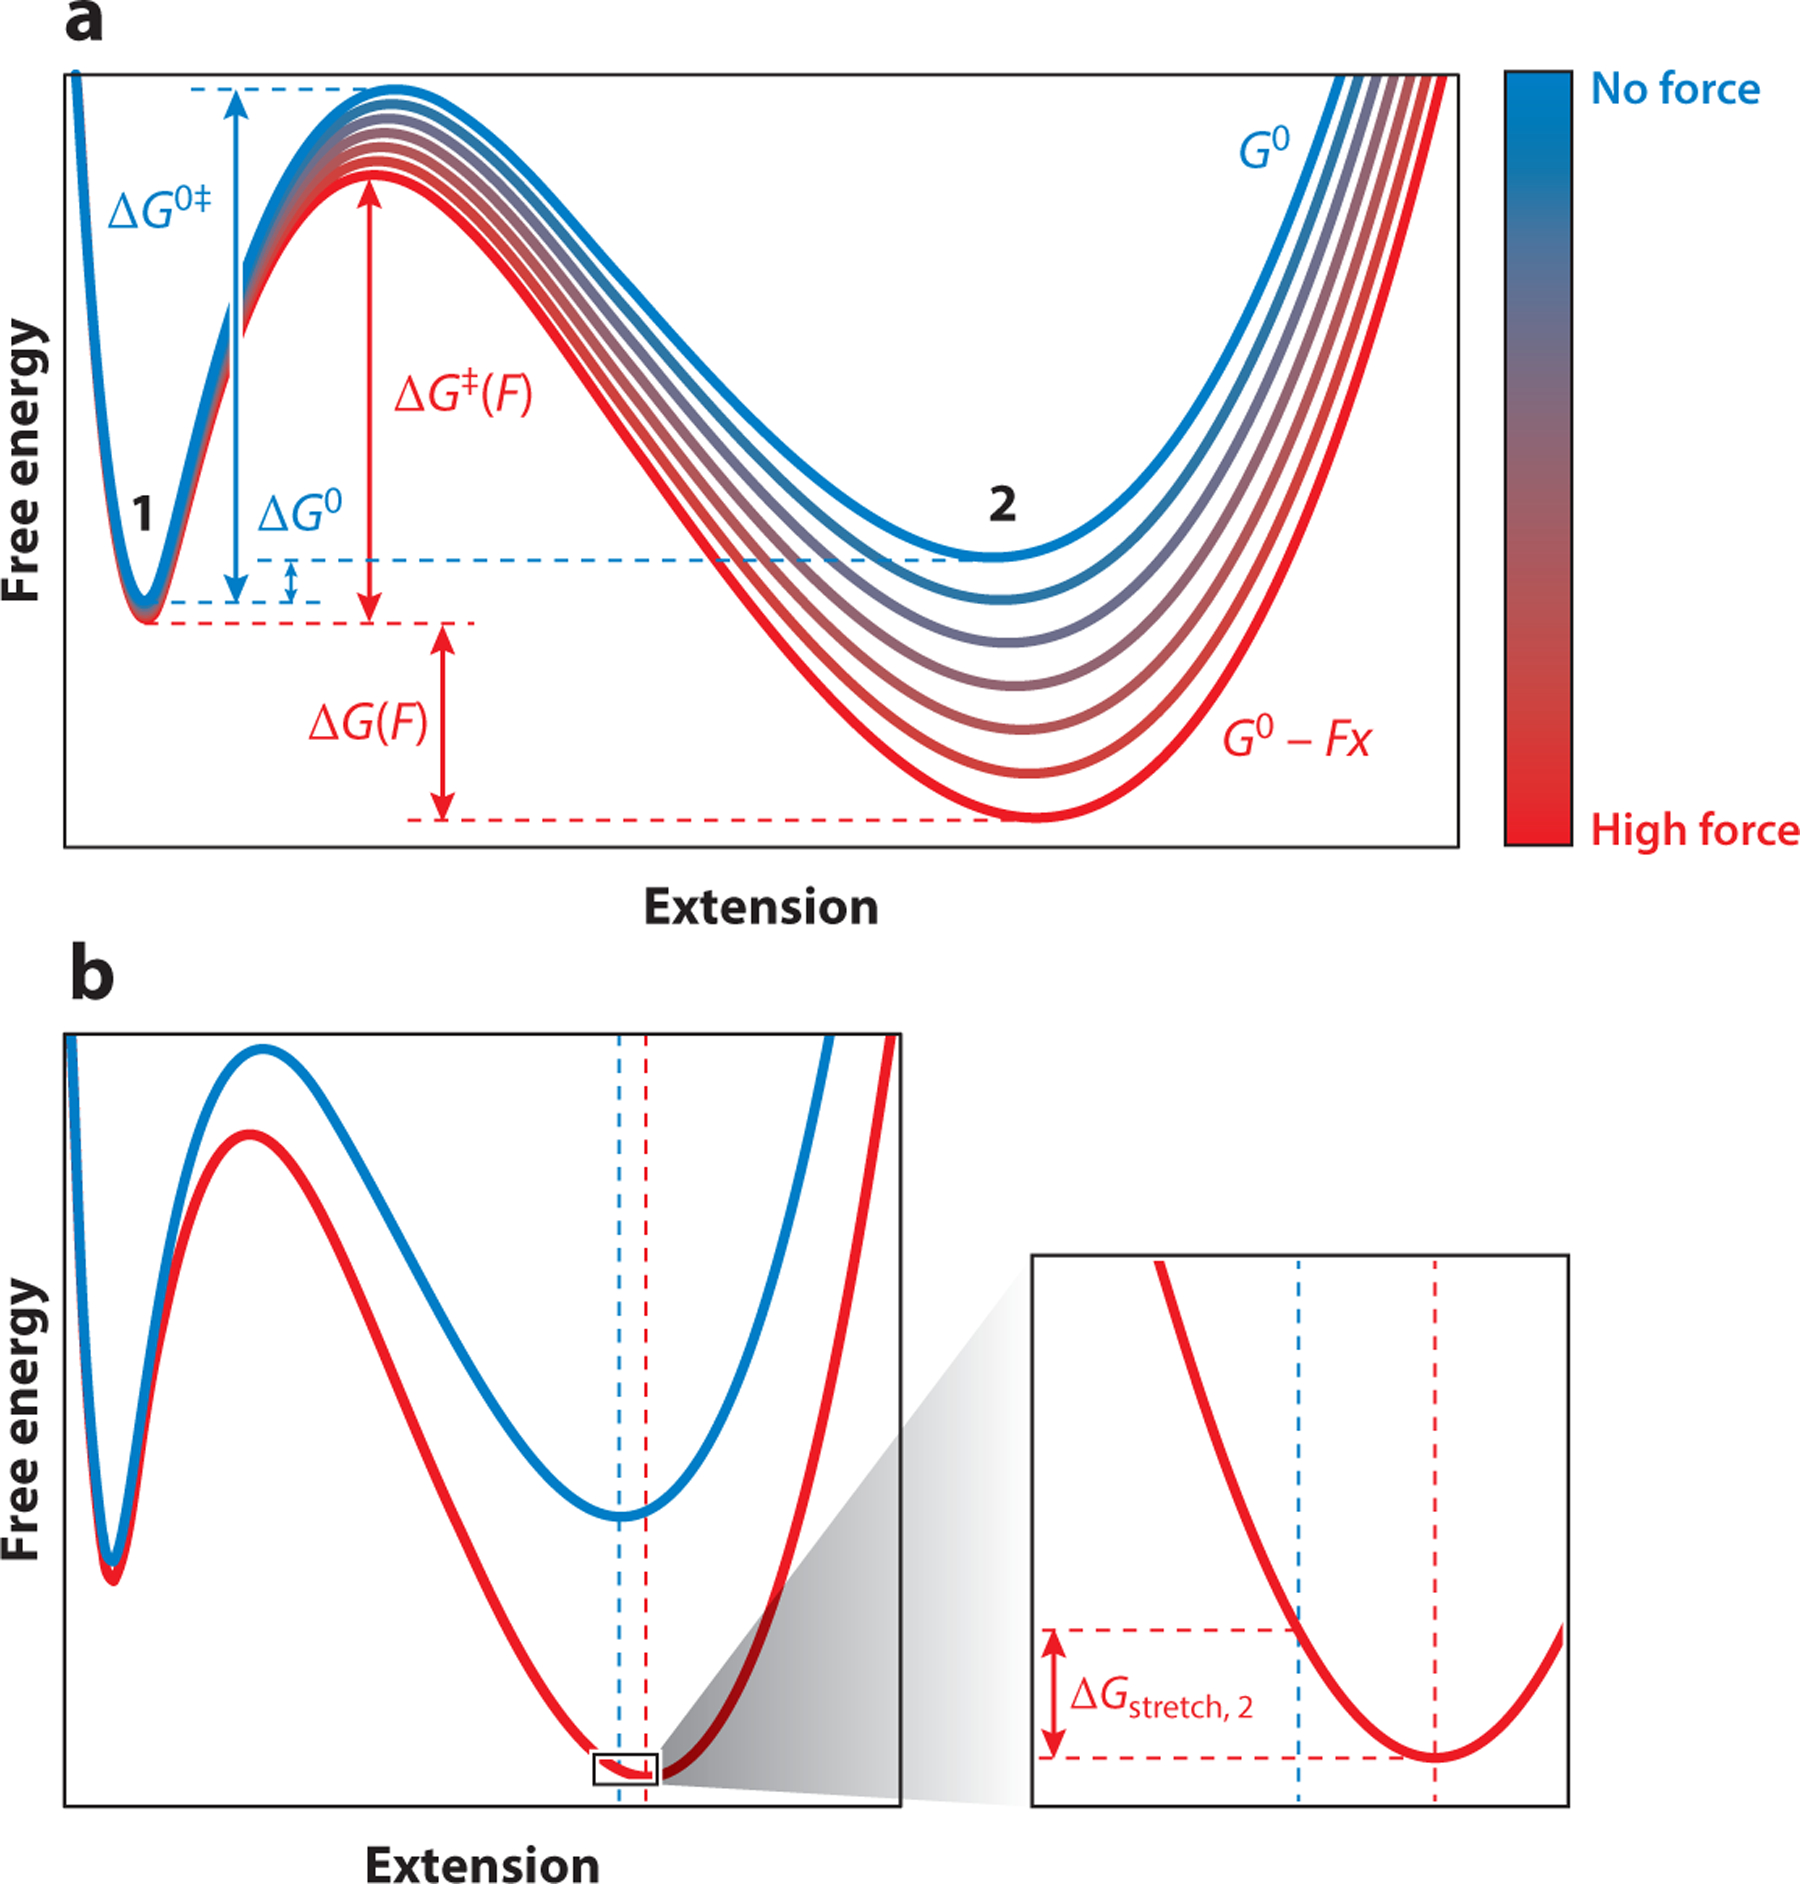
The free energy landscape changes in response to applied force. (a) As force is increased (red), the free energy landscape will tilt about the line −Fx. Note that force changes both the difference in free energy of the states 1 and 2, favoring state 2, and the height of the barrier, accelerating unfolding and resulting in a shift in equilibrium toward the unfolded state. Because the magnitude of the mechanical perturbation is proportional to the extension, longer states are affected more than shorter states. (b) Illustration of the origin of the stretching free energy that results from a shift in the state minimum; ΔGstretch is illustrated here for state 2. State 1 is similarly affected, but at a lesser magnitude.
The application of force changes the potential energy surface, corresponding, to a first approximation, to a linear correction of the energy by a term −Fx along the reaction coordinate. The effect of this correction is to tilt the energy landscape around the origin of the reaction coordinate. As the applied force increases, the equilibrium shifts to favor the longer (unfolded) state of the protein (Figure 3a). Because folded proteins do not deform much under force, the end-to-end distance of state 1 can be treated as a constant. In contrast, unfolded polypeptides are compliant, extending in response to an applied mechanical load (see Section 2.3, below, for how the response to force can be described). This stretching introduces an additional energy term. At equilibrium (ΔG = 0), the effect of force on the populations of states 1 and 2 and the effect of the force F on the equilibrium can be described by (11)
| 2. |
where kB is the Boltzmann constant, T is the temperature, Keq(F) is the force-dependent equilibrium constant, ΔG0 is the standard free energy, Δx is the difference in extension between states 1 and 2 at F = 0, and ΔGstretch is the free energy required to stretch the unfolded polypeptide to the extension it assumes at the force F (Figure 3b). Thus, the population of the unfolded state increases exponentially with the applied force (see 11 for a more detailed description).
The effect of force on the unfolding rate results from its effect on the energy landscape and can be approximated by Bell’s model (12), which introduces a −Fx factor in the Arrhenius equation:
| 3. |
where k(F) is the unfolding rate at a given force, A is the attempt frequency of the transition, k0 is the unfolding rate at zero force, and β = 1/kBT, where kB is the Boltzmann constant and T the absolute temperature. At room temperature, we obtain kBT = 4.1 pN nm. Often, data are fit to the linearized model of the natural logarithm of the rate (or inverse lifetime) versus the force. In practice, there is also a contribution to the rate due to the specifics of the experimental design (trap power, bead size, etc.). This is usually accounted for with an unknown prefactor, km (13):
| 4. |
Due to this prefactor, equivalent measurements of a protein-folding assay may not give the same zero-force rate k0. It can also be the case that the extrapolated zero-force rate for the same molecule differs with the design of the molecular setup (length of the tether) or with the trap stiffnesses (13). However, measured rate changes—for example, with changing salt concentrations—are comparable since they should have the same prefactor term, as long as the experimental design is the same. Additional corrections can be made by accounting for the local stiffness, κ, of the potential (14):
| 5. |
This simple model predicts that force also shifts the minima and the maxima of the potential energy landscape. In general, it can be shown that the shifts of the minima and maxima of the potential energy surface are inversely proportional to the curvature (sharpness) of these extremes (11).
This is the simplest model to describe the force dependence of kinetic rates. However, it is phenomenological and does not always describe accurately the effect of force on the landscape. The breakdown of this model will lead to a nonlinear dependence of ln(k) versus F (15, 16). A more theoretically rigorous treatment has been derived by Dudko et al. (15) using Kramer’s theory to describe the diffusive crossing of a barrier under force. In this framework, the force dependence of the kinetic rates becomes
| 6. |
where v = 1/2 for a cusp-type potential energy surface and v = 2/3 for a linear-cubic potential. For v = 1, this expression reduces to the Bell model above. Most potentials can be well described by the cubic correction (15). Note that obtaining ΔG‡ from the Bell equation requires experiments as a function of temperature T, which are typically difficult to implement experimentally. In contrast, the Dudko et al. equation yields this parameter from the fitting of the plot of ln(k) versus F, as long as a broad enough force range is explored to observe the nonlinearity predicted by this model.
2.3. Modeling of Biopolymer Behavior Under Force
In most experimental setups, the molecule of interest is not directly linked to the beads held in the optical traps but is instead connected to spacer molecules (handles) that extend the molecule away from the bead surface as well as away from the laser focus (Figure 1b). This addition is important to prevent the bead surfaces (often highly charged or covered in protein) from affecting the dynamics of the molecule of interest, as well as to reduce photochemical damage due to radiation-induced radical formation (17). Typically, linear double-stranded DNA (dsDNA) molecules serve as spacers (18), although other materials, such as DNA origami structures, can be used (19). Since these handles affect the properties of the biomolecule measured in these experiments, their response to force must be known and accounted for within the signal. Because dsDNA is the most common handle, it is discussed here in some detail, but the same concepts apply to alternative handle materials.
Consider a flexible polymer, such as an unfolded polypeptide or a dsDNA fragment, of length L (referred to here as its contour length) at zero force. The force-dependent state of the molecule can be characterized in one dimension by its end-to-end distance, x(F). For any given extension x, the molecule has an associated number of microscopic states that is maximal at zero force and becomes 1 when the molecule is maximally extended, that is, when its end-to-end distance matches its contour length, x = L. Therefore, the force applied to the ends of a molecule reduces its entropy because the number of its accessible configurations is a sharply decreasing function of its end-to-end distance. The force dependence of this extension process can be described by a wormlike chain model (20):
| 7. |
Here, F is the force applied to the ends of the polymer. In this model, the intrinsic flexibility of the polymer is described by a single parameter, its persistence length P, which describes how quickly the memory of the initial orientation of the chain decays along its length. A larger persistence length describes a stiffer polymer. The formula above assumes that the contour length of the molecule is constant and independent of the applied force. Accordingly, it is valid only in the so-called entropic regime of polymer elasticity, in which the effect of the force is just to straighten the polymer along the direction defined by the applied force and in which work is done only to reduce the entropy of the chain [−TΔS(F)]. In practice, molecules are stretchable under force.
Applied force extends the structure of the polymer, adding an enthalpic term to its entropic elastic behavior. This effect is described by the extensible wormlike chain model, which includes a stretch modulus of the polymer, K (21, 22):
| 8. |
The formulae are interpolations that are exact in the low- and high-force regimes. For an exact treatment of the wormlike chain model, readers are referred to Reference 23. In practice, the interpolation formulae with polynomial order corrections to increase their accuracy are useful and cover the range of forces relevant for most biological measurements (24).
For dsDNA handles in monovalent salt solutions around 100 mM, the extensible worm-like chain model is appropriate, with a persistence length of ~50 nm and a stretch modulus of ~1,200 pN (exact numbers vary with buffer conditions) (25). For unfolded polypeptides, the wormlike chain model with persistence length between 0.65 and 0.75 nm is typically used (26). The force-versus-extension behavior of single-stranded DNA or single-stranded RNA can be fit by the wormlike chain model using a persistence length of ~1 nm (27). The persistence length of dsDNA is therefore some 50 times higher than that of single-stranded DNA due to its braided nature. This relatively high persistence length or stiffness makes dsDNA an attractive molecular handle for single-molecule manipulation experiments—the persistence length P of a DNA handle can be directly related to its stiffness κDNA by the formula κDNA = kBTPDNA.
Imagine a polypeptide attached by one end to a surface and by the other to a DNA handle tethered to an optically trapped bead. In this case, the effective stiffness of the molecular system (including polypeptide and handles) and the trap contribute to the thermal noise experienced by the bead in the trap as two springs arranged in parallel (13):
| 9. |
where B is the bandwidth of the measurement; γ is the drag coefficient of the bead, equal to 6πηr; η is the viscosity of the medium; and r is the radius of the bead. The value κmolecular represents the stiffness of both the handles and the polypeptide and is given by
| 10. |
Note that in the last expression, the molecular stiffnesses of the polypeptide and handles contribute to the compound stiffness as springs arranged in series.
In general, the signal detected with an optical tweezers instrument, Δxsignal, is smaller than the change in extension of the polypeptide, Δx, due to the compliance of the molecular components, according to
| 11. |
Therefore, from Equations 9 and 11, the signal-to-noise ratio (SNR) of the experiment is (10)
| 12. |
The value κmolecular is itself a function of the applied force because most biopolymers (including the handles) behave as nonlinear springs. The longer the handle, the smaller is κmolecular, and the choice of the handle is therefore necessarily a compromise between maximizing the SNR of the experiment (high persistence length and shorter contour length of the handle) and minimizing possible surface effects and radiation damage to the system (longer contour length of the handle).
In practice, the polypeptide of interest is shorter than the DNA handles used (hundreds of amino acids versus thousands of base pairs); therefore, their contributions to the stiffness are often similar, despite the lower persistence length of polypeptide chains.
The SNR for a dual-trap instrument (in which the polypeptide is tethered on both sides by handles to beads kept in respective traps) is higher because part of the thermal noise corresponds to the correlated motion of the beads in the traps (due to the molecular tether between them), which is automatically subtracted out when taking the difference between the positions of the beads to obtain the signal, x. In this case, γ must be replaced by the effective drag coefficient of the system, given in terms of the drag coefficients of the two beads, γ 1 and γ 2, by γ eff = γ 1γ 2/(γ 1 + γ 2) (10). Notice that the SNR is independent of the stiffness of the trap. The reason is that both the signal and the noise depend on this parameter, which cancels out when calculating the ratio (10). However, because trap stiffness determines the corner frequency of the experiment, it limits the maximum bandwidth that can be used during data collection. Conversely, although averaging the data to lower bandwidth would increase the spatial SNR, this improvement comes at the expense of temporal resolution. Ultimately, the maximal spatial resolution depends on the timescale of the biological process of interest (see, e.g., measurements of transition path times below).
3. DATA COLLECTION AND ANALYSIS
The benefit of using optical tweezers to study protein folding derives from its high resolution in the relevant spatial and temporal regimes. The readout is the molecular length, or number of amino acids, involved in a transition, which is obtained from the difference between the two bead positions, Δx. The bead positions are continuously measured by back focal plane interferometry (28) with excellent spatial and temporal resolution. Although the measurement provides only one-dimensional structural information about the intermediates in the process, using mutants, truncated proteins, or different handle attachment points enables identification of the protein region that corresponds to a given folding or unfolding transition. Even intermediates of the same length can be distinguished, provided their transition kinetics under applied force are sufficiently different (29). As a result, optical tweezers make it possible to extract the folding and unfolding kinetics and to obtain information about the structures of the involved states. This approach is particularly well suited for studying larger proteins that often aggregate in bulk studies or that may fold or unfold with many intermediates. One of the main advantages of single-molecule optical tweezers studies is that they make it possible to establish directly whether a particular intermediate is obligatory and on-pathway to folding, which is often more difficult to do in bulk folding studies. Different experimental protocols are commonly used to collect these data, summarized below.
3.1. Force Ramp Experiments
One of the most common methods to study protein folding using optical tweezers is to perform force ramp experiments and generate force-versus-extension pulling curves. In this type of experiment, the traps are moved apart at a constant velocity, which in turn continuously increases the force on the molecule. In practice, one trap is usually held at a fixed position, whereas the other one is moved by a steerable mirror or acousto-optic deflector. Before the protein responds to the applied force by changing its structure, the force ramp data display only the elastic response of the handles (Figure 1b,c). As the force is ramped up, the likelihood of unfolding continuously increases (see Equation 3). At some point, the force on the protein will be high enough that it is no longer stable and the molecule unfolds, which appears as a transition toward increased length that is accompanied by a drop in force. Most proteins unfold cooperatively in a sharp transition that corresponds to a sudden increase in the end-to-end extension of the molecule, and that appears as a clear rip in the force–extension curve (Figure 1c). After the unfolding event, the force continues to increase at a longer contour length, now governed by the combined elastic behavior of the handles and the unfolded part of the polypeptide. When the force is lowered, the refolding rate increases until the molecule ultimately refolds. This transition appears as a jump from a longer to a shorter end-to-end distance of the molecule, or zip, in the data.
In this type of experiment, the unfolding and refolding of the protein typically occur out of equilibrium because the perturbation of the energy landscape is faster than the rate at which the molecule can equilibrate to the newly imposed force. As a result, the force-versus-extension curves display hysteresis; that is, the forces at which the unfolding and refolding events occur do not coincide. Moreover, the unfolding and refolding forces generally are a function of the pulling rate. A faster pulling rate takes the system farther from equilibrium and leads to unfolding at a higher force. Although these experiments are performed far from equilibrium, equilibrium information about the folding process can still be extracted from them by using fluctuation theorems (30–33), as described in the following paragraphs.
Because the unfolding process is ultimately a thermally induced stochastic event, the exact force at which a protein molecule unfolds is slightly different every time the experiment is repeated. From this distribution of unfolding forces obtained at a particular experimental condition, the zero-force unfolding rates can be obtained. The lifetime of a folded (or unfolded) state as a function of force can be obtained by transforming the probability density of unfolding (or refolding) forces according to (34)
| 13. |
where τ is the lifetime of the folded or unfolded state, p(f) is the probability density function at F, and r(F) is the loading rate, typically expressed in units of piconewtons per second and equal to the product of the pulling rate and the effective stiffness of the system κeff = κtrapκmolecular/(κtrap + κmolecular). The loading rate varies as a function of force despite the constant pulling rate due to the nonlinear elasticity of the handles. Once the unfolding forces have been transformed to lifetimes [or rates k(F), where k = 1/τ], the expressions discussed above for the relationship between k(F) and k0 can be applied (see Section 2.2).
The pulling curves can also be used to determine the equilibrium free energy ΔG from the nonequilibrium work of the process using Jarzynski’s equality (35, 36):
| 14. |
where wi is the mechanical irreversible work done to unfold the protein in the ith pulling iteration. Equation 14 shows that it is possible to access the equilibrium free energy of the folding process (left-hand side of the expression) from the average of the Boltzmann-weighted irreversible work determined over N realizations of the experiment in the limit of large N (right-hand side). The irreversible work wi done during the unfolding or refolding process is simply the integral of the force–extension curve (Figure 4a), corrected for the reversible work of stretching the molecular handles. Faster pulling speeds take the system farther out of equilibrium, leading to larger hysteresis between the unfolding and refolding processes, and the difference between these integrations (the dissipated work) increases. Provided that the dissipated work is not too large, in practice the value of N required for the above expression to hold is within experimental limits.
Figure 4.
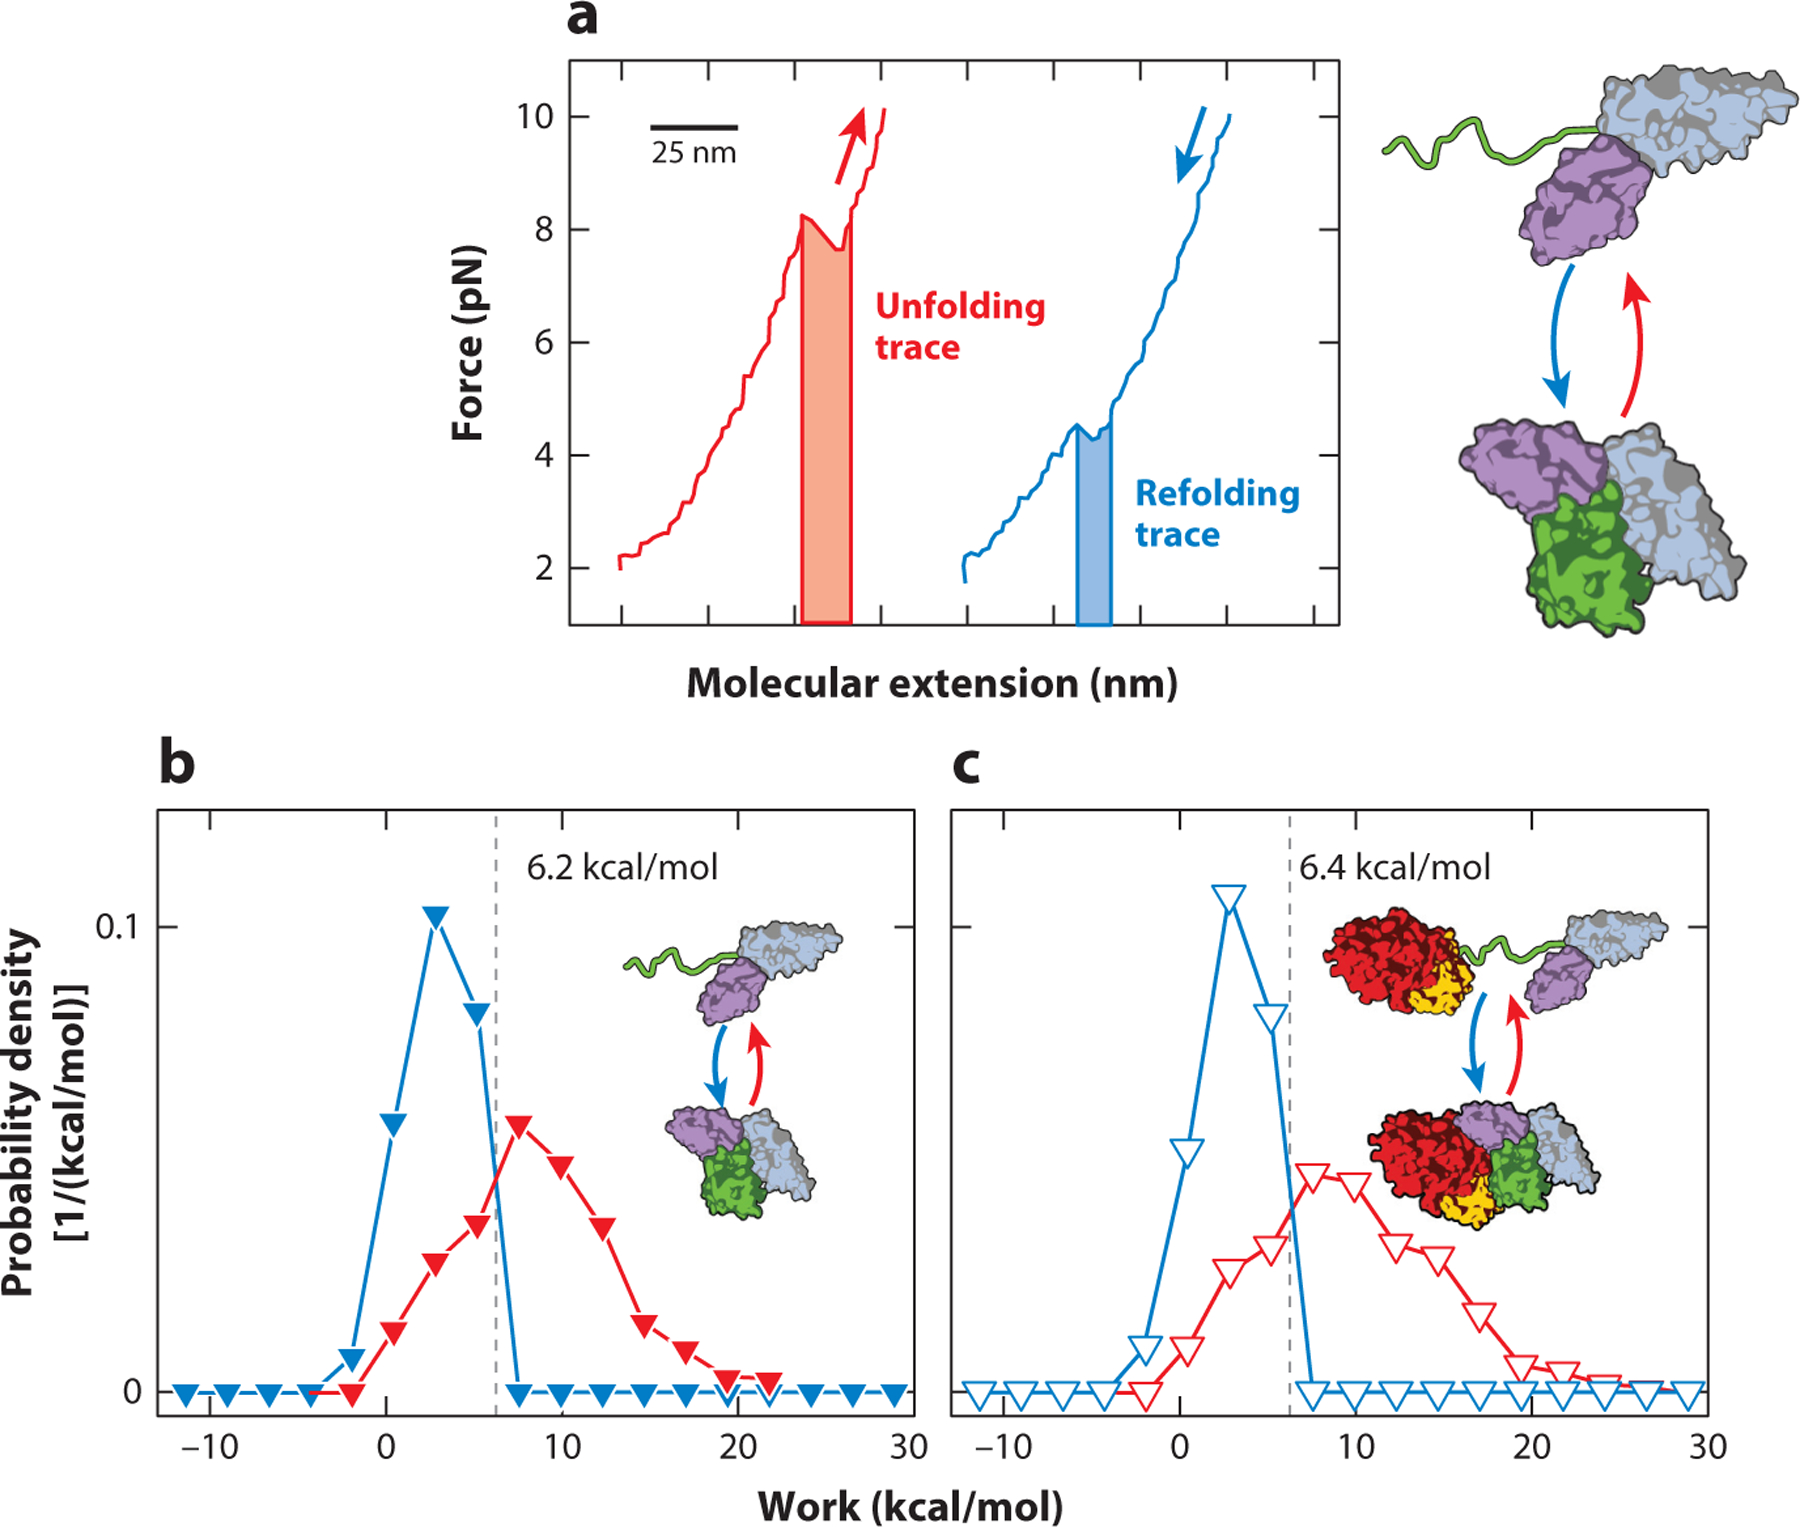
Extracting mechanical work from nonequilibrium measurements. (a) Mechanical work associated with unfolding and refolding is determined by integration around the rip boundaries (shaded region); red indicates the unfolding trace and blue the refolding trace. Note that the force is the same at the beginning and end of the integration. As a result, the DNA handles do not change their extension and thus do not contribute to the mechanical work of stretching the molecular assembly. (b) The Crooks fluctuation theorem yields the free energy of folding for the green domain in the three-domain construct shown here. The free energy is equal to the irreversible work at which the distributions of refolding (blue) and unfolding (red) work cross. In this example, the experiment was carried out with a protein construct composed of domains III, IV, and V of the five-domain protein elongation factor G (EF-G). The green domain is domain III. (c) A similar measurement carried out with full-length EF-G. The analysis yields a free energy similar to that in panel b, demonstrating that the additional EF-G domains (G and II) have no net effect on the thermodynamic stability of domain III. Figure adapted with permission from Liu et al. (37).
The Crooks fluctuation theorem (31, 33), a statistical mechanics result relating the distributions of irreversible work associated with folding and unfolding to the free energy of the underlying molecular process, provides another way of extracting thermodynamic information from nonequilibrium measurements through the relationship
| 15. |
where PU(W) and PR(−W) are the probabilities of the irreversible mechanical work W of unfolding and refolding, respectively. It can be seen from this equation that W is equal to the free energy ΔG when PU(W) = PR(W). The point at which the two distributions cross therefore directly yields ΔG. Figure 4 depicts a practical way to extract the mechanical work from the force-versus-extension curve, performed during an unfolding experiment. In the example shown, the analysis is used to determine the free energy of an individual domain (domain III) in a multidomain protein, elongation factor G (EF-G). In this particular application, the results showed that the presence of additional domains does not result in higher thermodynamic stability of domain III. The method has also been used successfully to demonstrate cooperative unfolding of coupled domains (4).
Force ramps are useful to gain fundamental information about the system: In how many steps does the protein unfold? How many states are populated during refolding? Is there large hysteresis between unfolding and refolding? They are also the simplest way to collect data. Because this type of experiment can cover a broad range of forces during each pulling/relaxation iteration, it is very useful to detect the transitions originating from structures with very different mechanical stabilities, such as individual domains in a large protein. However, refolding transitions can be difficult to detect accurately. In addition, it can be difficult to cleanly resolve transitions and intermediates for systems near equilibrium where multiple folding and unfolding events occur in a single pulling cycle. When analyzing the force distributions from such systems with multibarrier landscapes, modifications to the theory and fitting procedures developed by Zhang & Dudko (38; discussed above in this section) need to be made. In practice, data collection is limited to a relatively small range of forces for each type of molecular transition (because outside this range transitions in one direction or the other are very infrequent), which must then be extrapolated to obtain the properties at zero force. The smaller this range, the more likely extrapolation will result in large errors due to nonlinear effects (see Section 2.2). For these reasons, force ramp experiments are often used in conjunction with equilibrium measurements at constant force, as discussed in the following section.
3.2. Constant Force Experiments
One type of equilibrium measurement uses feedback on the trap positions to keep the force across the molecule constant. In these experiments, the molecule transitions between states with distinct extensions. The molecule is stretched to the force of interest where it can fold and unfold spontaneously. For the instrument to maintain the force constant, it increases or decreases the distance between the beads each time the molecule unfolds or refolds, respectively. Thus, a plot of the distance between the beads as a function of time displays successive jumps (hopping) that reflect the molecular transitions between states. Initially, trajectories of this type were analyzed by applying simple thresholds, where any points above or below a certain cutoff extension were classified as representing folded or unfolded states, respectively (18, 39). However, this method is prone to errors, because thermal fluctuations can be misinterpreted as transitions and short excursions to a different state may be missed. Classifying events by using hidden Markov models is a more robust approach for the analysis of constant-force experiments and is now commonly used for this type of experiment (29, 40). Hidden Markov models treat the observed data as a Markov chain of transitions in which the probability of transitioning to a given state is dependent only on the current state. Hidden Markov model analysis yields the transition probabilities between states and determines the most likely state assignment in an experimentally measured trajectory (41–43).
Constant-force experiments represent a straightforward way to determine force-dependent state lifetimes. Because a constant perturbation is applied to the energy landscape, data interpretation is straightforward. Furthermore, the elastic handles remain at a constant extension in this type of experiment since the force is invariant. The measured extension changes therefore directly reflect changes in the contour length of the protein under study without requiring corrections. However, the feedback algorithm required to maintain a constant force in the instrument can lead to artifacts and increased noise compared with measurements without feedback. The feedback bandwidth is necessarily lower than the response time of the bead, limiting the temporal resolution as well. More importantly, for systems with one or more short-lived states, feedback can introduce numerous artifacts resulting from missed events (44). A passive force clamp approach has been developed that circumvents this limitation by using two traps of different stiffnesses. One trap is operated outside of its linear regime, taking advantage of a relatively flat region of the trapping potential in which the force is constant for small displacements (14). The other trap is used to detect and measure transitions. While this feedback-free method does not benefit from the improved SNR that is afforded by differential detection with two traps (10), it circumvents the relatively low bandwidth and potential artifacts associated with active-feedback implementations.
Some proteins have force-dependent folding and unfolding rates that permit the molecule to sample all accessible states near equilibrium (29, 45). However, for many proteins, there is no single force at which both folding and unfolding transitions are in an experimentally accessible range, that is, neither too fast nor too slow (18, 40). In these cases, repeated jumps between low and high force are necessary (see Section 3.4).
3.3. Constant Trap Position (Passive Mode)
In constant trap position experiments, the traps are adjusted to apply a defined pretension to the protein and are then kept at this position while the molecule undergoes folding/unfolding transitions. Because the centers of the traps are fixed but the beads move relative to the trap centers, transitions involving changes in molecular end-to-end extension manifest as changes in force. The force and extension are conjugate variables of each other, and either signal can be analyzed, although one may be more accurate than the other, depending on the detection setup. Because the force on the molecule varies as the molecule transitions between states, this method cannot be described as a simple linear bias on the folding landscape. Instead of a perturbation term of −Fx on the landscape, the relevant correction would depend on the extension and the local stiffness (46). The consequences of this type of bias are experimentally very helpful: If a molecule unfolds, the force drops, favoring subsequent refolding. Likewise, when the molecule folds, the force increases. As such, it is easier to sample a larger region of the energy landscape, more transitions are recorded per unit time (44, 47), and reversible, rather than sequential, crossing of energy barriers is favored (47).
Analysis of the data in this case is also performed via hidden Markov model implementation, as in constant-force measurements. Thus, in this type of experiment, the rate constants for complicated transition networks, either branched or sequential, can be directly extracted. In force ramp experiments, in contrast, the force of a second barrier would appear higher because the transitions occur chronologically and the force changes more or less monotonically with time in this type of experiment. That is, the true rates are convoluted due to the presence of multiple barriers and the time-dependent force perturbation (38). While these rates can be successfully extracted from pulling curves (38), they are directly observable in passive mode only if the system displays reversible kinetics.
3.4. Force-Jump Experiments
Passive mode experiments are a powerful way to measure the unfolding or refolding kinetics and to readily examine complicated dynamics with many states. However, not all proteins are amenable to such measurements. For instance, kinetic rates can be impractically slow in the force range where the equilibrium populations of folded, intermediate, and unfolded states are all sufficiently high to detect them, or the experimentally accessible region (i.e., the region in which this reversibility is fulfilled) may span a narrow range of forces. In these cases, kinetic lifetime data can still be obtained by using force-jump experiments. In this approach, the force is raised (or lowered) very quickly to a set value, and the time until an unfolding (or refolding) event occurs is recorded (48). Assuming that the time to execute the jump is short compared with the lifetime of the initial state, the time until unfolding (or refolding) is the lifetime of the folded (or unfolded) state. Since these experiments are usually outside of the reversible (hopping) range, once the transition has occurred, the molecule is unlikely to convert back to its previous state within the experimental timescale. Therefore, any given force jump will yield one lifetime measurement, and jumps must be repeated many times to build robust statistics. However, force-jump experiments still incorporate the advantages of resolution from passive mode measurements while, depending on the lifetime of the intermediate, making it possible to identify the intermediate states.
4. APPLICATIONS OF OPTICAL TWEEZERS TO THE STUDY OF PROTEIN FOLDING
4.1. (Un)Folding Pathways of Small Proteins
The first detailed protein folding study using optical tweezers was carried out with ribonuclease H (RNase H) (18). Native RNase H unfolds at ~19 pN. However, the protein also populates a mechanically much weaker state that unfolds at ~5.5 pN. This state is characterized by a long distance to the transition state for unfolding of ~5 nm; that is, it deforms by more than the diameter of the native protein before it is committed to unfolding (18). This property suggests a molten-globule structure in which, presumably, hydrophobic collapse of the polypeptide has led to a state that is held together by transient interactions, in contrast to the specific contacts that stabilize native structures. Constant-force experiments served to resolve an intermediate that had been inferred from biochemical ensemble experiments before, but its formation was too rapid for direct detection (49). The optical tweezers assay made it possible to directly observe this intermediate and demonstrated that it is on-pathway and obligatory, as it was observed to be invariably populated by the polypeptide prior to reaching the native state. While folding intermediates can be detected in ensemble measurements, it is usually difficult to define them as either on- or off-pathway for productive folding. Observing the folding of individual molecules in real time with optical tweezers solves this problem and provides insights into the folding mechanisms that cannot be obtained with other methodologies.
Demonstrating how equilibrium information can be extracted from nonequilibrium force-ramp experiments, Shank et al. (4) used the Crooks fluctuation theorem (31) to determine the unfolding free energy of T4 lysozyme. T4 lysozyme is composed of two subdomains. When the smaller of the two subdomains is selectively unfolded by choosing appropriate tethering positions, a free energy for unfolding of 12.3 kcal/mol is obtained. Chemically denaturing the complete protein in ensemble experiments yields a similar value (14.1 kcal/mol), indicating that the whole protein unfolds when force is applied to the small subdomain. This observation indicates highly cooperative unfolding and refolding of the two domains, resulting from strong energetic coupling between them. This inference is validated by the observation of single-step transitions when the protein is pulled across both domains. The tertiary structure of the C-terminal T4 lysozyme domain incorporates an α-helix that belongs to the very N terminus in the primary sequence. Experiments with a circular permutant showed that this discontinuous domain topology results in the observed energetic coupling. The ability to apply force as a selective denaturant thus revealed that chain topology alone is responsible for the folding cooperativity between the subdomains since the original protein and the circular permutant adopt the same tertiary structure. It is interesting to speculate that such a reentrant topology may have evolved as a mechanism to coordinate the folding of multidomain proteins. Moreover, the energetic coupling resulting from the reentrant topology will necessarily minimize partial spontaneous unfolding that could otherwise result in the formation of kinetically trapped misfolded species and in aggregation.
The folding energy landscapes of many proteins are rugged, complicating the conformational search for the native state and increasing the risk of misfolding, which can result in the formation of protein aggregates that are associated with a number of proteinopathies, including neurode-generative diseases. Yu et al. (50) observed three distinct misfolded states of the prion protein PrP, which is known to adopt a self-propagating toxic conformation. The misfolded states are only transiently populated and cannot be resolved in traditional ensemble measurements, but the high temporal (>10 kHz) and spatial (<1 nm) resolution attainable in optical tweezers experiments enable their detection at the single-molecule level. A PrP mutant with increased aggregation propensity showed increased misfolding, making it likely that the observed states indeed represent early events in the pathological misfolding of the protein. All three misfolded states were formed from the unfolded state, whereas folding to the native structure occurred in an apparent two-state manner. These experiments therefore ruled out a role of postulated folding intermediates in the misfolding process. Rather, complete unfolding of the protein appears to be a required step preceding the formation of misfolded states (see also Section 4.4 for details of the misfolding transition).
4.2. Mapping Energy Landscapes
While several ensemble techniques can be used to characterize states along the protein folding pathway and the barriers separating them, it is usually difficult to resolve the entire folding energy landscape in those experiments. Unlike ensemble measurements, force spectroscopy experiments offer the advantage of a well-defined reaction coordinate: the molecular end-to-end extension of the protein. Accordingly, optical tweezers experiments have allowed the reconstruction of complete energy landscapes (reviewed in 51) through the use of deconvolution methods originally developed for the folding of DNA hairpins (52). Deconvolution removes the compliance effects of the instrument and the molecular handles, via either experimentally determined (52) or theory-derived (53) point spread functions, which describe the distribution of measured extensions around the mean that is caused by components other than the protein of interest, including the beads and the DNA handles. This approach has been used to map the folding energy landscape of the GCN4 leucine zipper protein (54). High-resolution passive mode measurements, combined with a newly developed approach for determining the position-dependent point spread function, enabled the definition of distinct regions of stability within the protein that corresponded to the C-terminal and N-terminal heptad repeats in that protein. In another study, the energy landscape of the prion protein could be described (55).
Stigler et al. (29) were able to map the complex folding pathways of calmodulin, detecting both on- and off-pathway intermediates in addition to the unfolded and the fully folded states. Calmodulin is composed of two domains, each of which is formed by two EF-hand motifs. By combining ultrastable optical tweezers measurements of full-length and truncated calmodulin variants with hidden Markov model analysis, six distinct states along the folding pathway were resolved. Attainment of the native state proceeds through one of two folding intermediates in which either the N-terminal domain (EF hands 1 and 2) or the C-terminal domain (EF hands 3 and 4) is folded. Both pathways are equally likely, showing that folding can begin from either end of the molecule. However, EF hands 2 and 3 can adopt a misfolded state through a third pathway. In addition, the intermediate in which the N-terminal domain is structured can transition into a misfolded state. These two misfolding routes thus compete with productive folding, slowing down native state formation. Another EF-hand protein, NCS-1, was found to similarly populate misfolded states that, surprisingly, are stabilized by Ca2+ ions (45). Because all the intermediate folding states of calmodulin are reversibly populated when the molecule is subjected to ~10 pN of tension, it is possible to determine their kinetic connectivity. This connectivity, along with the hidden Markov model analysis–derived lifetimes and thermodynamic stabilities of these intermediates, yielded a detailed folding energy landscape of the molecule that previously could only be speculated about on the basis of computer simulations.
4.3. Pulling Geometries and Reaction Coordinates
The T4 lysozyme experiments described above (4) indicated that the protein unfolds through the same pathway regardless of pulling geometry. Such behavior may not be common, however. Atomic force microscopy experiments indicated that the unfolding force depends on the pulling geometry (56, 57), and molecular dynamics simulations suggested that changes in geometry and loading rate can alter unfolding pathways (58, 59). Using optical tweezers, Jagannathan et al. (60) detected significant differences in the unfolding of the src SH3 domain depending on the points of attachment of the molecular handles. Higher forces were required to unfold the protein when applied longitudinally along—as opposed to perpendicularly to—a β-sheet. Unfolding proceeds through simultaneous shearing of hydrogen bonds in the former geometry, while hydrogen bond unzipping takes place in the latter, revealing the mechanically anisotropic nature of the folded state. Interestingly, unfolding in the unzipping geometry is well described by Bell’s model, whereas the force-dependent unfolding rates in the shearing geometry are biphasic. The biphasic behavior is best described by the sum of two independent Bell models, suggesting two distinct unfolding pathways, each with its own transition state for unfolding. Which pathway is preferred at a given tension depends on the heights and locations of the main barriers, both of which change in response to the applied force. These findings also illustrate that folding landscapes can profoundly change under applied mechanical load (60).
Guinn et al. (61) combined force spectroscopy with chemical denaturation to further dissect the unfolding pathways of the structurally simple src SH3 domain. Chemical denaturants primarily work by stabilizing the hydrocarbon and amide groups that are buried in the folded structure but become exposed upon unfolding. For a two-state folder, the change in folding and unfolding rates with denaturant concentration therefore depends on the amount of surface area that is accessible before reaching the transition state. This denaturant dependence of the unfolding rate is expressed by the m-value—it represents the chemical equivalent to the distance to the transition state in mechanical measurements. A change in transition state structure—that is, in the unfolding pathway—therefore likely results in a change in the m-value. The SH3 domain indeed appears to unfold through two distinct transition states in the shearing geometry, each with its own m-value (61). The existence of two populations of distinct transition states (61) was further confirmed by φ-value analysis, in which the effect of single amino acid substitution on transition state stability is measured (62). This study illustrates that even small protein domains can have surprisingly complex (un)folding energy landscapes and illustrates how adding an independent reaction coordinate to mechanical unfolding experiments can help to untangle this complexity.
Using a similar chemomechanical approach, Motlagh et al. (63) exploited the stabilizing effects of osmolytes to structurally characterize a folding intermediate in T4 lysozyme. Osmolytes are chemically diverse small molecules that counteract denaturants and stabilize folded structures. The degree to which osmolytes stabilize a folded structure is related to the change in available surface area upon folding, similar to the denaturant m-values. The response of an on-pathway folding intermediate of T4 lysozyme to two different osmolytes, sorbitol and trimethylamine N-oxide, along with molecular extension constraints from optical tweezers unfolding experiments and a statistical thermodynamics formalism (64), suggested that the observed intermediate corresponds to the C-terminal subdomain of the protein. The combination of force spectroscopy and chemical stabilization can thus be used as a powerful approach for annotating and structurally characterizing folding intermediates.
4.4. Transition Path Times
The transition state is, by definition, the highest point in the energy landscape and therefore the most sparsely populated one. As a result, the time that a two-state protein spends crossing the barrier between the folded and unfolded state, called transition path time, is very small compared with that spent in either state. Combined with the inherent stochasticity of folding, the transient character of the transition state makes it impossible to observe barrier crossing in ensemble experiments. Recently, however, it has become possible to measure transition path times by using fluorescence (65) and force spectroscopy (66) approaches (Figure 5). The excellent resolution of optical tweezers measurements has proven to be particularly powerful for these measurements.
Figure 5.
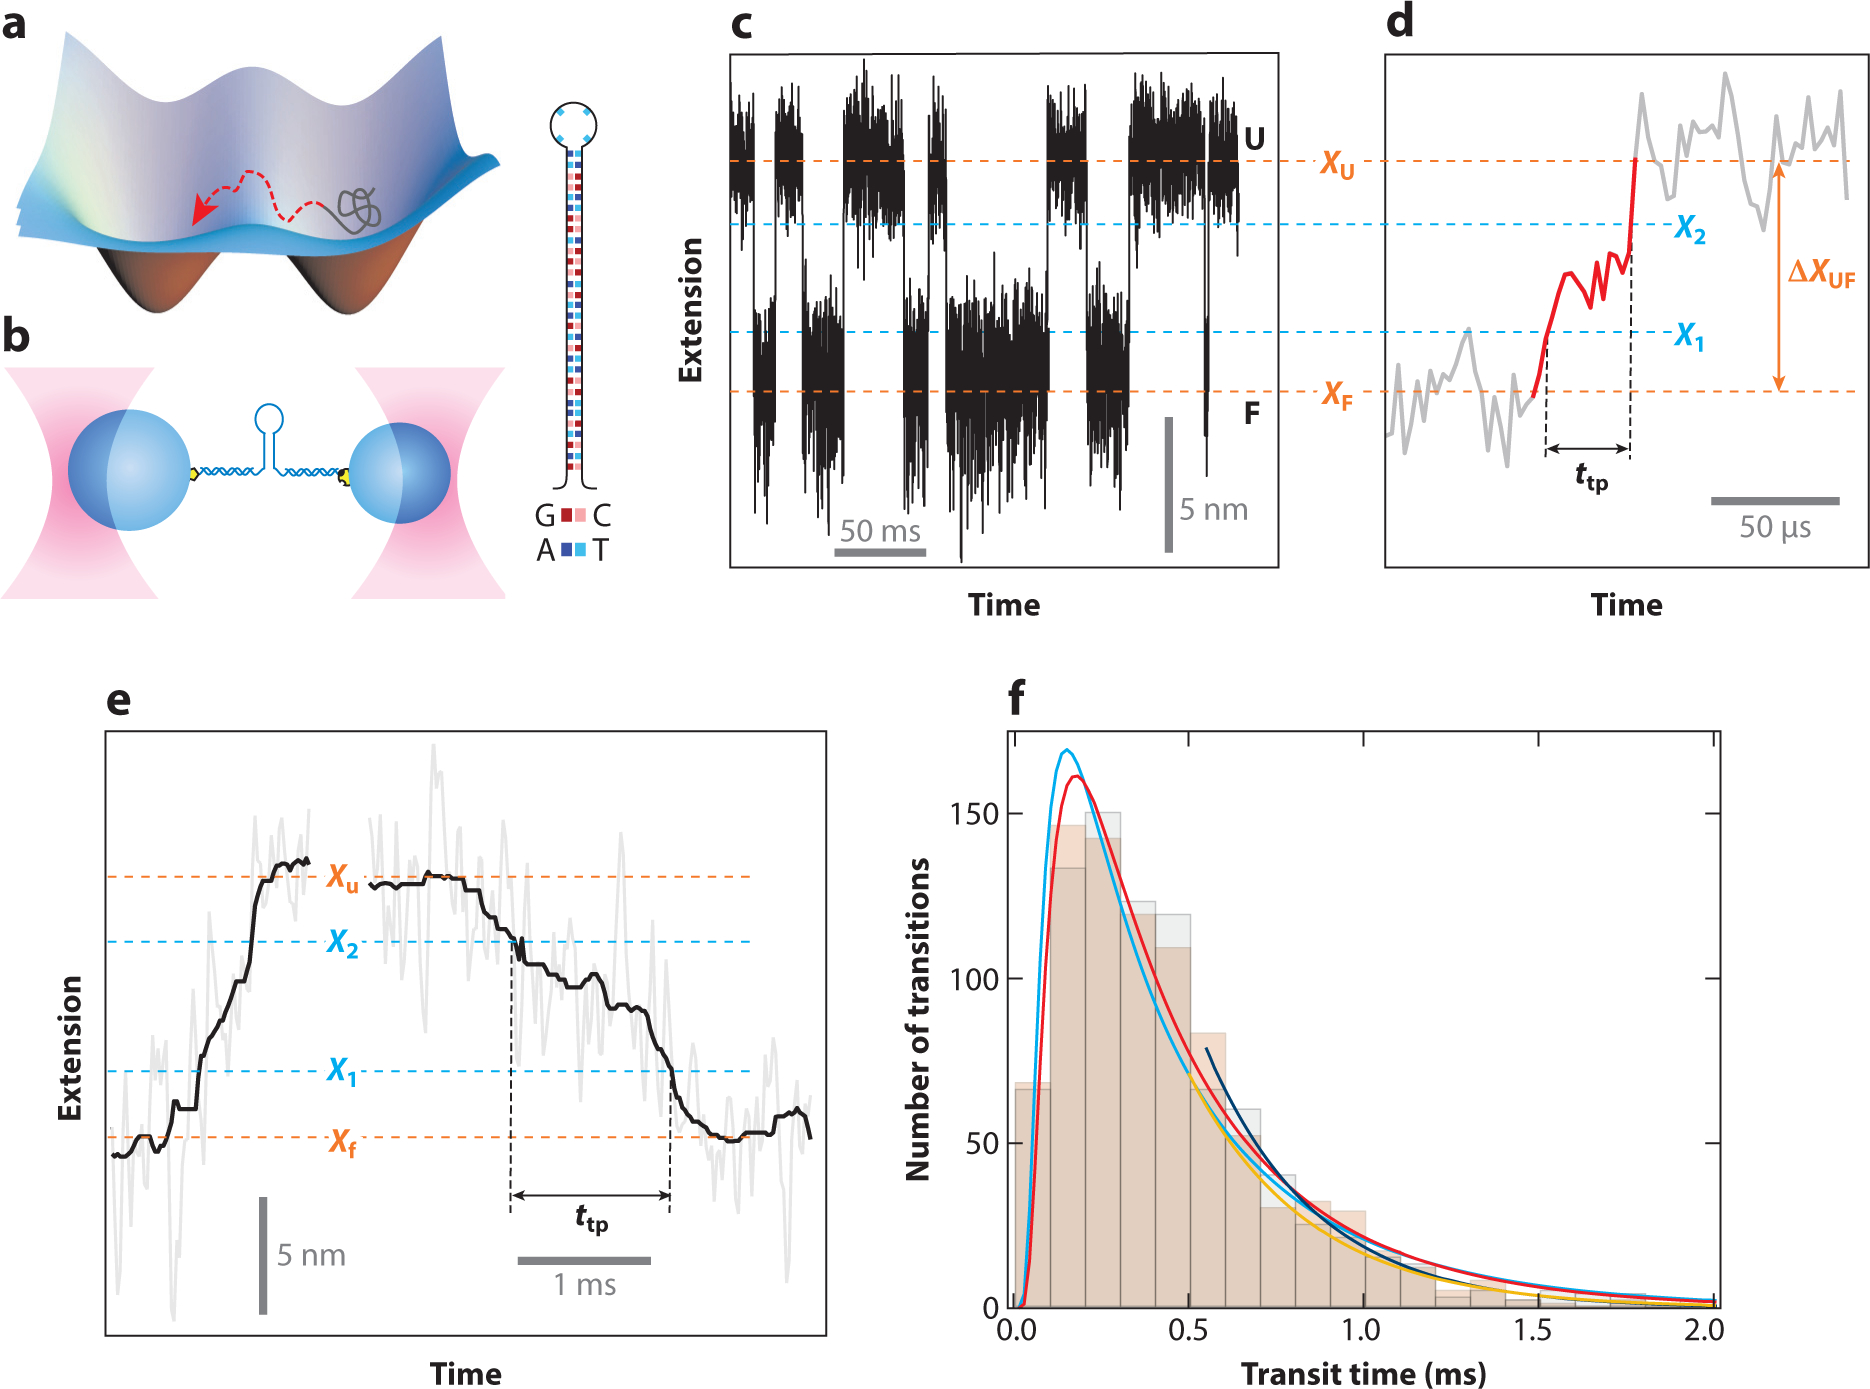
Characterizing transition paths using optical tweezers. (a) The transition state is the least-occupied state in a folding free energy landscape due to its high energy. As such, characterization through the use of traditional biophysical measurements has been impossible. (b) Highly stable dual-trap optical tweezers instruments are well suited to study transition states and transition paths. Initial studies following the folding of DNA hairpins showed that it was possible to directly observe transition states. (c) The hairpin hops between the folded (F) and unfolded (U) states in constant-force equilibrium experiments. (d) Magnified view of an unfolding transition, identified as the part between the folded and unfolded states. These experiments permit the measurement of the transition path time, ttp. (e) Example of a ttp measurement for the prion protein PrP. (f) The ttp distributions are very similar for PrP unfolding (black bars) and folding (beige bars) and are well described by a model based on Kramer’s theory (the cyan curve is for folding, and the red curve is for unfolding). The exponential tails are fit well by a separate equation (the blue curve is for folding and the orange curve is for unfolding). Figure adapted with permission from Neupane et al. (66).
Folding is well described as diffusion over a one-dimensional energy landscape. Yu et al. (67) determined the diffusion constant for PrP folding and unfolding by using Kramer’s equation, from which the transition path time for PrP was calculated to be 2 μs for the unfolded-to-native transition. Interestingly, the transition path time was found to be much slower (~500 μs) for forming (or dissolving) the misfolded state that is prominently populated in PrP dimers. Comparison with kinetic measurements validates these numbers. The much longer time required for crossing into the misfolded state indicates an increased roughness of the energy landscape for this transition. This result suggests that folding to the native state typically avoids nonproductive and mutually exclusive interactions, yielding a smooth, minimally frustrated landscape that may be the result of evolutionary pressure to favor reliable folding (68). The optical tweezers experiments with PrP thus yield mechanistic insight into PrP misfolding, which is likely an early step during pathogenic aggregation.
While energy landscape reconstruction has enabled the determination of transition path times indirectly, as described in the previous paragraph, Neupane et al. (66) were able to directly measure the transition path time for PrP by increasing the trap stiffness of their optical tweezers, which resulted in markedly improved temporal resolution. The direct measurement yielded a transition path time of 500 μs, in agreement with the value obtained from energy landscape reconstruction (Figure 5e,f). It also revealed rich dynamics during barrier crossing and is thus a promising approach for the characterization of microstates during the actual folding process. Importantly, the direct measurement yielded not only the mean transition path time but also its distribution. Knowledge of the distribution enabled a direct comparison with theoretical expectations based on the diffusive search over a one-dimensional energy landscape. The excellent agreement of theory and experiment indicates that this model is a good physical description of the folding process.
4.5. Structurally Complex and Multidomain Proteins
The studies discussed above illustrate how single-molecule manipulation with optical tweezers yields insight into protein folding landscapes at a level of detail that now enables direct comparison of experimental results with molecular dynamics and theory studies. To date, these studies have largely been carried out with relatively small and structurally simple proteins that fold quickly and reversibly. A large fraction of all proteomes is, however, made up of larger, structurally more complex proteins, which do not fit this description (69). Their often highly complex folding pathways and propensity to form aggregating species in vitro makes studying these proteins a challenging task. Single-molecule manipulation bears great promise to overcome these difficulties, because it circumvents intermolecular aggregation and has the potential to resolve complex and potentially heterogeneous folding pathways.
The nucleotide-binding domain of the chaperone heat shock protein 70 (Hsp70) is a member of the large family of sugar kinases, a structural group of proteins with highly diverse functions. This large domain of almost 400 amino acids is organized into two lobes. By pulling on the termini of the nucleotide-binding domain from Escherichia coli Hsp70, Bauer et al. (70) found that lobe II forms an obligatory folding intermediate that serves as a nucleus for further folding. This intermediate is stabilized by ATP binding, which thus would be expected to promote productive folding. The results of an earlier study are consistent with this result (71). The lobe II intermediate is absent in yeast mitochondrial Hsp70, which is incapable of refolding in the single-molecule assay. Strikingly, transplanting the lobe II region from the E. coli into the yeast protein restores refolding (70), illustrating how intermediates in a pathway can break down folding into smaller steps and facilitate overall folding of structurally complex domains.
Jahn et al. (72, 73) dissected the folding of another molecular chaperone, Hsp90. Functional Hsp90 is a homodimer in which each subunit is composed of three domains [N-terminal (N) domain, middle (M) domain, and C-terminal (C) domain]. The N domain alone (211 amino acids) is longer than the complete calmodulin protein discussed above, and the complete Hsp90 protomer is composed of more than 700 amino acids. When the three domains are studied as isolated polypeptides, both the N and M domains exhibit very fast misfolding transitions to states with considerable thermodynamic stabilities, reducing the rate of overall productive folding by several orders of magnitude. Notably, the folding rates for these isolated N and M domains are maximal at approximately 3.5 pN in optical tweezers experiments and lower at smaller forces, indicating that tension decreases misfolding rates to a larger degree than folding rates (72). Similarly, mechanical load also appears to reduce misfolding among domains, as the probability of correct folding is higher at 1.8 pN than at 0.6 pN. Single-molecule mechanical experiments have thus made it possible to resolve some of the complexities arising from intra- and interdomain misfolding in large, multidomain proteins. Misfolding among homologous domains had previously been demonstrated in repeat proteins (74, 75) but appears to be much more pronounced in Hsp90, with its three nonhomologous domains. Cotranslational folding (see Section 4.6) likely is a straightforward mechanism of avoiding this complication. In the cell, the small forces that might be exerted by chaperones such as GroEL (76, 77) could help to reduce both intra- and interdomain misfolding (72), although this idea remains to be thoroughly tested (78). In addition, folding on the ribosome during synthesis also results in the generation of force (79), which might help to further alleviate misfolding.
While off-pathway processes slow down Hsp90 folding, the molecule still reaches the native state within a few seconds (72). Another multidomain protein, elongation factor G (EF-G), showed sequential unfolding of its five constituent domains (80). However, unlike for Hsp90, full refolding of EF-G at low force was not observed within the timescale of the experiment. In contrast, refolding of the isolated N-terminal GTPase domain of EF-G was mostly complete after 10 s at low force. However, in the context of the complete protein, refolding was apparent in only a small fraction of attempts, reflecting interdomain misfolding. It is likely that these nonproductive, long-range interactions in the unfolded polypeptide are, at least in part, avoided when the polypeptide folds in a domain-wise fashion during biosynthesis. The autonomous, robust folding of many domains, including those in Hsp90 (72, 73, 81) and EF-G (80), is consistent with this idea.
4.6. Cotranslational Folding
All cellular proteins are synthesized by the ribosome, a large molecular machine that helps to decode genetic information and synthesizes polypeptides one amino acid at a time. Addition of amino acids to the nascent polypeptide is relatively slow, proceeding at up to ~20 per second in bacteria (82) and considerably more slowly in eukaryotes (83). This slow rate of synthesis provides ample time for cotranslational folding, given that a small domain requires several seconds to be produced, whereas folding typically occurs on the millisecond timescale. It thus appears likely that synthesis and folding are coupled, as first noted more than 50 years ago (84). Experimentally studying this coupling in mechanistic detail, however, has been challenging, and only recently has initial progress been made.
The first optical tweezers study of nascent protein folding on the ribosome was carried out using T4 lysozyme, a protein whose folding has been extensively studied in ensemble measurements (85). Kaiser et al. (40) used ribosome–nascent chain complexes arrested at defined positions in which a C-terminal linker allows the entire T4 lysozyme sequence to be extruded from the ribosome. Attaching handles for force transduction to the large ribosomal subunit and to a position near the N terminus of the nascent protein enabled observation of folding and unfolding of ribosome-bound T4 lysozyme, revealing that the ribosome slows down folding more than 100-fold. When T4 lysozyme is stretched from its termini, it refolds through an obligatory on-pathway intermediate (40). The ribosome specifically delays the final step of folding from the intermediate to the native structure, rather than indiscriminately delaying both steps in this pathway. This effect is particularly pronounced during folding in close proximity to the ribosome and is at least in part mediated by presumably nonspecific electrostatic interactions between the ribosome and the nascent chain. When T4 lysozyme is truncated by 15 amino acids from its C terminus, the polypeptide isolated off the ribosome adopts a heterogeneous ensemble of bona fide misfolded states, whose formation is, however, effectively suppressed by the ribosome. One function of ribosome–nascent chain interactions might thus be to delay premature folding into stable off-pathway structures until sufficient sequence has been synthesized to enable productive folding. A similar effect has been observed for the N-terminal G domain of EF-G (80, 86).
Ribosome interactions with proximal parts of the nascent chain reduce not only folding rates but also misfolding with other parts of the nascent polypeptide. Such a scenario was observed with nascent EF-G polypeptides of varying length. Misfolding between the two N-terminal domains (G domain and domain II) is markedly reduced by the ribosome, resulting in faster productive folding (86). Thus, the net effect of the ribosome on the folding of a given domain depends on nascent chain length (Figure 6a): Folding rates of the G domain are reduced right after it emerges from the ribosome but are increased in longer nascent chains relative to the respective isolated polypeptides (86). Interactions with the ribosome thus help to promote successful domain-wise folding of nascent polypeptides by avoiding long-range misfolding. Cotranslational EF-G folding is disrupted, however, when the C-terminal half of the protein emerges, because the central domain III requires its C-terminal neighbors (domains IV and V) to become stably structured (37; see also Figure 4). These studies thus illustrate the complex interplay of domain and ribosome interactions during nascent chain folding.
Figure 6.
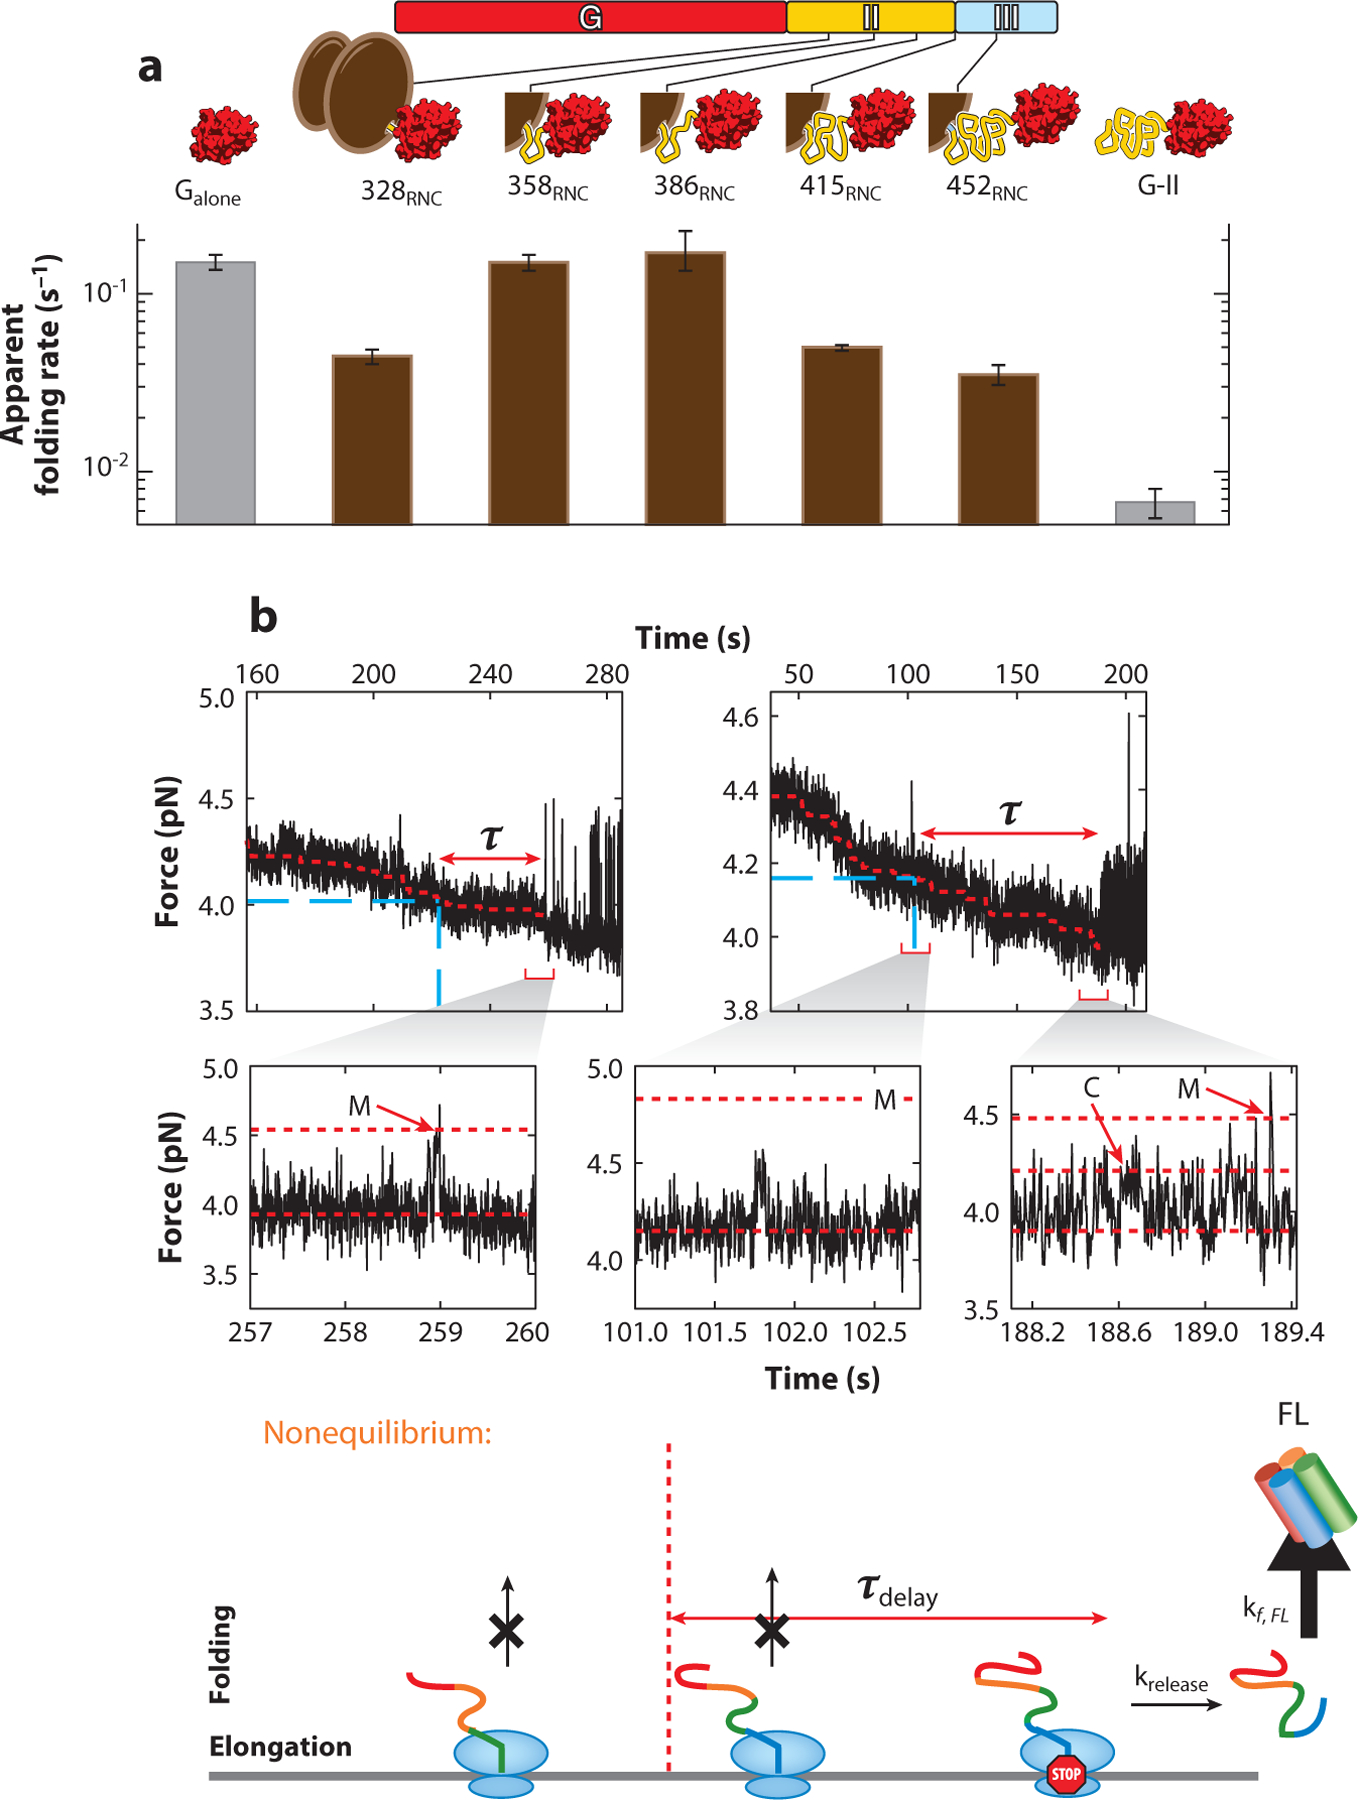
Studying cotranslational folding using optical tweezers. (a) Stalled RNCs were used to measure the folding rate of the G domain (red) of elongation factor G at increasing nascent chain lengths. The ribosome decreases the folding rate in short nascent chains but accelerates it in longer nascent chains by reducing misfolding. How the ribosome modulates folding is therefore dependent on nascent chain length and can switch during polypeptide synthesis. Panel a adapted with permission from Liu et al. (86). (b) Real-time measurement of nascent chain elongation and folding. Calerythrin transiently visits a misfolded state (M) and a native C-terminal intermediate (C). Occupation of the misfolded state is delayed significantly during nascent chain synthesis, relative to the isolated construct. This suggests that misfolded states may be suppressed during cotranslational folding until synthesis is complete, when full-length calerythrin may fold to its native state. Panel b adapted with permission from Alexander et al. (88). Abbreviations: kf,FL, folding rate of the full-length protein; RNC, ribosome–nascent chain complex.
The experiments described above used ribosomes stalled at defined positions along the messenger RNA. In this way, the nascent chains are sampling the same energy landscape, and a detailed picture can be constructed through snapshots of folding pathways at different chain lengths. However, this method can miss short-lived or temporary intermediates of the folding process, or the switching from one dominant pathway to another. To access a true trajectory, folding must be followed in real time as the ribosome synthesizes the protein and the chain length constantly increases. These types of cotranslational folding experiments have recently been achieved using an in vitro reconstituted translation system and ribosomes reversibly stalled via omission of sequentially repeated amino acids. Wruck et al. (87) described gradual hydrophobic collapse and partial folding during synthesis in the optical tweezers.
Real-time measurements can also shed light on strategies for avoiding misfolded trapped states. The protein calerythrin folds after release from the ribosome through a C-terminal intermediate, but truncated stalled ribosome–nascent chain complexes misfold rapidly (88). By following translation in real time (Figure 6b), it was found that a misfolding event that occurs readily with polypeptide fragments in vitro, and more slowly but still rapidly in stalled ribosome–nascent chain complexes, is delayed during active translation by an average time of 63 s. Thus, during real-time translation, the misfolded state is suppressed until synthesis is complete. This observation is surprising because, until now, it was assumed that given that folding is fast relative to the rate of translation, the growing polypeptide must exist at equilibrium with all its accessible configurations at any given time during synthesis (88). This type of slow equilibration could also provide the time required for cofactor or chaperone binding. This process is not observed with stalled ribosome–nascent chain complexes because the nascent chain reaches conformational equilibrium prior to the measurement in the optical tweezers, a process that typically takes tens of minutes. This observation highlights the importance of using real-time cotranslational folding of restarted stalled ribosomes to investigate the dynamic features of the nascent folding pathway.
4.7. Molecular Chaperones
Molecular chaperones are crucial for efficient folding in the crowded environment of the cell (89). While their importance has been unambiguously established, a mechanistic understanding of their function is still rudimentary. Optical tweezers experiments are beginning to shed light on how chaperones shape the folding pathways of their client proteins. Bechtluft et al. (90) studied the effect of the chaperone SecB on mature maltose-binding protein (MBP), a periplasmic protein from E. coli. SecB blocked MBP refolding (90), in line with its function of preventing proteins destined for export from folding in the cytosol, which would hamper their translocation through the membrane. In this way, SecB appears to amplify a similar effect of the signal sequence, which is also known to retard stable folding (91). The chaperone trigger factor, which interacts with both nascent and fully synthesized proteins, also reduces the folding rate of MBP (92), similar to the effect of SecB. However, whereas SecB appears to prevent any stable structure formation in unfolded MBP, transitions consistent with partially folded, compact structures are apparent in optical tweezers experiments with trigger factor (92). Alternatively, binding of a single copy of trigger factor through multiple sites in a single substrate molecule could explain the observed compact states. Such a binding mode was demonstrated in a recent nuclear magnetic resonance study (93). Both trigger factor and SecB reduce the formation of stably misfolded states that form in a tandem repeat construct containing four copies of MBP (90, 92), which suggests that these chaperones reduce long-range contacts that otherwise result in interdomain misfolding. Trigger factor is also known to dock to the ribosome (94), which results in increased affinity for nascent proteins (95). Whether the post- and cotranslational binding modes of the chaperone are similar or distinct remains to be determined.
Optical tweezers experiments with nascent EF-G polypeptides revealed how the trigger factor chaperone remedies an unanticipated complication of cotranslational folding. Unfolded domain II emerging from the ribosome was found to destabilize the cotranslationally folded G domain, resulting in unfolding and the formation of misfolded states between the two domains. The ribosome itself does not protect against this denaturation, but trigger factor effectively blocks it (86). Since unfolded polypeptide is inevitably present during protein synthesis, chaperones might serve not only to reduce long-range misfolding but also to protect already folded parts of the nascent chain against denaturation. These experiments thus define a novel function for nascent chain-binding chaperones, which are present in all organisms, and provides a new paradigmatic mechanism for how chaperones help cotranslational folding.
The Hsp70 chaperone DnaK from E. coli binds and releases its substrates in a manner regulated by ATP binding and hydrolysis (96). In the ATP-bound state, the chaperone binds rapidly but weakly to the substrate protein. ATP hydrolysis, stimulated by the cochaperone DnaJ, results in tight binding with low on and off rates. The nucleotide exchange factor GrpE catalyzes the exchange of adenosine diphosphate for ATP and resets the system. In the presence of ATP, DnaJ, and GrpE, DnaK increased the probability of refolding in the same tandem-repeat MBP construct used to study SecB and trigger factor (97). Surprisingly, DnaK stabilized the core MBP structure against mechanical unfolding in a construct containing a single MBP under conditions that favored strong chaperone binding. It therefore appears that the chaperone stabilizes structured states, in addition to its established role of binding unfolded segments and preventing the formation of nonnative contacts among them. Ensemble experiments showed an increased thermal stability of the authentic DnaK substrate RepE, supporting this conclusion (97). It will be interesting to characterize how the DnaK system modulates the folding of authentic substrate proteins at the resolution afforded by single-molecule optical tweezers experiments.
5. EPILOGUE
The application of mechanical force through the use of optical tweezers has yielded a wealth of information on protein folding, including the topography of the potential energy surface over which the molecule diffuses in its search of the native state, the kinetics, and the thermodynamics of the process. These developments have been accompanied by advances in the resolution, the SNR, and control of the forces, as well as in the theoretical description of how best to extract the information from experiments (theory of measurement). It seems likely that future advances will occur along several exciting lines of research, some of which have already been initiated. From the technical point of view, the development of optical tweezers instruments with single-molecule fluorescence-detection capabilities (instruments known as fleezers, for fluorescence + tweezers) is likely to provide a more complete description of protein folding and unfolding, by providing a multidimensional registry of the process. From a conceptual point of view, the ability to follow in real time the growth and concomitant folding of a single polypeptide as it arises on the surface of the ribosome should yield much-needed insight into the de novo folding that occurs inside the cell during synthesis. Lastly, it appears likely that experiments designed to follow protein folding in vitro, at the single-molecule level, will attempt to reproduce ever more closely the complex environment of the cell interior, including crowding effects, and the presence of other factors such as chaperones that participate and aid the folding process in vivo. These studies, combined with experiments designed to investigate the activity of motors such as proteases and unfoldases involved in the maintenance of cellular proteostasis, should allow researchers to obtain a much sharper picture of the complex process of protein folding.
ACKNOWLEDGMENTS
C.B. acknowledges support from the Nanomachines program (KC1203) funded by the Office of Basic Energy Sciences of the US Department of Energy (contract DE-AC02-05CH11231), the Howard Hughes Medical Institute, and the National Institutes of Health (grants R01GM071552 and R01GM032543). K.M. acknowledges support from the Cell, Molecular, Developmental Biology, and Biophysics (CMDB) graduate program (National Institutes of Health training grant 5T32GM007231). C.M.K. acknowledges support from the National Institutes of Health (grant 5R01GM121567) and the Pew Scholars Program.
Footnotes
DISCLOSURE STATEMENT
The authors are not aware of any affiliations, memberships, funding, or financial holdings that might be perceived as affecting the objectivity of this review.
LITERATURE CITED
- 1.Rief M, Gautel M, Oesterhelt F, Fernandez JM, Gaub HE. 1997. Reversible unfolding of individual titin immunoglobulin domains by AFM. Science 276:1109–12 [DOI] [PubMed] [Google Scholar]
- 2.Kellermayer MS, Smith SB, Granzier HL, Bustamante C. 1997. Folding-unfolding transitions in single titin molecules characterized with laser tweezers. Science 276:1112–16 [DOI] [PubMed] [Google Scholar]
- 3.Tskhovrebova L, Trinick J, Sleep JA, Simmons RM. 1997. Elasticity and unfolding of single molecules of the giant muscle protein titin. Nature 387:308–12 [DOI] [PubMed] [Google Scholar]
- 4.Shank EA, Cecconi C, Dill JW, Marqusee S, Bustamante C. 2010. The folding cooperativity of a protein is controlled by its chain topology. Nature 465:637–40 [DOI] [PMC free article] [PubMed] [Google Scholar]
- 5.Tapia-Rojo R, Eckels EC, Fernández JM. 2019. Ephemeral states in protein folding under force captured with a magnetic tweezers design. PNAS 116:7873–78 [DOI] [PMC free article] [PubMed] [Google Scholar]
- 6.Löf A, Walker PU, Sedlak SM, Gruber S, Obser T, et al. 2019. Multiplexed protein force spectroscopy reveals equilibrium protein folding dynamics and the low-force response of von Willebrand factor. PNAS 116:18798–807 [DOI] [PMC free article] [PubMed] [Google Scholar]
- 7.Jackson JD. 1999. Classical Electrodynamics. New York: Wiley; 3rd ed. [Google Scholar]
- 8.Ashkin A, Dziedzic JM, Bjorkholm JE, Chu S. 1986. Observation of a single-beam gradient force optical trap for dielectric particles. Opt. Lett 11:288–90 [DOI] [PubMed] [Google Scholar]
- 9.Žoldák G, Stigler J, Pelz B, Li H, Rief M. 2013. Ultrafast folding kinetics and cooperativity of villin headpiece in single-molecule force spectroscopy. PNAS 110:18156–61 [DOI] [PMC free article] [PubMed] [Google Scholar]
- 10.Moffitt JR, Chemla YR, Izhaky D, Bustamante C. 2006. Differential detection of dual traps improves the spatial resolution of optical tweezers. PNAS 103:9006–11 [DOI] [PMC free article] [PubMed] [Google Scholar]
- 11.Bustamante C, Chemla YR, Forde NR, Izhaky D. 2004. Mechanical processes in biochemistry. Annu. Rev. Biochem 73:705–48 [DOI] [PubMed] [Google Scholar]
- 12.Bell GI. 1978. Models for the specific adhesion of cells to cells. Science 200:618–27 [DOI] [PubMed] [Google Scholar]
- 13.Wen J-D, Manosas M, Li PTX, Smith SB, Bustamante C, et al. 2007. Force unfolding kinetics of RNA using optical tweezers. I. Effects of experimental variables on measured results. Biophys. J 92:2996–3009 [DOI] [PMC free article] [PubMed] [Google Scholar]
- 14.Greenleaf WJ, Woodside MT, Abbondanzieri EA, Block SM. 2005. Passive all-optical force clamp for high-resolution laser trapping. Phys. Rev. Lett 95:208102. [DOI] [PMC free article] [PubMed] [Google Scholar]
- 15.Dudko OK, Hummer G, Szabo A. 2006. Intrinsic rates and activation free energies from single-molecule pulling experiments. Phys. Rev. Lett 96:108101. [DOI] [PubMed] [Google Scholar]
- 16.Hummer G, Szabo A. 2003. Kinetics from nonequilibrium single-molecule pulling experiments. Biophys. J 85:5–15 [DOI] [PMC free article] [PubMed] [Google Scholar]
- 17.Landry MP, McCall PM, Qi Z, Chemla YR. 2009. Characterization of photoactivated singlet oxygen damage in single-molecule optical trap experiments. Biophys. J 97:2128–36 [DOI] [PMC free article] [PubMed] [Google Scholar]
- 18.Cecconi C, Shank EA, Bustamante C, Marqusee S. 2005. Direct observation of the three-state folding of a single protein molecule. Science 309:2057–60 [DOI] [PubMed] [Google Scholar]
- 19.Pfitzner E, Wachauf C, Kilchherr F, Pelz B, Shih WM, et al. 2013. Rigid DNA beams for high-resolution single-molecule mechanics. Angew. Chem. Int. Ed 52:7766–71 [DOI] [PMC free article] [PubMed] [Google Scholar]
- 20.Bustamante C, Marko JF, Siggia ED, Smith SB. 1994. Entropic elasticity of lambda phage DNA. Science 265:1599–600 [DOI] [PubMed] [Google Scholar]
- 21.Smith SB, Cui Y, Bustamante C. 1996. Overstretching B-DNA: the elastic response of individual double-stranded and single-stranded DNA molecules. Science 271:795–99 [DOI] [PubMed] [Google Scholar]
- 22.Wang MD, Yin H, Landick R, Gelles J, Block SM. 1997. Stretching DNA with optical tweezers. Biophys. J 72:1335–46 [DOI] [PMC free article] [PubMed] [Google Scholar]
- 23.Marko JF, Siggia ED. 1995. Stretching DNA. 28:8759–70 [Google Scholar]
- 24.Bouchiat C, Wang MD, Allemand J-F, Strick T, Block SM, Croquette V. 1999. Estimating the persistence length of a worm-like chain molecule from force-extension measurements. Biophys. J 76:409–13 [DOI] [PMC free article] [PubMed] [Google Scholar]
- 25.Baumann C, Smith SB, Bloomfield VA, Bustamante C. 1997. Ionic effects on the elasticity of single DNA molecules. PNAS 94:6185–90 [DOI] [PMC free article] [PubMed] [Google Scholar]
- 26.Yang G, Cecconi C, Baase WA, Vetter IR, Breyer WA, et al. 2000. Solid-state synthesis and mechanical unfolding of polymers of T4 lysozyme. PNAS 97:139–44 [DOI] [PMC free article] [PubMed] [Google Scholar]
- 27.Vieregg J, Cheng W, Bustamante C, Tinoco I. 2007. Measurement of the effect of monovalent cations on RNA hairpin stability. J. Am. Chem. Soc 129:14966–73 [DOI] [PMC free article] [PubMed] [Google Scholar]
- 28.Allersma MW, Gittes F, deCastro MJ, Stewart RJ, Schmidt CF. 1998. Two-dimensional tracking of ncd motility by back focal plane interferometry. Biophys. J 74:1074–85 [DOI] [PMC free article] [PubMed] [Google Scholar]
- 29.Stigler J, Ziegler F, Gieseke A, Gebhardt JC, Rief M. 2011. The complex folding network of single calmodulin molecules. Science 334:512–16 [DOI] [PubMed] [Google Scholar]
- 30.Jarzynski C 1997. Nonequilibrium equality for free energy differences. Phys. Rev. Lett 78:2690–93 [Google Scholar]
- 31.Crooks GE. 1999. Entropy production fluctuation theorem and the nonequilibrium work relation for free energy differences. Phys. Rev. E 60:2721–26 [DOI] [PubMed] [Google Scholar]
- 32.Liphardt J, Dumont S, Smith SB, Tinoco I Jr., Bustamante C 2002. Equilibrium information from nonequilibrium measurements in an experimental test of Jarzynski’s equality. Science 296:1832–35 [DOI] [PubMed] [Google Scholar]
- 33.Collin D, Ritort F, Jarzynski C, Smith SB, Tinoco I, Bustamante C. 2005. Verification of the Crooks fluctuation theorem and recovery of RNA folding free energies. Nature 437:231–34 [DOI] [PMC free article] [PubMed] [Google Scholar]
- 34.Dudko OK, Hummer G, Szabo A. 2008. Theory, analysis, and interpretation of single-molecule force spectroscopy experiments. PNAS 105:15755–60 [DOI] [PMC free article] [PubMed] [Google Scholar]
- 35.Jarzynski C 1997. Nonequilibrium equality for free energy differences. Phys. Rev. Lett 78:2690–93 [Google Scholar]
- 36.Liphardt J, Dumont S, Smith SB, Tinoco I, Bustamante C. 2002. Equilibrium information from nonequilibrium measurements in an experimental test of Jarzynski’s equality. Science 296:1832–35 [DOI] [PubMed] [Google Scholar]
- 37.Liu K, Chen X, Kaiser CM. 2019. Energetic dependencies dictate folding mechanism in a complex protein. PNAS. 116:25641–48 [DOI] [PMC free article] [PubMed] [Google Scholar]
- 38.Zhang Y, Dudko OK. 2013. A transformation for the mechanical fingerprints of complex biomolecular interactions. PNAS 110:16432–37 [DOI] [PMC free article] [PubMed] [Google Scholar]
- 39.Liphardt J, Onoa B, Smith SB, Tinoco I Jr., Bustamante C 2001. Reversible unfolding of single RNA molecules by mechanical force. Science 292:733–37 [DOI] [PubMed] [Google Scholar]
- 40.Kaiser CM, Goldman DH, Chodera JD, Tinoco I Jr., Bustamante C 2011. The ribosome modulates nascent protein folding. Science 334:1723–27 [DOI] [PMC free article] [PubMed] [Google Scholar]
- 41.Mckinney SA, Joo C, Ha T. 2006. Analysis of single-molecule FRET trajectories using hidden Markov modeling. Biophys. J 91:1941–51 [DOI] [PMC free article] [PubMed] [Google Scholar]
- 42.Stigler J, Rief M. 2012. Hidden Markov analysis of trajectories in single-molecule experiments and the effects of missed events. Chem. Phys. Chem 13:1079–86 [DOI] [PubMed] [Google Scholar]
- 43.Sgouralis I, Whitmore M, Lapidus L, Comstock MJ, Presse S. 2018. Single molecule force spectroscopy at high data acquisition: a Bayesian nonparametric analysis. J. Chem. Phys 148:123320. [DOI] [PubMed] [Google Scholar]
- 44.Elms PJ, Chodera JD, Bustamante C, Marqusee S. 2012. Limitations of constant-force-feedback experiments. Biophys. J 103:1490–99 [DOI] [PMC free article] [PubMed] [Google Scholar]
- 45.Heidarsson PO, Naqvi MM, Otazo MR, Mossa A, Kragelund BB, Cecconi C. 2014. Direct single-molecule observation of calcium-dependent misfolding in human neuronal calcium sensor-1. PNAS 111:13069–74 [DOI] [PMC free article] [PubMed] [Google Scholar]
- 46.Cossio P, Hummer G, Szabo A. 2015. On artifacts in single-molecule force spectroscopy. PNAS 112:14248–53 [DOI] [PMC free article] [PubMed] [Google Scholar]
- 47.Suzuki Y, Dudko OK. 2013. Single molecules in an extension clamp: extracting rates and activation barriers. Phys. Rev. Lett 110:158105. [DOI] [PubMed] [Google Scholar]
- 48.Li PTX, Collin D, Smith SB, Bustamante C, Tinoco I. 2006. Probing the mechanical folding kinetics of TAR RNA by hopping, force-jump and force-ramp methods. Biophys. J 90:250–60 [DOI] [PMC free article] [PubMed] [Google Scholar]
- 49.Raschke TM, Marqusee S. 1997. The kinetic folding intermediate of ribonuclease H resembles the acid molten globule and partially unfolded molecules detected under native conditions. Nat. Struct. Biol 4:298–304 [DOI] [PubMed] [Google Scholar]
- 50.Yu H, Liu X, Neupane K, Gupta AN, Brigley AM, et al. 2012. Direct observation of multiple misfolding pathways in a single prion protein molecule. PNAS 109:5283–88 [DOI] [PMC free article] [PubMed] [Google Scholar]
- 51.Woodside MT, Block SM. 2014. Reconstructing folding energy landscapes by single-molecule force spectroscopy. Annu. Rev. Biophys 43:19–39 [DOI] [PMC free article] [PubMed] [Google Scholar]
- 52.Woodside MT, Anthony PC, Behnke-Parks WM, Larizadeh K, Herschlag D, Block SM. 2006. Direct measurement of the full, sequence-dependent folding landscape of a nucleic acid. Science 314:1001–4 [DOI] [PMC free article] [PubMed] [Google Scholar]
- 53.Hinczewski M, Gebhardt JC, Rief M, Thirumalai D. 2013. From mechanical folding trajectories to intrinsic energy landscapes of biopolymers. PNAS 110:4500–5 [DOI] [PMC free article] [PubMed] [Google Scholar]
- 54.Gebhardt JC, Bornschlogl T, Rief M. 2010. Full distance-resolved folding energy landscape of one single protein molecule. PNAS 107:2013–18 [DOI] [PMC free article] [PubMed] [Google Scholar]
- 55.Yu H, Gupta AN, Liu X, Neupane K, Brigley AM, et al. 2012. Energy landscape analysis of native folding of the prion protein yields the diffusion constant, transition path time, and rates. PNAS 109:14452–57 [DOI] [PMC free article] [PubMed] [Google Scholar]
- 56.Marszalek PE, Lu H, Li H, Carrion-Vazquez M, Oberhauser AF, et al. 1999. Mechanical unfolding intermediates in titin modules. Nature 402:100–3 [DOI] [PubMed] [Google Scholar]
- 57.Dietz H, Berkemeier F, Bertz M, Rief M. 2006. Anisotropic deformation response of single protein molecules. PNAS 103:12724–28 [DOI] [PMC free article] [PubMed] [Google Scholar]
- 58.Best RB, Fowler SB, Herrera JL, Steward A, Paci E, Clarke J. 2003. Mechanical unfolding of a titin Ig domain: structure of transition state revealed by combining atomic force microscopy, protein engineering and molecular dynamics simulations. J. Mol. Biol 330:867–77 [DOI] [PubMed] [Google Scholar]
- 59.Best RB, Paci E, Hummer G, Dudko OK. 2008. Pulling direction as a reaction coordinate for the mechanical unfolding of single molecules. J. Phys. Chem. B 112:5968–76 [DOI] [PubMed] [Google Scholar]
- 60.Jagannathan B, Elms PJ, Bustamante C, Marqusee S. 2012. Direct observation of a force-induced switch in the anisotropic mechanical unfolding pathway of a protein. PNAS 109:17820–25 [DOI] [PMC free article] [PubMed] [Google Scholar]
- 61.Guinn EJ, Jagannathan B, Marqusee S. 2015. Single-molecule chemo-mechanical unfolding reveals multiple transition state barriers in a small single-domain protein. Nat. Commun 6:6861. [DOI] [PMC free article] [PubMed] [Google Scholar]
- 62.Fersht AR, Matouschek A, Serrano L. 1992. The folding of an enzyme. I. Theory of protein engineering analysis of stability and pathway of protein folding. J. Mol. Biol 224:771–82 [DOI] [PubMed] [Google Scholar]
- 63.Motlagh HN, Toptygin D, Kaiser CM, Hilser VJ. 2016. Single-molecule chemo-mechanical spectroscopy provides structural identity of folding intermediates. Biophys. J 110:1280–90 [DOI] [PMC free article] [PubMed] [Google Scholar]
- 64.Hilser VJ, Freire E. 1996. Structure-based calculation of the equilibrium folding pathway of proteins. Correlation with hydrogen exchange protection factors. J. Mol. Biol 262:756–72 [DOI] [PubMed] [Google Scholar]
- 65.Chung HS, Louis JM, Eaton WA. 2009. Experimental determination of upper bound for transition path times in protein folding from single-molecule photon-by-photon trajectories. PNAS 106:11837–44 [DOI] [PMC free article] [PubMed] [Google Scholar]
- 66.Neupane K, Foster DA, Dee DR, Yu H, Wang F, Woodside MT. 2016. Direct observation of transition paths during the folding of proteins and nucleic acids. Science 352:239–42 [DOI] [PubMed] [Google Scholar]
- 67.Yu H, Dee DR, Liu X, Brigley AM, Sosova I, Woodside MT. 2015. Protein misfolding occurs by slow diffusion across multiple barriers in a rough energy landscape. PNAS 112:8308–13 [DOI] [PMC free article] [PubMed] [Google Scholar]
- 68.Bryngelson JD, Wolynes PG. 1987. Spin glasses and the statistical mechanics of protein folding. PNAS 84:7524–28 [DOI] [PMC free article] [PubMed] [Google Scholar]
- 69.Braselmann E, Chaney JL, Clark PL. 2013. Folding the proteome. Trends Biochem. Sci 38:337–44 [DOI] [PMC free article] [PubMed] [Google Scholar]
- 70.Bauer D, Meinhold S, Jakob RP, Stigler J, Merkel U, et al. 2018. A folding nucleus and minimal ATP binding domain of Hsp70 identified by single-molecule force spectroscopy. PNAS 115:4666–71 [DOI] [PMC free article] [PubMed] [Google Scholar]
- 71.Bauer D, Merz DR, Pelz B, Theisen KE, Yacyshyn G, et al. 2015. Nucleotides regulate the mechanical hierarchy between subdomains of the nucleotide binding domain of the Hsp70 chaperone DnaK. PNAS 112:10389–94 [DOI] [PMC free article] [PubMed] [Google Scholar]
- 72.Jahn M, Buchner J, Hugel T, Rief M. 2016. Folding and assembly of the large molecular machine Hsp90 studied in single-molecule experiments. PNAS 113:1232–37 [DOI] [PMC free article] [PubMed] [Google Scholar]
- 73.Jahn M, Tych K, Girstmair H, Steinmassl M, Hugel T, et al. 2018. Folding and domain interactions of three orthologs of Hsp90 studied by single-molecule force spectroscopy. Structure 26:96–105 [DOI] [PubMed] [Google Scholar]
- 74.Oberhauser AF, Marszalek PE, Carrion-Vazquez M, Fernandez JM. 1999. Single protein misfolding events captured by atomic force microscopy. Nat. Struct. Biol 6:1025–28 [DOI] [PubMed] [Google Scholar]
- 75.Borgia MB, Borgia A, Best RB, Steward A, Nettels D, et al. 2011. Single-molecule fluorescence reveals sequence-specific misfolding in multidomain proteins. Nature 474:662–65 [DOI] [PMC free article] [PubMed] [Google Scholar]
- 76.Shtilerman M, Lorimer GH, Englander SW. 1999. Chaperonin function: folding by forced unfolding. Science 284:822–25 [DOI] [PMC free article] [PubMed] [Google Scholar]
- 77.Lin Z, Madan D, Rye HS. 2008. GroEL stimulates protein folding through forced unfolding. Nat. Struct. Mol. Biol 15:303–11 [DOI] [PMC free article] [PubMed] [Google Scholar]
- 78.Hayer-Hartl M, Bracher A, Hartl FU. 2016. The GroEL-GroES chaperonin machine: a nano-cage for protein folding. Trends Biochem. Sci 41:62–76 [DOI] [PubMed] [Google Scholar]
- 79.Goldman DH, Kaiser CM, Milin A, Righini M, Tinoco I Jr., Bustamante C 2015. Mechanical force releases nascent chain-mediated ribosome arrest in vitro and in vivo. Science 348:457–60 [DOI] [PMC free article] [PubMed] [Google Scholar]
- 80.Liu K, Rehfus JE, Mattson E, Kaiser CM. 2017. The ribosome destabilizes native and non-native structures in a nascent multidomain protein. Protein Sci. 26:1439–51 [DOI] [PMC free article] [PubMed] [Google Scholar]
- 81.Jahn M, Rehn A, Pelz B, Hellenkamp B, Richter K, et al. 2014. The charged linker of the molecular chaperone Hsp90 modulates domain contacts and biological function. PNAS 111:17881–86 [DOI] [PMC free article] [PubMed] [Google Scholar]
- 82.Bremer H, Dennis PP. 2008. Modulation of hemical composition and other parameters of the cell at different exponential growth rates. EcoSal Plus 3 10.1128/ecosal.5.2.3 [DOI] [PubMed] [Google Scholar]
- 83.Bostrom K, Wettesten M, Boren J, Bondjers G, Wiklund O, Olofsson SO. 1986. Pulse-chase studies of the synthesis and intracellular transport of apolipoprotein B-100 in Hep G2 cells. J. Biol. Chem 261:13800–6 [PubMed] [Google Scholar]
- 84.Phillips DC. 1967. Hen egg-white lysozyme molecule. PNAS 57:484–95 [DOI] [PubMed] [Google Scholar]
- 85.Baase WA, Liu L, Tronrud DE, Matthews BW. 2010. Lessons from the lysozyme of phage T4. Protein Sci. 19:631–41 [DOI] [PMC free article] [PubMed] [Google Scholar]
- 86.Liu K, Maciuba K, Kaiser CM. 2019. The ribosome cooperates with a chaperone to guide multi-domain protein folding. Mol. Cell 74:310–19 [DOI] [PMC free article] [PubMed] [Google Scholar]
- 87.Wruck F, Katranidis A, Nierhaus KH, Büldt G, Hegner M. 2017. Translation and folding of single proteins in real time. PNAS 114:E4399–407 [DOI] [PMC free article] [PubMed] [Google Scholar]
- 88.Alexander L, Goldman DH, Wee LM, Bustamante C. 2019. Non-equilibrium dynamics of a nascent polypeptide during translation suppress its misfolding. Nat. Commun 10:2709. [DOI] [PMC free article] [PubMed] [Google Scholar]
- 89.Kim YE, Hipp MS, Bracher A, Hayer-Hartl M, Hartl FU. 2013. Molecular chaperone functions in protein folding and proteostasis. Annu. Rev. Biochem 82:323–55 [DOI] [PubMed] [Google Scholar]
- 90.Bechtluft P, van Leeuwen RG, Tyreman M, Tomkiewicz D, Nouwen N, et al. 2007. Direct observation of chaperone-induced changes in a protein folding pathway. Science 318:1458–61 [DOI] [PubMed] [Google Scholar]
- 91.Park S, Liu G, Topping TB, Cover WH, Randall LL. 1988. Modulation of folding pathways of exported proteins by the leader sequence. Science 239:1033–35 [DOI] [PubMed] [Google Scholar]
- 92.Mashaghi A, Kramer G, Bechtluft P, Zachmann-Brand B, Driessen AJ, et al. 2013. Reshaping of the conformational search of a protein by the chaperone trigger factor. Nature 500:98–101 [DOI] [PubMed] [Google Scholar]
- 93.Saio T, Guan X, Rossi P, Economou A, Kalodimos CG. 2014. Structural basis for protein antiaggregation activity of the trigger factor chaperone. Science 344:1250494. [DOI] [PMC free article] [PubMed] [Google Scholar]
- 94.Kramer G, Rauch T, Rist W, Vorderwulbecke S, Patzelt H, et al. 2002. L23 protein functions as a chaperone docking site on the ribosome. Nature 419:171–74 [DOI] [PubMed] [Google Scholar]
- 95.Kaiser CM, Chang HC, Agashe VR, Lakshmipathy SK, Etchells SA, et al. 2006. Real-time observation of trigger factor function on translating ribosomes. Nature 444:455–60 [DOI] [PubMed] [Google Scholar]
- 96.Clerico EM, Tilitsky JM, Meng W, Gierasch LM. 2015. How Hsp70 molecular machines interact with their substrates to mediate diverse physiological functions. J. Mol. Biol 427:1575–88 [DOI] [PMC free article] [PubMed] [Google Scholar]
- 97.Mashaghi A, Bezrukavnikov S, Minde DP, Wentink AS, Kityk R, et al. 2016. Alternative modes of client binding enable functional plasticity of Hsp70. Nature 539:448–51 [DOI] [PubMed] [Google Scholar]