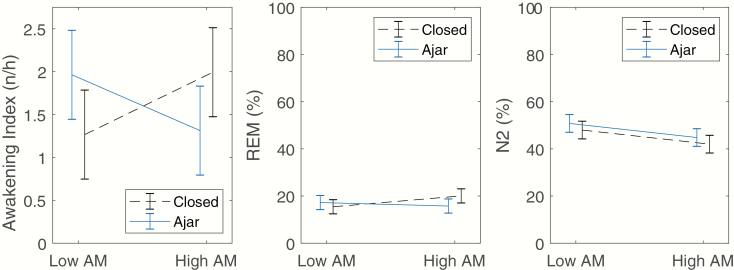
Figure 2.
Left pane: Interaction between AM depth and window filter for awakening frequency. The Window × AM interaction was significant (p = 0.002). Center pane: Interaction between AM depth and window filter for proportion of REM sleep. The Window × AM interaction was significant (p = 0.047). Right pane: Interaction between AM depth and window filter for N2 sleep. The Window × AM interaction was not statistically significant, p = 0.777. There was a significantly lower proportion of N2 sleep during High AM WTN periods than Low AM WTN periods (p = 0.011). All data shown are estimated marginal means from the mixed regression model, adjusted for covariates included in the model (Table 4). Error bars indicate 95% confidence intervals.

