

Abstract
Heterogeneity in skeletal muscle contraction time, peak power output, and resistance to fatigue, among others, is necessary to accommodate the wide range of functional demands imposed on the body. Underlying this functional heterogeneity are a myriad of differences in the myofilament protein isoform expression and post-translational modifications; yet, characterizing this heterogeneity remains challenging. Herein, we have utilized top-down liquid chromatography (LC)-mass spectrometry (MS)-based proteomics to characterize myofilament proteoform heterogeneity in seven rat skeletal muscle tissues including vastus lateralis, vastus medialis, vastus intermelius, rectus femoris, soleus, gastrocnemius, and plantaris. Top-down proteomics revealed myofilament proteoforms varied greatly across the seven different rat skeletal muscle tissues. Subsequently, we quantified and characterized myofilament proteoforms using online LC-MS. We have comprehensively characterized the fast and slow skeletal troponin I isoforms, which demonstrates the ability of top-down MS to decipher isoforms with high sequence homology. Taken together, we have shown that top-down proteomics can be used as a robust and high-throughput method to characterize the molecular heterogeneity of myofilament proteoforms from various skeletal muscle tissues.
Keywords: Top-Down Mass Spectrometry, Skeletal Muscle, Myofilament Proteins, Heterogeneity
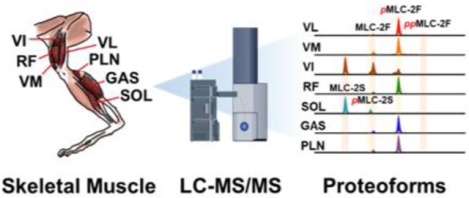
Graphical Abstract
Introduction
Mammalian skeletal muscle tissues are highly heterogeneous due to the diverse array of muscular functions needed for bodily regulation and homeostasis.1–4 Skeletal muscles consist of multi-nucleated cells called muscle fibers that are classified into fast- (type II) and slow- (type I) twitch fibers.5 Skeletal muscle fibers are composed of sarcomeres, which are the basic contractile units of skeletal muscle, with interdigitating thick and thin myofilaments bordered by protein-dense structures called Z-discs.6–8 Myofilament proteins comprise the thin and thick filaments, which mediate muscle contraction.8–10 Highly abundant myofilament proteins include the thin filament proteins: actin, tropomyosin (Tpm), and the troponin complex, troponin C (TnC), troponin T (TnT), and troponin I (TnI); and the thick filament proteins: the myosin light chains, myosin heavy chain (MHC), and myosin binding protein C.6–10 Previous studies have shown that different myofilament protein isoforms are expressed in disparate skeletal muscle tissues and found these differences to be crucial for the physiological functions of the specific muscle.11–13 In addition, post-translational modifications (PTMs) of myofilament proteins play critical roles in the function of skeletal muscle tissues.3,14–17 Therefore, it is highly important to decipher the heterogeneity of various myofilament proteoforms in different skeletal muscle tissues.
Top-down mass spectrometry (MS)-based proteomics is the premier tool to comprehensively characterize proteoforms-the myriad of protein products arising from a single gene due to genetic variants, alternative RNA splicing, and PTMs.18–23 In particular, top-down tandem MS (MS/MS) can characterize proteoforms of interests and locate sites of PTMs and amino acid sequence variations.24–26 Likewise, top-down proteomics can also effectively distinguish isoforms encoded by different genes from a gene family, which often exhibit high sequence homology (i.e. α-Tpm and β-Tpm are isoforms that come from two different genes, Tpm1 and Tpm2 respectively).15,27–29 We have recently established a top-down liquid chromatography (LC)-MS/MS method that can rapidly analyze skeletal muscle tissues and its application to sarcopenia, an age-related loss of skeletal muscle mass and function.15–16,24 However, a study to comprehensively characterize the heterogeneity of myofilament proteoforms in a large number of muscles representing a range of functional and biochemical properties is lacking.
In this study, we used top-down MS-based proteomics to investigate the myofilament proteoform heterogeneity of seven different rat skeletal muscle tissues: vastus lateralis (VL), gastrocnemius (GAS), vastus medialis (VM), vastus intermelius (VI), rectus femoris (RF), soleus (SOL), and plantaris (PLN). These tissues were selected because they represent a range of constituent fiber types, from those with primarily slow fibers (i.e. SOL), to those with a mixture of fiber types (i.e. VI, VM, PLN), to muscles with primarily fast fibers (i.e. VL, GAS, RF).30 Our results clearly demonstrated that different skeletal muscle tissues exhibit myofilament proteoform heterogeneity. Many of the skeletal muscle tissues contained both fast and slow isoforms of myofilament proteins but the relative abundance of fast and slow isoforms (encoded by different genes) differed across different muscle tissues, evidence of differential isoform expression. Top-down proteomics allowed for rapid detection (by LC-MS) and characterization (by online LC-MS/MS) of the various myofilament proteoforms from rat skeletal muscle tissues. Taken together, we have demonstrated the advantage of top-down proteomics to rapidly assess the myofilament proteoform heterogeneity in various skeletal muscle tissues.
Experimental Procedures
Chemical and Reagents
All reagents were purchased from Millipore Sigma (St Louis, MO, USA) and Fisher Scientific (Fair Lawn, NJ, USA) unless noted otherwise. All solutions were prepared with HPLC grade water (Fisher Scientific, Fair Lawn, NJ, USA).
Skeletal Muscle Tissue Samples
Male Fisher 344 x Brown Norway F1 hybrid rats (F344BN) aged 24-months (n=6) were obtained from the National Institute on Aging colony maintained by Harlan Sprague-Dawley (Indianapolis, IN). The VL, VM, VI, RF, SOL, GAS, and PLN muscles were taken from one leg of each rat and were flash frozen in liquid N2 and stored at −80 °C. Handling and euthanasia were carried out under the guidelines of the University of Wisconsin-Madison Animal Use and Care Committee.
Myofilament Protein Extraction
The extraction of myofilament proteins from skeletal muscle was adapted from our previous studies.15–16,24 Briefly, 5–10 mg of rat skeletal muscle tissue was homogenized in 50 μL of HEPES extraction buffer (25 mM HEPES pH 7.5, 2.5 mM EDTA, 50 mM NaF, 1 mM Na3VO4, 1 mM PMSF in isopropanol) using a Teflon pestle (1.5 mL microcentrifuge tube, flat tip, Thomas Scientific, Swedesboro, NJ, USA). The homogenate was centrifuged for 20 min at 16,000 × g, 4 °C (Sorvall Legend Micro 21R, Thermo Fisher Scientific, Am Kalkberg, Germany) and the supernatant was discarded. The pellet was then resuspended and further homogenized in 10 volumes (μl/mg. tissue) of trifluoroacetic acid (TFA) extraction buffer (1% TFA, 2 mM TCEP). The homogenate was centrifuged for 20 min at 16,000 × g, 4 °C. The resulting supernatant was centrifuged for an additional 20 min at 16,000 × g, 4 °C to completely remove the pellet prior to LC-MS analysis. Bradford protein assay was performed using bovine serum albumin for the linear curve to determine the total protein concentration of the extracts for protein normalization prior to LC-MS.
Detection and Quantification of Proteoforms by LC-MS
LC-MS analysis was carried out using a NanoAcquity ultra-high pressure LC system (Waters, Milford, MA) coupled to a high-resolution Bruker Impact II quadrupole-time of flight (Q-TOF) mass spectrometer (Bruker, Bremen, Germany). Myofilament protein extracts from rat VL, VM, VI, RF, SOL, GAS, and PLN skeletal muscle tissues were diluted using 0.1% formic acid, 2 mM TCEP in water. 5 μL of the diluted protein extracts (500 ng) were loaded on a home-packed PLRP column (PLRP-S, 250 mm long, 0.25 mm i.d., 10 μm particle size, 1000 Å pore size, Agilent). Myofilament proteins were eluted by a linear 50 minute gradient of 5% to 95% mobile phase B (mobile phase A: 0.1% formic acid in water, mobile phase B: 0.1% formic acid in 50:50 acetonitrile: ethanol) at a flow rate of 8 μL/min. The eluted proteins were analyzed by the Bruker Impact II Q-TOF MS via electrospray ionization. End plate offset and capillary voltage were set at 500 and 4,500 V, respectively. The nebulizer was set to 0.5 bar, and the dry gas flow rate was 4.0 L/min at 220 °C. The quadrupole low mass was set to 600 m/z. Mass spectra were taken at a scan rate of 1.0 Hz over 600–2000 m/z range. Three technical replicate runs were collected for each sample to ensure reproducibility and stability of the instrument performance. Relative abundance of myofilament proteoforms were calculated by taking the proteoform abundance based on the deconvoluted mass spectrum over the total abundances for the proteoform family (by summing the abundance of all related proteoforms).
LC-MS/MS Protein Characterization
LC-MS/MS analysis was carried out using a Waters ACQUITY UPLC M-class system (Milford, MA, USA) coupled to a maXis II ETD Q-TOF mass spectrometer (Bruker Daltonics, Bremen, Germany). Myofilament protein extracts from rat SOL and GAS skeletal muscle tissues were diluted using 0.1% formic acid, 2 mM TCEP in water. 5 μL of the diluted protein extracts (500 ng) were loaded on a home-packed PLRP column (PLRP-S, 250 mm long, 0.25 mm i.d., 10 μm particle size, 1000 Å pore size, Agilent). Myofilament proteins were eluted by a linear 50 minute gradient of 5% to 95% mobile phase B (mobile phase A: 0.1% formic acid in water, mobile phase B: 0.1% formic acid in 50:50 acetonitrile: ethanol) at a flow rate of 8 μL/min. End plate offset and capillary voltage were set at 500 and 4,500 V, respectively.
Data-dependent LC-MS/MS was performed on the rat SOL and GAS skeletal muscle myofilament protein extracts. The three most intense ions in each mass spectrum were selected and fragmented by collision-activated dissociation (CAD) with a scan rate of 2 Hz in 500–3000 m/z. The isolation window for online auto MS/MS CAD was 5–8 m/z. The collision DC bias was set from 18 to 45 eV for CAD with nitrogen as collision gas.
Data Analysis
All LC-MS data were collected with OtofControl 3.4 (Bruker Daltonics) and processed and analyzed using DataAnalysis 4.3 software (Bruker Daltonics). All chromatograms shown were smoothened by the Gauss algorithm with a smoothing width of 2.04 s. Mass spectra of specific elution windows related to myofilament proteins of interest were deconvoluted using the Maximum Entropy algorithm incorporated in the DataAnalysis 4.3 software. The resolving power for Maximum Entropy deconvolution was set to 50,000 for proteins that were isotopically resolved. Sophisticated numerical annotation procedure (SNAP) algorithm was applied to determine the monoisotopic masses of all detected ions.
LC-MS/MS data was processed using in-house developed MASH Suite Pro.31 A signal-to-noise (S/N) threshold of 3 and a minimum fit of 60% were used for program processing. The fragment ions in the tandem mass spectra were assigned based on the protein sequence of myofilament protein isoforms in UniProt protein database (Unit-ProtKB). N-terminal methionine cleavage, N-terminal trimethylation, N-terminal acetylation, S-glutathionylation, and phosphorylation were considered when determining b- and y- ion assignments. Monoisotopic masses were used for all proteoform determinations and all fragment ions were manually validated with a mass tolerance of 10 ppm.
Results and Discussion
Analysis of myofilament proteins in different rat skeletal muscles by SDS-PAGE and online LC-MS
SDS-PAGE was first used to visualize the protein components in the TFA extracts prepared from seven different skeletal muscle tissues (Figure S1). The results showed the TFA extracts from different skeletal muscle tissues contained different composition of myofilament proteins. In particular, the SOL tissue showed markedly different protein bands compared to the other tissues, specifically seen by the proteins below 40 kDa (Figure S1). SOL tissue is composed almost exclusively of slow-twitch muscle fibers, whereas GAS tissue is primarily composed of fast-twitch muscle fibers.30,32 VL and RF, which are also fast-twitch tissues, showed high similarities with the GAS tissue.33–34 The remaining tissues of VI, VM, and PLN are a mixture of fast- and slow-twitch muscle fibers, therefore they contained features from both the fast- and slow-twitch muscle tissues.30 Biological and technical replicates were performed in triplicate to ensure the reproducibility of our extraction method (Figure S2). Although SDS-PAGE can be a useful visual tool to reveal protein components and roughly reveal differences in the expression of certain myofilament proteins in skeletal muscle tissues, it is a low-resolution method that cannot identify proteoforms with sequence variations and PTMs as well as its inability to detect low-abundance proteins.
Therefore, we next sought to assess the heterogeneity of myofilament proteoforms in different skeletal muscle tissues utilizing an online top-down MS-based proteomics method (Figure 1). Our workflow used in this study started by obtaining VL, VM, VI, RF, SOL, GAS, and PLN skeletal muscle tissues from rat hind leg then performing a two-step extraction to enrich the myofilament proteins from the different skeletal muscle tissues. These myofilament protein extracts were then analyzed by either online LC-MS or online LC-MS/MS for robust protein profiling and characterization to determine the proteoform heterogeneity found in the different skeletal muscle tissues. Importantly, the entire procedure including tissue homogenization, myofilament protein extraction, and LC-MS/MS analysis can be done in less than three hours, which provides a rapid, robust, and high-throughput method to decipher proteoform heterogeneity found in skeletal muscle tissues.
Figure 1. Schematic of a top-down LC-MS/MS method to decipher rat skeletal muscle heterogeneity.
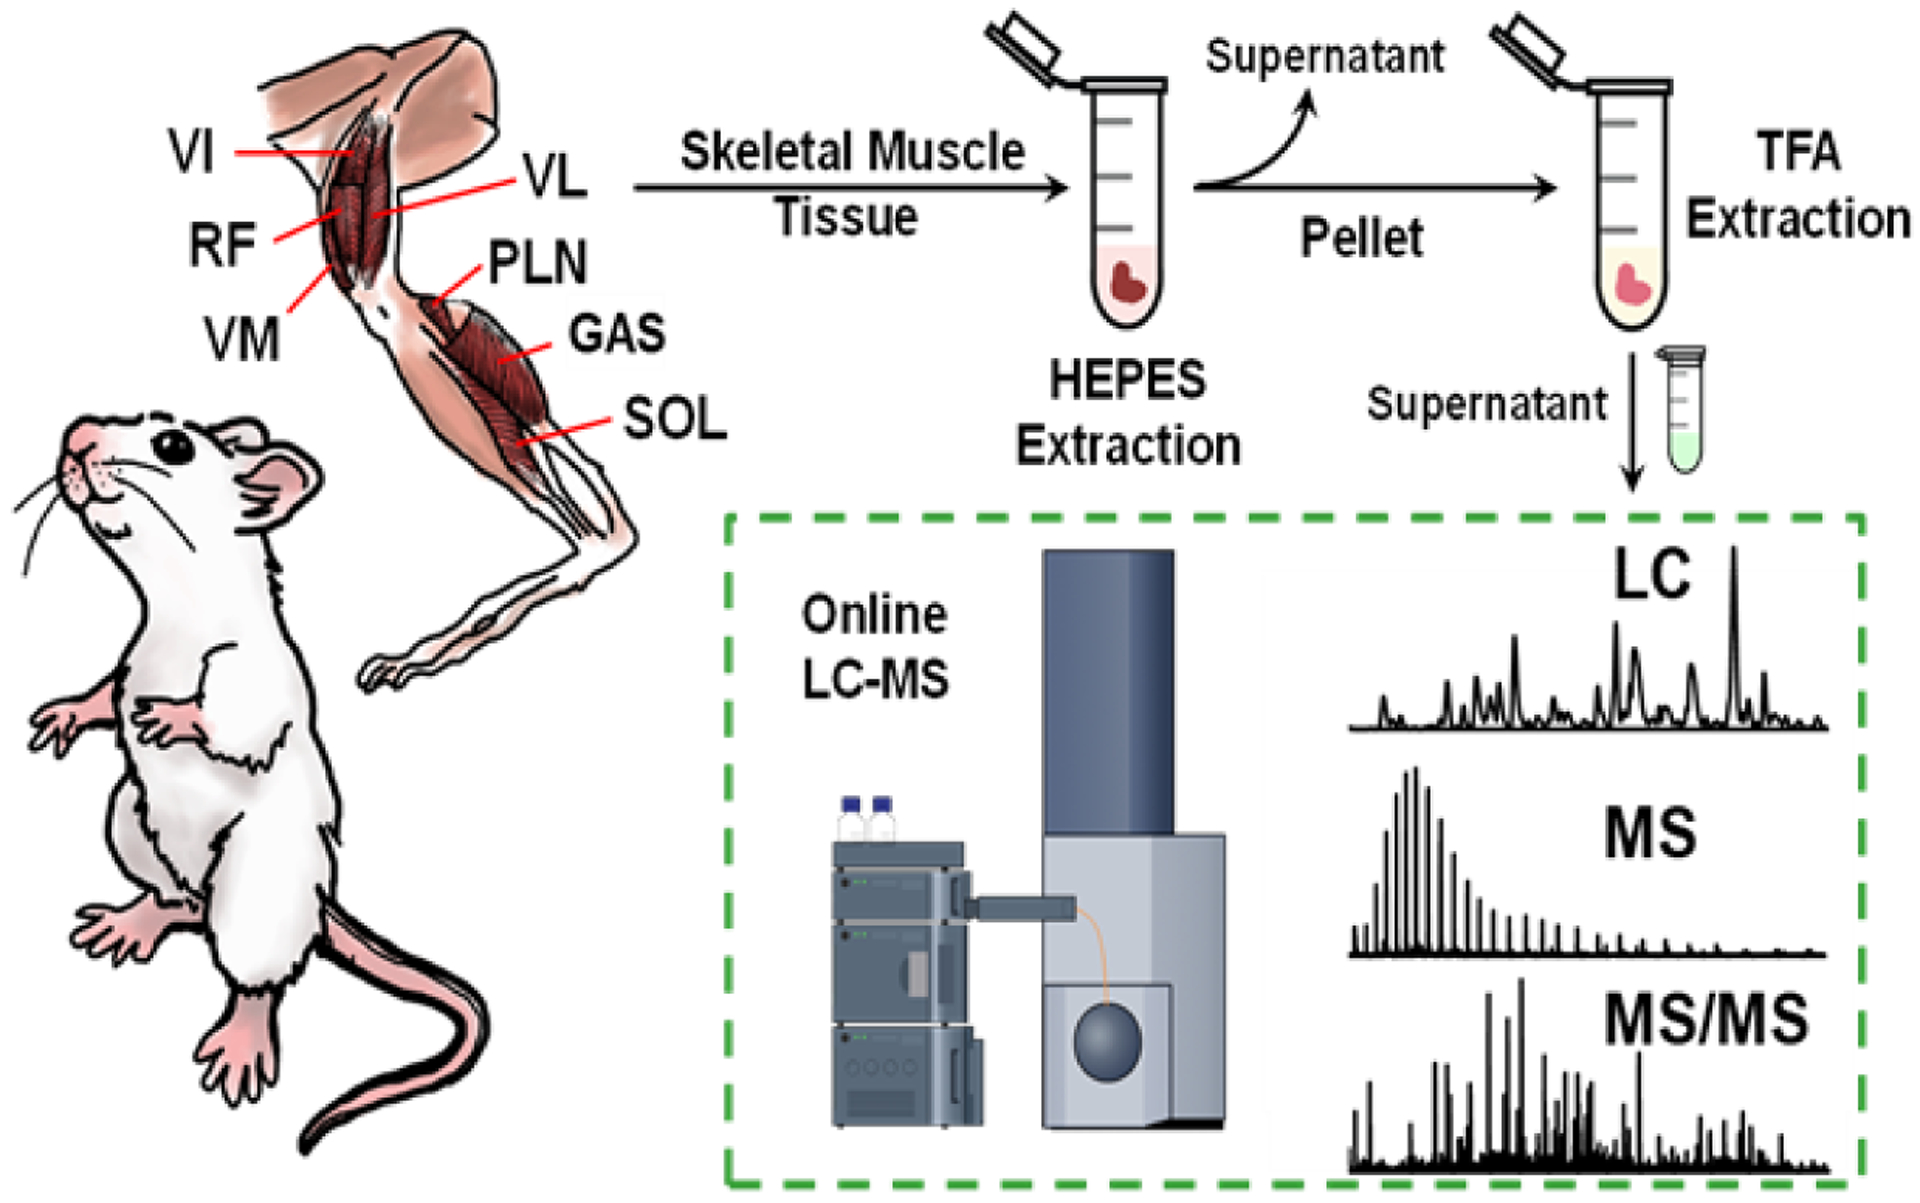
VL: vastus lateralis; VM: vastus medialis; VI: vastus intermedius; RF: rectus femoris; SOL: soleus; GAS: gastrocnemius; PLN: plantaris.
The myofilament protein extracts from VL, VM, VI, RF, SOL, GAS, and PLN skeletal muscle tissues were analyzed with online LC-MS profiling with key myofilament proteins identified by intact accurate mass measurement (Figure 2). Our LC-MS method was able to detect several major myofilament proteins from the seven skeletal muscle tissues including: fast skeletal troponin T (fsTnT), slow skeletal troponin T (ssTnT), fast skeletal troponin I (fsTnI), slow skeletal troponin I (ssTnI), alpha-tropomyosin (α-Tpm), beta-tropomyosin (β-Tpm), the ventricular isoform of myosin light chain 1 (MLC-1V), the fast isoforms of myosin light chain 1, 2, and 3 (MLC-1F, MLC-2F, MLC-3F), the slow isoforms of myosin light chain 1 and 2 (MLC-1S, MLC-2S), alpha skeletal actin (α-sActin), fast skeletal troponin C (fsTnC), and slow skeletal troponin C (ssTnC). These important myofilament proteins were all identified based on their intact protein mass with a mass error tolerance within 5 ppm and identifications can be asserted based on previous studies on the comprehensive characterization of skeletal muscle myofilament proteins.15,24–26 Biological triplicates were performed using VI tissue to ensure that the LC-MS method used was reproducible (Figure S3). Notably, our LC-MS method was able to effectively separate and distinguish key myofilament protein isoforms, such as α-Tpm and β-Tpm, even though they have high sequence homology (Figure 2). Tpms are a family of actin-binding proteins forming a head-to-tail polymer along the major groove of actin filaments, playing critical roles in a variety of biological processes including skeletal muscle contraction and relaxation.35 The Tpm family has multiple isoforms arising from different genes. α-Tpm and β-Tpm are encoded by the Tpm1 and Tpm2 genes, respectively, but have very high sequence homology with 86% of the amino acid sequence identical.35–38
Figure 2. LC-MS profiling of myofilament proteins detected in different types of rat muscle.
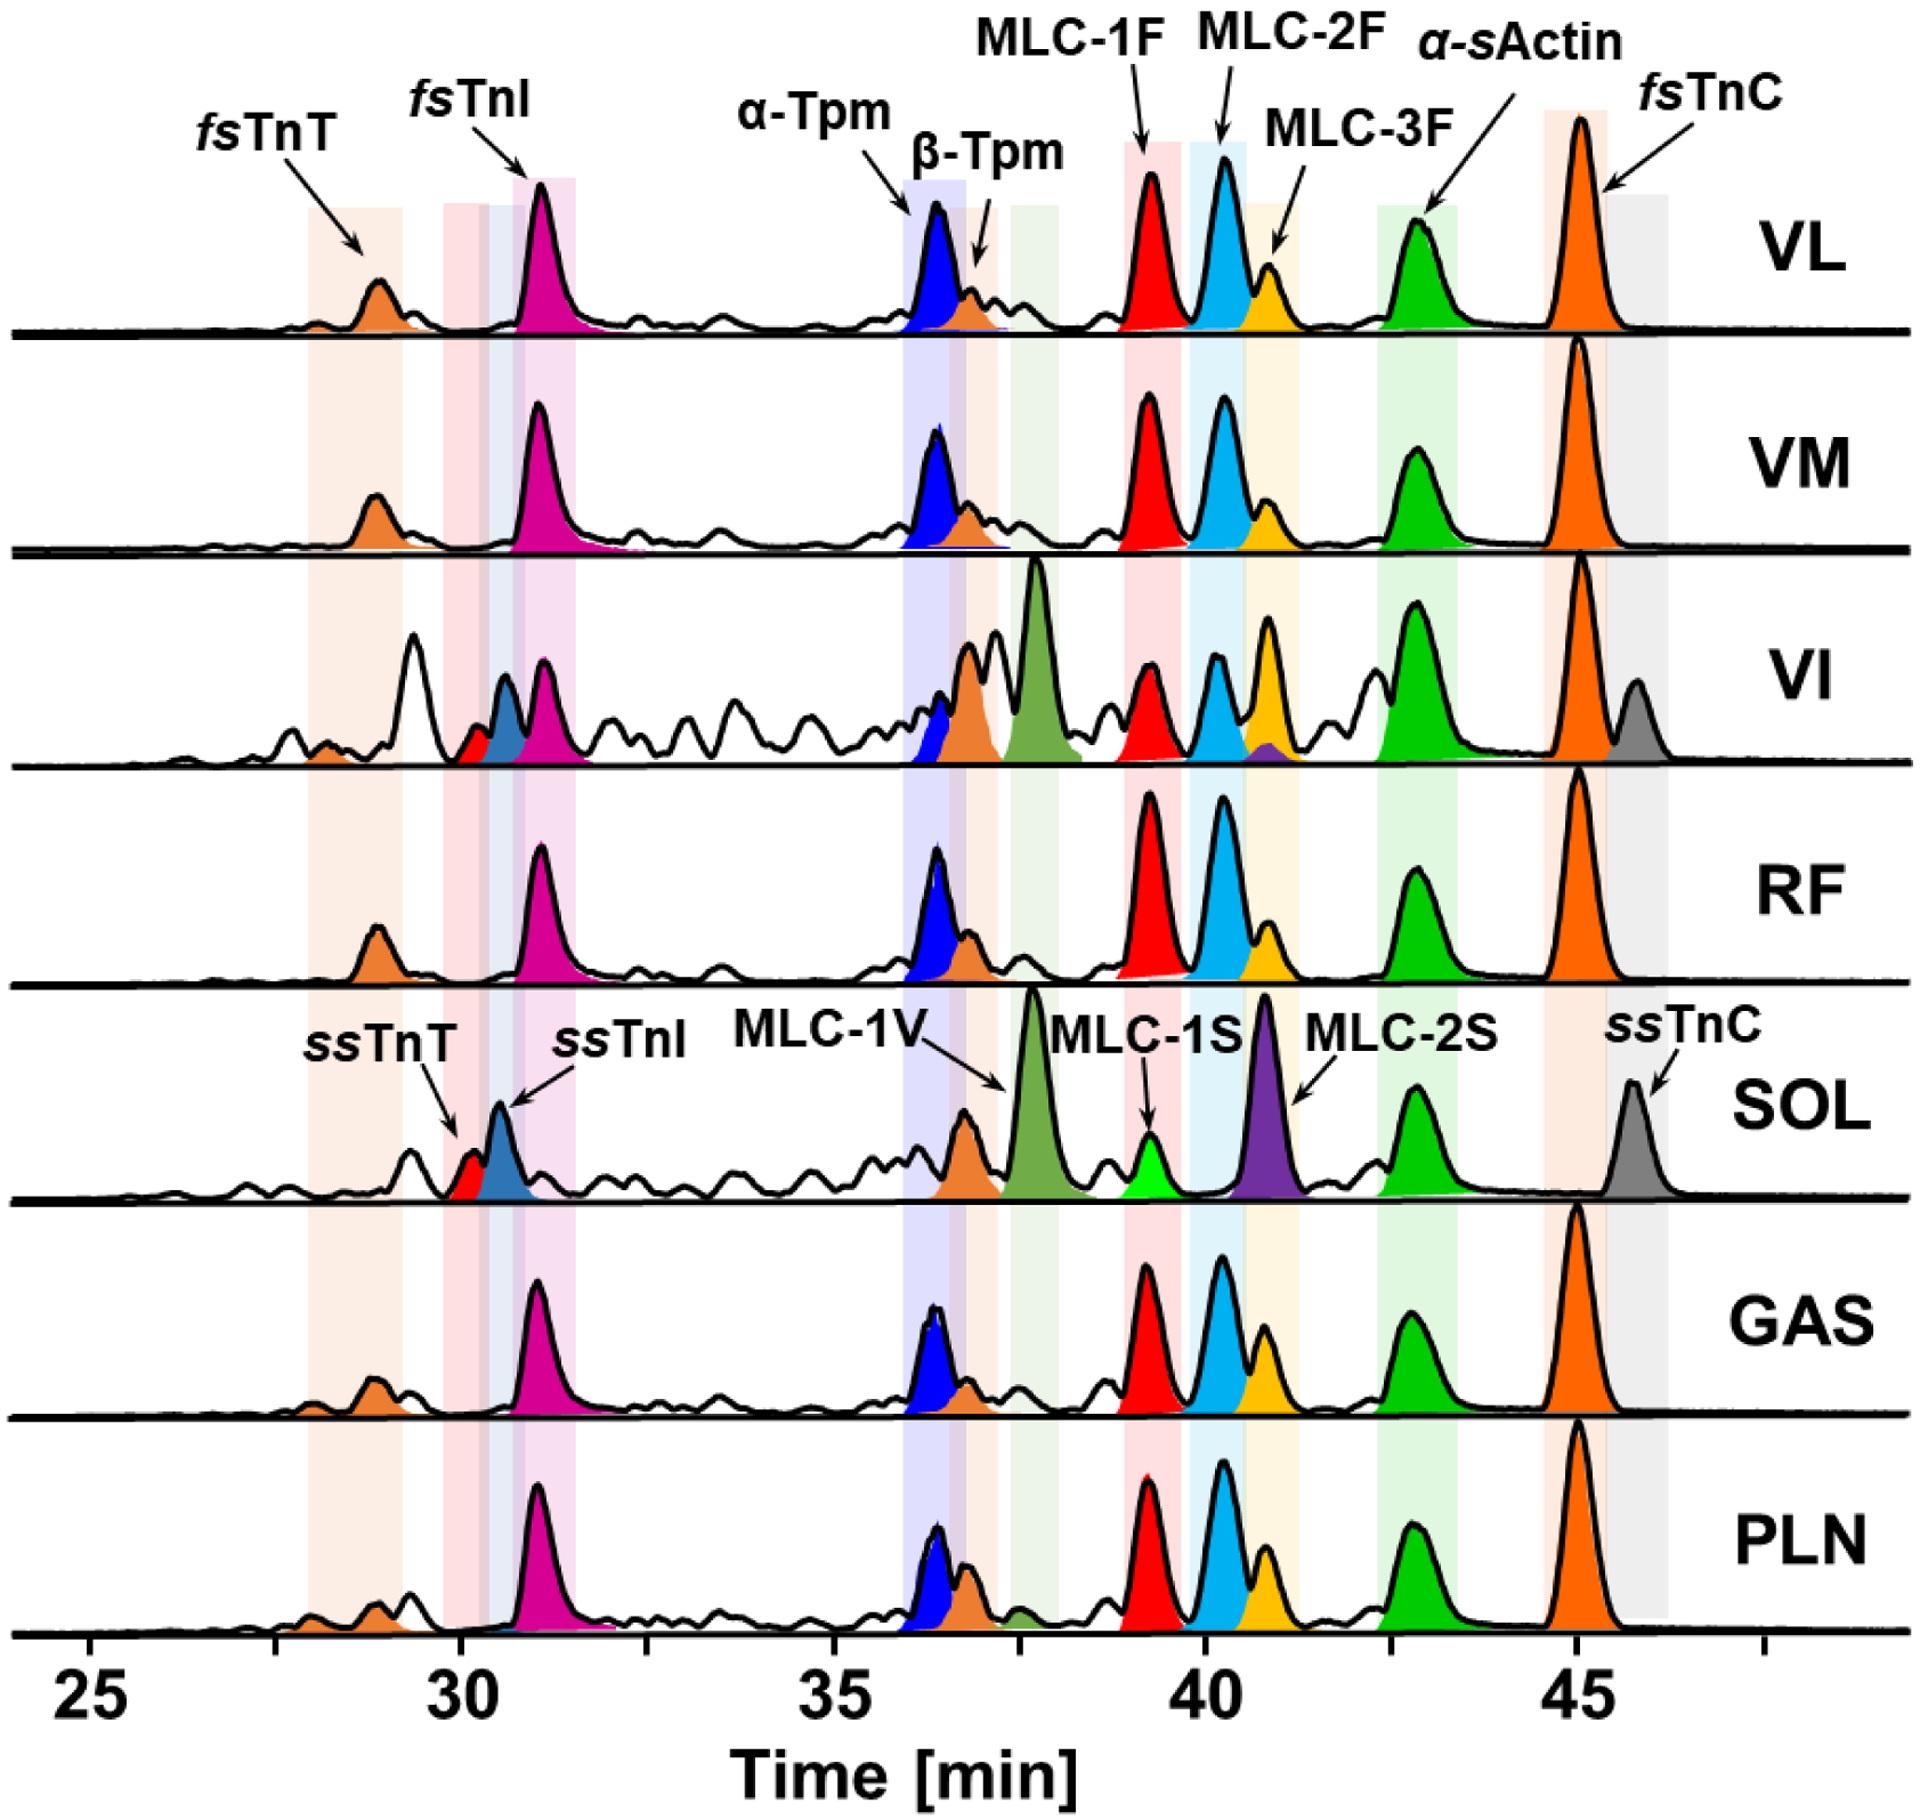
LC-MS of labeled myofilament protein base peak chromatograms (BPCs) of seven different rat skeletal muscles, VL, VM, VI, RF, SOL, GAS, PLN.
The main isoforms in the predominantly fast-twitch fiber VL, RF, and GAS are fsTnI, fsTnC, α-Tpm, MLC-1F, MLC-2F, and MLC-3F, whereas SOL which consists mainly of slow-twitch muscle fibers has predominantly the slow-twitch isoforms (ssTnI, ssTnC, β-Tpm, MLC-1S, MLC-2S, MLC-1V) (Figure 2). Both fast- and slow-twitch isoforms are clearly present in VI. The base peak chromatogram (BPC) for α-sActin remains constant in the highly reproducible chromatograms among different skeletal muscle tissues (Figure S4) and the deconvoluted mass spectra shows α-sActin has only one proteoform and remains unchanged across different muscle tissues (Figure S4). Thus, our results display the wide variety of myofilament proteoforms in the various rat skeletal muscle tissues, which demonstrates the heterogeneity across seven rat skeletal muscle tissues (Figure 2).
Top-down high-resolution MS demonstrates myofilament proteoform heterogeneity across seven rat skeletal muscle tissues
To exemplify the heterogeneity of myofilament proteoforms across seven skeletal muscle tissues, deconvoluted mass spectra and relative abundances of proteoforms were analyzed for fast and slow skeletal TnI and TnC (Figure 3). The deconvoluted mass spectrum for TnI shows proteoform differences across the various skeletal muscle tissues (Figure 3a). The monoisotopic masses for fsTnI (Tnni2 gene) and ssTnI (Tnni1 gene) were calculated based on their sequences from the UniProt database (Accession Numbers: fsTnI – P27768, ssTnI – A0A096MIZ5). The experimentally observed mass for fsTnI was 21225.87 Da, which closely matched the calculated mass of 21225.84 Da from the UniProt database upon N-terminal methionine cleavage and addition of acetylation to the first amino acid. The experimentally observed mass for ssTnI was 21553.53 Da, which matched the calculated mass of 21553.49 Da from the UniProt database upon N-terminal methionine cleavage. Every muscle tissue except for SOL contained fsTnI; VI and SOL muscles contained ssTnI, which is conceivable since SOL is composed almost exclusively of slow-twitch muscle fibers. VI, VM, and PLN are a mixture of fast- and slow-twitch muscle fibers, whereas GAS, VL, and RF are primarily composed of fast-twitch muscle fibers (Figure 3b).30,32–34 In addition, there were PTMs that were observed by intact mass measurement from the deconvoluted mass spectra within a 5 ppm mass error tolerance. The fsTnI for VL, VM, VI, RF, and GAS had S-glutathionylation modifications, which matched closely to the calculated masses from UniProt with a mass shift of 305.07 Da. Previous studies have found that S-glutathionylation of fsTnI results in increased Ca2+ sensitivity in fast-twitch muscle fibers as well as protects the sarcomere from oxidative stress.39–40 SOL muscle tissue had a phosphorylated ssTnI peak that was 79.97 Da from the unphosphorylated peak. The relative abundances of the fsTnI and ssTnI proteoforms show extensive heterogeneity across the different skeletal muscle tissues (Figure 3b).
Figure 3. Heterogeneity of skeletal TnI and TnC in rat skeletal muscles.
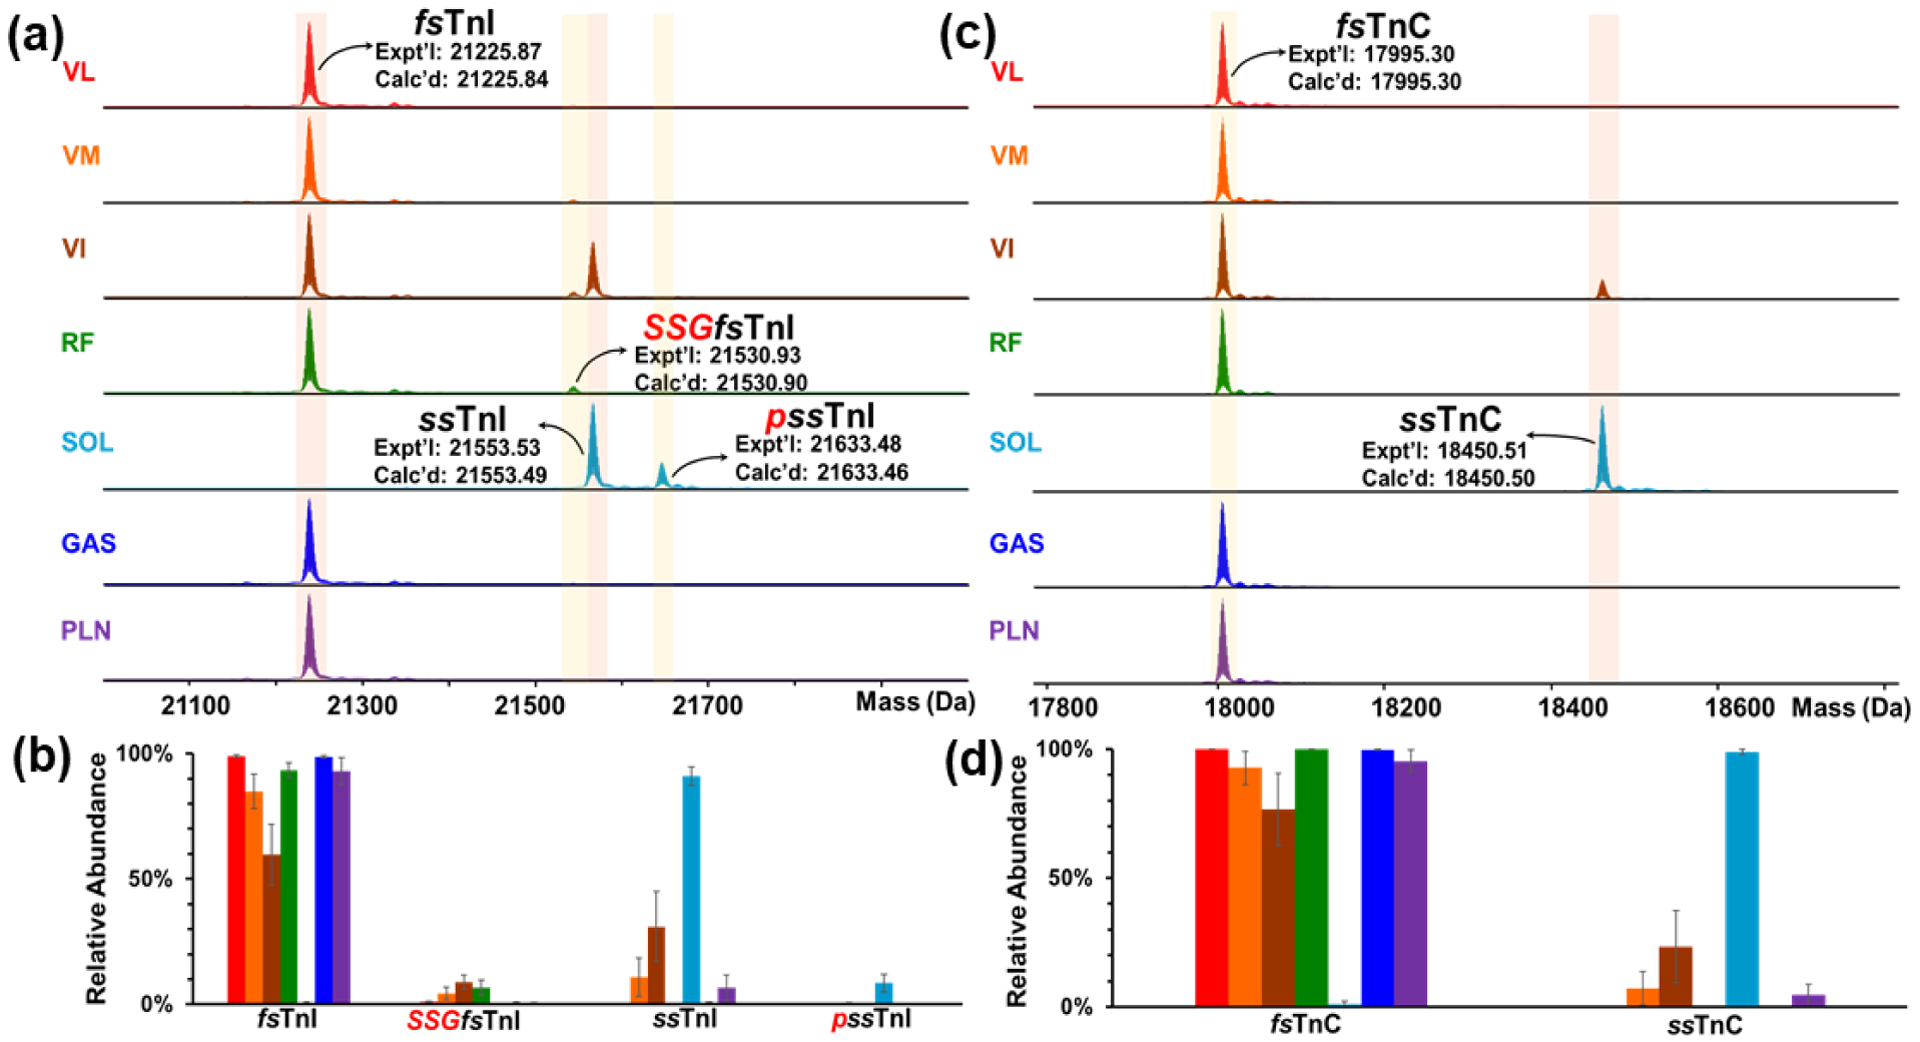
(a) Deconvoluted mass spectra of various muscle types of skeletal TnI. (b) Relative abundances of fsTnI and ssTnI proteoforms in different muscles. (c) Deconvoluted mass spectra of skeletal TnC. (b) Relative abundances of fsTnC and ssTnC proteoforms in different muscles. n = 6 biological replicates for each muscle tissue. All abundance values represent mean ± SEM. p, phosphorylation; red italic SSG, S-glutathionylation.
The deconvoluted mass spectra for skeletal TnC from the different skeletal muscle tissues show distinct proteoforms from both fast- and slow- twitch muscle tissues (Figure 3c). The calculated values for ssTnC (Gene: Tnnc1) from the UniProt database (Accession number: Q4PP99) was 18450.51 Da, which matched closely with the experimental value of 18450.50 Da upon addition of acetylation to the first amino acid in the sequence. The calculated mass for fsTnC (Gene: Tnnc2) from the UniProt database (Accession number: Q304F3) was 17995.30 Da, which matched identically with the experimental mass upon removal of the N-terminal methionine and addition of acetylation to the first amino acid in the sequence. Every skeletal muscle type contained the fast skeletal isoform of TnC besides SOL, whereas only VM, VI, SOL and PLN contained the slow skeletal isoform of TnC (Figure 3d). The various skeletal muscle tissues contained skeletal TnC proteoforms that were related to the type of tissue (fast, slow, or mix) in which they were detected.
The deconvoluted mass spectra for MLC-2 also show several proteoform differences (Figure 4a). MLC-2 is expressed in both its fast (MLC-2F) and slow (MLC-2S) isoforms (MLC-2F gene – Mylpf, MLC-2S gene – Myl2) amongst the various tissues of skeletal muscle. High-resolution top-down MS analysis of the myofilament protein extracts showed the MLC-2F and MLC-2S isoforms with molecular masses of 18868.39 and 18779.40 Da respectively. These molecular masses match closely to that found in the UniProt database of 18868.36 and 18779.36 Da, respectively, once N-terminal trimethylation was added to the monoisotopic mass (Accession Numbers: MLC-2F - P04466, MLC-2S - P08733). VL, RF, GAS, PLN, and VM muscle tissues are shown to almost completely express the MLC-2F isoform. The SOL muscle tissue is shown to express the MLC-2S isoform, whereas VI is shown to express both the MLC-2F and MLC-2S isoforms. In previous studies, our group has found that MLC-1F, MLC-2F, and MLC-3F are in fast-twitch muscle fibers, whereas MLC-1S, MLC-1V and MLC-2S are found in slow-twitch muscle fibers.16 The results of our heterogeneity study across seven skeletal muscle tissues are in accordance with this previous finding. MLC isoforms have been shown to be muscle-dependent and related to contractile properties.41 The relative abundance of the different proteoforms illustrate the differences of myofilament proteoforms in various rat skeletal muscle tissues (Figure 4b). The deconvoluted mass spectra show that the MLC-2 isoforms are also singly and doubly phosphorylated with mass shifts of 79.96 Da and 159.92 Da, respectively. Interestingly, for skeletal muscle tissues in which the fast isoform, MLC-2F, the most abundant proteoform was singly phosphorylated. As mentioned before, top-down MS has shown that there is a decrease in MLC-2F phosphorylation found in GAS tissue as a result of sarcopenia, therefore this method is viable to study this relationship across different skeletal muscle tissues to further understand the effects of aging on multiple skeletal muscle tissues.15
Figure 4. Heterogeneity of MLC-2 and Tpm in rat skeletal muscles.
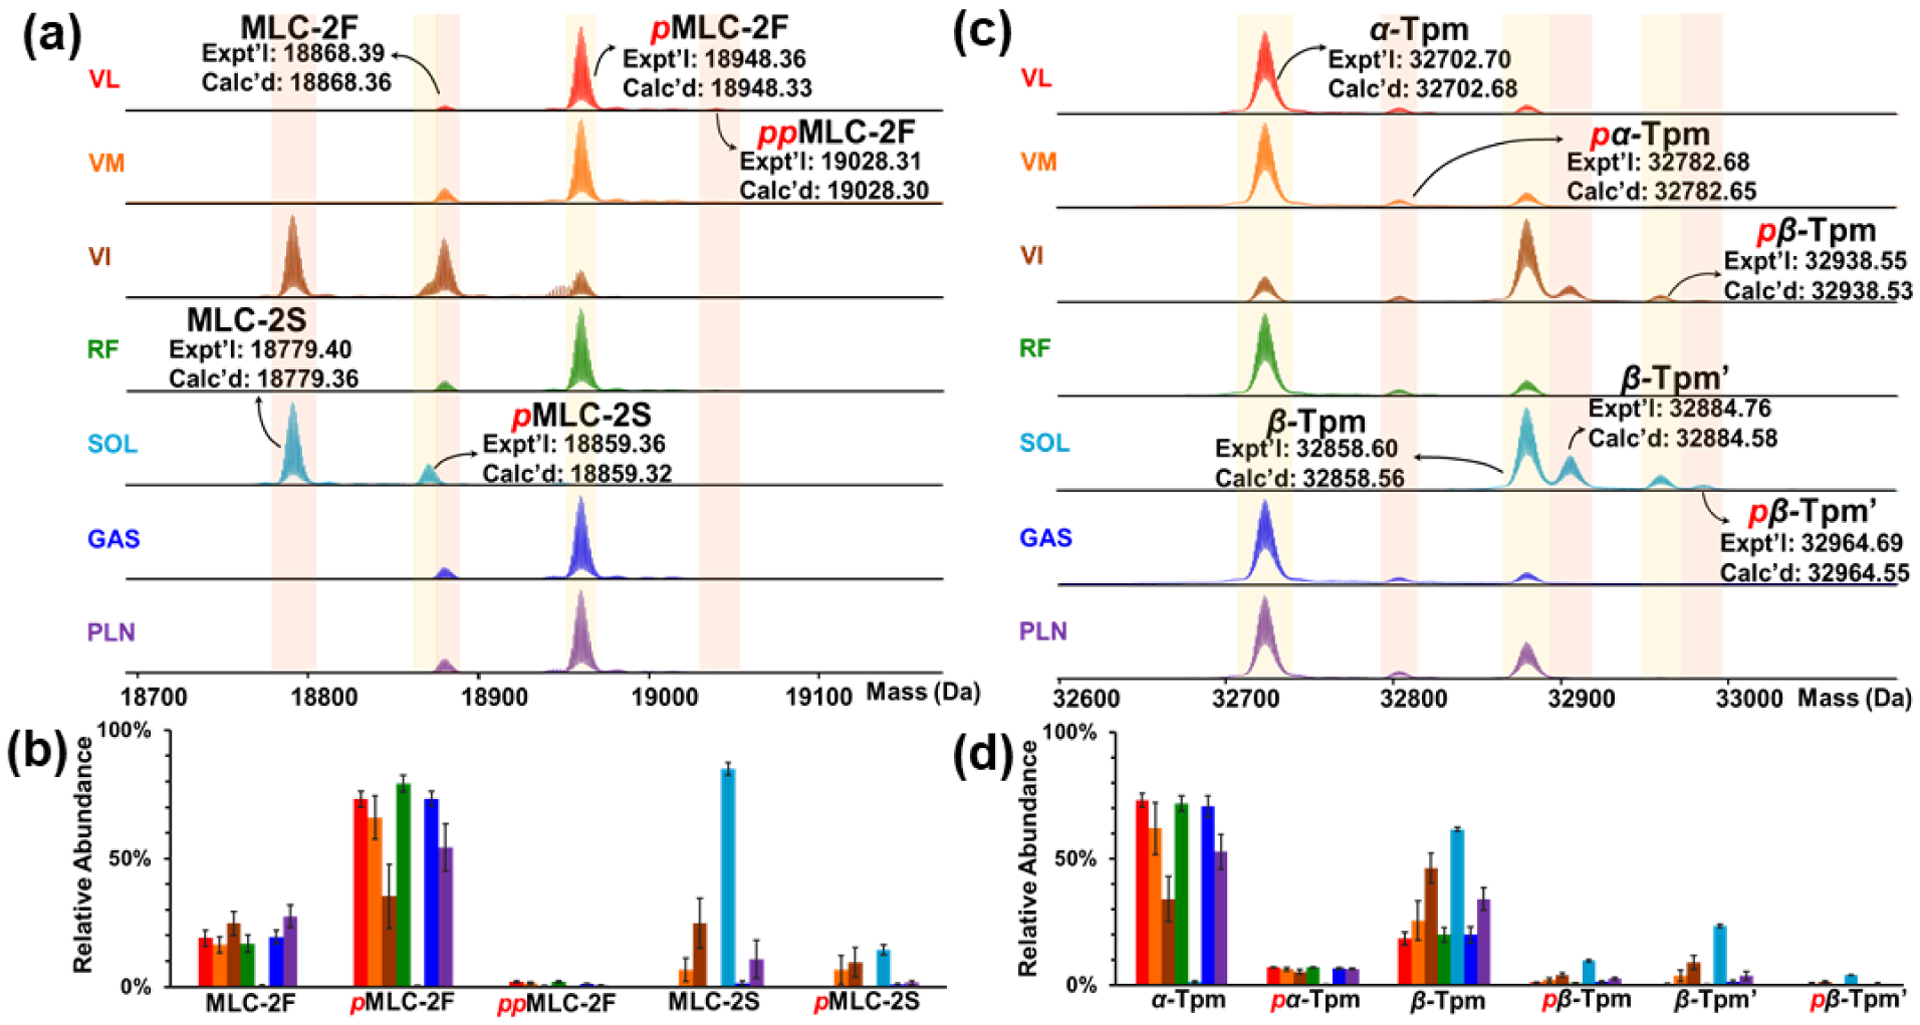
(a) Deconvoluted mass spectra of various muscle types of MLC-2 proteoforms. (b) Relative abundances of MLC-2 proteoforms in different muscles. (c) Deconvoluted mass spectra of various muscle types of Tpm proteoforms. (d) Relative abundances of α-Tpm and β-Tpm proteoforms in different muscles. n = 6 biological replicates for each muscle tissue. All abundance values represent mean ± SEM. p, phosphorylation.
The deconvoluted mass spectra for skeletal Tpm shows many proteoforms (Figure 4c). α-Tpm (Gene – Tpm1; Accession Number: P04692) is known to be the major isoform in fast-twitch fibers, while the abundance of β-Tpm (Gene – Tpm2; Accession Number: P58775) increases in slow-twitch fibers compared to the other skeletal muscle tissues.42 Interestingly, all of the skeletal muscle tissues contained some level of both α-Tpm and β-Tpm (Figure 4c). α-Tpm is the predominatly expressed isoform in VL, VM, RF, PLN and GAS tissues and the β-Tpm isoform is more highly expressed in SOL and VI tissues (Figure 4d). There was another β-Tpm proteoform, which originates from alternative splicing of the Tpm2 gene, found in SOL and VI tissues that was identified by intact mass from the NCBI database (Accession Number: XP_575811) and denoted β-Tpm’.43 High-resolution MS analysis of the myofilament protein extracts showed the α-Tpm, β-Tpm, and β-Tpm’ isoforms with molecular masses of 32702.70, 32858.60 and 32883.76 Da, respectively. These molecular weights match closely to that found in the UniProt database for α-Tpm, β-Tpm, and β-Tpm’ of 32702.68, 32858.58, and 32884.58 Da, respectively. Many of these isoforms were found to have low levels of single phosphorylation with mass shifts of 79.96 Da, highlighting the benefits of top-down MS as these low levels of PTMs would be challenging to observe in bottom-up MS. Our results, as well as previous studies, indicate that the ratio of α-Tpm:β-Tpm is muscle dependent.44 The ratio of α-Tpm/β-Tpm was calculated by dividing the sum of relative abundances based on the deconvoluted mass spectrum for all α-Tpm proteoforms by the sum of the relative abundances for all β-Tpm proteoforms. For the β-Tpm abundances, this includes both β and β’ because they arise from the same gene (Tpm2), and therefore belong to the same proteoform family. The ratio of α-Tpm proteoforms to β-Tpm proteoforms varied across the different skeletal muscle tissues; VL had a ratio of 4.1 ± 0.9, RF had a ratio of 3.7 ± 0.7, GAS had a ratio of 3.4 ± 0.9, VM had a ratio of 2.2 ± 1.4, PLN had a ratio of 1.5 ± 0.6, VI had a ratio of 0.7 ± 0.3, and SOL had a ratio of 0.02 ± 0.01 (Figure S5). This is consistent with the fact that VL, RF and GAS contain predominantly fast-twitch muscle fibers, VM, PLN, and VI are a mixture of fast- and slow-twitch fibers, whereas SOL contains mainly slow-twitch fibers.30 Differences in the composition of Tpm isoforms between different skeletal muscle tissues may contribute to variable contractile functions, as has been linked to altered contractility in muscle.43
Our results display extensive heterogeneity of myofilament proteoforms across seven different skeletal muscle tissues (Figure 3 and 4). The heterogeneity of different myofilament proteins in skeletal muscle tissues is summarized by showing all of the proteoforms present (Table S1) as well as the relative percentage of proteoforms (Table S2). There is distinct heterogeneity amongst the different skeletal muscle tissues and these differences can be further correlated with functional data to associate myofilament proteoforms to the function of the muscle tissue.
Troponin T proteoforms show high level of heterogeneity throughout different skeletal muscle tissues
Perhaps the best example of myofilament proteoform heterogeneity is illustrated by the vast number of fast skeletal TnT isoforms, as shown in a mouse model that fast skeletal TnT has 13 alternatively spliced isoforms and these various isoforms have different effects on sarcomere contractility.45–46 Our results confirmed this diversity, in that the most diverse of the myofilament proteins across the seven rat skeletal muscle tissues, in terms of isoforms (coded by different genes) and PTMs was TnT (Figure 5). In total, there were six fast skeletal isoforms (fsTnT1, fsTnT3, fsTnT4, fsTnT8, fsTnT9, fsTnT10) and one slow skeletal isoform (ssTnT1) observed in the seven different muscle tissues. The various slow and fast isoforms of skeletal TnT were identified by intact mass measurement within a 10 ppm error of the calculated values in UniProt/NCBI databases upon N-terminal cleavage of methionine and acetylation of the first amino acid (Figure 5a). In addition, the various forms of skeletal TnT exhibited significant phosphorylation as was identified by a 79.97 Da mass shift. Our results also showed lysine truncation of ssTnT1 found in SOL tissue.
Figure 5. Heterogeneity of skeletal TnT in rat skeletal muscle.
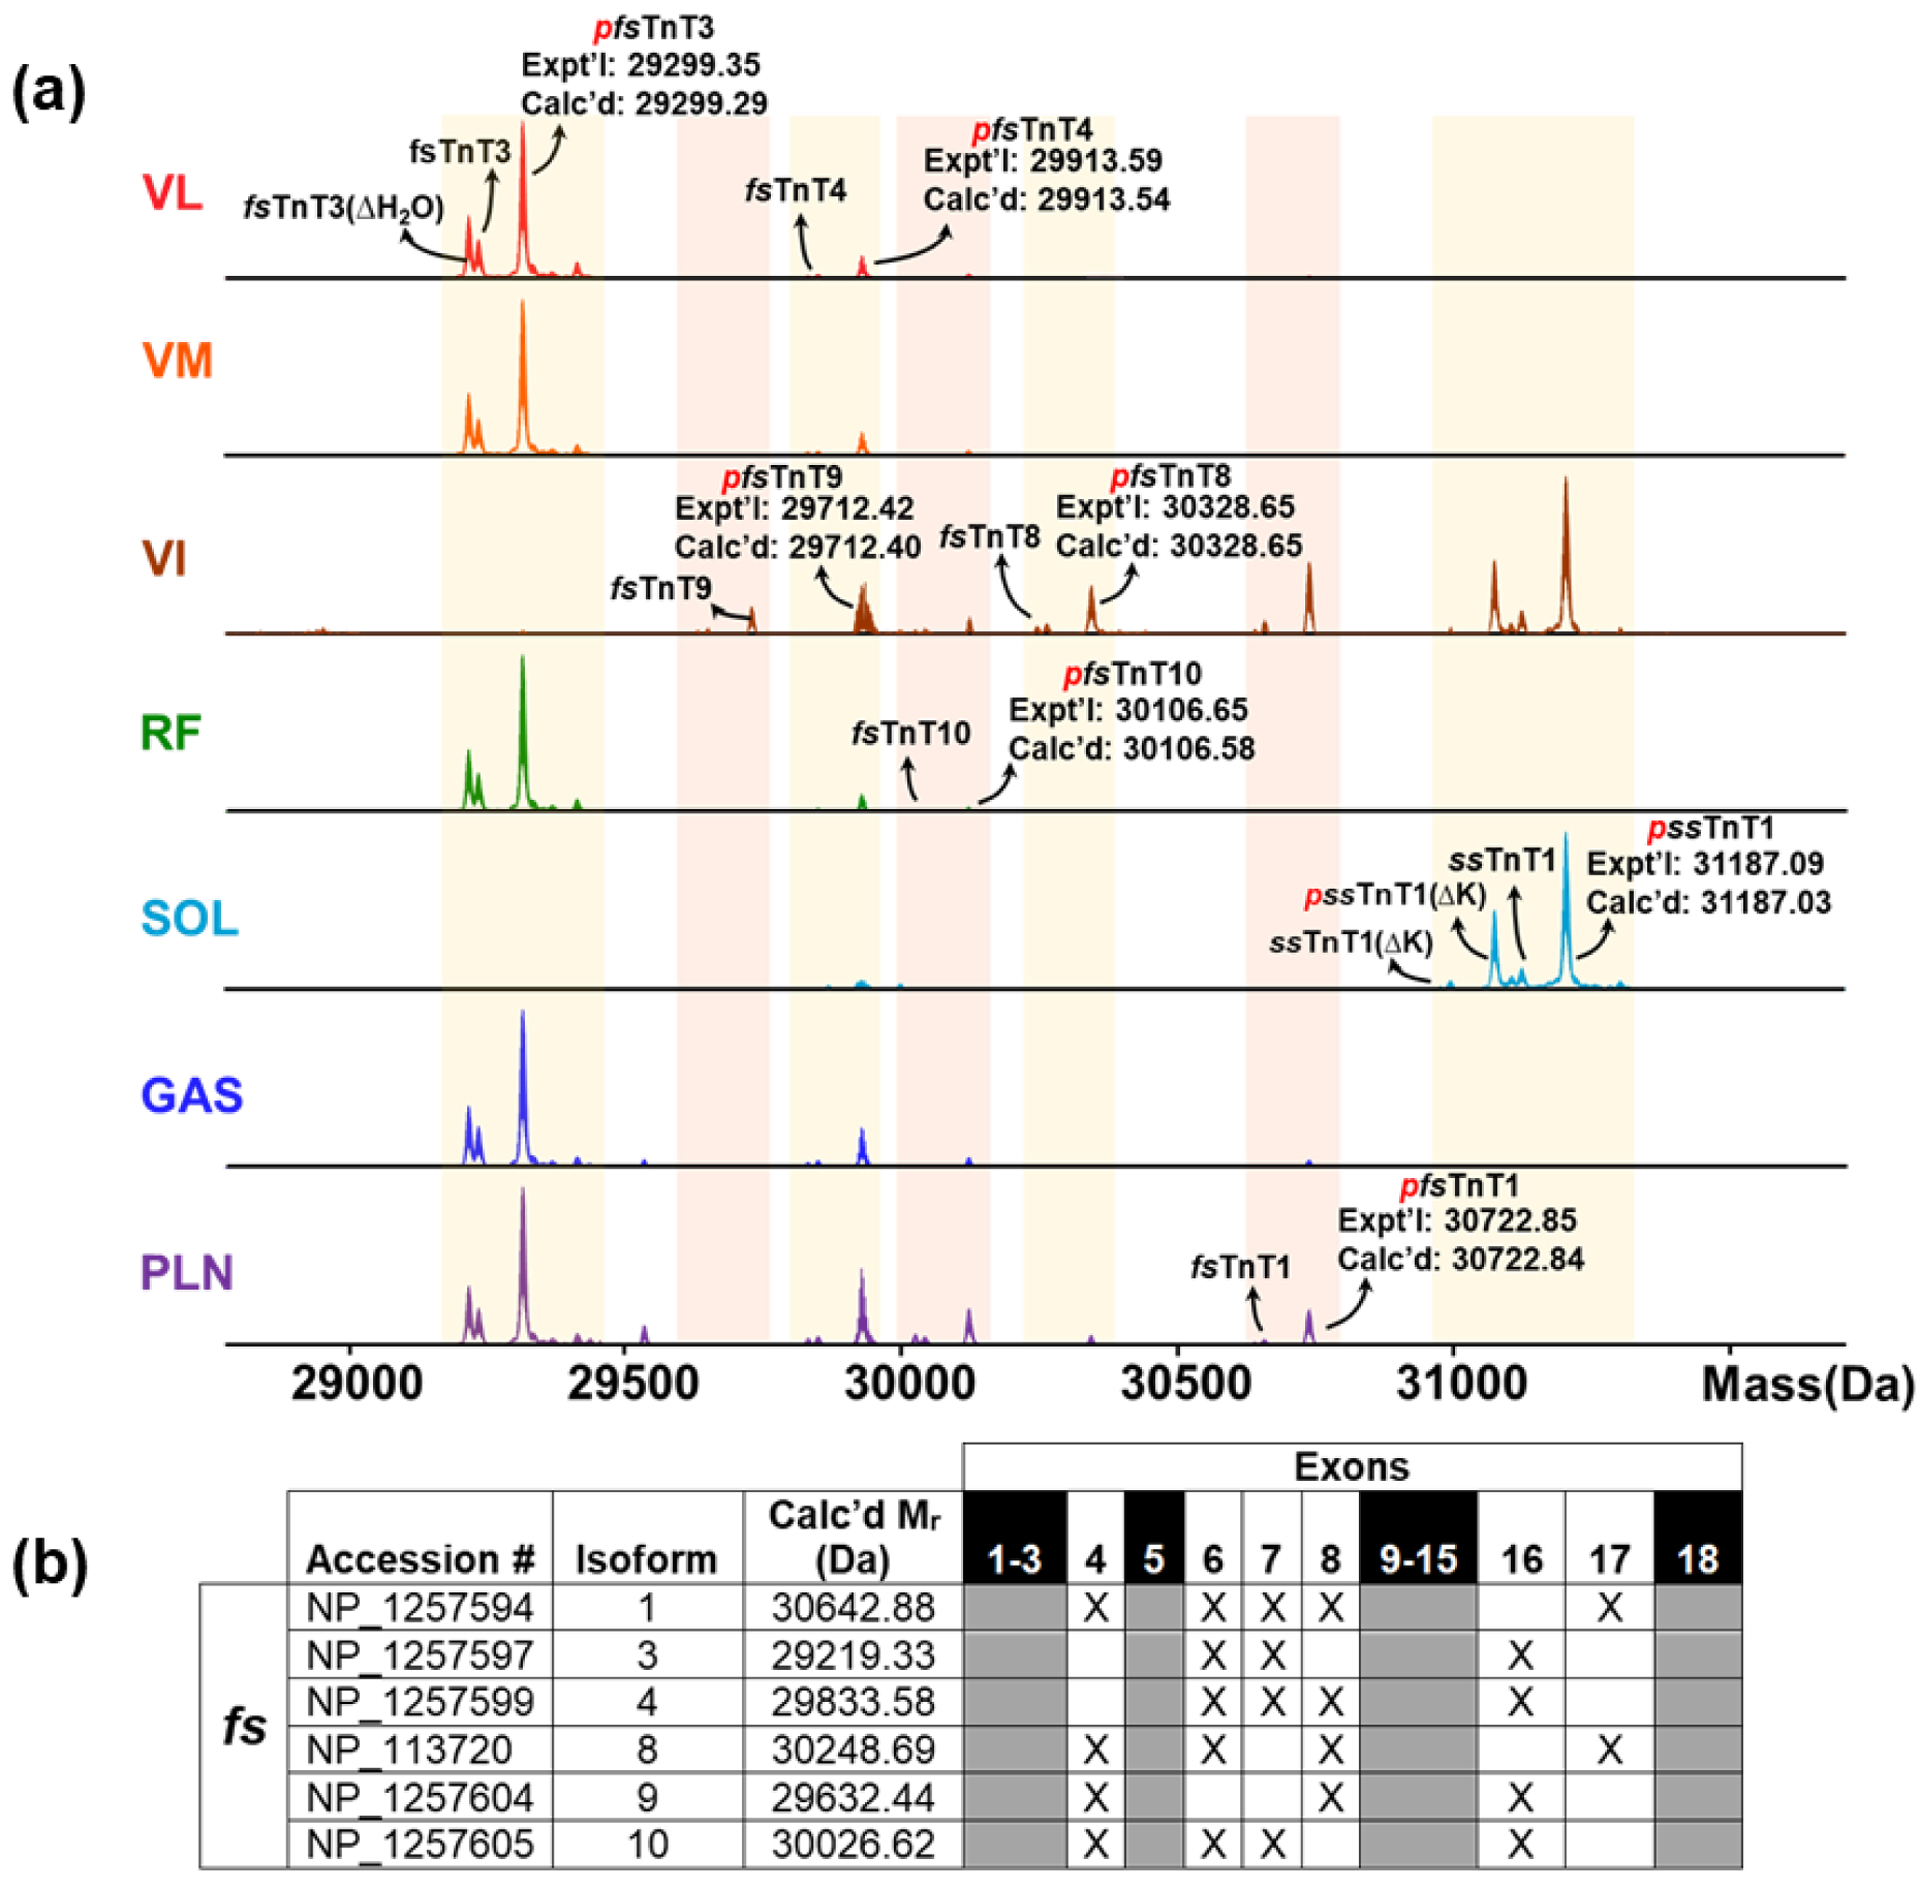
(a) Deconvoluted mass spectra of different muscle types in TnT shows several PTMs and isoforms. p, phosphorylation; ΔH2O, loss of water moiety; ΔK, loss of lysine residue. (b) Changes in TnT isoforms in fast skeletal muscle. Table displaying accession numbers, calculated relative molecular masses, and exon structure for rat fsTnT isoforms in the NCBI database. “X” indicates presence of exon. Grey boxes are conserved in all isoforms in the database.
Similar to the other myofilament proteins that have been discussed (vide supra), the TnT skeletal isoforms appear to contain isoforms consistent with the muscle fibers found in the skeletal muscle tissue. For example, SOL muscle contained mostly ssTnT1 proteoforms and the other muscles contained various fast isoforms. Interestingly, VI contained six out of seven of the TnT isoforms, including both slow and fast isoforms, which suggests that it is a skeletal muscle tissue contains a mixture of fibers and a high level of diversity. The fast isoforms of skeletal TnT share several exons and only differ by the expression of specific exons (Figure 5b). Due to the high sequence similarities of the various skeletal TnT isoforms, bottom-up proteomics would have difficulty in distinguishing these isoforms from each other (Figure S6). Previous studies47 and the sequences found from the UniProt databases show that the various fast isoform have a variable N-terminus and a highly conserved C-terminus and central portion (Figure S6). TnT bridges the thin filament proteins TnC, TnI, and Tpm together and therefore has an important role in activation of the thin filament contraction.48 The C-terminus and central portion of TnT is the portion of TnT that binds to the other thin filament proteins.47 The variable N-terminus of TnT has important conformational and functional roles that defines the many different isoforms of fsTnT.49 Top-down proteomics is able to clearly disseminate all of the isoforms of fsTnT which is a major advantage because it has the capability to provide important insight when correlated with functional data of this important myofilament protein that other proteomic methods are unable to effectively address.
Characterization of myofilament proteoforms by LC-MS/MS analysis
Top-down proteomics is a powerful technology for sequence-specific characterization of different protein isoforms.21–26 To further demonstrate the ability of top-down MS to distinguish protein isoforms, LC-MS/MS analysis of myofilament proteins from SOL and GAS tissue was performed because SOL tissue is composed of slow-twitch fibers, whereas GAS tissue contains mainly fast-twitch fibers, and contain representative slow- and fast- isoforms.30 The fragment assignments were validated in MASH software to identify the TnI isoforms, fsTnI and ssTnI, which have high sequence homology. However, the method applies for all myofilament proteins detected in the analysis. To map the sequences of rat TnI isoforms, UniProt databases were used for sequence characterization. Upon initial comparison of the fsTnI monoisotopic masses with that found in UniProt, we noticed that there was a mass discrepancy of 88.95 Da. After removal of N-terminal methionine and addition of an acetylation to the first amino acid, the monoisotopic masses matched (as described in the previous section). N-terminal trimethylation or acetylation was further validated by comparison of the theoretical fragment ion masses and the experimental fragment ion masses to determine the correct N-terminal modification (Figure S7). The high-resolution MS method allows the determination of the N-terminal modification, which showcases the advantages of the top-down MS method. Online CAD fragmentation was used to generate b- and y-ions for tandem MS data. The precursors of ssTnI and fsTnI that were used for fragmentation match the predicted ions very closely, which confirms the mass accuracy and resolution of the instrument (Figure 6a). The reliability of the method was validated by showing several b- and y-ions and their accuracy to predicted values as denoted by the red circles (Figure 6b). Lastly, the total fragmentation of ssTnI and fsTnI shows the top-down characterization of two isoforms with high sequence similarities (Figure 6c). In total ssTnI produced 20 b-ions and 12 y-ions and fsTnI produced 21 b-ions and 20 y-ions. Overall, 30 of the 186 (16.1%) and 33 of the 181 (18.2%) backbone bonds were cleaved from ssTnI and fsTnI, respectively. The robustness of our top-down MS approach was further exemplified by characterizing the fast and slow skeletal isoforms of TnC and MLC-2 from SOL and GAS skeletal muscle tissues (Figure S8, Figure S9). The level of sequence coverage obtained in this study was expected because the analysis was done by online LC-MS/MS over a chromatographic time frame and is similar to sequence coverage seen in the previously reported online top-down LC-MS/MS analyses.50–51 Offline fractionation provides higher sequence coverage with the caveat that it is far more labor intensive and low throughput; however, fractionation could be pursued if there was a particular site-specific modification of interest to characterize.36–38,50–51 Still, the online tandem MS workflow described above is a robust method for characterizing protein isoforms from different muscle tissue in a robust and timely manner.
Figure 6. Online LC-MS/MS of skeletal TnI isoforms.
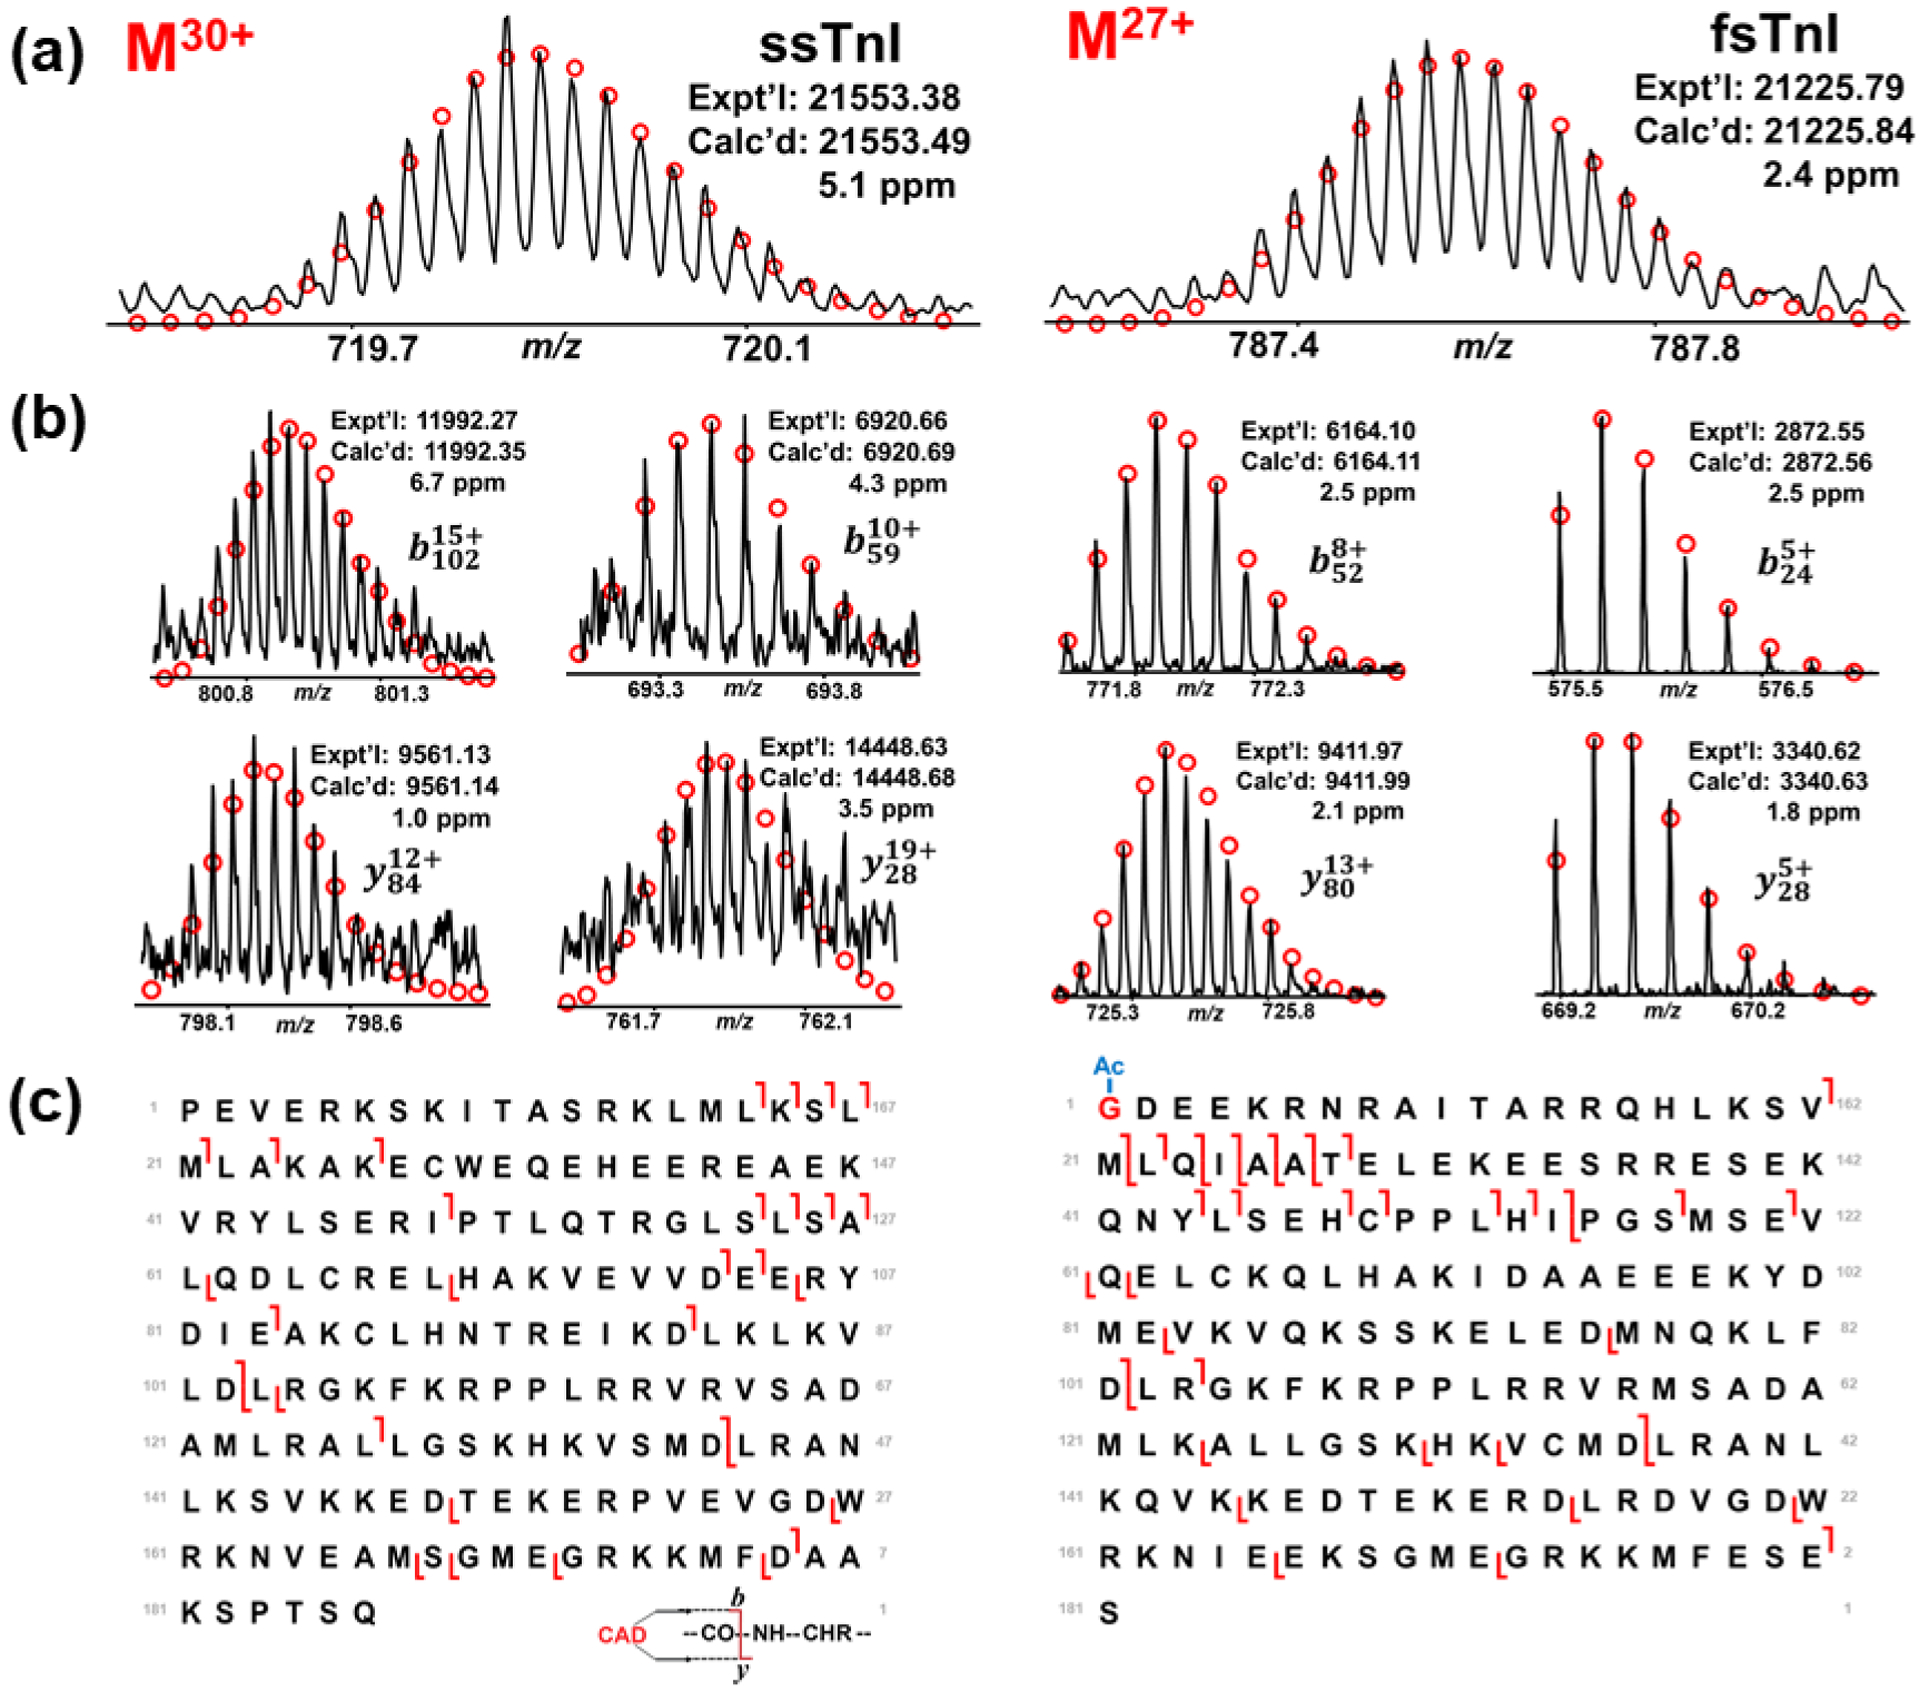
(a) Precursor ion of ssTnI at charge state of 30+ and precursor ion of fsTnI at charge state of 27+. Circles represent the theoretical isotopic abundance distribution of the isotopomer peaks corresponding to the assigned monoisotopic mass. (b) Representative CAD fragment ions. (c) Sequence map of ssTnI and fsTnI. N-terminal acetylation is highlighted in red on fsTnI. For ssTnC there were 20 b-ions and 12 y-ions. For fsTnC there were 21 b-ions and 20 y-ions.
Conclusions
In summary, we have reported the myofilament proteoform heterogeneity of rat skeletal muscle tissues using a robust and rapid top-down MS-based proteomics workflow. Previous proteomic studies have focused on one to two muscle tissues; this study represents the first extensive top-down MS study of a variety of skeletal muscle tissues. By detecting and quantifying different myofilament proteoforms from different muscle tissues, we demonstrated the highly heterogeneous nature of skeletal muscle. For example, the skeletal muscle myofilament proteoforms of TnI, TnC, MLC-2, Tpm, and TnT all showed vast differences across the seven different skeletal muscle tissues. Our results showed that skeletal TnT proteoforms exhibited the greatest amount of diversity across the seven skeletal muscle tissues. Furthermore, we have utilized online LC-MS/MS method to efficiently characterize the fast and slow isoforms of skeletal TnI, which have high sequence homology. Thus, our top-down MS-based proteomics method provides a high throughput platform to rapidly characterize myofilament proteoforms, which establishes technical foundations to understand myofilament adaptation to aging and disease across a variety of skeletal muscles.
Supplementary Material
Table S1. Summary of Myofilament Proteoforms
Table S2. Summary of Relative Proteoform Abundances
Figure S1. SDS-PAGE of TFA Extracts
Figure S2. SDS-PAGE of Biological and Technical Replicates
Figure S3. Overlaid LC-MS Results of Biological Replicates
Figure S4. Deconvoluted Mass Spectra of Alpha Skeletal Actin
Figure S5. α-Tpm/β-Tpm in Various Rat Skeletal Muscle Tissues
Figure S6. Sequence Alignment of Rat TnT Fast Isoforms
Figure S7. Determination of N-terminal Modification
Figure S8. Online LC-MS/MS Characterization of MLC-2S
Figure S9. Online LC-MS/MS Characterization of Skeletal TnC
Acknowledgements
The authors wish to thank Yanlong Zhu for their help and suggestions during the manuscript preparation. We would like to acknowledge NIH R01 grants, GM117058, GM125085, HL109810, and HL096971 and the high-end instrument grant S10OD018475 (to Y.G.).
The MS proteomics data have been deposited to the MassIVE repository, created by NIH-funded Center for Computational Mass Spectrometry (ftp://MSV000084452@massive.ucsd.edu) with the data set identifier MSV000084452.
Abbreviations
- Tpm
tropomyosin
- TnC
troponin C
- TnT
troponin T
- TnI
troponin I
- MHC
myosin heavy chain
- PTMs
post-translational modifications
- MS
mass spectrometry
- MS/MS
tandem MS
- LC
liquid chromatography
- VL
vastus lateralis
- GAS
gastrocnemius
- VM
vastus medialis
- VI
vastus intermelius
- RF
rectus femoris
- SOL
soleus
- PLN
plantaris
- F344BN
Fisher 344 x Brown Norway F1 hybrid
- TFA
trifluoroacetic acid
- Q-TOF
quadrupole-time of flight
- CAD
collision-activated dissociation
- SNAP
sophisticated numerical annotation procedure
- S/N
signal-to-noise
- fsTnT
fast skeletal troponin T
- ssTnT
slow skeletal troponin T
- fsTnI
fast skeletal troponin I
- ssTnI
slow skeletal troponin I
- α-Tpm
alpha-tropomyosin
- β-Tpm
beta-tropomyosin
- MLC-1V
ventricular isoform of myosin light chain 1
- MLC-1F
fast isoform of myosin light chain 1
- MLC-2F
fast isoform of myosin light chain 2
- MLC-3F
fast isoform of myosin light chain 3
- MLC-1S
slow isoform of myosin light chain 1
- MLC-2S
slow isoform of myosin light chain 2
- α-sActin
alpha skeletal actin
- fsTnC
fast skeletal troponin C
- ssTnC
slow skeletal troponin C
- EIC
extracted ion chromatogram
- BPC
base peak chromatogram
Footnotes
Supporting Information
The Supporting Information is available free of charge on the ACS Publications website at http://pubs.acs.org.
Competing financial interests: The authors declare no competing financial interests.
References
- 1.Frontera WR; Ochala J, Skeletal muscle: a brief review of structure and function. Calcif Tissue Int 2015, 96, 183–95. [DOI] [PubMed] [Google Scholar]
- 2.Bottinelli R; Reggiani C, Human skeletal muscle fibres: molecular and functional diversity. Prog Biophys Mol Biol. 2000, 73, 195–262. [DOI] [PubMed] [Google Scholar]
- 3.Bassel-Duby R; Olson EN, Signaling Pathways in Skeletal Muscle Remodeling. Annu Rev Biochem. 2006, 75, 19–37. [DOI] [PubMed] [Google Scholar]
- 4.Ciciliot S; Rossi AC; Dyar KA; Blaauw B; Schiaffino S, Muscle type and fiber type specificity in muscle wasting. Int J Biochem Cell Biol. 2013, 45, 2191–2199. [DOI] [PubMed] [Google Scholar]
- 5.Schiaffino S; Reggiani C, Fiber Types in Mammalian Skeletal Muscles. Physiol Rev. 2011, 91, 1447–1531. [DOI] [PubMed] [Google Scholar]
- 6.Squire JM, Architecture and function in the muscle sarcomere. Curr Opin Struct Biol 1997, 7, 247–57. [DOI] [PubMed] [Google Scholar]
- 7.Yuan C; Solaro RJ, Myofilament proteins: From cardiac disorders to proteomic changes. Proteomics Clin Appl. 2008, 2, 788–99. [DOI] [PubMed] [Google Scholar]
- 8.Moss RL; Diffee GM; Greaser ML, Contractile properties of skeletal muscle fibers in relation to myofibrillar protein isoforms Rev Physiol Biochem Pharmacol. Springer Berlin Heidelberg: Berlin, Heidelberg, 1995; pp 1–63. [DOI] [PubMed] [Google Scholar]
- 9.Peng Y; Ayaz-Guner S; Yu D; Ge Y, Top-down mass spectrometry of cardiac myofilament proteins in health and disease. Proteomics Clin Appl. 2014, 8, 554–568. [DOI] [PMC free article] [PubMed] [Google Scholar]
- 10.Miller MS; Callahan DM; Toth MJ, Skeletal muscle myofilament adaptations to aging, disease, and disuse and their effects on whole muscle performance in older adult humans. Front Physiol. 2014, 5, 369–369. [DOI] [PMC free article] [PubMed] [Google Scholar]
- 11.Miller MS; Toth MJ, Myofilament protein alterations promote physical disability in aging and disease. Exerc Sport Sci Rev. 2013, 41, 93–99. [DOI] [PMC free article] [PubMed] [Google Scholar]
- 12.Okumura N, Hashida-Okumura A, Kita K, Matsubae M, Matsubara T, Takao T, Nagai K: Proteomic analysis of slow- and fast-twitch skeletal muscles. Proteomics 2005. 5, 2896–2906. [DOI] [PubMed] [Google Scholar]
- 13.Gelfi C; Vasso M; Cerretelli P, Diversity of human skeletal muscle in health and disease: Contribution of proteomics. J Proteomics. 2011, 74, 774–795. [DOI] [PubMed] [Google Scholar]
- 14.Sweeney HL; Stull JT, Alteration of cross-bridge kinetics by myosin light chain phosphorylation in rabbit skeletal muscle: implications for regulation of actin-myosin interaction. Proc. Natl. Acad. Sci. U.S.A 1990, 87, 414. [DOI] [PMC free article] [PubMed] [Google Scholar]
- 15.Gregorich ZR, Peng Y, Cai W, Jin Y, Wei L, Chen AJ, McKiernan SH, Aiken JM, Moss RL, Diffee GM, and Ge Y Top-down targeted proteomics reveals decrease in myosin regulatory light-chain phosphorylation that contributes to sarcopenic muscle dysfunction. J. Proteome Res 2016. 15, 2706–2716. [DOI] [PMC free article] [PubMed] [Google Scholar]
- 16.Wei LM, Gregorich ZR, Lin ZQ, Cai WX, Jin YT, McKiernan SH, McIlwain S, Aiken JM, Moss RL, Diffee GM, Ge Y: Novel Sarcopenia-related Alterations in Sarcomeric Protein Post-translational Modifications (PTMs) in Skeletal Muscles Identified by Top-down Proteomics. Mol Cell Proteomics 2018. 17, 148–159. [DOI] [PMC free article] [PubMed] [Google Scholar]
- 17.Dowling P; Zweyer M; Swandulla D; Ohlendieck K, Characterization of Contractile Proteins from Skeletal Muscle Using Gel-Based Top-Down Proteomics. Proteomes 2019, 7, 25. [DOI] [PMC free article] [PubMed] [Google Scholar]
- 18.Smith LM; Kelleher NL; The Consortium for Top Down, P.; Linial M; Goodlett D; Langridge-Smith P; Ah Goo Y; Safford G; Bonilla* L; Kruppa G; Zubarev R; Rontree J; Chamot-Rooke J; Garavelli J; Heck A; Loo J; Penque D; Hornshaw M; Hendrickson C; Pasa-Tolic L; Borchers C; Chan D; Young* N; Agar J; Masselon C; Gross* M; McLafferty F; Tsybin Y; Ge Y; Sanders* I; Langridge J; Whitelegge* J; Marshall A, Proteoform: a single term describing protein complexity. Nat. Methods 2013, 10, 186. [DOI] [PMC free article] [PubMed] [Google Scholar]
- 19.Smith LM; Kelleher NL, Proteoforms as the next proteomics currency. Science 2018, 359, 1106. [DOI] [PMC free article] [PubMed] [Google Scholar]
- 20.Aebersold R; Agar JN; Amster IJ; Baker MS; Bertozzi CR; Boja ES; Costello CE; Cravatt BF; Fenselau C; Garcia BA; Ge Y; Gunawardena J; Hendrickson RC; Hergenrother PJ; Huber CG; Ivanov AR; Jensen ON; Jewett MC; Kelleher NL; Kiessling LL; Krogan NJ; Larsen MR; Loo JA; Ogorzalek Loo RR; Lundberg E; MacCoss MJ; Mallick P; Mootha VK; Mrksich M; Muir TW; Patrie SM; Pesavento JJ; Pitteri SJ; Rodriguez H; Saghatelian A; Sandoval W; Schlüter H; Sechi S; Slavoff SA; Smith LM; Snyder MP; Thomas PM; Uhlén M; Van Eyk JE; Vidal M; Walt DR; White FM; Williams ER; Wohlschlager T; Wysocki VH; Yates NA; Young NL; Zhang B, How many human proteoforms are there? Nat. Chem. Bio 2018, 14, 206. [DOI] [PMC free article] [PubMed] [Google Scholar]
- 21.Chen B; Brown KA; Lin Z; Ge Y, Top-Down Proteomics: Ready for Prime Time? Anal. Chem 2018, 90, 110–127. [DOI] [PMC free article] [PubMed] [Google Scholar]
- 22.Toby TK; Fornelli L; Kelleher NL, Progress in Top-Down Proteomics and the Analysis of Proteoforms. Annu Rev Anal Chem. 2016, 9, 499–519. [DOI] [PMC free article] [PubMed] [Google Scholar]
- 23.Gregorich ZR; Ge Y, Top-down proteomics in health and disease: challenges and opportunities. Proteomics 2014, 14, 1195–1210. [DOI] [PMC free article] [PubMed] [Google Scholar]
- 24.Gregorich ZR; Chang Y-H; Ge Y, Proteomics in heart failure: top-down or bottom-up? Pflugers Arch. 2014, 466, 1199–1209. [DOI] [PMC free article] [PubMed] [Google Scholar]
- 25.Armirotti A; Damonte G, Achievements and perspectives of top-down proteomics. Proteomics 2010, 10 , 3566–3576. [DOI] [PubMed] [Google Scholar]
- 26.Cai W; Tucholski TM; Gregorich ZR; Ge Y, Top-down Proteomics: Technology Advancements and Applications to Heart Diseases. Expert Rev Proteomics. 2016, 13, 717–730. [DOI] [PMC free article] [PubMed] [Google Scholar]
- 27.Jin Y; Diffee GM; Colman RJ; Anderson RM; Ge Y, Top-down Mass Spectrometry of Sarcomeric Protein Post-translational Modifications from Non-human Primate Skeletal Muscle. J. Am. Soc. Mass Spectrom 2019, in press. [DOI] [PMC free article] [PubMed] [Google Scholar]
- 28.Lin Z; Wei L; Cai W; Zhu Y; Tucholski T; Mitchell SD; Guo W; Ford SP; Diffee GM; Ge Y, Simultaneous Quantification of Protein Expression and Modifications by Top-down Targeted Proteomics: A Case of the Sarcomeric Subproteome. Mol. Cell. Proteomics 2019, 18, 594. [DOI] [PMC free article] [PubMed] [Google Scholar]
- 29.Lin Z; Guo F; Gregorich ZR; Sun R; Zhang H; Hu Y; Shanmuganayagam D; Ge Y, Comprehensive Characterization of Swine Cardiac Troponin T Proteoforms by Top-Down Mass Spectrometry. J. Am. Soc. Mass Spectrom 2018, 29, 1284–1294. [DOI] [PMC free article] [PubMed] [Google Scholar]
- 30.Armstrong RB; Phelps RO, Muscle fiber type composition of the rat hindlimb. Am J Anat. 1984, 171, 259–272. [DOI] [PubMed] [Google Scholar]
- 31.Cai W; Guner H; Gregorich ZR; Chen AJ; Ayaz-Guner S; Peng Y; Valeja SG; Liu X; Ge Y, MASH Suite Pro: A Comprehensive Software Tool for Top-Down Proteomics. Mol. Cell. Proteomics 2016, 15, 703–714. [DOI] [PMC free article] [PubMed] [Google Scholar]
- 32.Vitorino R; Ferreira R; Neuparth M; Guedes S; Williams J; Tomer KB; Domingues PM; Appell HJ; Duarte JA; Amado FML, Subcellular proteomics of mice gastrocnemius and soleus muscles. Anal Biochem. 2007, 366, 156–169. [DOI] [PMC free article] [PubMed] [Google Scholar]
- 33.Eng CM; Smallwood LH; Rainiero MP; Lahey M; Ward SR; Lieber RL, Scaling of muscle architecture and fiber types in the rat hindlimb. J Exp Biol. 2008, 211, 2336. [DOI] [PubMed] [Google Scholar]
- 34.Yan Z; Booth FW, Cytochrome c promoter activity in soleus and white vastus lateralis muscles in rats. J Appl Physiol. 1998, 85, 973–978. [DOI] [PubMed] [Google Scholar]
- 35.Perry SV, Vertebrate tropomyosin: distribution, properties and function. J Muscle Res Cell Motil. 2001, 22, 5–49. [DOI] [PubMed] [Google Scholar]
- 36.Peng Y; Yu D; Gregorich Z; Chen X; Beyer AM; Gutterman DD; Ge Y, In-depth proteomic analysis of human tropomyosin by top-down mass spectrometry. J Muscle Res Cell Motil. 2013, 34, 199–210. [DOI] [PMC free article] [PubMed] [Google Scholar]
- 37.Peng Y; Chen X; Zhang H; Xu Q; Hacker TA; Ge Y, Top-down targeted proteomics for deep sequencing of tropomyosin isoforms. J Proteome Res. 2013, 12, 187–198. [DOI] [PMC free article] [PubMed] [Google Scholar]
- 38.Jin Y; Peng Y; Lin Z; Chen Y-C; Wei L; Hacker TA; Larsson L; Ge Y, Comprehensive analysis of tropomyosin isoforms in skeletal muscles by top-down proteomics. J Muscle Res Cell Motil. 2016, 37, 41–52. [DOI] [PMC free article] [PubMed] [Google Scholar]
- 39.Dutka TL; Mollica JP; Lamboley CR; Weerakkody VC; Greening DW; Posterino GS; Murphy RM; Lamb GD, S-nitrosylation and S-glutathionylation of Cys134 on troponin I have opposing competitive actions on Ca2+ sensitivity in rat fast-twitch muscle fibers. Am. J. Physiol. Cell Physiol 2016, 312, C316–C327. [DOI] [PubMed] [Google Scholar]
- 40.Mollica JP; Dutka TL; Merry TL; Lamboley CR; McConell GK; McKenna MJ; Murphy RM; Lamb GD, S-Glutathionylation of troponin I (fast) increases contractile apparatus Ca2+ sensitivity in fast-twitch muscle fibres of rats and humans. J. Physiol 2012, 590, 1443–1463. [DOI] [PMC free article] [PubMed] [Google Scholar]
- 41.Greaser ML; Moss RL; Reiser PJ, Variations in contractile properties of rabbit single muscle fibres in relation to troponin T isoforms and myosin light chains. J. Physiol 1988, 406, 85–98. [DOI] [PMC free article] [PubMed] [Google Scholar]
- 42.Carraro U; Catani C; Dalla Libera L; Vascon M; Zanella G, Differential distribution of tropomyosin subunits in fast and slow rat muscles and its changes in long-term denervated hemidiaphragm. FEBS Lett. 1981, 128, 233–236. [DOI] [PubMed] [Google Scholar]
- 43.Lees-Miller JP; Helfman DM, The molecular basis for tropomyosin isoform diversity. BioEssays 1991, 13, 429–437. [DOI] [PubMed] [Google Scholar]
- 44.Palmiter KA; Kitada Y; Muthuchamy M; Wieczorek DF; Solaro RJ, Exchange of - for -Tropomyosin in Hearts of Transgenic Mice Induces Changes in Thin Filament Response to Ca, Strong Cross-bridge Binding, and Protein Phosphorylation. Front. Physiol 1996, 271, 11611–11614. [DOI] [PubMed] [Google Scholar]
- 45.Wang J; Jin J-P, Primary structure and developmental acidic to basic transition of 13 alternatively spliced mouse fast skeletal muscle troponin T isoforms. Gene 1997, 193, 105–114. [DOI] [PubMed] [Google Scholar]
- 46.Wei B; Jin JP, Troponin T isoforms and posttranscriptional modifications: Evolution, regulation and function. Arch. Biochem. Biophys 2011, 505, 144–154. [DOI] [PMC free article] [PubMed] [Google Scholar]
- 47.Biesiadecki BJ; Chong SM; Nosek TM; Jin J-P, Troponin T Core Structure and the Regulatory NH2-Terminal Variable Region†. Biochemistry 2007, 46, 1368–1379. [DOI] [PMC free article] [PubMed] [Google Scholar]
- 48.Genchev GZ; Kobayashi T; Lu H, Calcium Induced Regulation of Skeletal Troponin — Computational Insights from Molecular Dynamics Simulations. PLOS ONE 2013, 8, e58313. [DOI] [PMC free article] [PubMed] [Google Scholar]
- 49.Ogut O; Granzier H; Jin J-P, Acidic and basic troponin T isoforms in mature fast-twitch skeletal muscle and effect on contractility. Am J Physiol.. 1999, 276, C1162–C1170. [DOI] [PubMed] [Google Scholar]
- 50.Liang Y; Jin Y; Wu Z; Tucholski T; Brown KA; Zhang L; Zhang Y; Ge Y, Bridged Hybrid Monolithic Column Coupled to High-Resolution Mass Spectrometry for Top-Down Proteomics. Anal. Chem 2019, 91, 1743–1747. [DOI] [PMC free article] [PubMed] [Google Scholar]
- 51.Gregorich ZR; Peng Y; Lane NM; Wolff JJ; Wang S; Guo W; Guner H; Doop J; Hacker TA; Ge Y, Comprehensive assessment of chamber-specific and transmural heterogeneity in myofilament protein phosphorylation by top-down mass spectrometry. J. Mol. Cell. Cardiol 2015, 87, 102–112. [DOI] [PMC free article] [PubMed] [Google Scholar]
Associated Data
This section collects any data citations, data availability statements, or supplementary materials included in this article.
Supplementary Materials
Table S1. Summary of Myofilament Proteoforms
Table S2. Summary of Relative Proteoform Abundances
Figure S1. SDS-PAGE of TFA Extracts
Figure S2. SDS-PAGE of Biological and Technical Replicates
Figure S3. Overlaid LC-MS Results of Biological Replicates
Figure S4. Deconvoluted Mass Spectra of Alpha Skeletal Actin
Figure S5. α-Tpm/β-Tpm in Various Rat Skeletal Muscle Tissues
Figure S6. Sequence Alignment of Rat TnT Fast Isoforms
Figure S7. Determination of N-terminal Modification
Figure S8. Online LC-MS/MS Characterization of MLC-2S
Figure S9. Online LC-MS/MS Characterization of Skeletal TnC