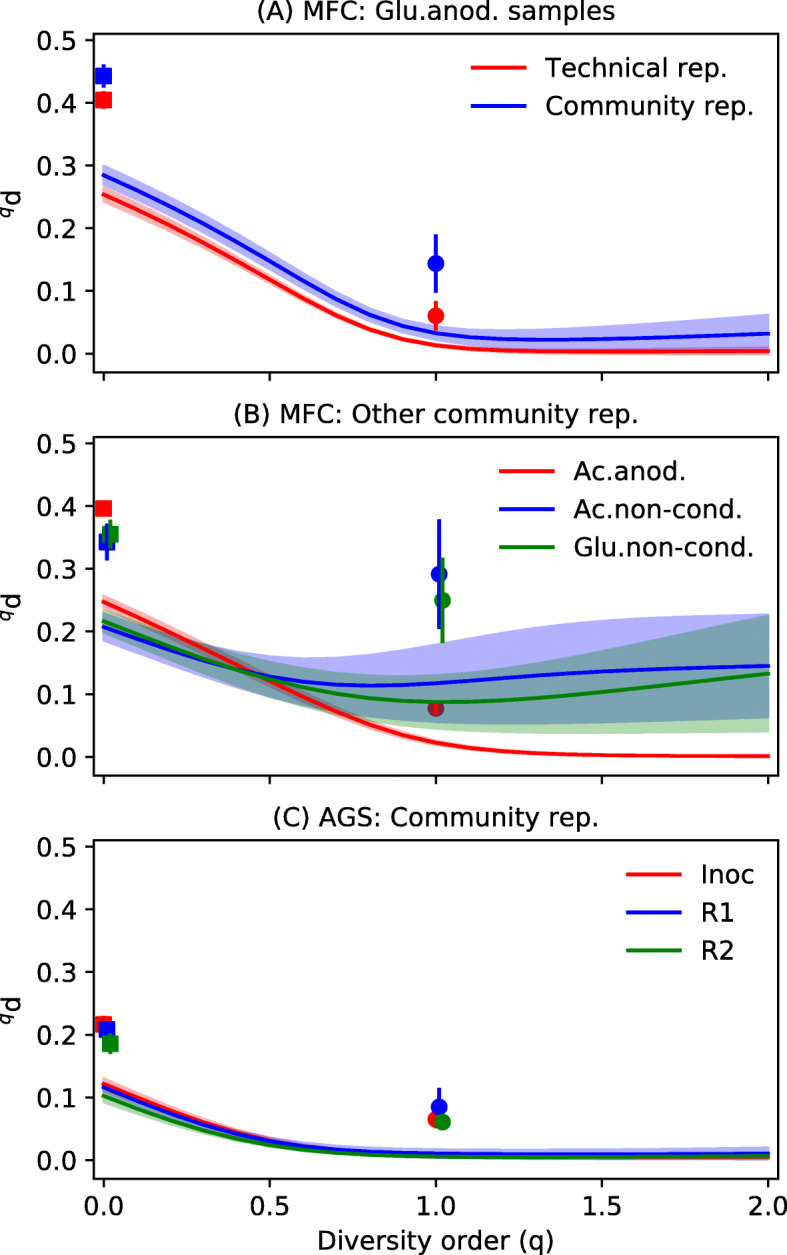
Fig. 3.

Dissimilarities between replicates (n = 6). a A comparison between the community and technical replicates for samples from the MFC experiment. b Other community replicates from the MFC experiment and c community replicates from the AGS experiment. Hill-based dissimilarity values (qd) are shown as lines. Jaccard and Bray-Curtis dissimilarities are shown as squares and circles, respectively. Shaded regions and error bars are standard deviations of pairwise dissimilarities (n = 15). The MFC data set had four categories of samples: acetate-fed biofilms growing on anodes (Ac.anod.), acetate-fed biofilms growing on non-conductive surfaces (Ac.non-cond.), glucose-fed biofilms growing on anodes (Glu.anod.), and glucose-fed biofilms growing on non-conductive surfaces (Glu.non-cond.). The AGS data set had three sample categories: the inoculum (Inoc), reactor 1 (R1), and reactor 2 (R2). The technical replicates were taken from a Glu.anod. sample
