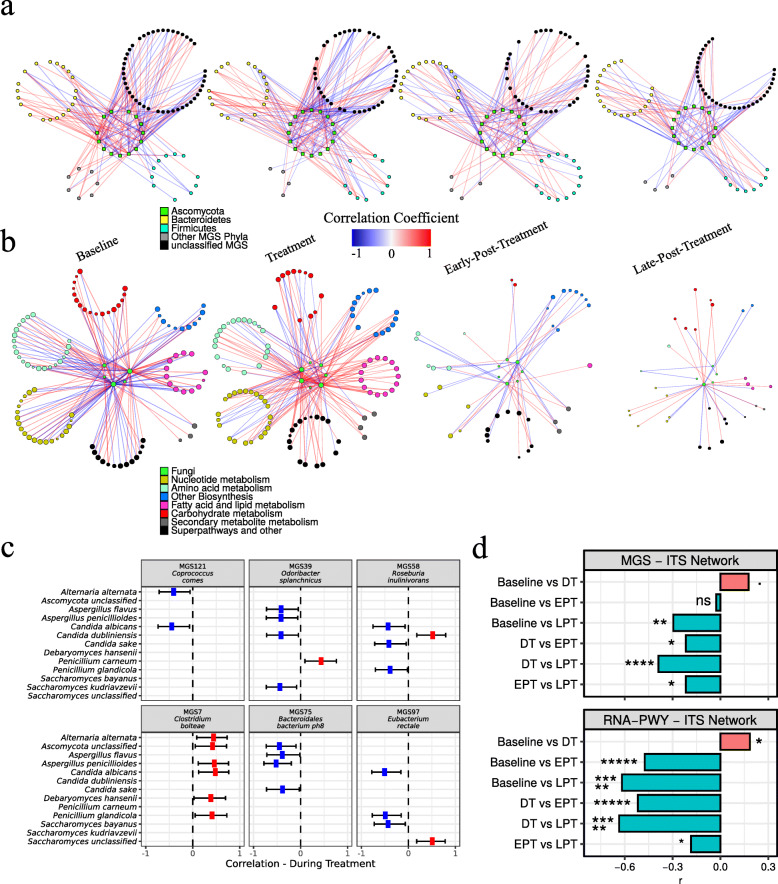
Fig. 3.
Cross-kingdom interactions among fungi, bacteria species, and pathway expression. a, b Co-abundance networks at indicated time points using BAnOCC with a 25% and b 50% prevalence filter. Only significant edges are shown (based on 95% credibility interval) with |r| ≥ 0.3. Negative correlations (blue), positive correlations (red). Networks are left (baseline) to right (late post treatment). a Correlations among fungal and bacterial species based on metagenomic species (MGS) and internal transcribed spacer (ITS) relative abundance. b Correlations among fungal species and pathway expression based on HUMAnN2 RNA pathway and internal transcribed sequence relative abundance. Superpathways and other pathways that did not fit into the six major categories were grouped as “other”. c Estimated correlation between bacterial and fungal species during treatment. Positive (red), negative (blue). Error lines show 95% confidence intervals. d Effect size of node degree change. r values change from − 1 (100% decrease) to 1 (100% increase). (Top) MGS and ITS relative abundances. (Bottom) RNA-PWY and ITS relative abundances. Statistical testing for significant changes in node degree was performed using a two-sided Wilcox signed-rank test. P values were adjusted for multiple testing using FDR. Node degree was determined independently for baseline, during (DT), early post (EPT), and late post treatment (LPT). Significance is indicated by symbols (ns, q ≥ 0.05; *q < 0.05; **q < 0.01; ***q < 1e− 3; ****q < 1e− 4; *****q < 1e− 5)

