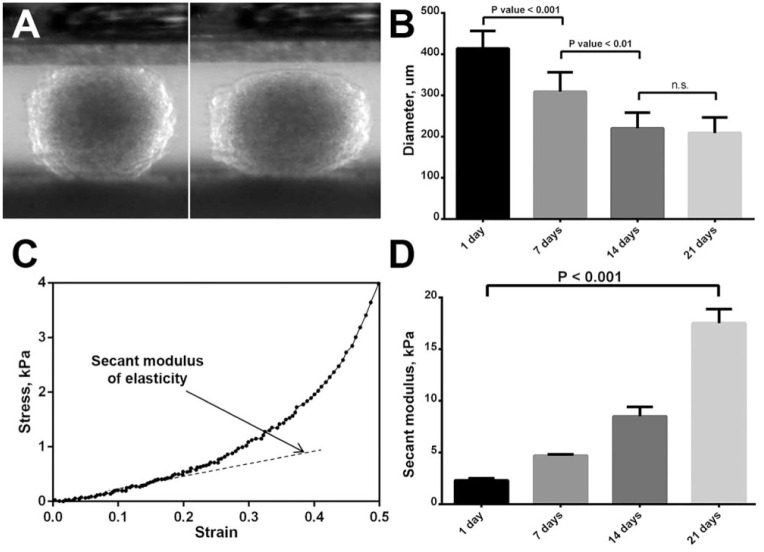
Figure 6.
Determination of biomechanical properties of chondrospheres (CS): compression stages during the test of 7-day-old CS using the compression system (A), the reduction of CS diameter as a result of their maturation process (B), CS strain-stress graph (C), increase of secant modulus of elasticity during the maturation of CS (D). Data of the graphs (B, D) are represented as mean ± SEM.

