Abstract
Background and Aims
Light interception is closely related to canopy architecture. Few studies based on multi-view photography have been conducted in a field environment, particularly studies that link 3-D plant architecture with a radiation model to quantify the dynamic canopy light interception. In this study, we combined realistic 3-D plant architecture with a radiation model to quantify and evaluate the effect of differences in planting patterns and row orientations on canopy light interception.
Methods
The 3-D architectures of maize and soybean plants were reconstructed for sole crops and intercrops based on multi-view images obtained at five growth dates in the field. We evaluated the accuracy of the calculated leaf length, maximum leaf width, plant height and leaf area according to the measured data. The light distribution within the 3-D plant canopy was calculated with a 3-D radiation model. Finally, we evaluated canopy light interception in different row orientations.
Key Results
There was good agreement between the measured and calculated phenotypic traits, with an R2 >0.97. The light distribution was more uniform for intercropped maize and more concentrated for sole maize. At the maize silking stage, 85 % of radiation was intercepted by approx. 55 % of the upper canopy region for maize and by approx. 33 % of the upper canopy region for soybean. There was no significant difference in daily light interception between the different row orientations for the entire intercropping and sole systems. However, for intercropped maize, near east–west orientations showed approx. 19 % higher daily light interception than near south–north orientations. For intercropped soybean, daily light interception showed the opposite trend. It was approx. 49 % higher for near south–north orientations than for near east–west orientations.
Conclusions
The accurate reconstruction of 3-D plants grown in the field based on multi-view images provides the possibility for high-throughput 3-D phenotyping in the field and allows a better understanding of the relationship between canopy architecture and the light environment.
Keywords: Multi-view, planting pattern, row orientation, canopy architecture, light interception, Zea mays, Glycine max
INTRODUCTION
Global food demand is expected to double by 2050, and crop production is facing tremendous pressure due to the increase in the human population (Tilman et al., 2011; Cobb et al., 2013). One of the most effective measures to solve this problem is to breed more high-yield varieties and use more advanced cultivation techniques (Bongiovanni and Lowenberg-Deboer, 2004). Currently, gene sequencing technology is under rapid development. It has become more affordable and efficient, and thus enables researchers to explore more detailed information regarding genes (Mullan and Reynolds, 2010). To make full use of the progress of molecular technology, high-throughput, high-precision, low-cost and comprehensive phenotypic analysis is indispensable and valuable for genetic gains on investing breeding resources (Houle et al., 2010). Exhaustive field investigations of plant phenotypic traits are time-consuming, and their accuracy cannot be fully guaranteed. Therefore, high-throughput phenotyping is the core technology to solve the bottleneck from genomic to phenotypic research (Minervini et al., 2015; Varshney et al., 2018; Costa et al., 2019).
Unlike 2-D planar images, plant 3-D architecture utilizes intuitive characteristics that describe the canopy orientation and shapes. There are many ways to obtain the 3-D information on crop canopies. Three-dimensional digitization technology can be used to obtain morphological and spatial information on plant organs (Chambelland et al., 2008; Zheng et al., 2011). However, it is time-consuming, invasive and easily affected by wind and position. With the development of sensors and information technology, non-invasive methods have been widely used to obtain 3-D spatial information on the crop canopy, such as the TOF (time of flight) camera (Jiang et al., 2016), depth camera (Xiong et al., 2017) and LiDAR (Sun et al., 2017). These methods can be used to extract canopy phenotypic traits such as plant height, canopy width and leaf area index (Bietresato et al., 2016). However, individual leaf shape, inclination angle and area cannot be extracted with these methods. Functional–structural plant models (FSPMs) can quantify the 3-D canopy architecture dynamically according to detailed input on the size and angles of individual organs and require intensive manual measurements indoors or outdoors (Ma et al., 2007; Chen et al., 2014; Louarn et al., 2015; Douma et al., 2019).
In recent years, 3-D reconstruction based on multi-view image sequences has been widely applied indoors for pepper, aubergine, cucumber, wheat and maize (Lou et al., 2014; Pound et al., 2014; Duan et al., 2016; Burgess et al., 2017; Hui et al., 2018), due to its advantages of low cost, high accuracy and its non-invasive and simple operation. Early plant vigour and growth parameters are characterized throughout plant growth based on the established 3-D canopy architecture. However, few studies have been conducted in a field environment, particularly studies that link 3-D plant architecture with a radiation model to quantify dynamic canopy light interception throughout the entire plant growth season.
Intercropping systems have been widely adopted globally for their favourable ecological and yield-increasing effects (Mucheru-Muna et al., 2010). The utilization of light and land resources can be maximized through complementarity among different species (Zhu et al., 2010; Kermah et al., 2017; Yang et al., 2017) to achieve sustainable agricultural development and high yield (Lithourgidis et al., 2011). The focus of intercropping is on how to best combine the characteristics of different species to improve the performance of the entire cropping system (Brooker et al., 2015). However, increasing species diversity does not always lead to higher yields (Letourneau et al., 2011; Cardinale et al., 2012). Higher crops have shading effects on lower crops, and different row orientations have different shading levels (Tsubo and Walker 2004), resulting in different patterns of canopy light interception which in turn will affect crop yields (Karanja et al., 2014). Therefore, it is very important to quantify the differences in canopy light interception under different row orientations for each intercropped plant to maximize the advantages of the intercropping system.
The aim of this study is to use an inexpensive and portable set-up to rapidly characterize 3-D plant architecture for sole and intercropping systems in the field. Based on the 3-D architecture, the canopy light interception at different growth stages and row orientations for each plant was quantitatively evaluated. This will provide a better understanding of yield advantage and different growth behaviours within the intercropping system and can guide field management.
MATERIALS AND METHODS
Field trial design
The field trial was conducted at the Lishu Experimental Station of China Agricultural University, Jilin Province (43°16'N, 124°26'E) for 2 years.The soil type in the experimental area is black soil with a bulk density of 1.3 g cm–3. Maize XY335 (Zea mays L.) and soybean JY47 (Glycine max) were selected as the targeted crops. Plants were sown in three treatments: sole maize, sole soybean and intercropped maize (two rows) with soybean (two rows). There was 50 cm between rows, 20 cm between plants within the rows of maize and 10 cm between plants within the rows of soybean.
We selected two rows and two adjacent plants within a row in the sole systems, and three adjacent intercropped plants within a row in the intercropped systems. In total, four sole maize, four sole soybeans and three intercropped soybeans and maize were used for the 3-D reconstructions. All selected plants were bound with white, red, yellow or blue non-reflective straps at the base with the aim of easily differentiating the targeted plants for measurement. We then placed a label (30 × 30 cm) between two rows of plants to facilitate the subsequent size conversion of the 3-D reconstructed plants (Fig. 1A).
Fig. 1.
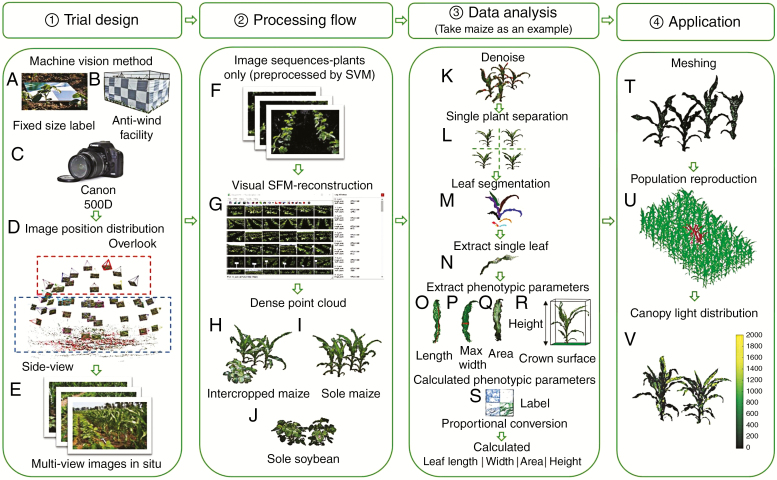
Pipeline of photography process, canopy reconstruction, phenotypic traits extraction and meshing. (A–E) represent trial design, (F–J) represent the process of 3-D reconstruction, (K–S) represent the flow of data analysis, (T–V) represent meshing and the process of calculating canopy light distribution.
Five dates were chosen during the emergence and silking stages of the maize corresponding to 21, 25, 33, 42 and 62 d after emergence. All measurements were performed in windless and sunny weather. The trial design and data processing are shown in Fig. 1. To avoid the influence of wind on plant architecture during the measurements, a windshield device was designed and is shown in Fig. 1B. The equipment was mainly composed of a cloth with a black and white checkerboard pattern that was non-reflective and was supported by an iron frame. The black and white pattern, with a strong contrast of colour, aids the capture of feature points from the targeted plants. We then manually held the Cannon 500D DSLR camera (Canon, Inc., Tokyo, Japan; Fig. 1C) to capture the multi-view images of the targeted plant canopy.
The distribution of image positions is shown in Fig. 1D. The images taken from the top view are shown in the red rectangle. The side-view image positions are shown in the blue rectangle. Ideally, the spacing interval of adjacent multi-view images is relatively uniform. However, according to the actual field environment and plant occlusion, the actual interval between the adjacent side-view images can be between 10° and 30°. The adjacent images taken from the top view were more evenly spaced than those from the side view because there was less occlusion by the plants. Finally, we obtained multi-view images of the targeted plants (Fig. 1E).
Reconstruction and treatment of 3-D point clouds of plants
The obtained multi-view images were pre-processed using an SVM (support vector machine) algorithm (Agrawal et al., 2011). A series of images containing the pixel information of the targeted plants were acquired with automatic removal of the non-plant background pixels (Fig. 1F). We selected vegetation pixels as a foreground training set and non-target plant pixels as a background training set. The SVM algorithm was then used to discriminate the two types of pixels. Finally, the main part of the plant pixels was kept while deleting non-plant background pixel information.
The open source software Visual SFM (Wu et al., 2011; Wu, 2013) was used to automatically reconstruct the 3-D point clouds containing only the targeted plants (Fig. 1G). The software included the following functions. (1) The scale-invariant feature transform (SIFT) descriptor with scale and rotation invariance was used. This descriptor is robust and is suitable for feature point extraction of the scale transformation and rotation angle (Gibbs et al., 2016). (2) An approximate nearest-neighbour classification algorithm was used to match the feature points between each pair of images (Arya et al., 1998). (3) Because the images may possibly have rotation, scaling or brightness changes, the random sample consensus algorithm (RANSAC) was used to eliminate possible matching errors. (4) Camera parameters and the projection matrix were calculated using the SFM method and were optimized using bundle adjustment to obtain sparse point clouds. (5) A multi-view stereo clustering method was used to reduce the amount of dense data reconstructed from the SFM result images. (6) Finally, using patch-based multi-view stereo (PMVS) software (Furukawa and Pounce, 2010), the dense point clouds with the true colour of the targeted plants were generated through matching, diffusion, expansion and filtering under the constraints of local photometric consistency and global visibility (Fig. 1H, I, J, corresponding to the intercropped maize, sole maize and sole soybean treatments, respectively).
Camera shaking and wind in the field when taking photographs will inevitably produce noise points. Therefore, pre-processing filtering needs to be performed to remove noise points and outliers to obtain smoother dense point clouds. We selected the point clouds in the filter module to eliminate the points of the non-ontological RGB colour information points, such as the red dots in Fig. 1K, and to obtain relatively clean plant point clouds in the Geomagic Studio software (Raindrop Geomagic, Morrisville, NC, USA; Hui et al., 2018). The filtering module in the Point Cloud Library (PCL) was used to automatically reduce the noise from the targeted plants (Rusu and Cousins, 2011). The PCL-based point cloud denoising includes the steps of creating a filter object, setting the point cloud to be filtered, setting the number of proximate points to be queried when performing statistics, and determining whether outliers are thresholds. For different crops, the denoising thresholds needed to be adjusted to achieve the best noise reduction. Geomagic Studio was used to manually extract the point cloud data of individual targeted plants from the population point clouds (Fig. 1L). The Octree model in CloudCompare (http://www.danielgm.net/cc/; 3-D point cloud and mesh processing software) (Fig. 1M) was used to segment individual organs from individual plants. We manually merged the divided points into individual organs depending on the topology relationship (Duan et al., 2016). Afterwards, the point clouds of the plant organs were transformed into triangular meshes using Geomagic Studio. Finally, the meshes of individual plant organs were integrated into the mesh of the plant populations (Fig. 1T).
Estimation of phenotypic traits
A series of phenotypic traits such as plant height, crown area, leaf length and leaf maximum width were automatically extracted for maize and soybeans in the current study. The maize plant is used as an example in Fig. 1I. The plant height was defined as the vertical distance between the base of the stem and the highest point of the plant. From the top view of the canopy, the definitions of canopy maximum length and width are shown in Fig. 1R. The product of the maximum length and width of the canopy was defined as the crown area, as shown in the green rectangle in Fig. 1R. Automatic extraction of plant height followed a similar procedure. We use a t-test to compare the difference in plant height and crown area between the intercropped system and sole crops. Geomagic Studio was used to patch the selected leaves, and then output the individual leaf area. The actual size of the plant was obtained by a proportional conversion based on the ratio of actual size to point cloud size of the label (Fig. 1S).
After separation of the individual leaf (Fig. 1N), the leaf base was moved to the origin and the leaf tip was rotated in the positive direction of the x-axis. A local polynomial regression algorithm was used to fit the leaf midribs and automatically obtain the leaf length (Fig. 1O; Duan et al., 2016). We then made a series of vertical planes perpendicular to the midrib plane to obtain the intersection points between the two edges of the leaf. A series of leaf widths were therefore obtained, and the maximum value was recorded as the maximum width of the leaf (Fig. 1P). The leaf area (LA) was calculated as the sum of all facets of the area of the individual leaf (Fig. 1Q). The plant height, leaf length (LL) and leaf maximum width (LW) of 2–3 leaves of all targeted plants were measured with a ruler to verify the accuracy of the reconstructed 3-D models. The reference leaf area (LAr) was calculated using eqn (1) (Montgomery, 1911). The accuracy was evaluated using the coefficient of determination (R2) and the root mean square error (RMSE).
| (1) |
Calculation of light interception within the canopy
We calculated direct and sky diffuse radiation within the canopy using the DSHP (dividing sky hemisphere with projection) model (Wang et al., 2008; Zheng et al., 2011) based on the meshed canopy. The canopy light distribution for each measurement date was simulated. The instantaneous canopy light distribution was simulated at each hour of the day when the solar elevation angle was >6°. To avoid the border effect and ensure the reliability of the virtual experiments, separated individual plants were randomly rotated to form different populations. Duplications were constructed for ten rows for sole and intercropped crops, and 14 columns were constructed for sole crops, 21 columns for intercropped maize and 42 columns for intercropped soybean. The central plants with two rows and two columns for sole crops and four rows and six columns for intercropping were used to calculate the light distribution (Fig. 1U). Five random simulations were run for each treatment at each measuring date to observe the differences among simulations. The radiation was characterized by PPFD (photosynthetic photon flux density) for all canopy facets. We set the total radiation to incorporate 90 % solar direct radiation and 10 % diffuse radiation from the sky hemisphere on sunny days.
One row of three maize plants and soybean plants was selected as the targeted plants for photographing and calibrating the phenotypic traits. To simulate the complete canopy for the intercropping treatment, we first manually separated the point clouds of the maize plants from point clouds of the soybean plants within the intercropping canopy. Then, we duplicated the plants randomly for two rows of maize and soybeans according to the field arrangement of the intercropping treatment. In this study, we defined Pi as the PPFD value of each facet, Si as the area of each facet, and i = 1,2 ….n, where n represented the number of facets. The product of Pi and Si is the instantaneous light interception of each facet (LI), as shown in eqn (2):
| (2) |
We first counted the LI at each integral time (t) in a day and then interpolated LI by a cubic spline method (McKinley and Megan, 1998) and integrated the interpolation function [eqn (3)] to obtain the daily light interception TL [eqn (4)]
| (3) |
where ft(x) is a spline between integral times; at, bt, ct and dt are coefficients calculated by the rule of cubic spline method.
| (4) |
where f(t) is numerically integrated; st represents the starting time of the day (sunrise) and et represents the ending time of the day (sunset). We used light interception per unit leaf area (IA) to evaluate the light interception efficiency of the leaves, as shown in eqn (5).
| (5) |
Furthermore, we divided the TL by the occupied ground area A to obtain the daily light interception per unit ground area (TLg) to evaluate the canopy light interception efficiency, as shown in eqn (6):
| (6) |
We used the ratio of daily light interception at each horizontal stratum (LR) to evaluate the light distribution on different measurement dates, as shown in eqn (7), where TLh represents the daily light interception at each horizontal stratum:
| (7) |
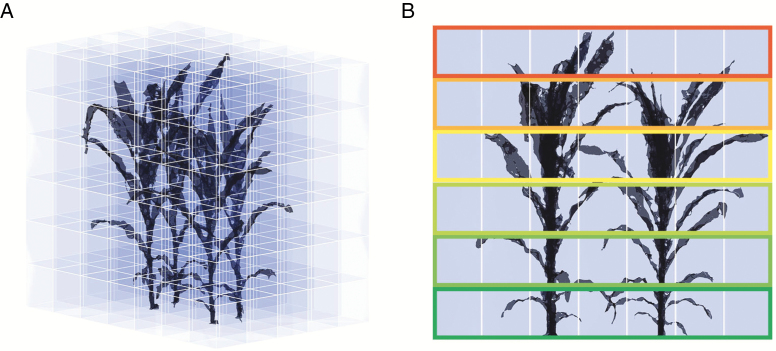
The TLg and LR were calculated at different growth stages to evaluate the changes in light interception for the simulated plant canopy. To calculate LR, we first determined the size of the canopy space based on the maximum and minimum values of the x, y and z axes of the canopy. We then sub-divided the canopy space from the ground with 20 × 20 × 20 cm voxels (Fig. 2A) and calculated the centre of each small facet to determine its position (Wang et al., 2008). The light interception at each horizontal stratum was characterized by summing the daily light interception of the facets in each layer of the vertical profiles.
Fig. 2.
Voxelization of the 3-D canopy for calculation of the daily light interception rate at different canopy heights. (A) Voxel schematic, (B) separating canopy into different layers with rectangles in different colours.
Evaluation of planted row orientations
At 62 d after emergence, all plants in the different treatment groups were simulated in different row orientations. Each clockwise rotation of 20° was recorded as a new orientation for a total of nine row orientations. Each orientation was simulated five times for a total of 135 simulations. The light interception at different orientations was evaluated.
RESULTS
Evaluation of the reconstructed 3-D canopy
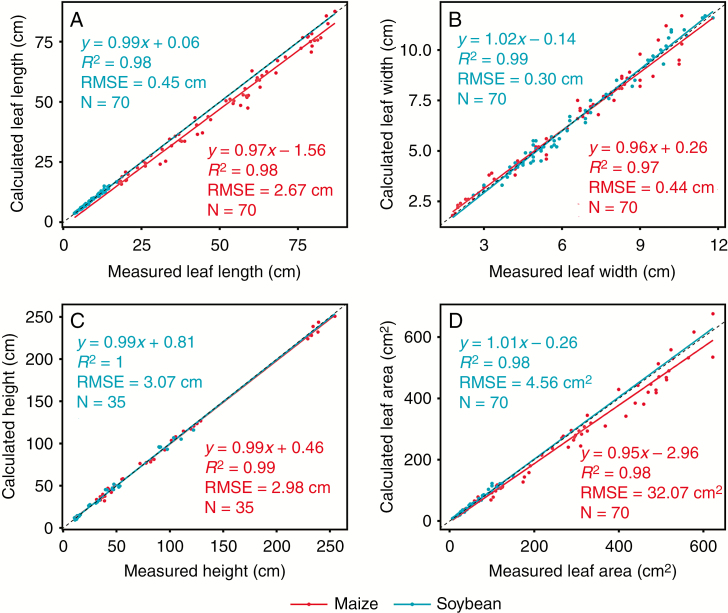
We evaluated the accuracy of the calculated individual leaf length, maximum leaf width, plant height and leaf area based on the measured data. For maize, the calculated leaf length is generally lower than the real leaf length (Fig. 3A) and the calculated leaf area is generally lower than the real leaf area (Fig. 3D). There was good agreement between the measured and calculated leaf length, with an R2 = 0.98 and RMSE = 0.45 cm for soybean and an R2 = 0.98 and RMSE = 2.67 cm for maize (Fig. 3A); maximum leaf width with an R2 = 0.99 and RMSE = 0.30 cm for soybean and an R2 = 0.97 and RMSE = 0.44 cm for maize (Fig. 3B); plant height with an R2 = 1 and RMSE = 3.07 cm for soybean and an R2=0.99 and RMSE = 2.98 cm for maize (Fig. 3C); and leaf area with an R2 = 0.98 and RMSE = 4.56 cm2 for soybean and an R2 = 0.98 and RMSE = 32.07 cm2 for maize (Fig. 3D). We emphasize here that the measured leaves for model calibration were mainly distributed on the top of the canopy surface to identify each leaf easily from the reconstructed plant architecture.
Fig. 3.
Comparison between measured and calculated values of leaf length (A), leaf maximum width (B), plant height (C) and leaf area (D) of sole maize, sole soybean and maize/soybean intercropping. Two leaves of each plant were selected for the accuracy evaluation.
Growth measurement of plants
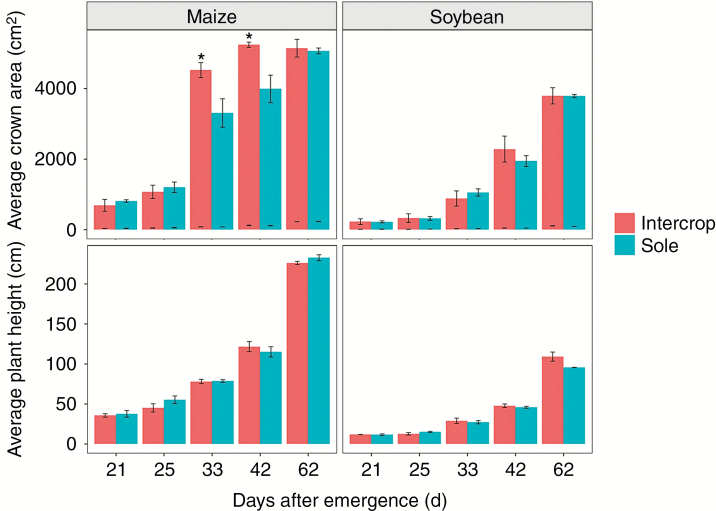
Plant height and crown area were extracted from all 3-D architecture reconstructions. The height and crown area were larger for intercropped soybean than for sole soybean 33 d after emergence (Fig. 4). The height of sole maize was higher than that of intercropped maize before 42 d after emergence. However, these differences were not significant. The crown area was larger for intercropped maize than for sole maize 25 d after emergence, and the difference was significant at 33 and 42 d after emergence (P < 0.05).
Fig. 4.
The dynamic growth of plant height and crown area for all treatments at 21, 25, 33, 42 and 62 d after emergence, An asterisk indicates significantly difference at P < 0.05 among treatments at the same days after emergence.
Three-dimensional light interception within the canopy
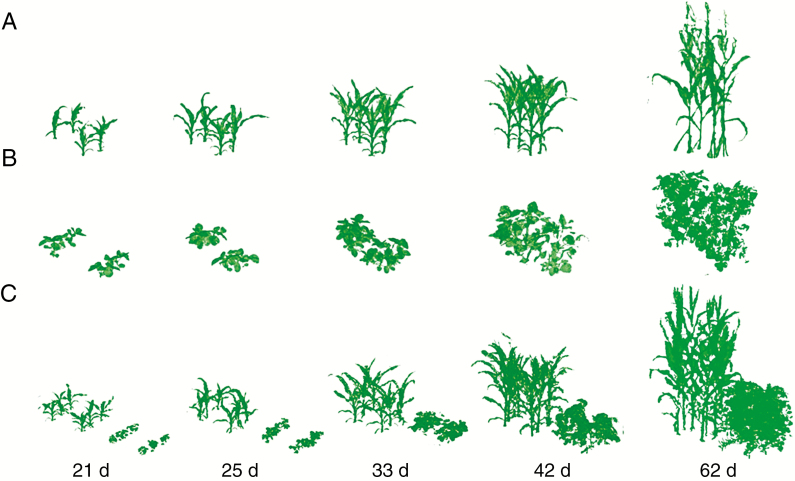
The reconstructions of 3-D point clouds were generated for five dates from emergence to the silking stage. The plant architecture was well preserved at the four early stages (Fig. 5). At 62 d after emergence, the maize plants around the targeted plants were pushed over manually to ensure complete access to the targeted plants due to severe occlusion.
Fig. 5.
3-D architecture reconstructions of the plant canopy of sole maize (A), sole soybean (B) and intercrops (C), corresponding to 21, 25, 33, 42 and 62 d after emergence.
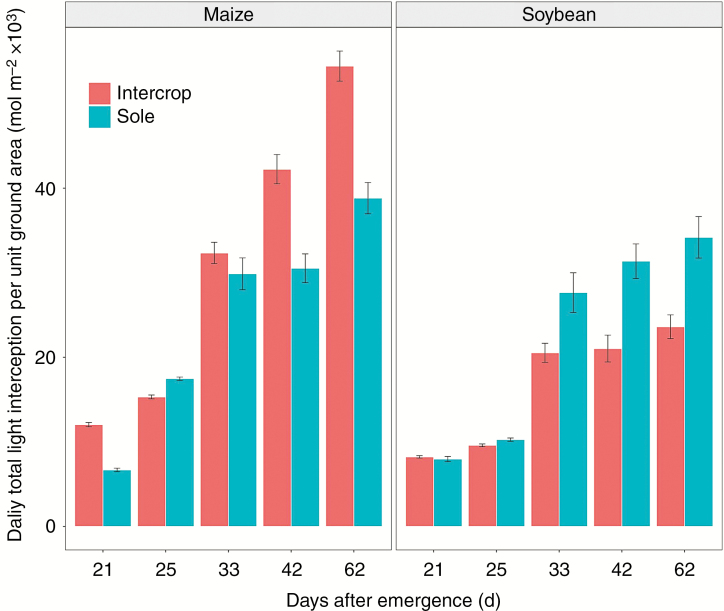
At 25 d after emergence, the intercropped maize plant intercepted more light than sole maize, because less light penetrated into the sole maize canopy compared with the intercropped maize canopy. The intercropped soybean intercepted slightly more light than sole soybean 21 d after emergence, because the intercropped maize had no occlusion on the soybean at this time. The difference in light interception between the intercropped and sole soybean was caused by the different arrangement of canopy architecture (Liu et al., 2017). With the increasing gap between maize and soybean height, the occlusion of maize on soybean became stronger, which resulted in less light interception by the intercropped soybean compared with the sole soybean (Fig. 6).
Fig. 6.
Comparison of the daily light interception per unit ground area for maize and soybean between intercropping and sole treatments.
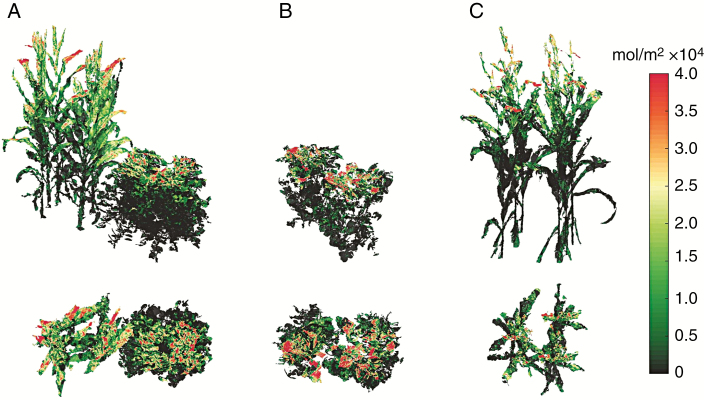
The light interception within the different canopies was visualized by colouring the reconstructed canopies according to the value of light interception per unit leaf area (Fig. 7). More red colours at the top of the canopy indicate higher light interception, whereas darker green colours indicate lower light interception. At 62 d after emergence, the radiation is mainly concentrated at the canopy surface for intercropped soybean and sole soybean (Fig. 7A, B). The radiation of the intercropped maize plant is concentrated at the higher part over the soybean plant (Fig. 7A). However, the radiation of sole maize is concentrated within a narrower range in the vertical direction than the intercropped maize and is mainly distributed on the top of canopy (Fig. 7C).
Fig. 7.
The visualization of light distribution of intercrops (A), sole soybean (B) and sole maize (C) from side and top views at 62 d after emergence. The light interception was visualized by colouring the reconstructed canopies according to the values of light interception per unit leaf area.
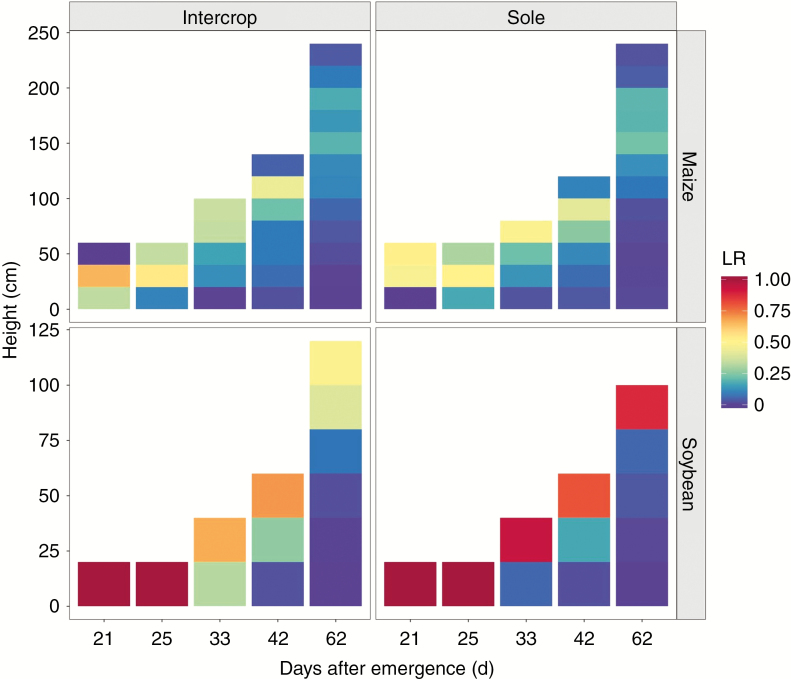
The light distribution was more uniform for intercropped maize and more concentrated for sole maize, mainly due to the serious occlusion among neighbouring maize in the sole treatment (Fig. 8). In the middle growth stages (33 and 42 d after emergence), nearly 85 % of the radiation was intercepted by 80 cm from canopy surface for both sole maize and intercropped maize. At the late growth stage (62 d after emergence), 85 % of the radiation was intercepted by 140 cm from the canopy surface for intercropped maize and by 120 cm for sole maize. The light distribution was similar for intercropped and sole soybean before 42 d after emergence. At the later growth stages (42 and 62 d after emergence), 85 % of the radiation was intercepted by 40 cm from the canopy surface.
Fig. 8.
The light distribution of maize and soybean for all treatments at 21, 25, 33, 42 and 62 d after emergence, LR represents the ratio of daily light interception at each horizontal stratum.
Effects of different planted row orientations on light interception
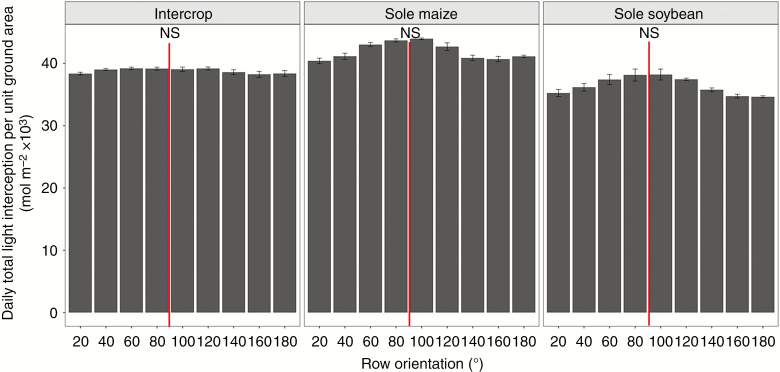
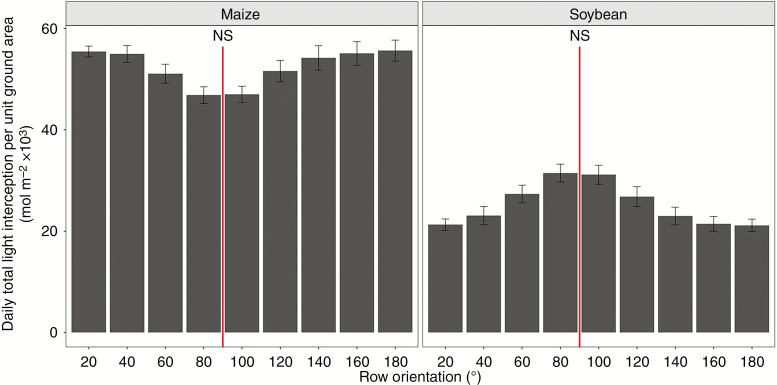
There was little difference in daily light interception per unit ground area among the various row orientations for intercropping, with an increase of approx. 2.5 % for near south–north orientations (80–100°) compared with the other orientations (Fig. 9). For sole cropping systems, the light interception was approx. 10 % higher for near south–north orientations than the other orientations. In the intercrop system, there were clear differences in light interception for the intercropped maize and soybean among the various row orientations (Fig. 10). For intercropped maize, the near east–west (20–40°) and near west–east (140–180°) orientations showed approx. 19 % higher daily light interception than the near south–north orientations (60–120°). For the intercropped soybean, the opposite trend was observed. Daily light interception was approx. 49 % higher for the near south–north orientations (80–100°) than for the near east–west (20–40°) and near west–east (160–180°) orientations.
Fig. 9.
The total daily light interception per unit of ground area of different row orientations in different cropping systems at 62 d after emergence. The red line represents south–north row orientation.
Fig. 10.
The total daily light interception per unit of ground area for different row orientations in intercropping maize and soybean at 62 d after emergence. The red line represents south–north row orientation.
DISCUSSION
Efficient acquisition of canopy 3-D architecture in the field based on multi-view images
In this study, we obtained canopy point clouds with high accuracy for crops grown in the field. At the early growth stages, it required approx. 15 min to capture 80–120 multi-view images for each treatment and approx. 3.5 h to reconstruct the 3-D architecture of the targeted canopy. To guarantee the accuracy of the canopy architecture under serious occlusion at 62 d after emergence, it required approx. 30 min to capture 160–200 multi-view images for each treatment and approx. 5 h to reconstruct the canopy architecture. Ten seconds were required for each radiation simulation of each canopy. Therefore, there was still a substantial advantage compared with that of manual measurements (Lu et al., 2014; Pound et al., 2014). We were able to optimize the photography modes including camera parameters, shooting perspectives, space intervals and image numbers in our study to balance the reconstruction efficiency and accuracy. We were also able to spontaneously transform a green-sensitive camera to enhance the contrast between vegetation and background pixels to improve the reconstruction results (Duan et al., 2016).
It was relatively easy to extract canopy information on crown area, LAI, plant height, etc. Information on individual organs such as leaf length, maximum leaf width, angle and ear length cannot be fully extracted automatically (Rose et al., 2015; Hui et al., 2018). At present, precise automatic segmentation of the individual plant from the population is the bottleneck due to the severe occlusion between plants in the field environment. Good results have been obtained at low plant densities (Jin et al., 2018) and in plants with open and flat leaves (Paproki et al., 2012). Further algorithm optimization is still needed, particularly for relatively high densities with severe occlusions. There is still an urgent need to construct an automatic image acquisition platform to achieve the task of simultaneous multi-view photography (Rahaman et al., 2015; Duan et al., 2016). Based on such high-throughput image data sets, the need for phenotypic traits required for breeding and cultivation will be larger. Linking these phenotypic traits with the genetic background to predict plant yield under different climatic environments can ultimately be achieved (Pieruschka and Poorter, 2012).
High-throughput acquisition of canopy architecture and simulation of light distribution in the field
Compared with FSPM (Ma et al., 2011; Sarlikioti et al., 2011; Song et al., 2013; Nguyen et al., 2015), accurate 3-D architecture of the crop canopy was reconstructed, which can avoid any changes among correlated architectural traits derived from measurements (Perez et al., 2019). Although we can acquire canopy architecture with high accuracy, the range of measurement is still limited (Duan et al., 2016). More efficient methods are needed to acquire canopy architecture at a larger scale. Unmanned aerial vehicles (UAVs) with different sensors are widely used in high-throughput field phenotyping to obtain relatively accurate phenotypic traits such as seedling number, ground coverage and plant height (Chapman et al., 2014; Holman et al., 2016; Duan et al., 2017; Hu et al., 2018). The use of UAVs mounted with LiDAR will be needed to acquire relatively complete canopy 3-D architecture for sole cropping patterns (Tao et al., 2015). Due to the difference in the spatial arrangement of tall (maize) and dwarf (soybean) plants, high-throughput 3-D architecture and automatic segmentation of individual organs can be obtained in intercropping at the early growth stages.
Leaf area and light distribution in the canopy direction play an important role in plant physiological and biochemical regulation. The light distribution in the vertical direction is a measurement of canopy light penetration, and it is a reference index for breeders to select better varieties (Chen et al., 2019). Under stress conditions, more uniform leaf area and light distribution can regulate stomatal movement and conserve water in plants (Chen et al., 2019). In this study, we evaluated the light distribution of maize and soybean for all treatments at different growth stages. At the silking stage in maize (62 d after emergence), a 140 cm depth (i.e. 50 % of plant height) for intercropped maize and a 120 cm depth (i.e. 42 % of plant height) for sole maize from the canopy top intercepted approx. 85 % of the radiation. The deeper penetration of light within the intercropped maize canopy may enhance photosynthetic capacity compared with sole maize (Migliavacca et al., 2017). This reference value can provide a basis for large-scale evaluation of 3-D canopy light interception by UAVs. Even if the complete 3-D architecture of the lower part of the plant cannot be obtained by UAVs, it can still be used to estimate the daily light interception by the constructed upper canopy layers.
Evaluation of light interception in different row orientations
In our virtual row orientation experiments, we evaluated the light interception simply by relying on our actual 3-D canopy architecture. In our 2 year experiment, we conducted east–west and south–north orientation experiments for all treatments. The phenotypic traits showed no significant difference in the various orientations (Supplementary data Fig. S1). Therefore, the reliability of our virtual experiments can be guaranteed.
In North-east China, various planting patterns are applied for maize with different row orientations and row spacing. A recent study has shown the effects of different row orientations on crop growth (Tian et al., 2019). In our current study, an accurate canopy model was established and integrated with a 3-D radiation model to quantify the light interception with different row orientations at intervals of 20°. Our simulations showed that there was no significant difference in canopy light interception among all treatments with different row orientations (Fig. 8). This result is consistent with that of Tsubo (2001). However, clear differences in daily light interception were found for maize and soybean individually within the intercropped system among different row orientations (Fig. 9). Therefore, we can improve the radiation use efficiency of maize plants by adjusting row orientation and selecting shade-loving varieties of soybean in the future.
In addition, appropriate row orientations can increase the crop shading effect for weeds, thus inhibiting their growth (Alcorta et al., 2011; Borger et al., 2016). The effectiveness of the planting orientation in suppressing weeds depends on the latitude and crop/weed species within the agronomic system. Borger (2016) found that barley and wheat planted in an east–west row orientation could effectively reduce the light interception and seed production of Lolium rigidum. Alcorta (2011) found that less light penetrated to the weed canopy zone for rows oriented east–west vs. rows oriented south–north in vineyards. The leaf, stem and root dry weight of horseweed planted in east–west rows was reduced by 30 % compared with those of horseweed planted in a south–north row orientation. We can quantify the shading effect of crops on the weed canopy zone and explain the shading inhibition of weed growth with the method proposed herein. This will enable us to better understand the competition for light in a field environment and to alter the row orientation of crops to suppress weeds in an environmentally friendly way.
SUPPLEMENTARY DATA
Supplementary data are available online at https://academic.oup.com/aob and consist of Figure S1: comparison of maize leaf phenotypic traits between east–west and south–north orientation experiments for sole maize and intercropped maize.
Acknowledgements
The authors (B.Z., F.L., Z.X., Y.G., B.L., and Y.M.) certify that they have NO affiliations with or involvement in any organization or entity with any financial interest (such as educational grants; membership, employment, consultancies, stock ownership, or other equity interest; and expert testimony or patent-licensing arrangements), or non-financial interest (such as personal or professional relationships, affiliations, knowledge or beliefs) in the subject matter or materials discussed in this manuscript.
FUNDING
We acknowledge the financial support of the National Key Research and Development Programme of China (2016YFD0300202; 31000671), and the Science and Technology projects from Yunnan (2017YN07) and Inner Mongolia.
LITERATURE CITED
- Agrawal S, Verma NK, Tamrakar P, Sircar P. 2011. Content based color image classification using SVM. In: Eighth International Conference on Information Technology: New Generations. Piscataway, NJ: IEEE, 1090–1094. [Google Scholar]
- Alcorta M, Fidelibus MW, Steenwerth KL, Shrestha A. 2011. Effect of vineyard row orientation on growth and phenology of glyphosate-resistant and glyphosate-susceptible horseweed (Conyza canadensis). Weed Science 59: 55–60. [Google Scholar]
- Arya S, Mount D, Netanyahu N, Silverman R, Wu A. 1998. An optimal algorithm for approximate nearest neighbor searching fixed dimensions. Journal of the ACM 45: 891–923. [Google Scholar]
- Bietresato M, Carabin G, Vidoni R, Gasparetto A, Mazzetto F. 2016. Evaluation of a LiDAR-based 3D-stereoscopic vision system for crop-monitoring applications. Computers & Electronics in Agriculture 124: 1–13. [Google Scholar]
- Bongiovanni R, Lowenberg-Deboer J. 2004. Precision agriculture and sustainability. Precision Agriculture 5: 359–387. [Google Scholar]
- Borger CPD, Hashem A, Powles SB. 2016. Manipulating crop row orientation and crop density to suppress Lolium rigidum. Weed Research 56: 22–30. [Google Scholar]
- Brooker RW, Bennett AE, Cong WF, et al. 2015. Improving intercropping: a synthesis of research in agronomy, plant physiology and ecology. New Phytologist 206: 107–117. [DOI] [PubMed] [Google Scholar]
- Burgess AJ, Retkute R, Pound MP, Mayes S, Murchie EH. 2017. Image-based 3D canopy reconstruction to determine potential productivity in complex multi-species crop systems. Annals of Botany 119: 517–532. [DOI] [PMC free article] [PubMed] [Google Scholar]
- Cardinale BJ, Duffy JE, Gonzalez A, et al. 2012. Biodiversity loss and its impact on humanity. Nature 486: 59–67. [DOI] [PubMed] [Google Scholar]
- Chambelland JC, Dassot M, Adam B, et al. 2008. A double-digitising method for building 3D virtual trees with non-planar leaves: application to the morphology and light-capture properties of young beech trees (Fagus sylvatica). Functional Plant Biology 35: 1059–1069. [DOI] [PubMed] [Google Scholar]
- Chapman S, Merz T, Chan A, et al. 2014. Pheno-Copter: a low-altitude, autonomous remote-sensing robotic helicopter for high-throughput field-based phenotyping. Agronomy 4: 279–301. [Google Scholar]
- Chen TW, Nguyen TM, Kahlen K, Stützel H. 2014. Quantification of the effects of architectural traits on dry mass production and light interception of tomato canopy under different temperature regimes using a dynamic functional–structural plant model. Journal of Experimental Botany 65: 6399–6410. [DOI] [PMC free article] [PubMed] [Google Scholar]
- Chen TW, Cabrera-Bosquet L, Alvarez Prado S, et al. 2019. Genetic and environmental dissection of biomass accumulation in multi-genotype maize canopies. Journal of Experimental Botany 70: 2523–2534. [DOI] [PMC free article] [PubMed] [Google Scholar]
- Cobb JN, Declerck G, Greenberg A, Clark R, McCouch S. 2013. Next-generation phenotyping: requirements and strategies for enhancing our understanding of genotype–phenotype relationships and its relevance to crop improvement. Theoretical and Applied Genetics 126: 867–887. [DOI] [PMC free article] [PubMed] [Google Scholar]
- Costa C, Schurr U, Loreto F, Menesatti P, Carpentier S. 2019. Plant phenotyping research trends, a science mapping approach. Frontiers in Plant Science 9: 1933. doi: 10.3389/fpls.2018.01933. [DOI] [PMC free article] [PubMed] [Google Scholar]
- Douma JC, de Vries J, Poelman EH, Dicke M, Anten NPR, Evers JB. 2019. Ecological significance of light quality in optimizing plant defence. Plant, Cell & Environment 42: 1065–1077. [DOI] [PMC free article] [PubMed] [Google Scholar]
- Duan T, Chapman SC, Holland E, Rebetzke GJ, Guo Y, Zheng B. 2016. Dynamic quantification of canopy structure to characterize early plant vigour in wheat genotypes. Journal of Experimental Botany 67: 4523–4534. [DOI] [PMC free article] [PubMed] [Google Scholar]
- Duan T, Zheng B, Wei G, Ninomiya S, Yan G, Chapman SC. 2017. Comparison of ground cover estimates from experiment plots in cotton, sorghum and sugarcane based on images and ortho-mosaics captured by UAV. Functional Plant Biology 44: 169–184. [DOI] [PubMed] [Google Scholar]
- Furukawa Y, Ponce J. 2010. Accurate, dense, and robust multiview stereopsis. IEEE Transactions on Pattern Analysis and Machine Intelligence 32: 1362–1376. [DOI] [PubMed] [Google Scholar]
- Gibbs JA, Pound M, French AP, Wells DM, Pridmore T. 2016. Approaches to three-dimensional reconstruction of plant shoot topology and geometry. Functional Plant Biology 44: 62–75. [DOI] [PubMed] [Google Scholar]
- Holman F, Riche A, Michalski A, Castle M, Wooster M, Hawkesford M. 2016. High throughput field phenotyping of wheat plant height and growth rate in field plot trials using UAV based remote sensing. Remote Sensing 8: 1031. [Google Scholar]
- Houle D, Govindaraju DR, Omholt S. 2010. Phenomics: the next challenge. Nature Reviews. Genetics 11: 855–866. [DOI] [PubMed] [Google Scholar]
- Hu P, Chapman SC, Wang X, et al. 2018. Estimation of plant height using a high throughput phenotyping platform based on unmanned aerial vehicle and self-calibration: example for sorghum breeding. European Journal of Agronomy 95: 24–32. [Google Scholar]
- Hui F, Zhu J, Hu P, et al. 2018. Image-based dynamic quantification and high-accuracy 3D evaluation of canopy structure of plant populations. Annals of Botany 121: 1079–1088. [DOI] [PMC free article] [PubMed] [Google Scholar]
- Jiang Y, Li C, H. Paterson A. 2016. High throughput phenotyping of cotton plant height using depth images under field conditions. Computers and Electronics in Agriculture 130: 57–68. [Google Scholar]
- Jin S, Su Y, Gao S, et al. 2018. Deep learning: individual maize segmentation from terrestrial lidar data using faster R-CNN and regional growth algorithms. Frontiers in Plant Science 9: 866. doi: 10.3389/fpls.2018.00866. [DOI] [PMC free article] [PubMed] [Google Scholar]
- Karanja S, M. Kibe A N. Karogo P, Mwangi M. 2014. Effects of intercrop population density and row orientation on growth and yields of sorghum–cowpea cropping systems in semi arid Rongai, Kenya. Journal of Agricultural Science 6: 34–43. [Google Scholar]
- Kermah M, Franke AC, Adjei-Nsiah S, Ahiabor BDK, Abaidoo RC, Giller KE. 2017. Maize–grain legume intercropping for enhanced resource use efficiency and crop productivity in the Guinea savanna of northern Ghana. Field Crops Research 213: 38–50. [DOI] [PMC free article] [PubMed] [Google Scholar]
- Letourneau Deborah K, Inge A, Beatriz Salguero R, et al. 2011. Does plant diversity benefit agroecosystems? A synthetic review. Ecological Applications 21: 9–21. [DOI] [PubMed] [Google Scholar]
- Lithourgidis AS, Dordas CA, Damalas CA, Vlachostergios DN. 2011. Annual intercrops: an alternative pathway for sustainable agriculture. Australian Journal of Crop Science 5: 396–410. [Google Scholar]
- Liu X, Tanzeelur R, Chun S, et al. 2017. Changes in light environment, morphology, growth and yield of soybean in maize–soybean intercropping systems. Field Crops Research 200: 38–46. [Google Scholar]
- Lou L, Liu Y, Sheng M, Han J, Doonan JH. 2014. A cost-effective automatic 3D reconstruction pipeline for plants using multi-view images. In: Mistry M, Leonardis A, Witkowski M, Melhuish C, eds. Advances in autonomous robotics systems. TAROS 2014. Cham: Springer, 221–230. [Google Scholar]
- Louarn G, Frak E, Zaka S, Prieto J, Lebon E. 2015. An empirical model that uses light attenuation and plant nitrogen status to predict within-canopy nitrogen distribution and upscale photosynthesis from leaf to whole canopy. AoB PLANTS 7: 116–131. [DOI] [PMC free article] [PubMed] [Google Scholar]
- Lu L, Liu Y, Sheng M, Han J, Doonan JH. 2014. A cost-effective automatic 3D reconstruction pipeline for plants using multi-view images. In: Mistry M, Leonardis A, Witkowski M, Melhuish C, eds. Advances in autonomous robotics systems. TAROS 2014. Cham: Springer, 221–230. [Google Scholar]
- Ma YT, Li BG, Zhan Z, et al. 2007. Parameter stability of the functional–structural plant model GREENLAB as affected by variation within populations, among seasons and among growth stages. Annals of Botany 99: 61–73. [DOI] [PMC free article] [PubMed] [Google Scholar]
- Ma YT, Wubs AM, Mathieu A, et al. 2011. Simulation of fruit-set and trophic competition and optimization of yield advantages in six Capsicum cultivars using functional–structural plant modelling. Annals of Botany 107: 793–803. [DOI] [PMC free article] [PubMed] [Google Scholar]
- McKinley S, Megan L. 1998. Cubic spline interpolation. College of the Redwoods 45: 1049–1060. [Google Scholar]
- Migliavacca M, Perez-Priego O, Rossini M, et al. 2017. Plant functional traits and canopy structure control the relationship between photosynthetic CO2 uptake and far-red sun-induced fluorescence in a Mediterranean grassland under different nutrient availability. New Phytologist 214: 1078–1091. [DOI] [PubMed] [Google Scholar]
- Minervini M, Scharr H, Tsaftaris S. 2015. Image analysis: the new bottleneck in plant phenotyping [Applications Corner]. IEEE Signal Processing Magazine 32: 126–131. [Google Scholar]
- Montgomery E. 1911. Correlation studies in corn. Nebraska Agricultural Experiment Station Annual Report 24: 108–159. [Google Scholar]
- Mucheru-Muna M, Pypers P, Mugendi D, et al. 2010. A staggered maize–legume intercrop arrangement robustly increases crop yields and economic returns in the highlands of central Kenya. Field Crops Research 115: 132–139. [Google Scholar]
- Mullan DJ, Reynolds MP. 2010. Quantifying genetic effects of ground cover on soil water evaporation using digital imaging. Functional Plant Biology 37: 703–712. [Google Scholar]
- Nguyen TT, Slaughter DC, Max N, Maloof JN, Sinha N. 2015. Structured light-based 3D reconstruction system for plants. Sensors (Basel, Switzerland) 15: 18587–18612. [DOI] [PMC free article] [PubMed] [Google Scholar]
- Paproki A, Sirault X, Berry S, Furbank R, Fripp J. 2012. A novel mesh processing based technique for 3D plant analysis. BMC Plant Biology 12: 63. doi: 10.1186/1471-2229-12-63. [DOI] [PMC free article] [PubMed] [Google Scholar]
- Perez R, Fournier C, Cabrera BL, et al. 2019. Changes in the vertical distribution of leaf area enhanced light interception efficiency in maize over generations of maize selection. Plant, Cell & Environment 42: 2105–2109. [DOI] [PubMed] [Google Scholar]
- Pieruschka R, Poorter H. 2012. Phenotyping plants: genes, phenes and machines. Functional Plant Biology 39: 813–820. [DOI] [PubMed] [Google Scholar]
- Pound MP, French AP, Murchie EH, Pridmore TP. 2014. Automated recovery of three-dimensional models of plant shoots from multiple color images. Plant Physiology 166: 1688–1698. [DOI] [PMC free article] [PubMed] [Google Scholar]
- Rahaman MdM, Chen D, Gillani Z, Klukas C, Chen M. 2015. Advanced phenotyping and phenotype data analysis for the study of plant growth and development. Frontiers in Plant Science 6: 619. doi: 10.3389/fpls.2015.00619. [DOI] [PMC free article] [PubMed] [Google Scholar]
- Rose JC, Paulus S, Kuhlmann H. 2015. Accuracy analysis of a multi-view stereo approach for phenotyping of tomato plants at the organ level. Sensors (Basel, Switzerland) 15: 9651–9665. [DOI] [PMC free article] [PubMed] [Google Scholar]
- Rusu RB, Cousins S. 2011. 3D is here: Point Cloud Library (PCL). In: Proceedings of the IEEE International Conference on Robotics and Automation (ICRA) 2011. Piscataway, NJ: IEEE, 1–4. [Google Scholar]
- Sarlikioti V, de Visser PH, Buck-Sorlin GH, Marcelis LF. 2011. How plant architecture affects light absorption and photosynthesis in tomato: towards an ideotype for plant architecture using a functional–structural plant model. Annals of Botany 108: 1065–1073. [DOI] [PMC free article] [PubMed] [Google Scholar]
- Song Q, Zhang G, Zhu X-G. 2013. Optimal crop canopy architecture to maximise canopy photosynthetic CO2 uptake under elevated CO2 – a theoretical study using a mechanistic model of canopy photosynthesis. Functional Plant Biology 40: 109–124. [DOI] [PubMed] [Google Scholar]
- Sun S, Li C, Paterson A. 2017. In-field high-throughput phenotyping of cotton plant height using LiDAR. Remote Sensing 9: 377. [DOI] [PMC free article] [PubMed] [Google Scholar]
- Tao S, Wu F, Guo Q, et al. 2015. Segmenting tree crowns from terrestrial and mobile LiDAR data by exploring ecological theories. ISPRS Journal of Photogrammetry & Remote Sensing 110: 66–76. [Google Scholar]
- Tian C, Han J, Li J, et al. 2019. Effects of row direction and row spacing on maize leaf senescence. PLoS One 14: e0215330. doi: 10.1371/journal.pone.0215330. [DOI] [PMC free article] [PubMed] [Google Scholar]
- Tilman D, Balzer C, Hill J, Befort BL. 2011. Global food demand and the sustainable intensification of agriculture. Proceedings of the National Academy of Sciences, USA 108: 20260–20264. [DOI] [PMC free article] [PubMed] [Google Scholar]
- Tsubo M, Walker S. 2004. Shade effects on Phaseolus vulgaris L. intercropped with Zea mays L. under well-watered conditions. Journal of Agronomy and Crop Science 190: 168–176. [Google Scholar]
- Tsubo M, Walker S, Mukhala E. 2001. Comparisons of radiation use effciency of mono-/inter-cropping systems with different row orientations. Field Crops Research 71: 17–29. [Google Scholar]
- Varshney RK, Thudi M, Pandey MK, et al. 2018. Accelerating genetic gains in legumes for the development of prosperous smallholder agriculture: integrating genomics, phenotyping, systems modelling and agronomy. Journal of Experimental Botany 69: 3293–3312. [DOI] [PubMed] [Google Scholar]
- Wang X, Yan G, Wang X, Ma YT, Li BG. 2008. Estimating photosynthetically active radiation distribution in maize canopies by a three-dimensional incident radiation model. Functional Plant Biology 35: 867–875. [DOI] [PubMed] [Google Scholar]
- Wu C. 2013. Towards linear-time incremental structure from motion. 3DV-Conference, 2013 International Conference of IEEE Computer Society 127–134 [Google Scholar]
- Wu C, Agarwal S, Curless B, Seitz SM. 2011. Multicore bundle adjustment. IEEE Computer Science Conference on Computer Vision & Pattern Recognition 3057–3064. [Google Scholar]
- Xiong X, Yu L, Yang W, et al. 2017. A high-throughput stereo-imaging system for quantifying rape leaf traits during the seedling stage. Plant Methods 13: 7. [DOI] [PMC free article] [PubMed] [Google Scholar]
- Yang F, Liao D, Wu X, et al. 2017. Effect of aboveground and belowground interactions on the intercrop yields in maize–soybean relay intercropping systems. Field Crops Research 203: 16–23. [Google Scholar]
- Zheng BY, Ma YT, Li BG, Guo Y, Deng QY. 2011. Assessment of the influence of global dimming on the photosynthetic production of rice based on three-dimensional modeling. Science China Earth Sciences 54: 290–297. [Google Scholar]
- Zhu XG, Long SP, Ort DR. 2010. Improving photosynthetic efficiency for greater yield. Annual Review of Plant Biology 61: 235–261. [DOI] [PubMed] [Google Scholar]
Associated Data
This section collects any data citations, data availability statements, or supplementary materials included in this article.


