Abstract
Background and Aims
High-throughput phenotyping is a limitation in plant genetics and breeding due to large-scale experiments in the field. Unmanned aerial vehicles (UAVs) can help to extract plant phenotypic traits rapidly and non-destructively with high efficiency. The general aim of this study is to estimate the dynamic plant height and leaf area index (LAI) by nadir and oblique photography with a UAV, and to compare the integrity of the established three-dimensional (3-D) canopy by these two methods.
Methods
Images were captured by a high-resolution digital RGB camera mounted on a UAV at five stages with nadir and oblique photography, and processed by Agisoft Metashape to generate point clouds, orthomosaic maps and digital surface models. Individual plots were segmented according to their positions in the experimental design layout. The plant height of each inbred line was calculated automatically by a reference ground method. The LAI was calculated by the 3-D voxel method. The reconstructed canopy was sliced into different layers to compare leaf area density obtained from oblique and nadir photography.
Key Results
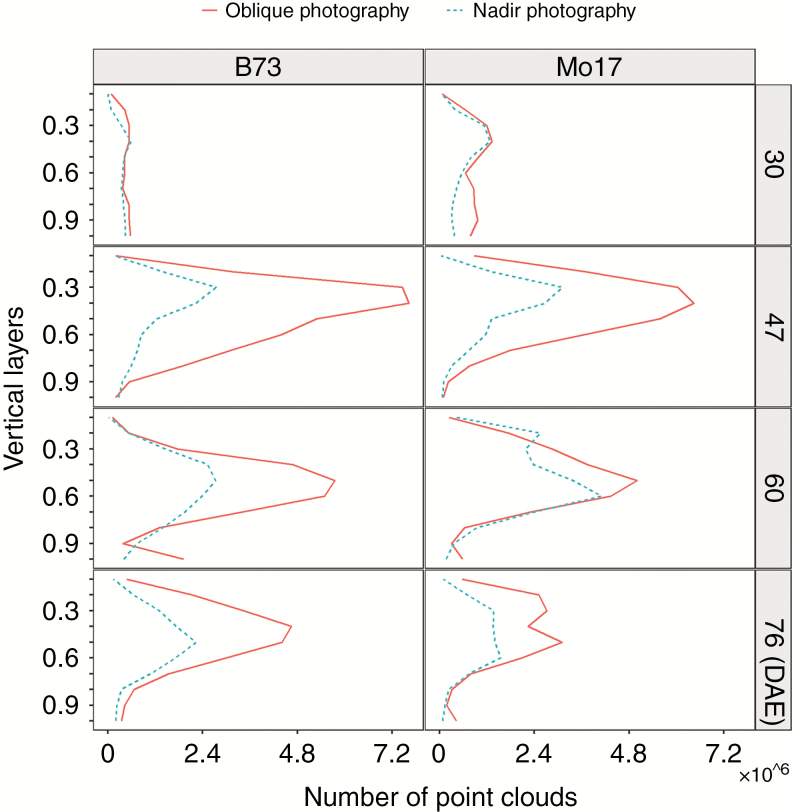
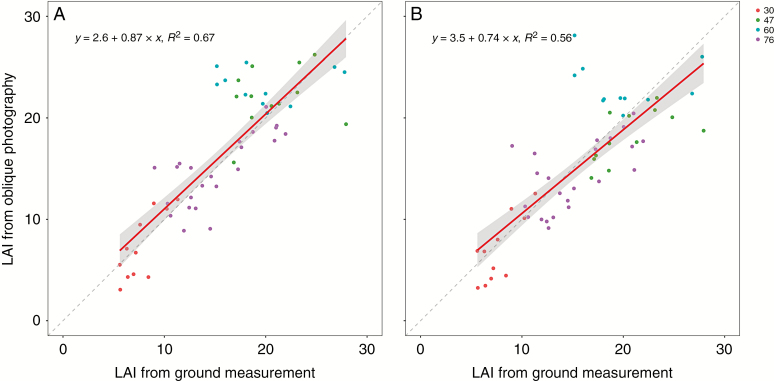
Good agreements were found for plant height between nadir photography, oblique photography and manual measurement during the whole growing season. The estimated LAI by oblique photography correlated better with measured LAI (slope = 0.87, R2 = 0.67), compared with that of nadir photography (slope = 0.74, R2 = 0.56). The total number of point clouds obtained by oblique photography was about 2.7–3.1 times than those by nadir photography. Leaf area density calculated by nadir photography was much less than that obtained by oblique photography, especially near the plant base.
Conclusions
Plant height and LAI can be extracted automatically and efficiently by both photography methods. Oblique photography can provide intensive point clouds and relatively complete canopy information at low cost. The reconstructed 3-D profile of the plant canopy can be easily recognized by oblique photography.
Keywords: UAV, oblique photography, plant height, LAI, 3-D, Zea mays L
INTRODUCTION
The world population will peak at 9.22 billion by 2050 (Ray et al., 2013). Improvement of food production in limited arable land is extremely urgent to deal with population pressure, climate change and water imbalance. Maize (Zea mays L.) is a grain crop with wide cultivation and the largest production in the world (Wang et al., 2019). Seed selection and breeding for maize varieties with high yield, stress tolerance and disease resistance is crucial to global crop genetic research (Sankaran et al., 2015; Guo et al., 2018). As an important part of breeding, high-throughput phenotyping can accelerate the breeding process effectively. Traditional manual measurement is a time-consuming and labour-intensive work with a limited sample size, and cannot meet the needs of high-throughput phenotyping research for breeding. Therefore, improving the throughput of phenotyping measurement in the field is a big challenge in plant genetics, physiology and breeding (Liebisch et al., 2015).
Advanced crop phenotyping platforms have been developed worldwide to measure crop phenotypes in the field recently such as BreedVision, Crop 3D, Field Scanalyzer and CropQuant (Busemeyer et al., 2013; Virlet et al., 2017; Zhou et al., 2017a; Guo et al., 2018; Rouphael et al., 2018). Field phenotyping platforms can integrate multiple sensors to obtain multi-source phenotypic data with high resolution and high quality, but are limited to fixed areas and need increased costs for large-scale experiments. Satellite survey can map large areas at the same time, but the method suffers from cloud cover and water vapour, especially during crop growth seasons. The coarse resolution of satellite surveys limits their application on field crops (Matese et al., 2015; Chu et al., 2017).
In recent years, unmanned aerial vehicles (UAVs) have become an important part of low-altitude remote sensing, and have received a great deal of attention in the field of agriculture (Guo et al., 2015; Jin et al., 2017; Li et al., 2019; Wang et al., 2019). They have the advantages of high temporal and spatial resolution, fast image acquisition, easy operation and portability, and relatively low cost (Chapman et al., 2014). UAVs are highly flexible with the ability to carry multiple sensors, such as digital cameras, multi-spectral cameras, hyperspectral cameras, thermal imaging cameras and LiDAR. Researchers have obtained plant height (Madec et al., 2017; Guo et al., 2018; Hu et al., 2018; Wang et al., 2019), ground cover (Duan et al., 2017), seedling number (Jin et al., 2017; Li et al., 2019), seedling distance (Gnädinger and Schmidhalter, 2017), tassel number (Wu et al., 2019; Liu et al., 2020) and leaf area index (Kalisperakis et al., 2015) measurements based on images obtained from UAVs. Currently, nadir photography is widely employed in agricultural phenotypic investigations using a UAV. The method utilizes a mounted camera with a 90° angle which takes photos along the vertical direction. Three-dimensional (3D) point clouds of the canopy surface can be obtained and used to calculate canopy height. However, fewer point clouds below the canopy surface are provided by nadir photography.
Oblique photography has recently been developed for 3-D modelling in urban areas and for forestry (Aicardi et al., 2016). The axis of the mounted camera on the UAV is deliberately kept tilted from the vertical by a specified angle. Images acquired by oblique photography could reveal more details which are masked in nadir photography. The dense point clouds produced by oblique photography show an effective improvement in the 3-D reconstruction with a better inclusion of information about the sides and bases of objects. However, few studies of oblique photography have been applied in agriculture.
Plant height is a good indicator to evaluate plant growth and grain yield (Bendig et al., 2015). The dynamics of plant height during the whole growing season could be used to assess critical genetic traits, fundamental plant physiology and environmental effects (Malambo et al., 2018). Leaf area index (LAI) is an important physiological trait and can be used to indicate the performance of a plant canopy for growth and yield (Roth et al., 2018). In addition, the vertical distribution of leaf area is important for the analysis of photosynthesis, pollen propagation and stress resistance. Quantitative analysis of vertical distribution and dynamic changes of LAI can be used for early nutrition diagnosis and breeding research (Lei et al., 2019).
Therefore, the aim of this study was to assess the potential of oblique photography in acquisition of plant height and LAI compared with traditional nadir photography. We then compared leaf area density and dynamic changes of vertical distribution of leaf area estimated by two methods.
MATERIALS AND METHODS
Field experiments and measurement on plants
Field experiments were conducted in 2018 at Lishu, Jilin, China (43°16'45''N, 124°26'10''E, altitude 196 m). The experiments were set with three replicates. There were 30 maize inbred lines with extensive genetic diversity in each replicate. The size of each plot was two rows × 5 m long with 40 plants. Row distance was 60 cm in all replicates. The maize emergence date was 9 June. Before sowing, basal chemical fertilizers were applied in all plots at a rate of 60 kg P ha–1 and 80 kg K ha–1. Management was conducted according to typical farmers’ practice.
Ten inbred lines were selected according to their sub-populations to measure their plant height and leaf area at four growth stages. The plant height here was the distance from the highest point to the base point of natural plants. Three plants in each inbred line plot were selected to measure plant height. The leaf area was measured by LI-COR (LI-3100, Lincoln, NE, USA).
UAV image acquisition
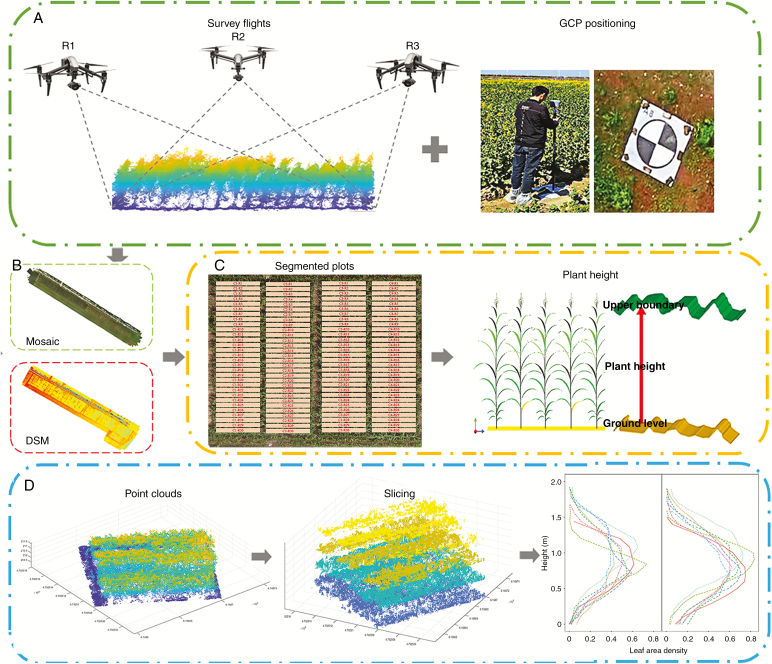
The UAV DJI Inspires 2 with a ZENMUSE X5S camera (DJI, Shenzhen, China) was used for image acquisition. The imaging sensor was a 4/3-inch CMOS with 15 mm focal length. The obtained image resolution was 5280 × 3956 pixels. Each field survey has three flight plans with a tilt of camera angles by 45°, 90° and 135°for oblique photography (Fig. 1A). There was a 5 min interval between each flight. Nadir photography has one flight with a tilt of camera angle by 90° (Fig. 1A). Mission Planner (open-source flight planning software for Pix Hawk autopilot, http://planner.ardupilot.com/) was used to determine the target aerial photography area on a satellite map and plan the aerial photography route by inputting relative flight and camera parameters. Autonomous flight plans were used to have 82 % overlap between adjacent images with flight height of 10 m. The image sets were captured at a 2 s interval with recorded GPS tags resulting in approx. 20.8 mega pixel RGB images. Six ground control points (GCPs; Fig. 1A) were permanently set up and evenly distributed in the field with three GCPs on each side. Three-dimensional positions of GCPs were recorded by RTK (CHCNAV-T8, Shanghai, China). Aerial images were collected by the UAV on 9 June, 11 July, 27 July, 11 August and 27 August, corresponding to zero, 30, 47, 60 and 76 days after emergence (DAE). The first flight was used to generate the reference ground.
Fig. 1.
Phenotyping pipeline for estimation of plant height and LAI by the UAV platform. (A) The flow of acquisition of UAV images, (B) the process to generate the point cloud, orthomosaic map and digital surface model, (C) individual plot segmentation and the method of plant height calculation and (D) flow of slicing point clouds and estimation of leaf area density at different canopy layers.
Image analysis and sampling
Oblique and nadir images were processed by the Agisoft Metashape (Agisoft, Russia) to generate 3-D point clouds, orthomosaic maps and the digital surface model (DSM). Agisoft Metashape includes the following main steps: data import, image alignment, generation of the sparse cloud with low accuracy parameter, importing GCPs and geo-referencing, optimization of image alignment (altitude errors <2 cm) and dense image matching with high-quality settings. DSM and orthomosaic maps were exported in the GeoTIFF file format and point clouds data in TXT file format by the Agisoft Metashape. A pixel in the GeoTIFF file incorporated elevation data of DSM or RGB visible bands of the orthomosaic map. The ground sample distance of DSM and the orthomosaic map was approx. 0.45 cm and 0.23 cm.
Individual plots were segmented according to their positions in the experimental design layout and assigned with a unique ID based on their geographical location (Fig. 1B). The process includes two steps. First, the four corners of the experimental area need to be visually identified from the orthomosaic map by QGIS (QGIS Development Team, 3.4.3). Next, we divided the experimental site evenly and established 90 spatial polygons. In order to exclude leaf overlap of adjacent plots and plot gaps, the trimming percentage was 10 % for each shorter side and 5 % for each longer side. Spatial polygons were used to segment DSM, orthomosaic and point cloud data. Raster and SP packages in R were used in this process (R Core Team, 2019).
Plant height and LAI estimations; LAI profiles based on two methods
The reference ground method was used to estimate plant height at plot level (Fig. 1C), which used the canopy upper boundary of different plots minus the reference ground. The value of 99 % of the DSM was used as the upper boundary and the median value of the DSM before emergence as the reference ground.
Point clouds were de-noised, down-sampled, filtered, sliced and visualized (Fig. 1D). Leaf area distributions in the vertical profiles were defined as leaf area density. First, the point cloud was sliced horizontally, divided into cubes of the same size and accumulated from the top of each cube to the bottom. Then we can obtain the distribution of cumulative point clouds at different canopy layers. The 3-D voxel method was used to calculate LAI (Jimenez-Berni et al., 2018, Lei et al., 2019). Only the points above the reference ground were included in the analysis to exclude the influence of the ground. Then point clouds were summarized into voxels with equal dimensions of 0.01–0.2 m, at intervals of 0.01 m. Statistical analysis was conducted on the point cloud after voxelization to eliminate outliers of <5 points. Finally, optimal voxel size was determined according to the comparisons between measured and calculated LAI. Tidyverse and sp packages in R were used in this process. All data processing or statistics were batch processed in parallel on a computer cluster using snow and snowfall packages in R.
| (1) |
where num(i) is the number of 3-D grids with point clouds in the ith layer and numtotal(i) is the total number of 3-D grids in the ith layer. k, a correction coefficient, was computed as 22 for best estimation of LAI (data not shown). The units of optimal voxel size are metres.
Statistical analyses
The coefficients of determination (R2), root mean square error (RMSE) and relative root mean square error (rRMSE) were used to assess the degree of coincidence between measured and calculated plant height.
| (2) |
| (3) |
| (4) |
x i and yi are the observed and calculated plant height; x is the average value of observed plant height; and n is the number of simulated or observed values.
RESULTS
There was good agreement between calculated and measured plant height during the whole growing season, with R2 = 0.90 for nadir photography(Fig. 2A) and R2 = 0.91 for oblique photography (Fig. 2B). The slope of the linear regression between plant heights from the two methods was 0.97, and the value of R2 was 0.98 (Fig. 2C).
Fig. 2.
Comparison of estimated and measured plant height during the whole growing season using nadir photography (A) and oblique photography (B). Comparison of UAV-derived plant height with the two photography methods (C).
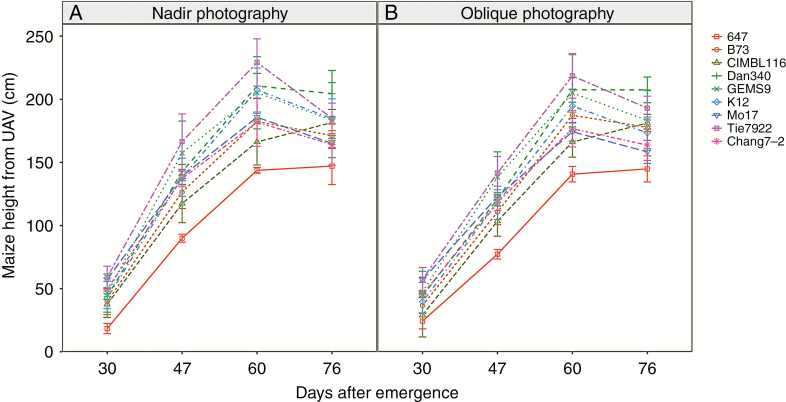
Calculated plant heights of different materials are presented in Fig. 3 at all growth stages. CIMBL116 grew continuously throughout the growth period. Plant heights for the other materials were highest at 60 DAE and then decreased. Plant height of Tie7922 was highest and 647 was lowest during the whole growing stage, except for Dan340 at 76 DAE. Although no obvious differences in calculated plant height were found between the two methods, smaller plant height was obtained from oblique photography compared with nadir photography(Fig. 3).
Fig. 3.
The curve of plant height of different materials obtained by nadir photography (A) and oblique photography (B) during the whole growing stage.
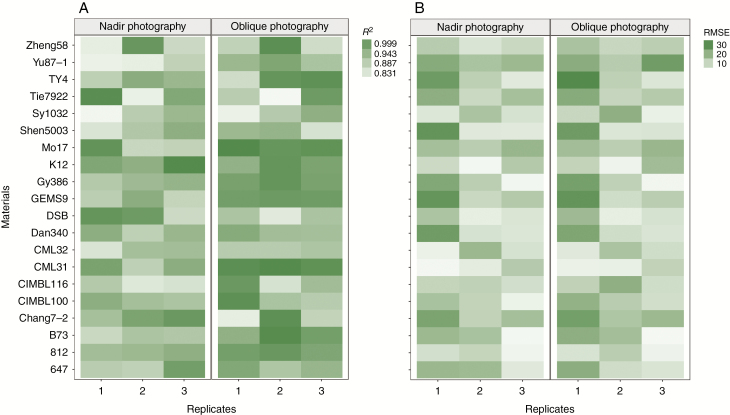
The heatmaps of R2 and RMSE are used not only to assess the estimation accuracy of different materials obtained by the two photography methods, but also to offer visual maps of this variability, produced from the comparison between manually measured and UAV-derived plant height in this study. The results showed that there was a good agreement between measured and calculated plant height with R2 >0.83 for both methods with different materials in three replicates. As seen from Fig. 4A, the R2 of plant height calculated by oblique photography was better than that by nadir photography. The bias between manually measured and UAV-derived plant height characterized by the RMSE for the two photography methods showed no obvious difference (Fig. 4B).
Fig. 4.
The heatmap of R2 (A) and RMSE (B) for visual rating of the estimation accuracy between estimated and measured plant height among different materials.
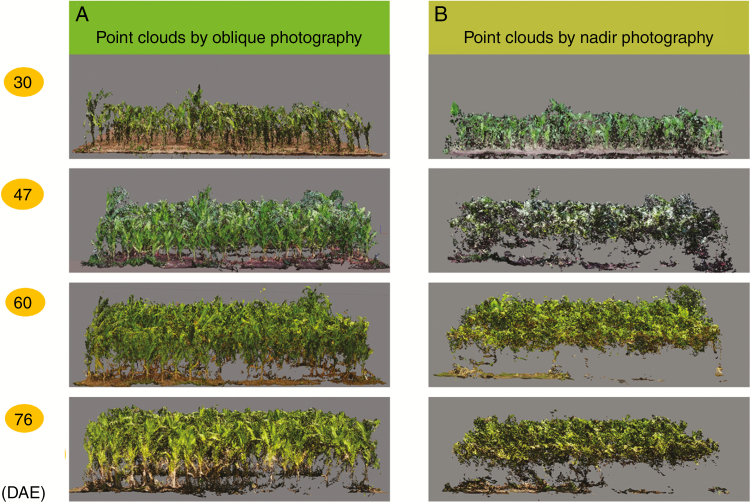
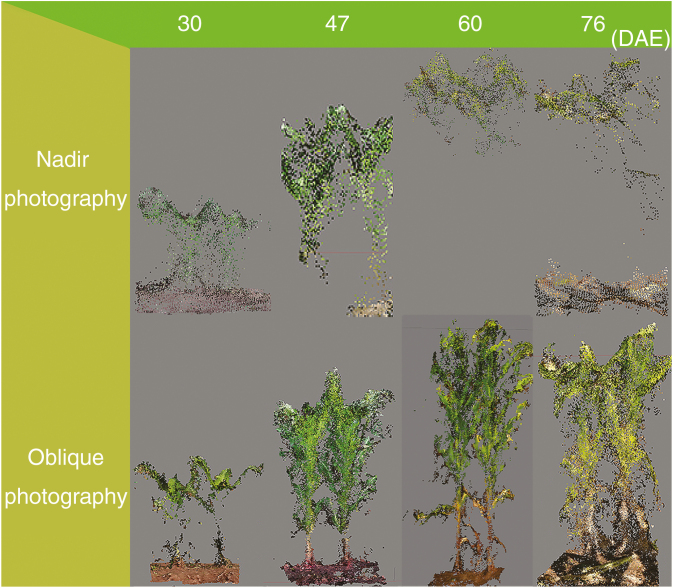
Oblique photography allows the reconstruction of vertical or inclined surfaces of the surveyed canopy. Point clouds obtained by oblique photography were more complete than those by nadir photography (Fig. 5). We can even clearly distinguish the position of each plant from side view figures (Fig. 5A).
Fig. 5.
Side view of canopy point clouds reconstructed by oblique photography (A) and nadir photography (B) at four growing stages.
In order to compare the completeness of individual plants by the two photography methods, B73 was taken as an example in Fig. 6. We can only obtain the point clouds at the top of the individual plant with nadir photography (Fig. 6, top). However, oblique photography can provide us with the point clouds of almost the complete individual plant, and the plant profile can be recognized easily (Fig. 6, bottom).
Fig. 6.
Side view of point clouds of B73 for nadir and oblique photography.
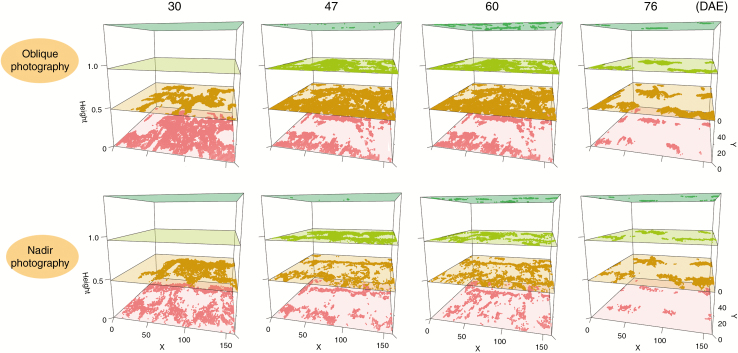
The point cloud for B73 and Mo17 was divided into ten vertical layers from the top of the canopy, the number of point clouds at each canopy layer was calculated and is presented in Fig. 7. The cumulated point cloud at different canopy layers was calculated and is presented for B73 in Fig. 8. The cumulated point cloud obtained by oblique photography was significantly larger than that by nadir photography.
Fig. 7.
Number of point clouds at each canopy height layer for B73 and Mo17 using nadir and oblique photography methods during the whole growing season.
Fig. 8.
The distribution of the cumulated point cloud at several strata during the whole growing stage of B73 by the two photography methods.
The LAI estimated by oblique photography was better than that by nadir photography (Fig. 9). The agreements between calculated and measured LAI during the whole growing season are presented in Fig. 9, with R2 = 0.67 for oblique photography and R2 = 0.56 for nadir photography.
Fig. 9.
Comparison of estimated and measured LAI during the whole growing season using oblique photography (A) and nadir photography (B).
Vertical distributions of leaf area density at different canopy layers are presented in Fig. 10 for all materials by the two photography methods. The general trend of leaf area density is consistent for the two methods at each growing stage. However, the leaf area density calculated by nadir photography is less than that by oblique photography, especially near the plant base. There were large differences in leaf area density among different materials. The peak of the leaf area density for CIMBL116 was highest compared with the other materials at 47, 60 and 76 DAE. The largest leaf area density of GEMS9 was higher than that of the other materials at 30, 47 and 60 DAE.
Fig. 10.
Vertical profiles of leaf area density during the whole stage with the two photography methods.
DISCUSSION
Advantages and disadvantages of UAVs
With the rapid development of sequencing technology, genomic research has been greatly increased. However, phenotyping is still the bottleneck in genetic research and breeding. The traditional field phenotype acquisition is destructive, labour-intensive, time-consuming and expensive, and can only obtain data at limited sampling points. A UAV mounted with several sensors can obtain phenotypic traits under field conditions non-invasively and inexpensively with merits of fast image acquisition, high temporal and spatial resolution, easy operation and portability (Zhou et al., 2017b; Roth et al., 2018; Blancon et al., 2019).
Plant height can be estimated with UAV images from the upper boundary (95th and/or 99th percentiles of DSM, Watanabe et al., 2017) and ground level in each plot. In our study, plant height estimated by a UAV correlated well with that by manual measurement, with R2 >0.90 (Fig. 2). There was also good agreement between calculated and measured LAI during the whole growing season (Fig. 9). Moreover, researchers have implemented many applications in seedling counting (Gnädinger and Schmidhalter, 2017; Jin et al., 2017; Li et al., 2019), crop growth estimation (Yeom et al., 2018; Herrmann et al., 2020) and tassel number counting (Wu et al., 2019; Liu et al., 2020) with UAV images.
Although UAV imaging is being widely adopted in precision agriculture applications, it suffers from the limited payload capacity, flight time and high winds (Kanellakis and Nikolakopoulos, 2017). UAV navigation needs a 3-D map of the environment and to detect the distance of obstacles, which means greater computation and storage consumption (Lu et al., 2018).
Oblique photography vs. nadir photography
Nadir UAV flights have been widely used in plant height and ground cover investigation (Guo et al., 2015; Jin et al., 2017; Li et al., 2019; Wang et al., 2019). The estimated accuracy of plant heights using nadir photography was high (Hu et al., 2018; Wang et al., 2019). However, nadir photography can only provide us with canopy surface information, as shown in Figs 5 and 6.
Oblique photography can provide more detailed information about plant architecture. However, few studies have been performed in agriculture. In our study, we obtained the 3-D plant architecture by oblique photography from three angles. This method can provide the canopy profiles of leaves and stems while ensuring similar estimation accuracy of plant height (Fig. 2). The LAI estimated by oblique photography was better than that by nadir photography (Fig. 9). It should be highlighted that oblique photography needs more time and storage in data acquisition, about three times more than nadir photography in our study.
The vertical distribution of leaf area had a high genetic variability and heritability, and showed significant trends with generations (Perez et al., 2019). Leaves tended to be located at lower positions in the canopy and distributed more evenly with height. The changes were essentially continuous over generations of selection (Perez et al., 2019). The total number of point clouds obtained by oblique photography is about 2.7–3.1 times more than that by nadir photography. Oblique photography can also provide relatively accurate vertical distribution of leaf area (Fig. 10) and can distinguish the plant profile clearly, compared with nadir photography (Figs 5 and 6).
Prediction of LAI using 3-D voxels
Researchers found good correlations between estimated and measured LAI by the 3-D voxel method from UAV–LiDAR (Hosoi and Omasa, 2006; Lei et al., 2019). The method of filtering the appropriate voxel size to create 3-D voxels can not only ensure the original shape of the point cloud, but can also compress the data and improve the efficiency of the algorithm. The LAI was extracted at the whole canopy level in our study. The vertical distribution of leaf area was also presented within the canopy which can be used as an indirect indicator to assist in plant breeding (Fig. 10; Perez et al., 2019).
In addition, the leaf area density calculated by nadir photography is less than that by oblique photography, particularly near the plant base. Most of the valid point cloud was located within 1.2 m depth from the canopy top (70 % of plant height) by nadir photography (Fig. 5B and Fig. 6, top), and within 1.5 m depth from the canopy top (85 % of plant height) by oblique photography (Fig. 5A and Fig. 6, bottom). More phenotypic traits, such as the 3-D convex hull of individual plants and maximum canopy width can also be calculated from 3-D point clouds (Duursma et al., 2012; Hui et al., 2018). In the near future, we will integrate these phenotypic traits to predict biomass and yield.
Conclusion
Oblique and nadir photography were used to estimate plant height and LAI for field-grown maize by UAVs. Good agreements were found for plant height between nadir and oblique photography, and manual measurement during the whole growing stage. The LAI estimated by oblique photography was better than that by nadir photography. Furthermore, more detailed 3-D plant architecture and vertical distribution of leaf area, which are the main indirect traits contributing to yield, were obtained by oblique photography compared with nadir photography. The cumulated point clouds by oblique photography were significantly larger than those by nadir photography. Leaf area density calculated by nadir photography is much lower than that by oblique photography, especially near the plant base. The image analysis technology can help to extract crop phenotypic traits during the whole growth stage automatically and efficiently with a limited number of field measurements by UAV observations. In the future, the phenotype information could be combined with genome-wide association studies to design plant growth at a genetic level.
ACKNOWLEDGEMENTS
We thank Weibo Zhang, Min Wang and Shilin Li for valuable help in image acquisition and processing. The authors declare no conflict of interest.
FUNDING
This work was supported by the National Science Foundation of China (31000671), and Science and Technology projects from Yunnan(2017YN07) and Inner Mongolia.
LITERATURE CITED
- Aicardi I, Chiabrando F, Grasso N, Lingua AM, Noardo F, Spanò A. 2016. UAV photogrammetry with oblique images: first analysis on data acquisition and processing. The International Archives of the Photogrammetry, Remote Sensing and Spatial Information Sciences XLI-B1: 835–842. [Google Scholar]
- Bendig J, Yu K, Aasen H, et al. 2015. Combining UAV-based plant height from crop surface models, visible, and near infrared vegetation indices for biomass monitoring in barley. International Journal of Applied Earth Observation and Geoinformation 39: 79–87. [Google Scholar]
- Blancon J, Dutartre D, Tixier MH, et al. 2019. A high-throughput model-assisted method for phenotyping maize green leaf area index dynamics using unmanned aerial vehicle imagery. Frontiers in Plant Science 10: 685–700. [DOI] [PMC free article] [PubMed] [Google Scholar]
- Busemeyer L, Mentrup D, Möller K, et al. 2013. BreedVision – a multi-sensor platform for non-destructive field-based phenotyping in plant breeding. Sensors 13: 2830–2847. [DOI] [PMC free article] [PubMed] [Google Scholar]
- Chapman SC, Merz T, Chan A, Jackway P, Hrabar S, Dreccer MF. 2014. Pheno-copter: a low-altitude, autonomous remote-sensing robotic helicopter for high-throughput field-based phenotyping. Remote Sensing 4: 279–301. [Google Scholar]
- Chu T, Starek MJ, Brewer MJ, Murray SC, Pruter L.S. 2017. Assessing lodging severity over an experimental maize (Zea mays L.) field using UAS images. Remote Sensing 9: 923–946. [Google Scholar]
- Duan T, Zheng B, Guo W, Ninomiya S, Guo Y, Chapman SC. 2017. Comparison of ground cover estimates from experiment plots in cotton, sorghum and sugarcane based on images and ortho-mosaics captured by UAV. Functional Plant Biology 44: 169–183. [DOI] [PubMed] [Google Scholar]
- Duursma RA, Falster DS, Valladares F, et al. 2012. Light interception efficiency explained by two simple variables: a test using a diversity of small- to medium-sized woody plants. New Phytologist 193: 397–408. [DOI] [PubMed] [Google Scholar]
- Gnädinger F, Schmidhalter U. 2017. Digital counts of maize plants by unmanned aerial vehicles (UAVs). Remote Sensing 9: 544–558. [Google Scholar]
- Guo W, Fukatsu T, Ninomiya S. 2015. Automated characterization of flowering dynamics in rice using field-acquired time-series RGB images. Plant Methods 11: 7–21. [DOI] [PMC free article] [PubMed] [Google Scholar]
- Guo Q, Wu F, Pang S, et al. 2018. Crop 3D – a LiDAR based platform for 3D high-throughput crop phenotyping. Science China. Life Sciences 61: 328–339. [DOI] [PubMed] [Google Scholar]
- Herrmann I, Bdolach E, Montekyo Y, Rachmilevitch S, Townsend PA, Karnieli A. 2020. Assessment of maize yield and phenology by drone-mounted superspectral camera. Precision Agriculture 21: 51–76. [Google Scholar]
- Hosoi F, Omasa K. 2006. Voxel-based 3-D modeling of individual trees for estimating leaf area density using high-resolution portable scanning lidar. IEEE Transactions on Geoscience and Remote Sensing 44: 3610–3618. [Google Scholar]
- Hu P, Chapman SC, Wang X, et al. 2018. Estimation of plant height using a high throughput phenotyping platform based on unmanned aerial vehicle and self-calibration: example for sorghum breeding. European Journal of Agronomy 95: 24–32. [Google Scholar]
- Hui F, Zhu J, Hu P, et al. 2018. Image-based dynamic quantification and high-accuracy 3D evaluation of canopy structure of plant populations. Annals of Botany 121: 1079–1088. [DOI] [PMC free article] [PubMed] [Google Scholar]
- Jimenez-Berni JA, Deery DM, Rozas-Larraondo P, et al. 2018. High throughput determination of plant height, ground cover, and above-ground biomass in wheat with LiDAR. Frontiers in Plant Science 9: 237–254. [DOI] [PMC free article] [PubMed] [Google Scholar]
- Jin X, Liu S, Baret F, Hemerlé M, Comar A. 2017. Estimates of plant density of wheat crops at emergence from very low altitude UAV imagery. Remote Sensing of Environment 198: 105–114. [Google Scholar]
- Kalisperakis I, Stentoumis CH, Grammatikopoulos L, Karantzalos K. 2015. Leaf area index estimation in vineyards from UAV hyperspectral data, 2D image mosaics and 3D models. The International Archives of the Photogrammetry, Remote Sensing and Spatial Information Sciences XL-1/W4: 299–303. [Google Scholar]
- Kanellakis C, Nikolakopoulos G. 2017. Survey on computer vision for UAVs: current developments and trends. Journal of Intelligent & Robotic Systems 87: 141–168. [Google Scholar]
- Lei L, Qiu C, Li Z, et al. 2019. Effect of leaf occlusion on leaf area index inversion of maize using UAV–LiDAR data. Remote Sensing 11: 1067–1081. [Google Scholar]
- Li B, Xu X, Han J, et al. 2019. The estimation of crop emergence in potatoes by UAV RGB imagery. Plant Methods 15: 15–27. [DOI] [PMC free article] [PubMed] [Google Scholar]
- Liebisch F, Kirchgessner N, Schneider D, Walter A, Hund A. 2015. Remote, aerial phenotyping of maize traits with a mobile multi-sensor approach. Plant Methods 11: 9–27. [DOI] [PMC free article] [PubMed] [Google Scholar]
- Liu Y, Cen C, Che Y, Ke R, Ma Y, Ma Y. 2020. Detection of maize tassels from UAV RGB imagery with faster R-CNN. Remote Sensing, 12: 338–354. [Google Scholar]
- Lu Y, Xue Z, Xia GS, Zhang L. 2018. A survey on vision-based UAV navigation. Geo-Spatial Information Science 21: 21–32. [Google Scholar]
- Madec S, Baret F, de Solan B, et al. 2017. High-throughput phenotyping of plant height: comparing unmanned aerial vehicles and ground LiDAR estimates. Frontiers in Plant Science 8: 2002–2015. [DOI] [PMC free article] [PubMed] [Google Scholar]
- Malambo L, Popescu SC, Murray SC, et al. 2018. Multitemporal field-based plant height estimation using 3D point clouds generated from small unmanned aerial systems high-resolution imagery. International Journal of Applied Earth Observation and Geoinformation 64: 31–42. [Google Scholar]
- Matese A, Toscano P, Di Gennaro SF, et al. 2015. Intercomparison of UAV, aircraft and satellite remote sensing platforms for precision viticulture. Remote Sensing 7: 2971–2990. [Google Scholar]
- Perez RPA, Fournier C, Cabrera-Bosquet L, et al. 2019. Changes in the vertical distribution of leaf area enhanced light interception efficiency in maize over generations of selection. Plant, Cell & Environment 42: 2105–2119. [DOI] [PubMed] [Google Scholar]
- Ray DK, Mueller ND, West PC, Foley JA. 2013. Yield trends are insufficient to double global crop production by 2050. PLoS ONE 8: e66428. [DOI] [PMC free article] [PubMed] [Google Scholar]
- R Core Team 2019. R: a language and environment for statistical computing. Vienna, Austria: R Foundation for Statistical Computing. [Google Scholar]
- Roth L, Aasen H, Walter A, Liebisch F. 2018. Extracting leaf area index using viewing geometry effects – a new perspective on high-resolution unmanned aerial system photography. ISPRS Journal of Photogrammetry and Remote Sensing 141: 161–175. [Google Scholar]
- Rouphael Y, Spíchal L, Panzarová K, Casa R, Colla G. 2018. High-throughput plant phenotyping for developing novel biostimulants: from lab to field or from field to lab? Frontiers in Plant Science 9: 1197–1202. [DOI] [PMC free article] [PubMed] [Google Scholar]
- Sankaran S, Khot LR, Espinoza CZ, et al. 2015. Low-altitude, high-resolution aerial imaging systems for row and field crop phenotyping: a review. European Journal of Agronomy 70: 112–123. [Google Scholar]
- Virlet N, Sabermanesh K, Sadeghi-Tehran P, Hawkesford MJ. 2017. Field Scanalyzer: an automated robotic field phenotyping platform for detailed crop monitoring. Functional Plant Biology 44: 143–153. [DOI] [PubMed] [Google Scholar]
- Wang X, Zhang R, Song W, et al. 2019. Dynamic plant height QTL revealed in maize through remote sensing phenotyping using a high-throughput unmanned aerial vehicle (UAV). Scientific Reports 9: 3458–3467. [DOI] [PMC free article] [PubMed] [Google Scholar]
- Watanabe K, Guo W, Arai K, et al. 2017. High-throughput phenotyping of sorghum plant height using an unmanned aerial vehicle and its application to genomic prediction modeling. Frontiers in Plant Science 8: 421–431. [DOI] [PMC free article] [PubMed] [Google Scholar]
- Wu J, Yang G, Yang X, Xu B, Han L, Zhu Y. 2019. Automatic counting of in situ rice seedlings from UAV images based on a deep fully convolutional neural network. Remote Sensing 11: 691–709. [Google Scholar]
- Yeom J, Jung J, Chang A, Maeda M, Landivar J. 2018. Automated open cotton boll detection for yield estimation using unmanned aircraft vehicle (UAV) data. Remote Sensing 10: 1895–1914. [Google Scholar]
- Zheng G, Moskal LM. 2012. Computational-geometry-based retrieval of effective leaf area index using terrestrial laser scanning. IEEE Transactions on Geoscience and Remote Sensing 50: 3958–3969. [Google Scholar]
- Zhou J, Reynolds D, Websdale D, et al. 2017. a CropQuant: an automated and scalable field phenotyping platform for crop monitoring and trait measurements to facilitate breeding and digital agriculture. BioRxiv 161547. [Google Scholar]
- Zhou X, Zheng HB, Xu XQ, et al. 2017. b Predicting grain yield in rice using multi-temporal vegetation indices from UAV-based multispectral and digital imagery. ISPRS Journal of Photogrammetry and Remote Sensing 130: 246–255. [Google Scholar]


