

Key Points
Question
Has blood pressure control changed among adults with hypertension over the past 20 years in the US?
Findings
In this serial cross-sectional study that included 18 262 US adults aged 18 years or older with hypertension, with data weighted to be representative of the US population, the age-adjusted estimated proportion with controlled blood pressure increased from 31.8% in 1999-2000 to 48.5% in 2007-2008, remained stable through 2013-2014 (53.8%), and then declined to 43.7% in 2017-2018.
Meaning
The prevalence of controlled blood pressure in the US may have decreased from 2013-2014 to 2017-2018.
Abstract
Importance
Controlling blood pressure (BP) reduces the risk for cardiovascular disease.
Objective
To determine whether BP control among US adults with hypertension changed from 1999-2000 through 2017-2018.
Design, Setting, and Participants
Serial cross-sectional analysis of National Health and Nutrition Examination Survey data, weighted to be representative of US adults, between 1999-2000 and 2017-2018 (10 cycles), including 18 262 US adults aged 18 years or older with hypertension defined as systolic BP level of 140 mm Hg or higher, diastolic BP level of 90 mm Hg or higher, or use of antihypertensive medication. The date of final data collection was 2018.
Exposures
Calendar year.
Main Outcomes and Measures
Mean BP was computed using 3 measurements. The primary outcome of BP control was defined as systolic BP level lower than 140 mm Hg and diastolic BP level lower than 90 mm Hg.
Results
Among the 51 761 participants included in this analysis, the mean (SD) age was 48 (19) years and 25 939 (50.1%) were women; 43.2% were non-Hispanic White adults; 21.6%, non-Hispanic Black adults; 5.3%, non-Hispanic Asian adults; and 26.1%, Hispanic adults. Among the 18 262 adults with hypertension, the age-adjusted estimated proportion with controlled BP increased from 31.8% (95% CI, 26.9%-36.7%) in 1999-2000 to 48.5% (95% CI, 45.5%-51.5%) in 2007-2008 (P < .001 for trend), remained stable and was 53.8% (95% CI, 48.7%-59.0%) in 2013-2014 (P = .14 for trend), and then declined to 43.7% (95% CI, 40.2%-47.2%) in 2017-2018 (P = .003 for trend). Compared with adults who were aged 18 years to 44 years, it was estimated that controlled BP was more likely among those aged 45 years to 64 years (49.7% vs 36.7%; multivariable-adjusted prevalence ratio, 1.18 [95% CI, 1.02-1.37]) and less likely among those aged 75 years or older (37.3% vs 36.7%; multivariable-adjusted prevalence ratio, 0.81 [95% CI, 0.65-0.97]). It was estimated that controlled BP was less likely among non-Hispanic Black adults vs non-Hispanic White adults (41.5% vs 48.2%, respectively; multivariable-adjusted prevalence ratio, 0.88; 95% CI, 0.81-0.96). Controlled BP was more likely among those with private insurance (48.2%), Medicare (53.4%), or government health insurance other than Medicare or Medicaid (43.2%) vs among those without health insurance (24.2%) (multivariable-adjusted prevalence ratio, 1.40 [95% CI, 1.08-1.80], 1.47 [95% CI, 1.15-1.89], and 1.36 [95% CI, 1.04-1.76], respectively). Controlled BP was more likely among those with vs those without a usual health care facility (48.4% vs 26.5%, respectively; multivariable-adjusted prevalence ratio, 1.48 [95% CI, 1.13-1.94]) and among those who had vs those who had not had a health care visit in the past year (49.1% vs 8.0%; multivariable-adjusted prevalence ratio, 5.23 [95% CI, 2.88-9.49]).
Conclusions and Relevance
In a series of cross-sectional surveys weighted to be representative of the adult US population, the prevalence of controlled BP increased between 1999-2000 and 2007-2008, did not significantly change from 2007-2008 through 2013-2014, and then decreased after 2013-2014.
This study uses US National Health and Nutrition Examination Survey data to characterize changes in blood pressure control among adults with hypertension between 1999-2000 and 2017-2018 overall and by age, race, insurance type, and health care access.
Introduction
Hypertension is a major risk factor for cardiovascular disease and more cardiovascular disease events in the US have been attributed to hypertension than any other modifiable risk factor.1,2,3 Antihypertensive medication use and controlling blood pressure (BP) levels reduce the risk for cardiovascular disease and all-cause mortality among adults with hypertension.4,5 Previous studies have reported that the proportion of US adults with hypertension who were aware they had it and were taking antihypertensive medication increased between 1988-1994 and 2009-2010.6,7 The proportion of US adults with controlled BP (defined as systolic BP [SBP] <140 mm Hg and diastolic BP [DBP] <90 mm Hg) also increased during this period. However, the National Center for Health Statistics reported that the proportion of US adults with hypertension who had controlled BP did not increase between 2009-2010 and 2015-2016 and may have decreased between 2013-2014 and 2015-2016.8 In addition, racial/ethnic differences in BP control have been reported among US adults, with a lower proportion of non-Hispanic Black adults having controlled BP compared with non-Hispanic White adults.9,10
The purpose of the current analysis was to determine whether the increase in BP control that occurred among US adults from 1999-2000 through 2009-2010 continued through 2017-2018. A secondary objective was to identify subgroups of individuals whose BP management could be improved. Therefore, demographic, socioeconomic, and health care–related factors associated with BP control among US adults in 2015-2018 were determined. Changes in hypertension awareness and use of antihypertensive medication among US adults from 1999-2000 through 2017-2018 were examined as secondary outcomes. To accomplish these goals, data from 10 cycles of the US National Health and Nutrition Examination Survey (NHANES) were analyzed.
Methods
NHANES was designed to assess the health and nutritional status of the US population and is conducted by the National Center for Health Statistics within the US Centers for Disease Control and Prevention.11 Since 1999-2000, the survey has been conducted in 2-year cycles. For the current analysis, 10 cycles conducted from 1999-2000 through 2017-2018 were used. Each cycle is independent with different participants recruited and with protocols approved by the institutional review board of the National Center for Health Statistics, Centers for Disease Control and Prevention. Written informed consent was obtained from each participant. The institutional review board of the University of Alabama at Birmingham considered the analysis of anonymous data to be exempt research.
Data Collection
Data were collected during an in-home interview and a study visit conducted at a mobile examination center. Of relevance to the current analysis, age, sex, race/ethnicity, education, household income, type of health insurance, and health care use were assessed using standardized questionnaires. Race/ethnicity was included in the current analysis because BP control has been reported to be lower for non-Hispanic Black adults compared with non-Hispanic White adults.9,10 Race/ethnicity was self-reported by study participants using questions with fixed category responses. Health care use included questions about having a usual facility to receive health care and whether the participant had a health care visit in the previous year.
Measurement of BP and Antihypertensive Medication Use
An identical protocol was used to measure SBP and DBP levels between 1999 and 2018. Blood pressure levels were measured by trained clinicians using a mercury sphygmomanometer and an appropriately sized BP cuff. Readings were obtained after 5 minutes of seated rest. Three BP measurements were obtained at 30-second intervals. The mean of all available measurements was used to define the SBP and DBP levels. Quality control included quarterly recertification of clinicians with retraining if needed and annual retraining of all clinicians. Hypertension was defined as SBP level of 140 mm Hg or higher, DBP level of 90 mm Hg or higher, or self-reported use of antihypertensive medication.12
Outcomes
The primary outcome of BP control was defined as SBP level lower than 140 mm Hg and DBP level lower than 90 mm Hg. The secondary outcomes were hypertension awareness and use of antihypertensive medication. Hypertension awareness was defined by an affirmative response to the question: “Have you ever been told by a doctor or other health care professional that you had hypertension, also called high BP?” Among participants who were aware they had hypertension, those who answered yes to the question “Are you now taking prescribed medication for high BP?” were categorized as taking antihypertensive medication.
Statistical Analysis
The age-adjusted prevalence of hypertension and the demographic, socioeconomic, and health care–related characteristics of adults with hypertension were calculated separately using data from each of the ten 2-year cycles from 1999-2000 through 2017-2018. For each 2-year cycle, the age-adjusted mean SBP and DBP levels and the age-adjusted distribution of BP among adults with hypertension were calculated (SBP <120 mm Hg and DBP of 80 mm Hg; SBP of 120-129 mm Hg and DBP <80 mm Hg; SBP of 130-139 mm Hg and DBP of 80-89 mm Hg; SBP of 140-159 mm Hg and DBP of 90-99 mm Hg; and SBP ≥160 mm Hg and DBP of 100 mm Hg).
The age-adjusted proportion of adults with controlled BP was calculated for all adults with hypertension and for adults with hypertension who were taking antihypertensive medication. These proportions were estimated for the overall population and within a priori–selected categories of age group (18-44 years, 45-64 years, 65-74 years, and ≥75 years), sex, race/ethnicity, education, household income, type of health insurance (none, private, Medicare, Medicaid, and other government health insurance), and health care use (had a usual care facility and a health care visit in the past year). Age adjustment was performed using direct standardization with the standard being all adults with hypertension across the entire period (1999-2018); the age categories used for standardization were 18 to 44 years (15.5%), 45 to 64 years (45.4%), 65 to 74 years (21.5%), and 75 years or older (17.7%).
Joinpoint statistical software (Joinpoint Regression Program version 4.8.0.1 [April 2020], Statistical Methodology and Applications Branch, Surveillance Research Program, National Cancer Institute) was used to identify changes in trends for the age-adjusted estimated proportion of the population with controlled BP among all adults with hypertension and separately among those taking antihypertensive medication.13 Logistic regression was used to assess the statistical significance of trends.
Using data pooled from the 2015-2016 and 2017-2018 cycles, factors associated with BP control were determined among all adults with hypertension and separately among adults with hypertension taking antihypertensive medication. The 2015-2016 and 2017-2018 data were pooled to provide more stable estimates. Poisson regression with robust variance estimates was used to estimate the prevalence ratios associated with a priori–selected variables of age group, sex, race/ethnicity, education, household income, type of health insurance, having a usual facility to receive health care, and having a health care visit in past year. Prevalence ratios were estimated using models that included age group, sex, and race/ethnicity and each other variable one at time, and using models that included all of the variables simultaneously.
Missing data were multiply imputed using a multilevel approach designed for survey data.14,15 A Gibbs sampling procedure was used to generate 10 imputed data sets after a burn-in of 500 iterations and 100 updates to ensure stochastic independence between imputed data sets. Factors associated with BP control also were assessed in regression models using a complete case approach.
In a sensitivity analysis, the age-adjusted proportion of adults with hypertension and with controlled BP was calculated using thresholds in the 2017 American College of Cardiology/American Heart Association (ACC/AHA) BP guideline to define hypertension and BP control.16 Hypertension was defined as SBP level of 130 mm Hg or higher, DBP level of 80 mm Hg or higher, or antihypertensive medication use. Blood pressure control was defined as SBP level lower than 130 mm Hg and DBP level lower than 80 mm Hg, except for low-risk adults aged 65 years or older for whom BP control was defined as SBP level lower than 130 mm Hg.10
For the secondary outcomes, the age-adjusted proportion of adults with hypertension that was aware of their condition and that was taking antihypertensive medication among those who were aware was calculated for each 2-year cycle. Trends for the age-adjusted estimated proportion of adults with hypertension awareness and who were taking antihypertensive medication were determined using Joinpoint software and logistic regression as described above for the primary outcome. Factors associated with hypertension awareness and antihypertensive medication use were determined using Poisson regression models with robust variance estimates as described above.
Sampling weights, estimated as the inverse probability of being selected for the survey, were used in all calculations to obtain US nationally representative estimates. The data analyses were conducted using Stata version 14 (StataCorp) and R version 3.6.3 (R Foundation for Statistical Computing). Statistical significance was defined by a 2-sided P value <.05. Because of the potential for type I error due to multiple comparisons, the findings for the analyses of the secondary end points should be interpreted as exploratory.
Results
The analyses were restricted to adults aged 18 years or older who completed a study interview and examination (n = 56 367). Participants who were pregnant (n = 1588) and those who did not have at least 1 SBP and DBP measurement (n = 2772) or were missing information on antihypertensive medication use (n = 246) were excluded. After these exclusions, a total of 51 761 participants, including 18 262 with hypertension, were included in the analysis (eFigure 1 in the Supplement). The response rate across cycles declined from 76% in 1999-2000 to 49% in 2017-2018.
Of the 51 761 participants included in this analysis, the mean (SD) age was 48 years (19 years) and 25 939 (50.1%) were women; 43.2% were non-Hispanic White adults; 21.6%, non-Hispanic Black adults; 5.3%, non-Hispanic Asian adults; and 26.1%, Hispanic adults. The estimated age-adjusted prevalence of hypertension (weighted to the US population) was 30.0% in 1999-2000 and 32.0% in 2017-2018 (eFigure 2 in the Supplement). Characteristics of adults with hypertension from 1999-2000 through 2017-2018 appear in Table 1. No participants were missing data on age, race/ethnicity, or sex. There were missing data for household income (9.6% of participants), education (1.8%), type of health insurance (1.2%), having a usual facility to receive health care (1.2%), and having a health care visit in the past year (0.1%). The age-adjusted estimated mean SBP level was 144 mm Hg and the mean DBP level was 77 mm Hg in 1999-2000 and 139 mm Hg and 77 mm Hg, respectively, in 2017-2018 (Table 2).
Table 1. Characteristics of Adults With Hypertension From 1999-2000 to 2017-2018.
| Characteristic | Adults with hypertensiona | |||||||||
|---|---|---|---|---|---|---|---|---|---|---|
| 1999-2000 | 2001-2002 | 2003-2004 | 2005-2006 | 2007-2008 | 2009-2010 | 2011-2012 | 2013-2014 | 2015-2016 | 2017-2018 | |
| No. of adults | 1518 | 1605 | 1623 | 1495 | 2090 | 2099 | 1837 | 1933 | 1968 | 2094 |
| Age group, y | ||||||||||
| 18-44 | 20.2 | 16.7 | 16.3 | 16.0 | 16.6 | 13.6 | 14.9 | 15.0 | 14.2 | 13.1 |
| 45-64 | 40.3 | 44.9 | 46.2 | 45.8 | 46.1 | 45.6 | 47.4 | 45.2 | 44.1 | 46.8 |
| 65-74 | 22.1 | 20.2 | 20.8 | 21.1 | 18.7 | 22.4 | 19.6 | 23.0 | 23.9 | 22.0 |
| ≥75 | 17.4 | 18.3 | 16.7 | 17.1 | 18.7 | 18.4 | 18.1 | 16.7 | 17.8 | 18.1 |
| Sex | ||||||||||
| Female | 52.6 | 55.2 | 51.0 | 51.5 | 52.4 | 51.3 | 51.8 | 50.8 | 51.6 | 49.5 |
| Male | 47.4 | 44.8 | 49.0 | 48.5 | 47.6 | 48.7 | 48.2 | 49.2 | 48.4 | 50.5 |
| Race/ethnicity | ||||||||||
| Non-Hispanic White | 72.1 | 74.2 | 74.8 | 75.2 | 73.2 | 71.3 | 69.5 | 69.5 | 66.5 | 64.2 |
| Non-Hispanic Black | 12.5 | 14.0 | 13.3 | 14.1 | 14.2 | 14.4 | 15.2 | 14.4 | 14.2 | 14.3 |
| Non-Hispanic Asianb | 3.7 | 4.2 | 4.3 | 5.4 | ||||||
| Hispanic | 11.3 | 8.2 | 7.3 | 6.1 | 8.8 | 8.9 | 9.3 | 9.8 | 11.1 | 11.5 |
| Education | ||||||||||
| <High school | 30.6 | 24.8 | 22.8 | 21.2 | 24.3 | 22.6 | 20.8 | 17.6 | 16.7 | 12.4 |
| High school graduate and some college | 53.4 | 53.3 | 59.6 | 56.4 | 54.7 | 55.8 | 52.7 | 58.3 | 57.7 | 62.3 |
| College graduate | 16.0 | 21.9 | 17.6 | 22.5 | 21.1 | 21.6 | 26.5 | 24.1 | 25.6 | 25.3 |
| Household income, $ | ||||||||||
| <20 000 | 29.5 | 24.6 | 21.2 | 19.1 | 20.1 | 18.3 | 19.3 | 17.8 | 18.4 | 14.7 |
| 20 000-44 999 | 33.5 | 31.4 | 33.5 | 31.1 | 30.6 | 30.8 | 28.4 | 29.5 | 25.0 | 26.3 |
| 45 000-74 999 | 18.7 | 22.3 | 26.0 | 25.4 | 20.2 | 22.8 | 20.1 | 21.0 | 23.4 | 18.9 |
| ≥75 000 | 18.3 | 21.7 | 19.3 | 24.4 | 29.1 | 28.2 | 32.2 | 31.7 | 33.1 | 40.0 |
| Type of health insurance | ||||||||||
| Private | 66.2 | 64.5 | 60.3 | 63.6 | 63.6 | 63.9 | 59.1 | 60.3 | 58.5 | 57.5 |
| Medicare | 19.1 | 21.2 | 23.2 | 17.6 | 15.9 | 16.6 | 17.7 | 18.5 | 21.2 | 19.4 |
| None | 9.9 | 8.3 | 11.1 | 10.1 | 12.1 | 11.6 | 10.7 | 10.5 | 7.9 | 8.9 |
| Medicaid | 3.0 | 3.8 | 2.1 | 2.6 | 3.7 | 3.4 | 5.0 | 5.3 | 5.3 | 8.1 |
| Other government | 1.9 | 2.2 | 3.4 | 6.2 | 4.7 | 4.5 | 7.6 | 5.4 | 7.1 | 6.2 |
| Had usual health care facility | 92.8 | 94.2 | 93.6 | 92.7 | 93.5 | 94.2 | 93.5 | 94.1 | 92.2 | 90.8 |
| Had health care visit in past year | 91.2 | 89.0 | 93.9 | 91.8 | 92.7 | 94.0 | 91.3 | 93.8 | 92.0 | 93.2 |
Data were self-reported and expressed as percentages unless otherwise indicated.
Characteristic description first used in 2011-2012.
Table 2. Age-Adjusted Mean Systolic Blood Pressure (SBP) and Diastolic Blood Pressure (DBP) and Distribution of BP Among Adults With Hypertension From 1999-2000 to 2017-2018a.
| 1999-2000 | 2001-2002 | 2003-2004 | 2005-2006 | 2007-2008 | 2009-2010 | 2011-2012 | 2013-2014 | 2015-2016 | 2017-2018 | |
|---|---|---|---|---|---|---|---|---|---|---|
| No. of adults | 1518 | 1605 | 1623 | 1495 | 2090 | 2099 | 1837 | 1933 | 1968 | 2094 |
| Mean level (95% CI), mm Hg | ||||||||||
| SBP | 144 (142-146) | 143 (141-144) | 141 (139-142) | 139 (137-140) | 136 (135-137) | 134 (133-136) | 136 (134-138) | 135 (133-137) | 138 (136-139) | 139 (137-140) |
| DBP | 78 (76-79) | 77 (76-78) | 75 (74-77) | 75 (74-76) | 74 (73-75) | 73 (71-74) | 74 (73-76) | 73 (72-74) | 73 (72-74) | 77 (76-79) |
| SBP/DBP category, % (95% CI)b | ||||||||||
| <120/<80 mm Hg | 9.2 (7.4-10.9) | 12.5 (10.0-15.0) | 13.1 (11.2-14.9) | 14.9 (12.8-17.0) | 18.2 (15.8-20.6) | 21.4 (19.4-23.4) | 18.4 (14.7-22.1) | 20.2 (16.8-23.6) | 17.2 (13.5-20.9) | 15.8 (12.9-18.6) |
| 120-129/<80 mm Hg | 6.5 (5.3-7.6) | 7.1 (5.7-8.5) | 9.6 (8.0-11.3) | 10.7 (8.5-12.8) | 12.3 (10.0-14.5) | 12.5 (10.9-14.0) | 15.8 (13.8-17.8) | 14.6 (12.5-16.7) | 14.3 (11.6-16.9) | 11.3 (9.4-13.2) |
| 130-139/80-89 mm Hg | 16.2 (12.4-19.9) | 15.3 (13.0-17.5) | 17.1 (14.6-19.7) | 18.3 (14.8-21.8) | 18.0 (15.5-20.6) | 19.2 (17.3-21.0) | 17.7 (16.4-18.9) | 19.1 (15.3-22.8) | 16.9 (14.0-19.7) | 16.7 (15.0-18.3) |
| 140-159/90-99 mm Hg | 48.2 (44.3-52.1) | 44.8 (41.8-47.7) | 42.4 (38.2-46.6) | 41.5 (38.8-44.2) | 39.3 (36.3-42.4) | 36.7 (33.3-40.0) | 35.7 (31.7-39.7) | 35.1 (31.0-39.2) | 40.1 (36.8-43.4) | 41.7 (38.6-44.8) |
| ≥160/100 mm Hg | 20.0 (16.5-23.6) | 20.4 (17.2-23.5) | 17.8 (15.4-20.2) | 14.6 (12.4-16.9) | 12.2 (10.7-13.7) | 10.3 (8.7-12.0) | 12.4 (9.6-15.2) | 11.1 (9.3-12.9) | 11.5 (9.9-13.2) | 14.6 (11.7-17.5) |
Age adjustment was performed using direct standardization with the standard being adults with hypertension across the entire period from 1999-2018; the age categories used for standardization were 18 to 44 years (15.5%), 45 to 64 years (45.4%), 65 to 74 years (21.5%), and 75 years or older (17.7%).
Adults with SBP and DBP levels that crossed over into another category were assigned the higher SBP/DBP category.
Primary Outcome
Among all adults with hypertension, the age-adjusted estimated proportion with controlled BP increased from 31.8% (95% CI, 26.9%-36.7%) in 1999-2000 to 48.5% (95% CI, 45.5%-51.5%) in 2007-2008, remained stable and was 53.8% (95% CI, 48.7%-59.0%) in 2013-2014, and then declined to 43.7% (95% CI, 40.2%-47.2%) in 2017-2018 (Table 3 and part A in the Figure). Among adults taking antihypertensive medication, the age-adjusted estimated proportion with controlled BP increased from 53.4% (95% CI, 49.0%-57.9%) in 1999-2000 to 68.3% (95% CI, 65.9%-70.8%) in 2007-2008, remained stable and was 72.2% (95% CI, 68.6%-75.8%) in 2013-2014, and then declined to 64.8% (95% CI, 61.3%-68.3%) in 2017-2018 (part B in the Figure). The estimated proportions of adults with controlled BP by the categories of age group, sex, race/ethnicity, education, household income, type of health insurance, and health care use among those with hypertension, overall, and restricted to those taking antihypertensive medication appear in Table 3 and eTable 1 in the Supplement.
Table 3. Percentage of Adults With Controlled Blood Pressure Among the Overall Population With Hypertension From 1999-2000 to 2017-2018.
| Characteristic | Adults with controlled blood pressure, % (95% CI)a | |||||||||
|---|---|---|---|---|---|---|---|---|---|---|
| 1999-2000 | 2001-2002 | 2003-2004 | 2005-2006 | 2007-2008 | 2009-2010 | 2011-2012 | 2013-2014 | 2015-2016 | 2017-2018 | |
| No. of adults | 1518 | 1605 | 1623 | 1495 | 2090 | 2099 | 1837 | 1933 | 1968 | 2094 |
| Overallb | 31.8 (26.9-36.7) | 34.9 (31.9-37.8) | 39.8 (35.5-44.1) | 43.8 (41.0-46.7) | 48.5 (45.5-51.5) | 53.0 (49.7-56.3) | 51.9 (47.4-56.4) | 53.8 (48.7-59.0) | 48.4 (44.3-52.4) | 43.7 (40.2-47.2) |
| Age group, y | ||||||||||
| 18-44 | 26.4 (17.1-35.8) | 29.9 (23.3-36.5) | 42.8 (31.7-54.0) | 29.1 (22.7-35.6) | 45.4 (36.8-54.1) | 35.5 (26.9-44.2) | 42.2 (31.6-52.9) | 44.6 (38.3-50.8) | 40.0 (33.9-46.0) | 33.4 (24.5-42.2) |
| 45-64 | 40.0 (34.1-45.8) | 38.8 (34.1-43.5) | 39.5 (33.3-45.7) | 48.3 (43.9-52.7) | 49.6 (44.7-54.5) | 57.1 (52.6-61.7) | 56.2 (49.6-62.8) | 57.0 (49.8-64.2) | 53.7 (48.1-59.2) | 46.2 (42.4-50.0) |
| 65-74 | 31.0 (24.9-37.1) | 33.8 (28.4-39.3) | 46.9 (41.8-51.9) | 48.6 (43.6-53.7) | 52.9 (48.1-57.8) | 59.2 (54.7-63.7) | 57.8 (51.2-64.5) | 59.2 (54.7-63.6) | 51.5 (44.5-58.5) | 51.9 (44.9-58.8) |
| ≥75 | 16.4 (11.8-20.9) | 30.5 (24.6-36.5) | 29.5 (24.4-34.6) | 39.5 (33.1-45.9) | 43.0 (38.2-47.8) | 50.3 (44.1-56.4) | 42.0 (33.4-50.5) | 47.4 (38.7-56.1) | 38.2 (31.7-44.8) | 36.5 (30.3-42.7) |
| Sexb | ||||||||||
| Female | 30.9 (25.7-36.1) | 36.9 (32.6-41.3) | 38.2 (33.7-42.8) | 46.7 (44.0-49.5) | 51.1 (48.2-54.0) | 57.2 (53.1-61.3) | 55.3 (49.3-61.3) | 57.5 (52.4-62.6) | 53.2 (48.2-58.2) | 43.9 (39.8-48.0) |
| Male | 34.0 (26.5-41.5) | 34.7 (30.7-38.6) | 42.6 (36.2-49.0) | 43.9 (40.0-47.8) | 46.6 (42.3-50.9) | 50.0 (46.5-53.5) | 49.6 (45.4-53.7) | 51.6 (45.0-58.2) | 45.5 (40.7-50.4) | 44.6 (40.0-49.4) |
| Race/ethnicityb,c | ||||||||||
| Non-Hispanic White | 35.2 (30.0-40.4) | 35.7 (32.2-39.1) | 41.6 (36.4-46.8) | 44.9 (42.0-47.7) | 51.1 (47.9-54.2) | 55.8 (52.0-59.7) | 54.0 (48.1-60.0) | 57.3 (49.6-64.9) | 51.3 (45.5-57.1) | 45.2 (39.6-50.8) |
| Non-Hispanic Black | 30.2 (23.9-36.5) | 32.8 (30.3-35.3) | 37.4 (32.5-42.3) | 43.1 (38.8-47.4) | 45.2 (40.8-49.5) | 48.0 (42.5-53.5) | 49.0 (43.6-54.4) | 46.3 (40.8-51.8) | 44.9 (41.0-48.7) | 38.5 (33.6-43.4) |
| Non-Hispanic Asiand | 45.2 (37.6-52.9) | 39.8 (32.6-46.9) | 37.6 (29.0-46.1) | 43.4 (38.8-48.1) | ||||||
| Hispanic | 23.3 (13.3-33.4) | 32.6 (25.5-39.7) | 33.4 (21.2-45.6) | 32.0 (22.9-41.1) | 41.6 (35.8-47.4) | 40.2 (37.6-42.9) | 45.9 (39.7-52.1) | 47.0 (41.1-53.0) | 44.4 (38.3-50.4) | 36.8 (30.7-42.8) |
| Educationb | ||||||||||
| <High school | 27.4 (21.1-33.8) | 33.1 (27.0-39.2) | 37.1 (32.2-42.0) | 34.7 (30.2-39.3) | 43.1 (36.0-50.3) | 50.3 (46.6-54.1) | 50.0 (41.6-54.1) | 55.0 (47.0-63.1) | 44.7 (36.5-52.8) | 34.9 (29.3-40.5) |
| High school graduate and some college | 32.2 (25.7-38.8) | 37.0 (32.2-41.9) | 38.9 (34.0-43.8) | 43.9 (40.2-47.6) | 48.4 (45.5-51.3) | 52.0 (48.6-55.4) | 51.9 (47.7-56.0) | 54.2 (48.6-59.8) | 49.1 (43.5-54.8) | 43.8 (39.1-48.5) |
| College graduate | 39.6 (27.8-51.5) | 31.6 (27.5-35.6) | 45.4 (36.6-54.2) | 50.2 (43.9-56.6) | 54.0 (48.1-59.9) | 58.3 (50.1-66.6) | 53.6 (45.0-62.2) | 51.4 (43.9-58.8) | 48.6 (41.5-55.7) | 47.1 (41.8-52.5) |
| Household income, $b | ||||||||||
| <20 000 | 31.5 (25.2-37.8) | 33.7 (28.6-38.9) | 37.7 (30.8-44.7) | 38.2 (31.9-44.6) | 47.9 (41.2-54.6) | 50.6 (45.9-55.4) | 52.7 (46.1-59.2) | 53.2 (46.1-59.2) | 44.3 (40.5-48.0) | 33.9 (24.5-43.3) |
| 20 000-44 999 | 33.1 (24.7-41.4) | 38.3 (31.9-44.8) | 38.1 (32.6-43.5) | 41.8 (37.5-46.1) | 47.3 (40.3-54.2) | 50.5 (46.1-54.9) | 52.5 (45.8-59.2) | 53.0 (47.5-58.5) | 50.5 (43.9-57.1) | 39.7 (33.8-45.6) |
| 45 000-74 999 | 32.2 (22.4-42.0) | 32.0 (26.7-37.3) | 39.0 (29.2-48.9) | 42.8 (37.3-48.3) | 47.6 (42.2-53.0) | 57.8 (51.6-63.9) | 53.6 (46.8-60.4) | 53.4 (46.5-60.2) | 49.2 (39.1-59.4) | 49.0 (40.9-57.0) |
| ≥75 000 | 34.4 (23.5-45.4) | 35.1 (30.5-39.6) | 44.8 (38.7-50.9) | 51.1 (44.0-58.0) | 50.0 (45.5-54.4) | 56.5 (50.0-63.1) | 50.6 (43.7-57.5) | 55.2 (47.8-62.5) | 51.8 (43.3-60.3) | 48.9 (43.1-54.7) |
| Type of health insuranceb | ||||||||||
| Private | 35.0 (30.0-40.1) | 38.2 (32.9-43.6) | 44.2 (38.2-50.1) | 45.8 (41.8-49.8) | 50.0 (46.9-53.1) | 55.9 (51.8-60.1) | 52.6 (47.4-57.7) | 56.8 (50.4-63.1) | 50.2 (44.7-55.6) | 46.5 (42.4-50.7) |
| Medicare | 39.0 (29.6-48.3) | 32.2 (25.0-39.5) | 48.2 (41.7-54.6) | 52.4 (40.5-64.3) | 59.4 (52.6-66.2) | 50.7 (42.8-58.5) | 60.2 (50.9-69.4) | 62.1 (56.4-67.8) | 60.3 (48.6-71.9) | 46.8 (36.8-56.7) |
| None | 13.7 (8.9-18.5) | 17.4 (8.1-26.6) | 16.8 (11.0-22.5) | 33.4 (19.0-47.8) | 35.5 (25.9-45.0) | 31.9 (23.8-40.0) | 43.3 (30.4-56.2) | 34.5 (23.8-45.2) | 27.9 (18.3-37.5) | 22.2 (14.8-29.6) |
| Medicaid | 24.5 (12.4-36.6) | 33.1 (22.2-44.1) | 35.7 (19.9-51.6) | 42.9 (28.2-57.6) | 63.9 (51.6-76.2) | 57.4 (44.8-69.9) | 59.3 (47.5-71.0) | 51.6 (36.1-67.2) | 46.6 (35.4-57.7) | 39.6 (28.2-51.0) |
| Other government | 20.1 (7.0-33.2) | 41.7 (24.1-59.3) | 51.1 (39.4-62.9) | 51.0 (42.9-59.2) | 67.9 (54.7-81.2) | 61.0 (50.9-71.1) | 49.2 (36.0-62.4) | 42.7 (33.7-51.6) | 43.9 (32.4-55.3) | 42.4 (33.3-51.6) |
| Had usual health care facilityb | ||||||||||
| No | 6.5 (0-14.2) | 7.3 (0.6-13.9) | 13.4 (0-28.0) | 14.0 (4.5-23.4) | 12.4 (3.4-21.5) | 18.9 (7.2-30.5) | 13.4 (7.4-19.4) | 17.6 (6.3-28.9) | 37.0 (23.9-50.1) | 18.2 (11.3-25.0) |
| Yes | 33.6 (28.4-38.8) | 36.6 (33.6-39.7) | 41.8 (37.2-46.3) | 46.1 (43.2-49.1) | 51.0 (47.9-54.0) | 55.4 (51.9-58.9) | 54.6 (49.8-59.4) | 56.2 (50.7-61.7) | 50.5 (46.5-54.5) | 46.5 (42.7-50.2) |
| Had health care visit in past yearb | ||||||||||
| No | 6.2 (2.1-10.3) | 3.0 (0-6.4) | 7.0 (0-15.7) | 6.1 (0.2-11.9) | 7.8 (1.7-13.8) | 14.1 (7.0-21.2) | 15.1 (7.6-22.6) | 10.1 (3.5-16.8) | 6.9 (0.6-13.2) | 7.5 (1.4-13.5) |
| Yes | 34.3 (29.2-39.4) | 38.9 (35.8-42.0) | 42.0 (37.6-46.3) | 47.2 (44.4-50.1) | 51.7 (48.6-54.8) | 55.8 (52.4-59.2) | 55.6 (51.4-59.9) | 56.6 (51.2-61.9) | 52.1 (48.0-56.1) | 46.5 (43.0-50.0) |
Defined as systolic blood pressure level below 140 mm Hg and diastolic blood pressure level below 90 mm Hg.
Age adjustment was performed using direct standardization with the standard being adults with hypertension across the entire period from 1999-2018; the age categories used for standardization were 18 to 44 years (15.5%), 45 to 64 years (45.4%), 65 to 74 years (21.5%) and 75 years or older (17.7%).
Due to a small sample size, adults of race/ethnicity other than those listed are not reported separately.
Characteristic description first used in 2011-2012.
Figure. Age-Adjusted Estimated Proportion of Adults With Hypertension and Controlled Blood Pressure.
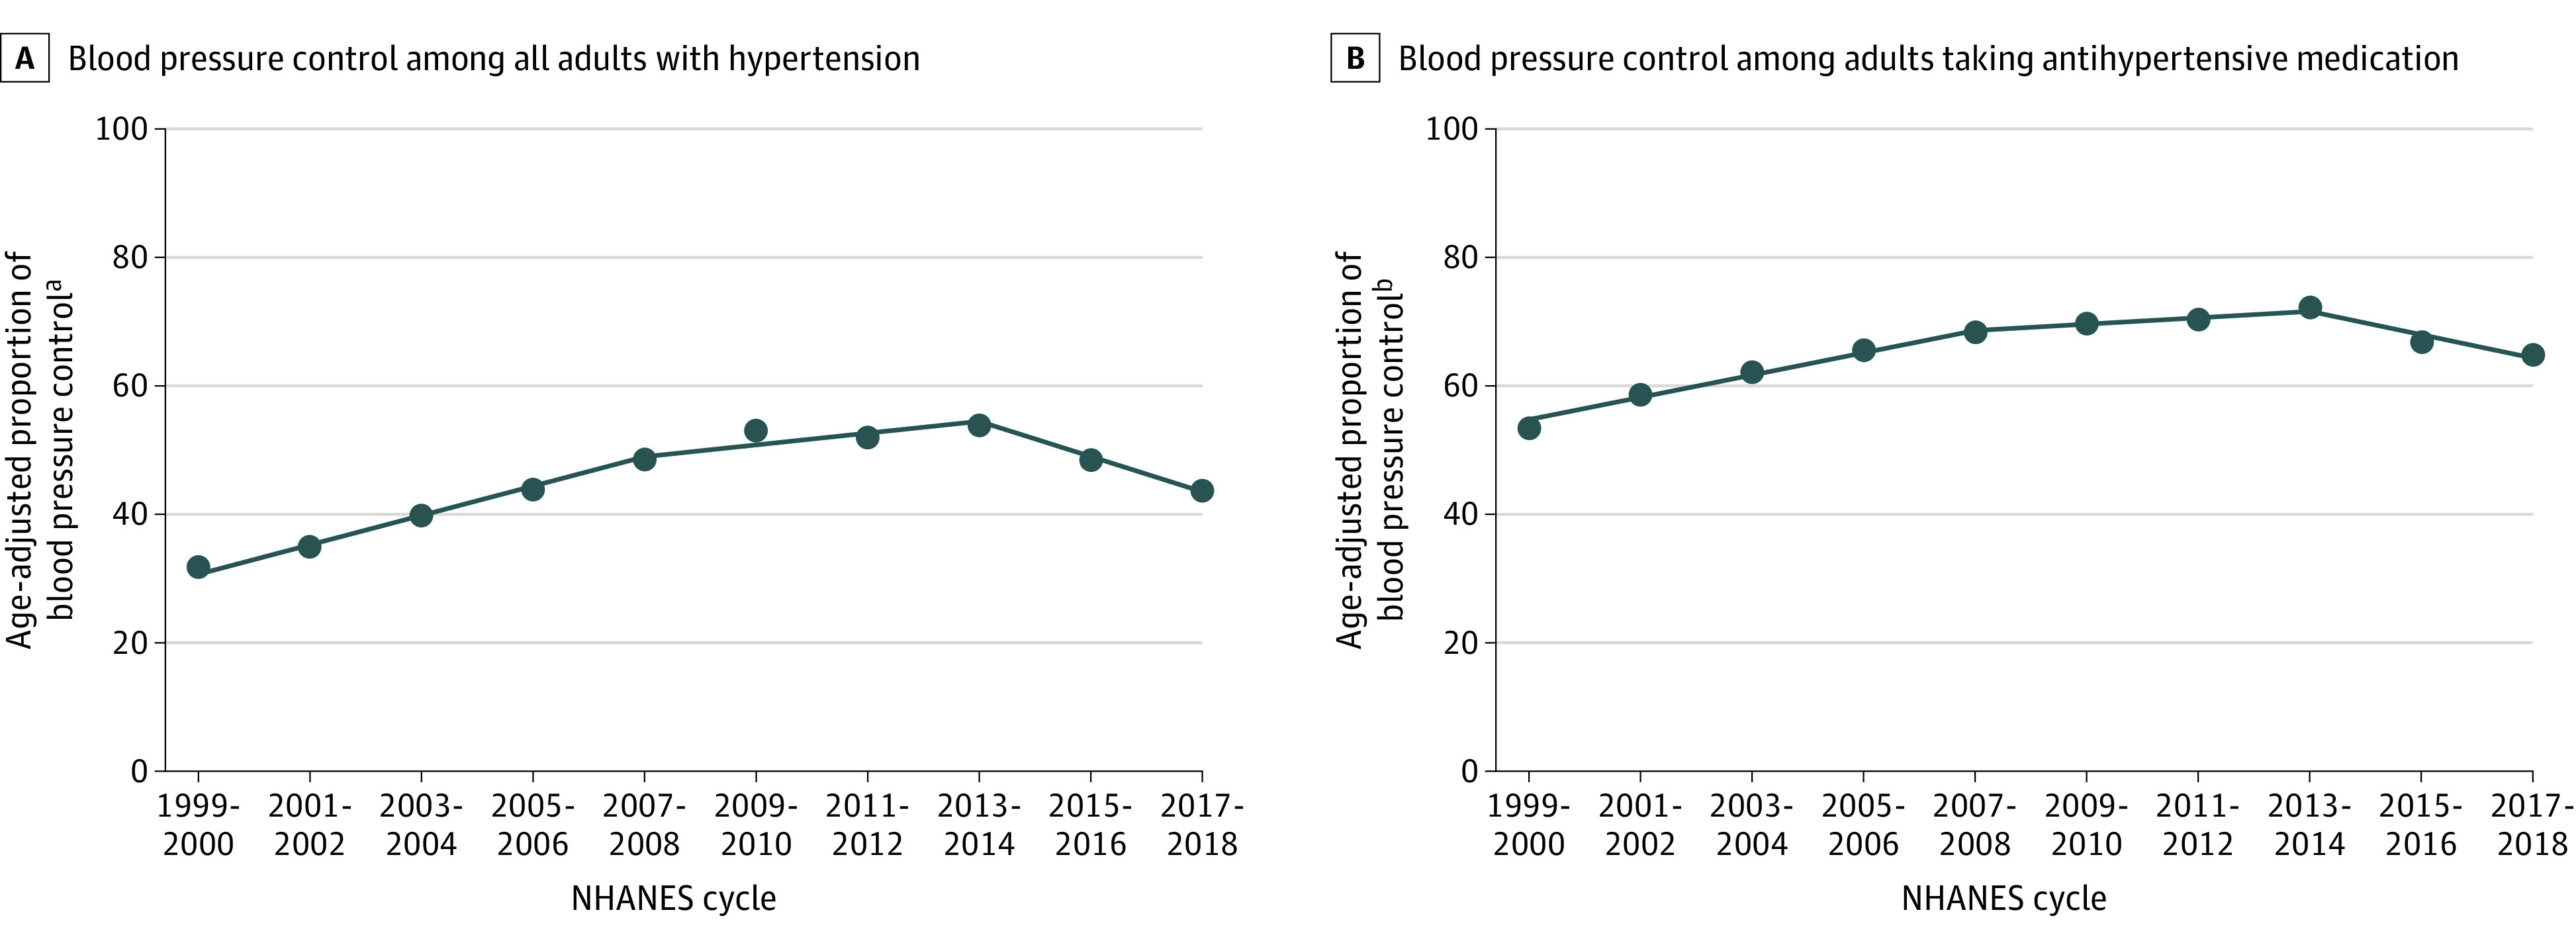
NHANES indicates National Health and Nutrition Examination Survey. The data markers represent the age-adjusted estimated proportion (the numbers and 95% CIs appear in Table 3 and eTable 1 in the Supplement). Hypertension was defined as systolic blood pressure (SBP) level of 140 mm Hg or higher, diastolic blood pressure (DBP) level of 90 mm Hg or higher, and antihypertensive medication use. Controlled blood pressure was defined as SBP level lower than 140 mm Hg and DBP level lower than 90 mm Hg. Treatment was defined by self-reported antihypertensive medication use. Among all adults with hypertension, blood pressure control from 1999-2000 through 2007-2008 yielded P < .001 for trend; from 2007-2008 through 2013-2014, P = .14 for trend; and from 2013-2014 through 2017-2018, P = .003 for trend. Among adults taking antihypertensive medication, blood pressure control from 1999-2000 through 2007-2008 yielded P < .001 for trend; from 2007-2008 through 2013-2014, P = .12 for trend; and from 2013-2014 through 2017-2018, P = .005 for trend. Age adjustment was performed using direct standardization with the standard being all adults across the entire period (1999-2018); the age categories used for standardization were 18 to 44 years (15.5%), 45 to 64 years (45.4%), 65 to 74 years (21.5%), and 75 years or older (17.7%). The line segments were generated using Joinpoint (National Cancer Institute).
aAmong all adults with hypertension.
bAmong adults who self-reported taking antihypertensive medication.
Compared with adults who were aged 18 to 44 years in the overall population with hypertension in 2015-2018, it was estimated that controlled BP was more likely among their counterparts aged 45 to 64 years (49.7% vs 36.7%; multivariable-adjusted prevalence ratio, 1.18 [95% CI, 1.02-1.37]) and less likely among those 75 years or older (37.3% vs 36.7%; multivariable-adjusted prevalence ratio, 0.81 [95% CI, 0.65-0.97]; Table 4). It was estimated that controlled BP was less likely among non-Hispanic Black adults vs non-Hispanic White adults (41.5% vs 48.2%, respectively; multivariable-adjusted prevalence ratio, 0.88 [95% CI, 0.81-0.96]) and more likely among those with private insurance (48.2%), Medicare (53.4%), or government health insurance other than Medicare or Medicaid (43.2%) vs no health insurance (24.2%) (multivariable-adjusted prevalence ratio, 1.40 [95% CI, 1.08-1.80], 1.47 [95% CI, 1.15-1.89], and 1.36 [95% CI, 1.04-1.76], respectively). Controlled BP was more likely among those with vs without a usual health care facility (48.4% vs 26.5%, respectively; multivariable-adjusted prevalence ratio, 1.48 [95% CI, 1.13-1.94]) and those who had vs those who had not had a health care visit in the past year (49.1% vs 8.0%; multivariable-adjusted prevalence ratio, 5.23 [95% CI, 2.88-9.49]).
Table 4. Factors Associated With Controlled Blood Pressure Among Adults in 2015-2018.
| Characteristic | All adults with hypertension (n = 4062)a | Adults taking antihypertensive medication (n = 2952)a | ||||
|---|---|---|---|---|---|---|
| Prevalence, % (95% CI)b | Prevalence ratio (95% CI) | Prevalence, % (95% CI)b | Prevalence ratio (95% CI) | |||
| Model 1c | Model 2d | Model 1c | Model 2d | |||
| Age group, y | ||||||
| 18-44 | 36.7 (31.1-43.3) | 1 [Reference] | 1 [Reference] | 71.9 (64.6-79.3) | 1 [Reference] | 1 [Reference] |
| 45-64 | 49.7 (46.3-53.2) | 1.32 (1.14-1.51) | 1.18 (1.02-1.37) | 71.5 (67.6-75.4) | 0.98 (0.88-1.09) | 0.96 (0.87-1.07) |
| 65-74 | 51.7 (46.6-56.8) | 1.34 (1.15-1.57) | 1.11 (0.92-1.32) | 64.3 (58.8-69.9) | 0.87 (0.76-0.99) | 0.84 (0.74-0.95) |
| ≥75 | 37.3 (32.7-41.9) | 0.96 (0.80-1.15) | 0.81 (0.65-0.97) | 47.3 (41.7-52.9) | 0.64 (0.56-0.73) | 0.63 (0.55-0.73) |
| Sex | ||||||
| Female | 48.5 (45.1-52.0) | 1 [Reference] | 1 [Reference] | 65.6 (62.8-68.4) | 1 [Reference] | 1 [Reference] |
| Male | 45.0 (41.4-48.6) | 0.93 (0.85-1.03) | 0.97 (0.88-1.06) | 66.7 (63.0-70.5) | 1.02 (0.97-1.09) | 1.01 (0.95-1.07) |
| Race/ethnicity | ||||||
| Non-Hispanic White | 48.2 (44.2-52.1) | 1 [Reference] | 1 [Reference] | 69.3 (65.9-72.7) | 1 [Reference] | 1 [Reference] |
| Non-Hispanic Black | 41.5 (38.3-44.7) | 0.85 (0.77-0.94) | 0.88 (0.81-0.96) | 55.6 (51.7-59.6) | 0.80 (0.75-0.86) | 0.82 (0.77-0.88) |
| Non-Hispanic Asian | 41.1 (36.6-45.6) | 0.86 (0.75-0.99) | 0.89 (0.78-1.02) | 60.0 (54.2-65.8) | 0.88 (0.78-0.99) | 0.87 (0.77-0.98) |
| Hispanic | 40.5 (35.8-45.1) | 0.83 (0.72-0.96) | 0.95 (0.82-1.09) | 61.6 (55.6-67.7) | 0.89 (0.80-0.98) | 0.93 (0.84-1.03) |
| Education | ||||||
| <High school | 40.5 (35.1-45.8) | 1 [Reference] | 1 [Reference] | 60.7 (54.7-66.7) | 1 [Reference] | 1 [Reference] |
| High school graduate and some college | 46.2 (42.5-50.0) | 1.08 (0.92-1.26) | 1.01 (0.85-1.19) | 64.4 (60.6-68.1) | 1.03 (0.91-1.17) | 1.00 (0.88-1.14) |
| College graduate | 48.0 (43.4-52.6) | 1.13 (0.97-1.31) | 0.99 (0.84-1.18) | 72.3 (67.6-77.0) | 1.17 (1.06-1.29) | 1.10 (0.97-1.24) |
| Household income, $ | ||||||
| <20 000 | 39.4 (34.2-44.5) | 1 [Reference] | 1 [Reference] | 57.3 (50.8-63.8) | 1 [Reference] | 1 [Reference] |
| 20 000-44 999 | 45.1 (40.4-49.8) | 1.11 (0.93-1.33) | 1.11 (0.93-1.32) | 63.7 (58.5-68.9) | 1.08 (0.94-1.25) | 1.07 (0.92-1.23) |
| 45 000-74 999 | 49.2 (42.3-56.2) | 1.22 (1.02-1.46) | 1.17 (0.97-1.40) | 66.4 (60.2-72.6) | 1.12 (0.97-1.29) | 1.07 (0.91-1.27) |
| ≥75 000 | 50.2 (45.1-55.3) | 1.18 (1.02-1.37) | 1.13 (0.94-1.36) | 72.2 (67.3-77.0) | 1.20 (1.07-1.33) | 1.13 (0.98-1.29) |
| Type of health insurance | ||||||
| Private | 48.2 (44.8-51.7) | 1.83 (1.44-2.32) | 1.40 (1.08-1.80) | 69.1 (65.6-72.5) | 1.40 (1.09-1.80) | 1.32 (1.01-1.74) |
| Medicare | 53.4 (45.4-61.4) | 1.89 (1.49-2.39) | 1.47 (1.15-1.89) | 65.4 (58.2-72.7) | 1.33 (1.03-1.71) | 1.28 (1.00-1.67) |
| None | 24.2 (18.2-30.2) | 1 [Reference] | 1 [Reference] | 44.4 (33.3-55.5) | 1 [Reference] | 1 [Reference] |
| Medicaid | 41.1 (31.9-50.2) | 1.70 (1.24-2.34) | 1.34 (0.97-1.86) | 61.7 (51.5-71.9) | 1.35 (1.03-1.77) | 1.35 (1.03-1.78) |
| Other government | 43.2 (34.1-52.3) | 1.79 (1.39-2.22) | 1.36 (1.04-1.76) | 57.3 (46.2-68.3) | 1.27 (1.01-1.60) | 1.23 (0.96-1.57) |
| Had usual health care facility | ||||||
| No | 26.5 (18.4-34.7) | 1 [Reference] | 1 [Reference] | 64.6 (51.2-78.1) | 1 [Reference] | 1 [Reference] |
| Yes | 48.4 (45.6-51.2) | 2.25 (1.69-3.00) | 1.48 (1.13-1.94) | 65.9 (63.4-68.5) | 1.04 (0.85-1.27) | 0.97 (0.82-1.15) |
| Had health care visit in past year | ||||||
| No | 8.0 (2.9-13.0) | 1 [Reference] | 1 [Reference] | 48.4 (33.5-63.4) | 1 [Reference] | 1 [Reference] |
| Yes | 49.1 (46.4-51.9) | 6.48 (3.63-11.6) | 5.23 (2.88-9.49) | 66.1 (63.3-68.8) | 1.28 (0.91-1.80) | 1.20 (0.84-1.73) |
Multiple imputation was performed. The percentage of participants with missing data was 1.8% for education, 9.6% for household income, 1.2% for type of health insurance, 1.2% for having a usual health care facility, and less than 0.1% for having a health care visit in the past year.
Age adjustment was performed for the characteristics (excluding the characteristic of age group) using direct standardization with the standard being adults with hypertension across the entire period from 1999-2018; the age categories used for standardization were 18 to 44 years (15.5%), 45 to 64 years (45.4%), 65 to 74 years (21.5%) and 75 years or older (17.7%).
Includes adjustment for age groups, sex, and race/ethnicity.
Includes simultaneous adjustment for all characteristics listed.
Among adults taking antihypertensive medication, it was estimated that controlled BP was less likely among those aged 65 to 74 years (64.3%) and aged 75 years or older (47.3%) vs those aged 18 to 44 years (71.9%) (multivariable-adjusted prevalence ratio, 0.84 [95% CI, 0.74-0.95] and 0.63 [95% CI, 0.55-0.73], respectively). Controlled BP among adults taking antihypertensive medication was less likely in non-Hispanic Black adults (55.6%) and non-Hispanic Asian adults (60.0%) vs non-Hispanic White adults (69.3%) (multivariable-adjusted prevalence ratio, 0.82 [95% CI, 0.77-0.88] and 0.87 [95% CI, 0.77-0.98], respectively). Controlled BP was more likely among those with Medicaid vs no health insurance (61.7% vs 44.4%, respectively; multivariable-adjusted prevalence ratio, 1.35 [95% CI, 1.03-1.78]). The results were similar in an analysis using a complete case approach (eTable 2 in the Supplement).
Secondary Outcomes
Among adults with hypertension, the age-adjusted estimated proportion who reported that they were aware they had hypertension increased from 69.9% (95% CI, 65.9%-73.8%) in 1999-2000 to 84.7% (95% CI, 82.3%-87.1%) in 2013-2014 and then declined to 77.0% (95% CI, 73.5%-80.6%) in 2017-2018 (eTable 3 and panel A in eFigure 3 in the Supplement). Among adults that reported being aware they had hypertension, the age-adjusted estimated proportion who reported taking antihypertensive medication increased from 85.0% (95% CI, 81.0%-89.1%) in 1999-2000 to 92.7% (95% CI, 91.0%-94.4%) in 2009-2010 and declined to 88.2% (95% CI, 85.5%-90.9%) in 2017-2018 (eTable 4 and panel B in eFigure 3 in the Supplement).
After multivariable adjustment, it was estimated that hypertension awareness was more likely in those who were aged 45 to 64 years (79.3%), 65 to 74 years (85.4%), and 75 years or older (82.1%) vs those aged 18 to 44 years (67.3%) (multivariable-adjusted prevalence ratio, 1.12 [95% CI, 1.03-1.22], 1.16 [95% CI, 1.05-1.27], and 1.10 [95% CI, 1.01-1.19], respectively; left panel in eTable 5 in the Supplement). Hypertension awareness was more likely among those with vs those without a usual health care facility (81.2% vs 59.5%, respectively; multivariable-adjusted prevalence ratio, 1.17 [95% CI, 1.04-1.31]) and among those who had vs those who had not had a health care visit in the past year (82.2% vs 43.3%; multivariable-adjusted prevalence ratio, 1.90 [95% CI, 1.56-2.31]). Hypertension awareness was less likely among college graduates vs adults with less than a high school education (75.3% vs 79.4%, respectively; multivariable-adjusted prevalence ratio, 0.91 [95% CI, 0.85-0.97]).
It was estimated that among adults who reported being aware they had hypertension, the self-reported use of antihypertensive medication was more likely among those aged 45 to 64 years (87.7%), 65 to 74 years (94.1%), and 75 years or older (96.0%) vs those aged 18 to 44 years (75.8%) (multivariable-adjusted prevalence ratio, 1.10 [95% CI, 1.02-1.18], 1.13 [95% CI, 1.06-1.22], and 1.15 [95% CI, 1.07-1.24], respectively; eTable 5 in the Supplement). Antihypertensive medication use was more likely among those having private insurance (90.6%) or Medicare (93.5%) vs those without insurance (75.2%) (multivariable-adjusted prevalence ratio, 1.12 [95% CI, 1.02-1.22] and 1.13 [95% CI, 1.03-1.23], respectively). Antihypertensive medication use was more likely among those with vs those without a usual health care facility (90.9% vs 66.2%, respectively; multivariable-adjusted prevalence ratio, 1.33 [95% CI, 1.16-1.54]) and among those who had vs those who had not had a health care visit in the past year (90.8% vs 45.6%; multivariable-adjusted prevalence ratio, 2.13 [95% CI, 1.59-2.85]; right panel in eTable 5 in the Supplement). It was estimated that men were less likely than women to report taking antihypertensive medication (86.4% vs 91.8%, respectively; multivariable-adjusted prevalence ratio, 0.96 [95% CI, 0.93-1.00]). The factors associated with hypertension awareness and antihypertensive medication use in a complete case analysis appear in eTable 6 in the Supplement.
Sensitivity Analysis Using 2017 ACC/AHA BP Guideline
Using the 2017 ACC/AHA BP guideline definition, the age-adjusted estimated prevalence of hypertension was 48.6% (95% CI, 45.7%-51.5%) in 1999-2000 and 46.5% (95% CI, 44.0%-49.0%) in 2017-2018 (eFigure 4 in the Supplement). Among all adults with hypertension, the age-adjusted estimated proportion with controlled BP increased from 9.7% (95% CI, 8.5%-10.9%) in 1999-2000 to 25.0% (95% CI, 22.5%-27.5%) in 2013-2014 and then decreased to 19.0% (95% CI, 17.0%-20.9%) in 2017-2018 (panel A in eFigure 5 in the Supplement). When restricted to those taking antihypertensive medication, the age-adjusted estimated proportion of adults with controlled BP increased from 27.6% (95% CI, 24.9%-30.3%) in 1999-2000 to 48.5% (95% CI, 45.1%-52.0%) in 2013-2014, and then declined to 38.9% (95% CI, 35.3%-42.5%) in 2017-2018 (panel B in eFigure 5 in the Supplement). Trends in hypertension awareness and antihypertensive medication use from 1999-2000 to 2017-2018 appear in eFigure 6 in the Supplement.
Discussion
In the current study, the age-adjusted estimated proportion of adults with controlled BP increased from 1999-2000 through 2007-2008 and remained stable from 2007-2008 through 2013-2014. However, the proportion of adults with controlled BP decreased from 2013-2014 through 2017-2018 such that a similar estimated proportion of adults had controlled BP in 2017-2018 as in 2005-2006.
Between 1977 and 2003, the National High BP Education Program of the National Heart, Lung, and Blood Institute coordinated 7 evidence-based guidelines for the screening, diagnosis, and management of hypertension.17,18 In December 2013, the panel members appointed to the eighth Joint National Committee (JNC 8) published a report that recommended higher BP goals for some adults compared with the seventh Joint National Committee (JNC 7) guideline.19 The decrease in BP control that was present among adults in the current study from 2013-2014 through 2017-2018 was predicted by 5 authors of the JNC 8 report, who noted the higher BP goal in JNC 8 vs JNC 7 would result in reduced intensity of antihypertensive medication use.20
The ACC/AHA published a BP guideline in November 2017 that recommended adults taking antihypertensive medication achieve a lower BP goal compared with the JNC 7 guideline and the JNC 8 panel member report.16 A previous study estimated that compared with the JNC 7 guideline, the 2017 ACC/AHA BP guideline increased the proportion of US adults with hypertension by 14%, increased the proportion recommended antihypertensive medication initiation by 2%, and increased the proportion recommended more intensive antihypertensive treatment by 14%.10 With a higher proportion of adults taking antihypertensive medication and more intensive treatment recommended for those with hypertension, the implementation of the 2017 ACC/AHA BP guideline could result in increasing hypertension awareness, antihypertensive medication use, and BP control.
Although improvements in BP control have occurred since 1999-2000, there were subgroups of adults (including older adults and non-Hispanic Black adults) who were less likely to have controlled BP. These age and racial/ethnic disparities were reported in studies conducted in the 1980s and 1990s.21,22 In 2014, the AHA, the ACC, and the US Centers for Disease Control and Prevention published a scientific advisory focused on approaches to control BP.23 This advisory recommended health system, clinician, and patient-tailored approaches to control BP. These methods have proven effective in the Kaiser Permanente Northern California health system and may be effective in other settings.24,25 Identifying strategies to implement these approaches in a wide variety of clinical practice settings may facilitate increases in BP control and reduce racial/ethnic and socioeconomic disparities.25,26,27
In 2015, the US Preventive Services Task Force recommended annual BP screening for adults aged 40 years or older, and among younger adults at high risk for hypertension.28 Adults younger than 40 years with SBP level lower than 130 mm Hg and DBP level of 85 mm Hg who do not have hypertension risk factors were recommended a BP screening interval of 3 to 5 years. In the current study, a substantial percentage of adults aged 18 to 44 years with hypertension were not aware they had hypertension. Efforts are needed to ensure BP screening occurs for younger adults.
In 2015-2018, younger vs older adults were less likely to be taking antihypertensive medication. Underuse of antihypertensive medication has been reported to be related to low perceived cardiovascular disease risk, lack of access to care, not having a usual source of care, and treatment discontinuation. Although younger adults with hypertension have a lower short-term risk for cardiovascular disease, they have a higher lifetime risk.29,30 Starting in 2010, the Patient Protection and Affordable Care Act required health insurance coverage for adult dependents aged 18 to 26 years. The proportion of younger adults with hypertension who reported having health insurance, seeing a physician in the past year, having a place to see their clinician when needed, and could afford any prescribed medication increased from 2006-2009 through 2011-2014.31,32,33 However, a high proportion of younger adults discontinue use of antihypertensive medication.34,35 Additional effort is needed to increase the initiation of and adherence to antihypertensive medication among younger adults.
A high prevalence of hypertension among patients hospitalized for coronavirus disease 2019 (COVID-19) has been reported.36 Black adults have been disproportionately affected by COVID-19 in the US, including higher infection and hospitalization rates.37,38 In the current study, a significantly lower proportion of non-Hispanic Black adults had controlled BP vs non-Hispanic White adults. It is uncertain if hypertension or uncontrolled BP increase the risk for worse outcomes among adults with COVID-19. In addition to the benefits of BP control in reducing cardiovascular disease risk, future studies should investigate whether achieving BP control in all racial/ethnic groups can reduce disparities in COVID-19 severity.
Limitations
This study has several limitations. First, each participant completed only a single visit and guidelines recommend obtaining the mean using multiple BP measurements obtained during 2 or more visits.16,39
Second, the analysis relied on self-report of hypertension awareness and treatment with antihypertensive medication.
Third, data on diet, medication adherence, adverse effects, insurance reimbursement for medications, and use of home BP monitoring were not available. Therefore, the association of lifestyle factors with BP control was not examined.
Fourth, the response rate for NHANES has declined from 1999-2000 through 2017-2018. The effect of this on the current study’s results is unclear.
Conclusions
In a series of cross-sectional surveys weighted to be representative of the adult US population, the prevalence of controlled BP increased between 1999-2000 and 2007-2008, did not significantly change from 2007-2008 through 2013-2014, and then decreased after 2013-2014.
eFigure 1. Flowchart showing the number of NHANES participants included in the current analyses
eFigure 2. Age-adjusted estimated percentage of adults with hypertension
eFigure 3. Age-adjusted estimated proportion of adults with hypertension who were aware they had hypertension (Panel A) and were taking antihypertensive medication among those who were aware (Panel B)
eFigure 4. Age-adjusted estimated percentage of US adults with hypertension defined using thresholds from the 2017 American College of Cardiology/American Heart Association blood pressure guideline
eFigure 5. Age-adjusted estimated proportion of adults with controlled blood pressure in a sensitivity analysis with blood pressure thresholds from the 2017 American College of Cardiology/American Heart Association blood pressure guideline
eFigure 6. Age-adjusted estimated proportion of US adults with hypertension, defined according to the 2017 American College of Cardiology/American Heart Association blood pressure guideline, who were aware they had hypertension (Panel A) and were taking antihypertensive medication among those who were aware (Panel B)
eTable 1. Percentage of adults with controlled blood pressure among those with hypertension who reported taking antihypertensive medication, overall and in sub-groups from 1999-2000 to 2017-2018
eTable 2. Factors associated with controlled blood pressure among US adults in 2015-2018 in a complete case analysis
eTable 3. Percentage of adults with hypertension who reported being aware they have hypertension, overall, and in sub-groups from 1999-2000 to 2017-2018
eTable 4. Percentage of adults who reported taking antihypertensive medication among those reported being aware that they have hypertension, overall and in sub-groups from 1999-2000 to 2017-2018
eTable 5. Factors associated with hypertension awareness and taking antihypertensive medication among US adults with hypertension in 2015-2018
eTable 6. Factors associated with hypertension awareness and taking antihypertensive medication among adults with hypertension in 2015-2018 in a complete case analysis
References
- 1.Clark D III, Colantonio LD, Min YI, et al. Population-attributable risk for cardiovascular disease associated with hypertension in black adults. JAMA Cardiol. 2019;4(12):1194-1202. doi: 10.1001/jamacardio.2019.3773 [DOI] [PMC free article] [PubMed] [Google Scholar]
- 2.Navar AM, Peterson ED, Wojdyla D, et al. Temporal changes in the association between modifiable risk factors and coronary heart disease incidence. JAMA. 2016;316(19):2041-2043. doi: 10.1001/jama.2016.13614 [DOI] [PMC free article] [PubMed] [Google Scholar]
- 3.Lewington S, Clarke R, Qizilbash N, Peto R, Collins R, Prospective Studies C; Prospective Studies Collaboration . Age-specific relevance of usual blood pressure to vascular mortality: a meta-analysis of individual data for one million adults in 61 prospective studies. Lancet. 2002;360(9349):1903-1913. doi: 10.1016/S0140-6736(02)11911-8 [DOI] [PubMed] [Google Scholar]
- 4.Bundy JD, Li C, Stuchlik P, et al. Systolic blood pressure reduction and risk of cardiovascular disease and mortality: a systematic review and network meta-analysis. JAMA Cardiol. 2017;2(7):775-781. doi: 10.1001/jamacardio.2017.1421 [DOI] [PMC free article] [PubMed] [Google Scholar]
- 5.Ettehad D, Emdin CA, Kiran A, et al. Blood pressure lowering for prevention of cardiovascular disease and death: a systematic review and meta-analysis. Lancet. 2016;387(10022):957-967. doi: 10.1016/S0140-6736(15)01225-8 [DOI] [PubMed] [Google Scholar]
- 6.Egan BM, Zhao Y, Axon RN. US trends in prevalence, awareness, treatment, and control of hypertension, 1988-2008. JAMA. 2010;303(20):2043-2050. doi: 10.1001/jama.2010.650 [DOI] [PubMed] [Google Scholar]
- 7.Guo F, He D, Zhang W, Walton RG. Trends in prevalence, awareness, management, and control of hypertension among United States adults, 1999 to 2010. J Am Coll Cardiol. 2012;60(7):599-606. doi: 10.1016/j.jacc.2012.04.026 [DOI] [PubMed] [Google Scholar]
- 8.National Center for Health Statistics NCHS fact sheet: National Health and Nutrition Examination Survey. Accessed March 19, 2020. https://www.cdc.gov/nchs/data/factsheets/factsheet_nhanes.pdf
- 9.Whelton PK. The elusiveness of population-wide high blood pressure control. Annu Rev Public Health. 2015;36:109-130. doi: 10.1146/annurev-publhealth-031914-122949 [DOI] [PubMed] [Google Scholar]
- 10.Muntner P, Carey RM, Gidding S, et al. Potential US population impact of the 2017 ACC/AHA high blood pressure guideline. J Am Coll Cardiol. 2018;71(2):109-118. doi: 10.1016/j.jacc.2017.10.073 [DOI] [PMC free article] [PubMed] [Google Scholar]
- 11.US Centers for Disease Control and Prevention National Health and Nutrition Examination Survey. Accessed March 19, 2020. https://www.cdc.gov/nchs/nhanes/index.htm
- 12.Chobanian AV, Bakris GL, Black HR, et al. The seventh report of the Joint National Committee on prevention, detection, evaluation, and treatment of high blood pressure: the JNC 7 report. JAMA. 2003;289(19):2560-2572. doi: 10.1001/jama.289.19.2560 [DOI] [PubMed] [Google Scholar]
- 13.Kim HJ, Fay MP, Feuer EJ, Midthune DN. Permutation tests for joinpoint regression with applications to cancer rates. Stat Med. 2000;19(3):335-351. doi: 10.1002/(SICI)1097-0258(20000215)19:3<335::AID-SIM336>3.0.CO;2-Z [DOI] [PubMed] [Google Scholar]
- 14.Quartagno M, Carpenter JR, Goldstein H. Multiple imputation with survey weights: a multilevel approach. J Survey Stat Method. Published online September 13, 2019. doi: 10.1093/jssam/smz036 [DOI] [Google Scholar]
- 15.Quartagno M, Grund S, Carpenter JR Jomo: a flexible package for two-level joint modelling multiple imputation. Accessed August 18, 2020. https://journal.r-project.org/archive/2019/RJ-2019-034/RJ-2019-034.pdf
- 16.Whelton PK, Carey RM, Aronow WS, et al. 2017 ACC/AHA/AAPA/ABC/ACPM/AGS/APhA/ASH/ASPC/NMA/PCNA guideline for the prevention, detection, evaluation, and management of high blood pressure in adults: a report of the American College of Cardiology/American Heart Association task force on clinical practice guidelines. J Am Coll Cardiol. 2018;71(19):e127-e248. doi: 10.1016/j.jacc.2017.11.006 [DOI] [PubMed] [Google Scholar]
- 17.Kotchen TA. Developing hypertension guidelines: an evolving process. Am J Hypertens. 2014;27(6):765-772. doi: 10.1093/ajh/hpt298 [DOI] [PubMed] [Google Scholar]
- 18.Krousel-Wood M, Muntner P, Carson A, et al. Hypertension control among newly treated patients before and after publication of the main ALLHAT results and JNC 7 guidelines. J Clin Hypertens (Greenwich). 2012;14(5):277-283. doi: 10.1111/j.1751-7176.2012.00609.x [DOI] [PMC free article] [PubMed] [Google Scholar]
- 19.James PA, Oparil S, Carter BL, et al. 2014 evidence-based guideline for the management of high blood pressure in adults: report from the panel members appointed to the Eighth Joint National Committee (JNC 8). JAMA. 2014;311(5):507-520. doi: 10.1001/jama.2013.284427 [DOI] [PubMed] [Google Scholar]
- 20.Wright JT Jr, Fine LJ, Lackland DT, Ogedegbe G, Dennison Himmelfarb CR. Evidence supporting a systolic blood pressure goal of less than 150 mm Hg in patients aged 60 years or older: the minority view. Ann Intern Med. 2014;160(7):499-503. doi: 10.7326/M13-2981 [DOI] [PubMed] [Google Scholar]
- 21.Hertz RP, Unger AN, Cornell JA, Saunders E. Racial disparities in hypertension prevalence, awareness, and management. Arch Intern Med. 2005;165(18):2098-2104. doi: 10.1001/archinte.165.18.2098 [DOI] [PubMed] [Google Scholar]
- 22.Burt VL, Cutler JA, Higgins M, et al. Trends in the prevalence, awareness, treatment, and control of hypertension in the adult US population: data from the health examination surveys, 1960 to 1991. Hypertension. 1995;26(1):60-69. doi: 10.1161/01.HYP.26.1.60 [DOI] [PubMed] [Google Scholar]
- 23.Go AS, Bauman MA, Coleman King SM, et al. An effective approach to high blood pressure control: a science advisory from the American Heart Association, the American College of Cardiology, and the Centers for Disease Control and Prevention. J Am Coll Cardiol. 2014;63(12):1230-1238. doi: 10.1016/j.jacc.2013.11.007 [DOI] [PubMed] [Google Scholar]
- 24.Jaffe MG, Lee GA, Young JD, Sidney S, Go AS. Improved blood pressure control associated with a large-scale hypertension program. JAMA. 2013;310(7):699-705. doi: 10.1001/jama.2013.108769 [DOI] [PMC free article] [PubMed] [Google Scholar]
- 25.Fontil V, Gupta R, Moise N, et al. Adapting and evaluating a health system intervention from Kaiser Permanente to improve hypertension management and control in a large network of safety-net clinics. Circ Cardiovasc Qual Outcomes. 2018;11(7):e004386. doi: 10.1161/CIRCOUTCOMES.117.004386 [DOI] [PMC free article] [PubMed] [Google Scholar]
- 26.Bellows BK, Ruiz-Negrón N, Bibbins-Domingo K, et al. Clinic-based strategies to reach United States Million Hearts 2022 blood pressure control goals. Circ Cardiovasc Qual Outcomes. 2019;12(6):e005624. doi: 10.1161/CIRCOUTCOMES.118.005624 [DOI] [PMC free article] [PubMed] [Google Scholar]
- 27.Egan BM, Sutherland SE, Rakotz M, et al. Improving hypertension control in primary care with the measure accurately, act rapidly, and partner with patients protocol. Hypertension. 2018;72(6):1320-1327. doi: 10.1161/HYPERTENSIONAHA.118.11558 [DOI] [PMC free article] [PubMed] [Google Scholar]
- 28.Siu AL; U.S. Preventive Services Task Force . Screening for high blood pressure in adults: US Preventive Services Task Force recommendation statement. Ann Intern Med. 2015;163(10):778-786. doi: 10.7326/M15-2223 [DOI] [PubMed] [Google Scholar]
- 29.Pencina MJ, D’Agostino RB Sr, Larson MG, Massaro JM, Vasan RS. Predicting the 30-year risk of cardiovascular disease: the Framingham Heart Study. Circulation. 2009;119(24):3078-3084. doi: 10.1161/CIRCULATIONAHA.108.816694 [DOI] [PMC free article] [PubMed] [Google Scholar]
- 30.Clark CJ, Alonso A, Spencer RA, Pencina M, Williams K, Everson-Rose SA. Predicted long-term cardiovascular risk among young adults in the national longitudinal study of adolescent health. Am J Public Health. 2014;104(12):e108-e115. doi: 10.2105/AJPH.2014.302148 [DOI] [PMC free article] [PubMed] [Google Scholar]
- 31.Fang J, Wang G, Ayala C, Lucido SJ, Loustalot F. Healthcare access among young adults: impact of the Affordable Care Act on young adults with hypertension. Am J Prev Med. 2017;53(6 suppl 2):S213-S219. [DOI] [PMC free article] [PubMed] [Google Scholar]
- 32.McKenna RM, Alcalá HE, Lê-Scherban F, Roby DH, Ortega AN. The Affordable Care Act reduces hypertension treatment disparities for Mexican-heritage Latinos. Med Care. 2017;55(7):654-660. doi: 10.1097/MLR.0000000000000726 [DOI] [PubMed] [Google Scholar]
- 33.Ladapo JA, Chokshi DA. Changes in cardiovascular care provision after the Affordable Care Act. Am J Manag Care. 2017;23(11):e366-e373. [PubMed] [Google Scholar]
- 34.Tajeu GS, Kent ST, Huang L, et al. Antihypertensive medication nonpersistence and low adherence for adults <65 years initiating treatment in 2007-2014. Hypertension. 2019;74(1):35-46. doi: 10.1161/HYPERTENSIONAHA.118.12495 [DOI] [PMC free article] [PubMed] [Google Scholar]
- 35.Tajeu GS, Kent ST, Kronish IM, et al. Trends in antihypertensive medication discontinuation and low adherence among Medicare beneficiaries initiating treatment from 2007 to 2012. Hypertension. 2016;68(3):565-575. doi: 10.1161/HYPERTENSIONAHA.116.07720 [DOI] [PMC free article] [PubMed] [Google Scholar]
- 36.Richardson S, Hirsch JS, Narasimhan M, et al. ; and the Northwell COVID-19 Research Consortium . Presenting characteristics, comorbidities, and outcomes among 5700 patients hospitalized with COVID-19 in the New York City Area. JAMA. 2020;323(20):2052-2059. doi: 10.1001/jama.2020.6775 [DOI] [PMC free article] [PubMed] [Google Scholar]
- 37.Killerby ME, Link-Gelles R, Haight SC, et al. ; CDC COVID-19 Response Clinical Team . Characteristics associated with hospitalization among patients with COVID-19—metropolitan Atlanta, Georgia, March-April 2020. MMWR Morb Mortal Wkly Rep. 2020;69(25):790-794. doi: 10.15585/mmwr.mm6925e1 [DOI] [PMC free article] [PubMed] [Google Scholar]
- 38.Yancy CW. COVID-19 and African Americans. JAMA. 2020;323(19):1891-1892. doi: 10.1001/jama.2020.6548 [DOI] [PubMed] [Google Scholar]
- 39.Muntner P, Shimbo D, Carey RM, et al. Measurement of blood pressure in humans: a scientific statement from the American Heart Association. Hypertension. 2019;73(5):e35-e66. doi: 10.1161/HYP.0000000000000087 [DOI] [PMC free article] [PubMed] [Google Scholar]
Associated Data
This section collects any data citations, data availability statements, or supplementary materials included in this article.
Supplementary Materials
eFigure 1. Flowchart showing the number of NHANES participants included in the current analyses
eFigure 2. Age-adjusted estimated percentage of adults with hypertension
eFigure 3. Age-adjusted estimated proportion of adults with hypertension who were aware they had hypertension (Panel A) and were taking antihypertensive medication among those who were aware (Panel B)
eFigure 4. Age-adjusted estimated percentage of US adults with hypertension defined using thresholds from the 2017 American College of Cardiology/American Heart Association blood pressure guideline
eFigure 5. Age-adjusted estimated proportion of adults with controlled blood pressure in a sensitivity analysis with blood pressure thresholds from the 2017 American College of Cardiology/American Heart Association blood pressure guideline
eFigure 6. Age-adjusted estimated proportion of US adults with hypertension, defined according to the 2017 American College of Cardiology/American Heart Association blood pressure guideline, who were aware they had hypertension (Panel A) and were taking antihypertensive medication among those who were aware (Panel B)
eTable 1. Percentage of adults with controlled blood pressure among those with hypertension who reported taking antihypertensive medication, overall and in sub-groups from 1999-2000 to 2017-2018
eTable 2. Factors associated with controlled blood pressure among US adults in 2015-2018 in a complete case analysis
eTable 3. Percentage of adults with hypertension who reported being aware they have hypertension, overall, and in sub-groups from 1999-2000 to 2017-2018
eTable 4. Percentage of adults who reported taking antihypertensive medication among those reported being aware that they have hypertension, overall and in sub-groups from 1999-2000 to 2017-2018
eTable 5. Factors associated with hypertension awareness and taking antihypertensive medication among US adults with hypertension in 2015-2018
eTable 6. Factors associated with hypertension awareness and taking antihypertensive medication among adults with hypertension in 2015-2018 in a complete case analysis