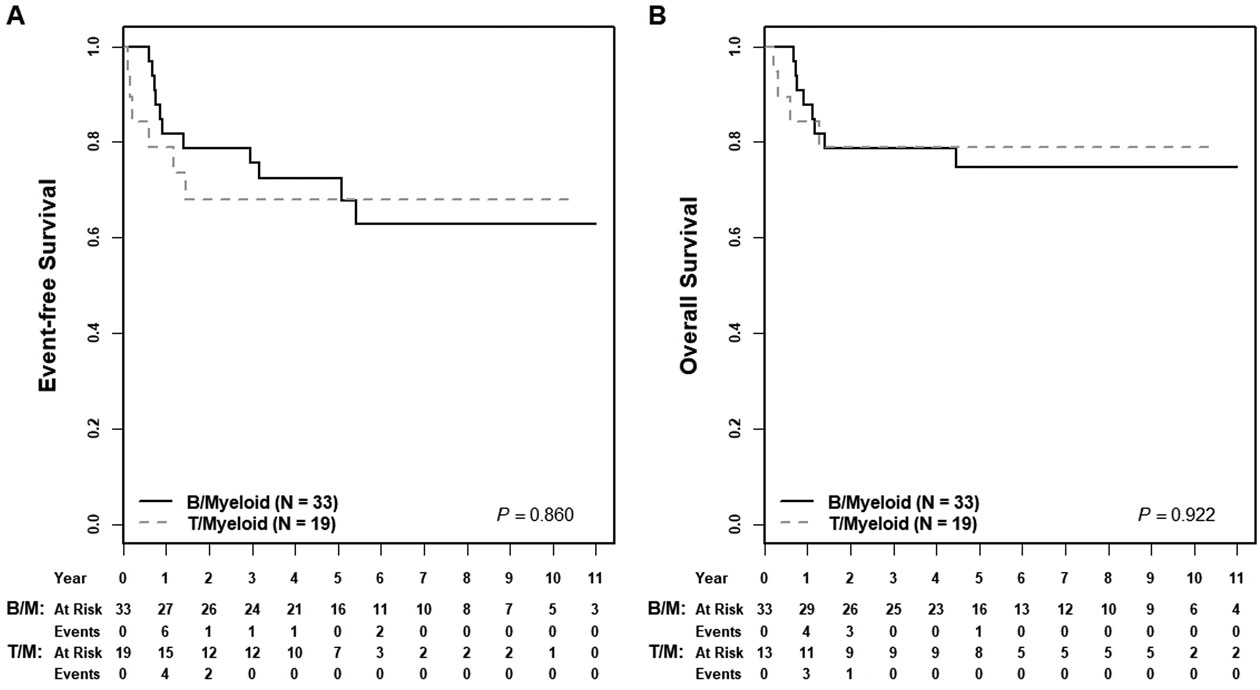
Figure 3: Association of MPAL phenotype and survival.

(A) Five-year EFS rates for B/Myeloid compared to T/Myeloid MPAL were 73±10% versus 68±15% (p=0.860); five-year OS rates were 75±9% versus 80±12% (p=0.922).

(A) Five-year EFS rates for B/Myeloid compared to T/Myeloid MPAL were 73±10% versus 68±15% (p=0.860); five-year OS rates were 75±9% versus 80±12% (p=0.922).