Background:
Treatment of cranial deformity is often performed during infancy in cases such as craniosynostosis and deformational plagiocephaly. To acquire morphologic standards for the treatment goals of these conditions, we created cranial average models and elucidated the growth patterns of the cranium of healthy infants in 3-dimension (3D) using homologous modeling.
Methods:
Homologous modeling is a technique that enables mathematical analysis of different 3D objects by converting the objects into homologous models that share the same number of vertices with the same spatial relationships. Craniofacial computed tomographic data of 120 healthy infants ranging in age from 1 to 17 months were collected. Based on the computed tomographic data, we created 120 homologous models. Six average 3D models (20 individuals each for 6 different age groups) were created by averaging the vertices of the models. Three-dimensional growth patterns of the cranium were clarified by comparing the 6 average models.
Results:
We successfully created 6 average models and visualized the growth patterns of the cranium. From 1-month-old to 5-month-old infants, the entire cranium except for the occipital region grows, and the cranium tended to be brachycephalic (cephalic index at 4–5 months: 87.1–97.3), but the growth was thereafter localized to specific areas.
Conclusions:
Three-dimensional growth patterns of the cranium of healthy infants were clarified. These findings will support the understanding and treatment of the conditions that cause cranial deformity. To our knowledge, this is the first report to visualize the growth patterns of the entire cranium of healthy infants in 3D.
INTRODUCTION
Treatment of cranial deformity is often performed during infancy in the cases such as craniosynostosis and deformational plagiocephaly. Currently, there are few morphologic standards for the treatment goals of these conditions.1–3 Our research was done to help solve this problem by creating average cranial models based on the computed tomographic (CT) data of 120 Japanese healthy infants.
We also clarified the growth patterns of the cranium in 3-dimension (3D). The size of the cranium grows to about 80% of adult’s size by the age of 2 years.4 Therefore, grasping the growth patterns of cranium in healthy infants is important for evaluation and treatment. So far, the infant’s cranial growth pattern has been investigated with measures such as direct measurement, X-ray photograph (Xp), CT, and 3D stereophotogrammetric scans.5–7 However, most of them express the cranial morphology with 2D values such as circumference and the ratio of length to width. The growth pattern of the cranium is complex, and there are various 3D features. In addition, areas and degree of growth at each age are not constant. Therefore, 3D analysis is indispensable to clarify the detailed growth patterns of the cranium.
We have been using homologous modeling for 3D analysis of the cranial morphology and have reported its usefulness.8 Homologous modeling is a technique that enables mathematical analysis of different 3D objects by converting the objects into homologous models that share the same number of vertices with the same spatial relationships. The analysis is performed by averaging and comparing the corresponding vertices across individual objects. It is mainly applied in the industrial field, so as to determine the size variation of clothes or to design the frames of eyeglasses.9–11 It can be similarly applied to the analysis of cranial morphology.
In this study, we successfully created 6 average cranial models for different age groups varying from 1 month to 17 months, based on the CT data of 120 healthy Japanese infants. Furthermore, we analyzed the area and degree of growth at each age and clarified the growth patterns of cranial morphology of healthy infants by comparing the average models.
METHODS
Patients
Craniofacial CT data of 120 infants ranging in age from 1 to 17 months (20 cases each for 6 different age groups) were collected. The division of age group was not even, considering the rapid growth at younger age and less dramatic change in size and morphology in the older groups (Table 1).
Table 1.
Details of Age Groups
| Group | Age (mo) | N |
|---|---|---|
| G1 | 1 | 20 |
| G2 | 2–3 | 20 |
| G3 | 4–5 | 20 |
| G4 | 6–8 | 20 |
| G5 | 9–11 | 20 |
| G6 | 12–17 | 20 |
CT data were obtained from the radiology database at the National Center for Child Health and Development (Tokyo, Japan) during the period 2014–2018. Infants with head trauma without fracture, impairment of consciousness due to acute infection, or ophthalmic disorders (such as strabismus and cataract) were included. Those with craniofacial bone fracture, epilepsy, intracranial tumor, history of chronic disease (such as chronic hepatitis), genetic abnormalities, and other conditions that may cause abnormality in cranial morphology were excluded.
CT Data Acquisition
We used a CT from General Electric (GE) Company (Discovery 750HD; GE Healthcare, Milwaukee, Wisc.). The scanning conditions were as follows: computed tomography dose index volume (CTDIvol): 28 mGy; tube voltage: 120 kVp; gantry rotation: 0.4 seconds; helical pitch: 0.531:1; and reconstructed slice thickness: 5 mm. The tube current setting was automatically controlled using the Auto-mA technique. The maximum tube current was set at 210 mA (noise index: 3.85). The reconstruction protocol for 3D construction was as follows: reconstructed slice thickness: 0.625 mm; iterative reconstruction: adaptive statistical iterative reconstruction (ASIR) (80%); and reconstruction kernel: standard.
Ethical Considerations
This project and use of CT data were approved by the Institutional Review Board (No. 1599).
Homologous Modeling
A method for creating a homologous model from CT data is described here. The first step is the segmentation of data. Image processing software (Mimics Research Edition version 18.0 and 3-matic Research Edition version 10.0; Materialise, Leuven, Belgium) was used to convert Digital Imaging and Communications in Medicine (DICOM) data to 3D voxel data. Cranial and facial bones, excluding the mandibular bone, were extracted using the “region growing” tool. Bone defects of fontanelle and cranial suture were filled using tools such as “wrapping” and “smoothing.” Voxel data were converted to STL file (Standard Triangulated Language; triangular mesh display of 3D image) to produce a uniform surface.
The next step is defining the landmarks. The cranial template model for this study was designed by Medic Engineering Corporation (Kyoto, Japan). It consists of 11,951 vertices and is tagged with 29–31 landmarks. “Template model” can be described as a “morphing meshwork” that can change its shape to fit the shape of different individuals. In the methodology of homologous modeling, single template model is prepared to fit the individual shapes of the entire sample, and the individual model thus created is called “homologous model.” On the CT data of 120 people, landmarks that spatially correspond to those of the template model were defined by mouse-clicking 3D image using software specifically designed to support homologous modeling (Body-Rugle; Medic Engineering Corporation, Kyoto, Japan).
The final step is fitting. Using homologous body modeling software (Markerless Homologous Body Modeling; Digital Human Technology Inc., Tokyo, Japan), the cranial template model was fitted to the individual 3D images. This is performed based on the 29–31 landmarks, and the rest of the vertices connecting the landmarks are also fitted to the individual model. Thus, the homologous model of that individual is created, having the 29–31 landmarks and 11,951 vertices that correspond spatially to those of the cranial template model (Fig. 1). One hundred twenty homologous models are created from the CT data of 120 individuals based on a single template model. Because all the 120 homologous models share the 11,951 vertices that spatially correspond to each other, analysis among individual objects is possible by averaging and comparing the corresponding vertices across objects.
Fig. 1.
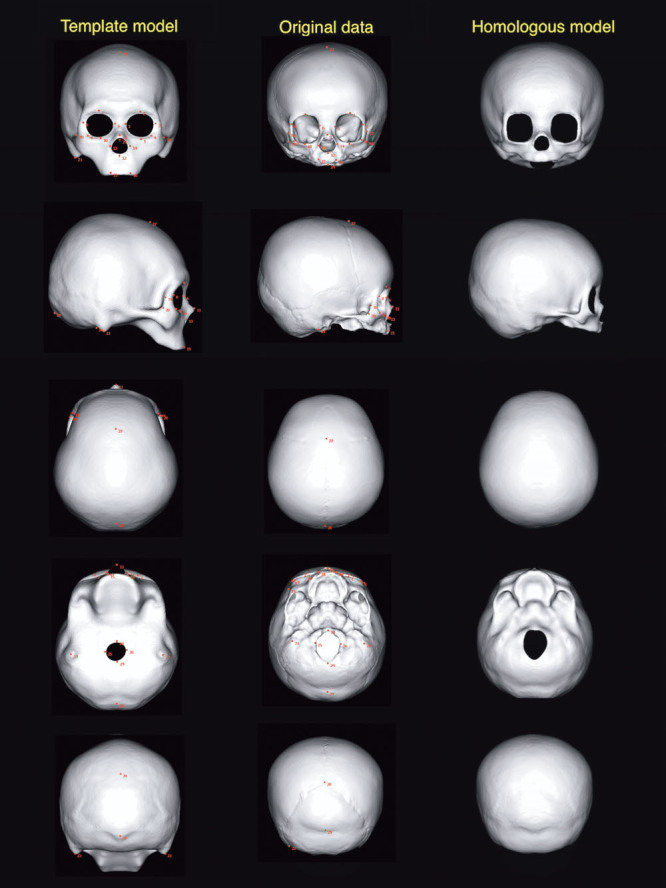
The template model, original voxel data (patient 3), and homologous model (the same patient), viewed in 6 directions. Red dots are landmarks defined in the process of homologous modeling.
Validation of Accuracy
To examine the accuracy of the homologous models, we superimposed the homologous model and the original CT data in 5 individuals. When superimposing the 2 images, the reference point (zero coordinate) was set at the intersection of the Frankfort plane and the coronal plane passing through the ear canal. The shortest interplanar distance in the perpendicular direction between the surfaces of the 2 images was displayed in heat maps.
Creation of Average Models and Extracting the Morphologic Changes Related to Growth
Statistical processing was performed for all vertices corresponding to individual homologous models. To create average models, the coordinate values of the corresponding vertices were averaged across 20 individuals within the same age group.
To clarify the degree of the morphologic variation within the same age group, the SD of the corresponding vertex of 20 craniums was computed and was shown in heat maps.
To enable comparison with the previous reports, 2D measurement values of the cranium (ie, circumference, length, and width) were measured on each average model of different age groups. Standard values for cephalic index (CI) (width/length × 100) were also calculated, which were defined in the range of −1 to +1 SDs.
To analyze the growth pattern, each average model was superimposed on the average model of the adjacent age group (ie, G1 average model versus G2 average model, G2 average model versus G3 average model). The area and the degree of morphologic change between the 2 age groups were expressed in the heat map. All the data preparation and processing were done by a single examiner (the first author).
RESULTS
Average Models
Figure 2 shows the average models of each age group.
Fig. 2.
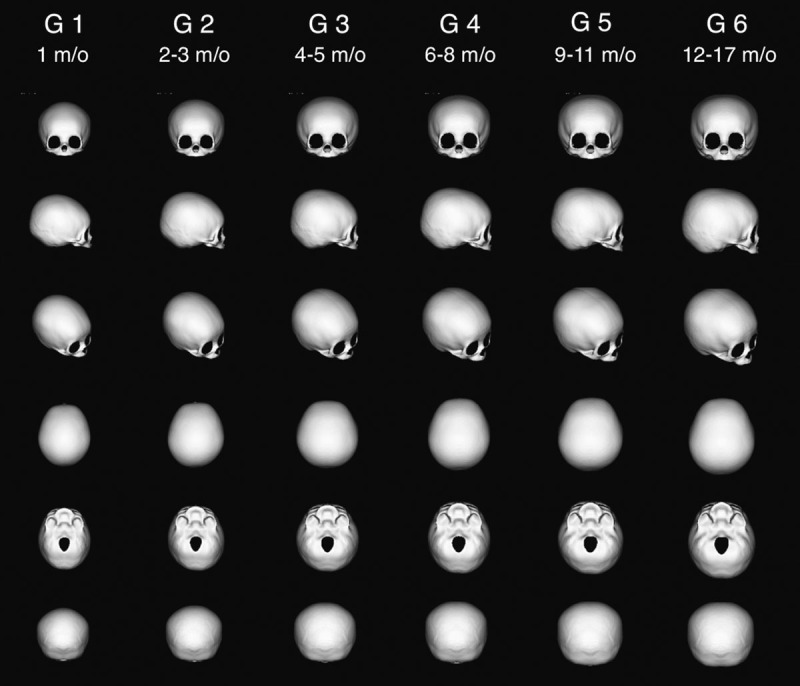
The average cranial models of 6 different age groups, viewed in 6 directions.
Degree of Morphologic Variation
Figure 3 is the heat map representing SD among the 20 individuals in each age group, which was about 5 mm or less except that for G6 (12–17 months old).
Fig. 3.

A lateral view of the heat map showing SD of 20 individuals in each age group. It was the largest in the occipital region of the average cranial model of G6; the others were about 5 mm or less.
Two-dimensional Parameters
Table 2 shows 2D measurement values of 6 average models. Based on the average and SD, standard values of CI for mesocephaly in different age groups are presented in Table 3. CI value is the highest in the 4- to 5-month-old age group.
Table 2.
Two-dimensional Measurement Values of Each Average Cranial Model
| Variables, Mean (SD) | Unit | G1 (1 mo) | G2 (2–3 mo) | G3 (4–5 mo) | G4 (6–8 mo) | G5 (9–11 mo) | G6 (12–17 mo) |
|---|---|---|---|---|---|---|---|
| Length | mm | 121.9 (3.9) | 128.1 (5.4) | 133.7 (4.6) | 141.6 (5.3) | 144.4 (6.0) | 150.4 (6.3) |
| Width | mm | 103.1 (5.0) | 111.6 (5.4) | 123.2 (4.5) | 123.4 (5.9) | 129.1 (6.7) | 131.3 (6.4) |
| Cephalic index | % | 84.6 (4.6) | 87.3 (5.4) | 92.2 (5.1) | 87.2 (4.9) | 89.4 (3.6) | 87.4 (5.4) |
| Circumference | mm | 357.7 (10.7) | 381.0 (13.0) | 407.1 (9.0) | 420.1 (12.7) | 432.4 (18.9) | 446.1 (14.4) |
Table 3.
Standard Value of CI
| Age (mo) | CI |
|---|---|
| 1 | 80.0–89.2 |
| 2–3 | 81.9–92.7 |
| 4–5 | 87.1–97.3 |
| 6–8 | 82.3–92.1 |
| 9–11 | 85.8–93.0 |
| 12–17 | 82.0–92.8 |
CI = width/length × 100.
Average head circumference of Japanese infants and circumference of our average models were compared (Fig. 4). Because our models do not incorporate soft tissues, the values were smaller in our data, but they were consistent with the growth curve.
Fig. 4.
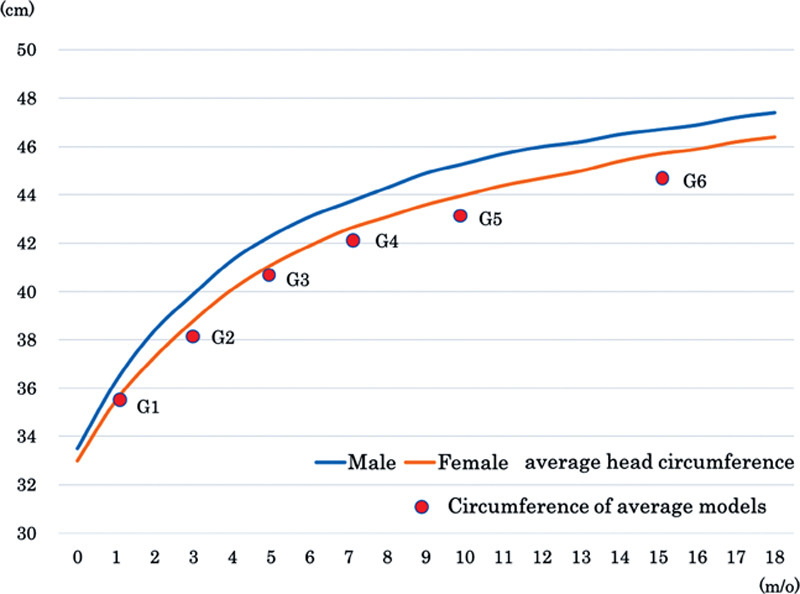
Comparison of average head circumference of Japanese infants and circumference of our average models. In our models, soft tissues are not incorporated and therefore values are smaller, but they are relatively consistent with the growth curves.
Growth Patterns of the Cranium
Growth patterns of the cranium in 3D were expressed with heat maps (Fig. 5). The larger the increase related to growth, the longer the interplanar distance, which is expressed in more reddish color.
Fig. 5.
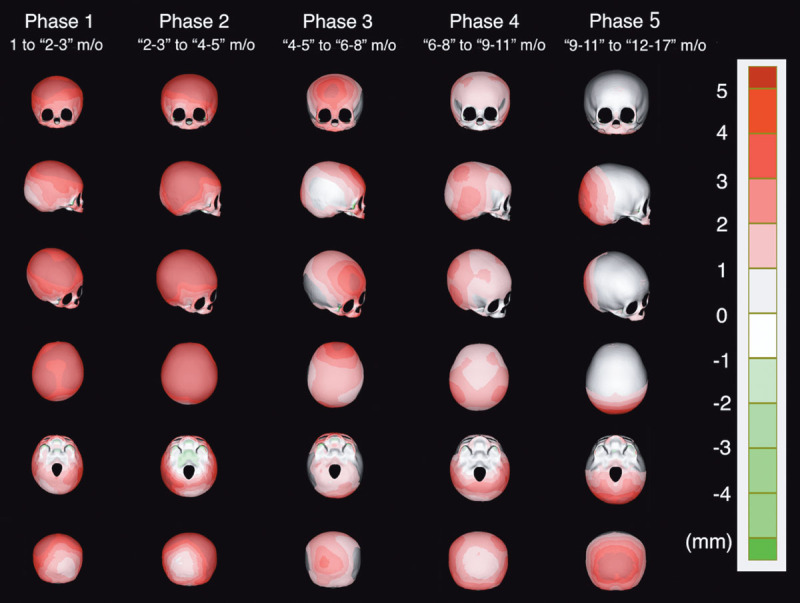
Heat map showing the shortest interplanar distance in the perpendicular direction between 2 average models of adjacent age groups. The larger the increase related to growth, the more reddish the color will be.
Table 4 shows the increase of 2D parameters between 2 average models of adjacent age groups. We identified the growing area of the cranium in each phase, from these heat maps and parameters (Table 5).
Table 4.
Absolute and Relative Increase of 2-dimensional Values between 2 Average Models of Adjacent Age Groups
| Variables: Absolute Increase (Relative Increase %) | Unit | Phase 1: G1–G2 | Phase 2: G2–G3 | Phase 3: G3–G4 | Phase 4: G4–G5 | Phase 5: G5–G6 |
|---|---|---|---|---|---|---|
| Length | mm | 6.2 (5.09) | 5.6 (4.37) | 7.9 (5.91) | 2.8 (1.98) | 6.0 (4.16) |
| Width | mm | 8.5 (8.24) | 11.6 (10.39) | 0.2 (0.16) | 5.7 (4.60) | 2.2 (1.70) |
| Cephalic index | % | 2.7 (3.19) | 4.9 (5.61) | -5.0 (-5.40) | 2.2 (2.52) | −2.0 (−2.24) |
| Circumference | mm | 23.3 (6.51) | 26.1 (6.85) | 13 (3.19) | 12.3 (2.93) | 13.7 (3.17) |
Table 5.
Growing Area of the Cranium in Each Phase
| Phase | Age (mo) | Growth Area of the Cranium |
|---|---|---|
| 1 (G1–G2) | 1 to “2–3” | Entire area except the occipital region |
| 2 (G2–G3) | “2–3” to “4–5” | Entire area except the occipital region |
| 3 (G3–G4) | “4–5” to “6–8” | Forehead and occipital region |
| 4 (G4–G5) | “6–8” to “9–11” | Posterior part of the temporal region |
| 5 (G5–G6) | “9–11” to “12–17” | Occipital region |
From “1 month old” to “4–5 months old” (phases 1 and 2), the relative increase of all 2D parameters (length, width, and circumference) is high, and the heat maps show the entire cranial growth (enlargement) except for the occipital region. From “4–5 months old” to “6–8 months old” (phase 3), only the relative increase of length is high, showing forehead and occipital growth. From “6–8 months old” to “9–11 months old” (phase 4), the relative increase of width is particularly high, showing growth of posterior part of the temporal region. From “9–11 months old” to “12–17 months old ” (phase 5), the relative increase of length becomes high again, and accordingly, growth is observed only in the occipital region.
Validation of Accuracy
Figure 6 shows heat maps in 4 directions (vertex, frontal, lateral, and inferior view), representing the deviation between the homologous model and the original voxel data. The white areas are where the deviation was <0.625 mm (the slice thickness of CT), which is the theoretical limit of accuracy. The average of deviation was the largest in the inferior view (0.390 mm). In the cranium, there was almost no deviation, and the data of the homologous model matched well with the original CT data.
Fig. 6.
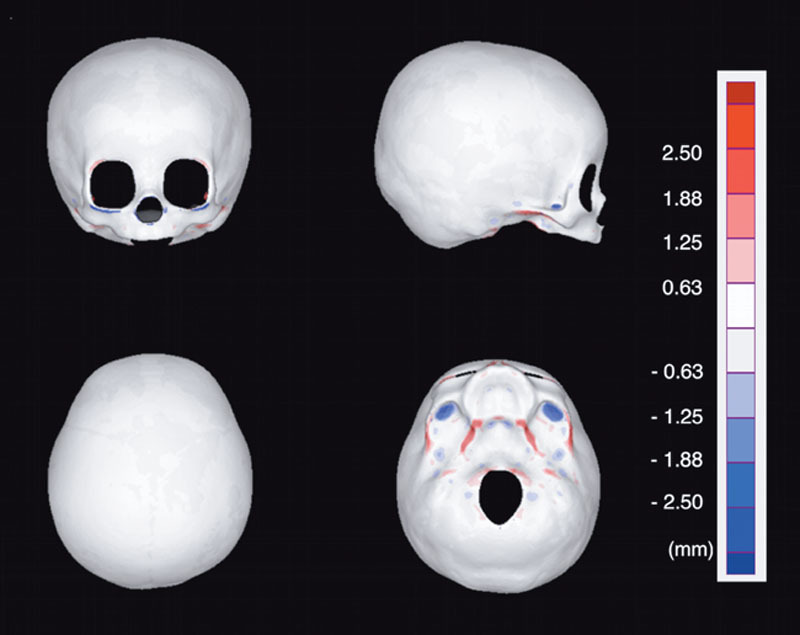
Heat map representing the deviation between the homologous model and the original voxel data. Deviation <0.625 mm (thickness of single CT slice) is shown with white. The average of deviation was the largest in the inferior view (0.390 mm). In the cranium, there was almost no deviation and the data of the homologous model matched well with the original CT data.
DISCUSSION
Advantages of Homologous Modeling
Homologous models are 3D images consisting of the same number of vertices. Because each vertex of different homologous models created from the same template model corresponds spatially, mathematical analysis such as comparison and averaging is possible. This technology was originally developed in the industrial field, and recently, it has been applied to the analysis of the human body in the medical field.12,13
We applied homologous modeling for the first time in the world to analyze the cranial morphology of infants. We previously reported the methodology for the 3D comprehensive analysis, such as creation of average cranial models and factor extraction, that characterizes cranial morphology using principal component analysis.8
The strong point of our method is that the homologous model has about 12,000 vertices, and all its vertices correspond spatially among homologous models of different individuals. As can be seen from the verification of the accuracy in the present report, the number of vertices is sufficient to accurately express the cranial morphology. Because all the vertices correspond spatially, creation of virtual cranial models such as average models and models that express the individual variations (such as +1 SD and +2 SD models) is possible by mathematical calculation of the coordinate values of vertices.14–16
Most of the previous studies that analyzed cranial morphology of healthy infants expressed the results as 2D values. Some of these are used as morphologic standards in the treatment of cranial deformity.1,3 But a 3D analysis may provide more details.
There have been several reports of 3D analysis on cranial morphology in the past. Marcus et al2 successfully created an average cranial model of healthy infants based on CT data by means of 3D vector analysis. The model consisted of >37,000 vertices. But there was no spatial correspondence among the vertices of the models, making comparison among the models difficult. Staal et al17 investigated the skulls of syndromic craniosynostosis. Sixty-six landmarks were set on the craniofacial CT and were analyzed by principal component analysis. However, the number of vertices is small to precisely represent the cranial morphology.
Our method overcomes these limitations. The 29–31 landmarks set in our method are used only as “anchors” to morph the template model to the individual cranium. The homologous models thus created consist of approximately 12,000 vertices, and statistical analysis is done on all of these vertices. Our methodology consists of a fewer number of landmarks with larger number of vertices, making analysis efficient but precise. The validity of our method was supported by the validation tests, and the 2D values calculated were consistent with the previous data.
Cranial Growth Pattern in Infancy
The present study clarified that the entire cranium grows except for the occiput in the early stage of infancy up to the age of 5 months, but later, there is a difference in the growth rate of growth in different areas of the cranium. Until phase 2 (up to the age of 5 months), the 2D relative increase is particularly high. This was in accordance with that reported by Meyer-Marcotty et al,7 in which longitudinal studies revealed that relative increase in early infancy in cranial length, width, vertex height, circumference, and volume was very high, and it decreased at the later phase.
Our study elucidated that the growth of the occipital region was slow in the early infancy. Under that influence, the cranium tends to be brachycephalic. This was also expressed by the highest CI value at 4–5 months of age group. Koizumi et al18 reported Japanese standard value of CI as 79.2–93.8 based on CT data of 100 children <3 years of age. Our result is in agreement with their data, but adds findings about the tendency to be brachycephalic at the age of 4–5 months with a larger number of cases.
Why is the growth of the occipital region slow in early infancy? We hypothesize that the answer is due to the external force, the cranium’s own weight on the area. In Japan, babies are commonly laid on their back (supine), and the occipital area is affected by its own weight, thus reducing the growth of the area at this period until the infant can roll over. A longitudinal cohort study by van Vlimmeren et al19 on cranial morphology of 248 babies supports this hypothesis. They reported that the deformational brachycephaly was the most severe at 6 months and the deformation improved thereafter, when the babies start to roll over and the influence of the weight of cranium was reduced. However, the growth patterns of the other areas found in our study cannot be explained only by the influence of the lifestyle and external forces. Especially the growth area after the age of 5 months is characteristically localized. Because the growth of the cranium is driven by the growth of the brain (internal force), the influence of growth pattern of the brain to that of the cranium cannot be ignored. We hypothesize that localized differences in brain growth lead to localized differences in cranial growth, especially in the late infancy period. Elucidation of this hypothesis is a future task.
Clinical Applications
Data on these cranial average models and growth patterns can provide treatment standards and strategies in the treatment of cranial deformities. By superimposing patient’s 3D CT data before and after treatment with an average model, morphologic abnormalities and changes can be visualized with heat maps. In addition, we may be able to customize helmets for the treatment of deformational plagiocephaly that take account of the local growth of the cranium or provide detailed prefabricated size variations of the helmets.
Future Tasks and Limitations
There are other important future tasks. For example, in the average cranial model of G6 (12–17 months of age), the SD of the 2D measurement value was small, but as shown in Figure 4, it is large in the 3D analysis. This means that individual differences in 3D morphology exist, which cannot be expressed by conventional 2D values. To analyze morphologic differences in 3D, we intend to apply principal component analysis to these homologous models. If we can elucidate the elements that determine the individual differences, we may be able to develop a novel classification of cranial morphology. These data will be a powerful guide in the treatment of cranial deformities, elucidating the pathology and screening of the diseases.
The main limitation of this study is the number of cases. One hundred twenty individuals from a single institution are not sufficient to represent the population norms.
The other limitation is that this is a cross-sectional study. Longitudinal study is ideal to elucidate the precise patterns of growth. But considering the limited availability of CT data of healthy individuals and the fact that this study involves the largest number of cases of the age group compared with the previous studies, the number of samples and methodology seem practically sufficient.
CONCLUSIONS
Using the homologous modeling, the 3D growth patterns of the cranium of healthy infants were clarified. Six average models for the different age groups ranging from 1 month to 17 months were created, based on 120 healthy Japanese infants. The cranium grows in the entire area except for the occiput until the age of 4–5 months, making the cranium most brachycephalic at this age. Topical difference in the rate of growth is seen thereafter, and the cranium changes more dolichocephalic. These findings will support the understanding and treatment of the conditions that cause cranial deformity. To our knowledge, this is the first report to visualize the growth patterns of the entire cranium of healthy infants in 3D.
ACKNOWLEDGMENTS
The authors thank Toyohisa Tanijiri at the Medic Engineering Corporation for technical assistance with the analysis. The authors also thank the radiologic technologist Rumi Imai for timely help in collection of samples.
Footnotes
Published online 18 August 2020.
Part of this study was presented at the World Society for Simulation Surgery (WSSS) Meeting 2018, Chicago, IL.
Disclosure: The authors have no financial interest to declare in relation to the content of this article. This study was supported by a grant for Regenerative Medicine in Pediatrics and Obstetrics (29-1) from the National Center for Child Health and Development.
REFERENCES
- 1.Imai K, Tajima S. The growth patterns of normal skull by using CT scans and their clinical applications for preoperative planning and postoperative follow-up in craniofacial surgery. Eur J Plast Surg. 1991;14:80 [Google Scholar]
- 2.Marcus JR, Domeshek LF, Loyd AM, et al. Use of a three-dimensional, normative database of pediatric craniofacial morphology for modern anthropometric analysis. Plast Reconstr Surg. 2009;124:2076–2084 [DOI] [PubMed] [Google Scholar]
- 3.Senoo T, Tokuyama E, Yamada K, et al. Determination of reference values for normal cranial morphology by using mid-sagittal vector analysis in Japanese children. J Plast Reconstr Aesthet Surg. 2018;71:670–680 [DOI] [PubMed] [Google Scholar]
- 4.Sgouros S, Hockley AD, Goldin JH, et al. Intracranial volume change in craniosynostosis. J Neurosurg. 1999;91:617–625 [DOI] [PubMed] [Google Scholar]
- 5.Waitzman AA, Posnick JC, Armstrong DC, et al. Craniofacial skeletal measurements based on computed tomography: part II. Normal values and growth trends. Cleft Palate Craniofac J 1992;29:118–128 [DOI] [PubMed] [Google Scholar]
- 6.Farkas LG, Forrest CR. Changes in anthropometric values of paired craniofacial measurements of patients with right coronal synostosis. Ann Plast Surg. 2006;56:427–430 [DOI] [PubMed] [Google Scholar]
- 7.Meyer-Marcotty P, Kunz F, Schweitzer T, et al. Cranial growth in infants—a longitudinal three-dimensional analysis of the first months of life. J Craniomaxillofac Surg. 2018;46:987–993 [DOI] [PubMed] [Google Scholar]
- 8.Kuwahara K, Hikosaka M, Kaneko T, et al. Analysis of cranial morphology of healthy infants using homologous modeling. J Craniofac Surg. 2019;30:33–38 [DOI] [PubMed] [Google Scholar]
- 9.Mochimaru M, Kouchi M, Dohi M. Analysis of 3-D human foot forms using the free form deformation method and its application in grading shoe lasts. Ergonomics. 2000;43:1301–1313 [DOI] [PubMed] [Google Scholar]
- 10.Kouchi M, Mochimaru M. Analysis of 3D face forms for proper sizing and CAD of spectacle frames. Ergonomics. 2004;47:1499–1516 [DOI] [PubMed] [Google Scholar]
- 11.Dohi M. Basic research for modeling the shape of clothes worn for apparel design. Int J Hum Cult Stud. 2017;27:26–32 [Google Scholar]
- 12.Kono K, Tanikawa C, Yanagita T, et al. A novel method to detect 3D mandibular changes related to soft-diet feeding. Front Physiol. 2017;8:567. [DOI] [PMC free article] [PubMed] [Google Scholar]
- 13.Inoue K, Nakano H, Sumida T, et al. A novel measurement method for the morphology of the mandibular ramus using homologous modelling. Dentomaxillofacial Radiol. 2015;44:20150062. [DOI] [PMC free article] [PubMed] [Google Scholar]
- 14.Mochimaru M, Kouchi M. Statistics for 3D human body forms. Proc Hum Factors Ergon Soc Annu Meet. 2000;44:852–855 [Google Scholar]
- 15.Allen B, Curless B, Popović Z, et al. The space of human body shapes. ACM Trans Graph. 2003;22:587 [Google Scholar]
- 16.Kent JT, Mardia KV, McDonnell P. The complex Bingham quartic distribution and shape analysis. J R Stat Soc Ser B (Statistical Methodol.) 2006;68:747–765 [Google Scholar]
- 17.Staal FC, Ponniah AJ, Angullia F, et al. Describing Crouzon and Pfeiffer syndrome based on principal component analysis. J Craniomaxillofac Surg. 2015;43:528–536 [DOI] [PubMed] [Google Scholar]
- 18.Koizumi T, Komuro Y, Hashizume K, et al. Cephalic index of Japanese children with normal brain development. J Craniofac Surg. 2010;21:1434–1437 [DOI] [PubMed] [Google Scholar]
- 19.van Vlimmeren LA, Engelbert RH, Pelsma M, et al. The course of skull deformation from birth to 5 years of age: a prospective cohort study. Eur J Pediatr. 2017;176:11–21 [DOI] [PMC free article] [PubMed] [Google Scholar]


