

Abstract
The extent to which the biology of oncogenesis and aging are shaped by factors that distinguish human populations is unknown. Hematopoietic clones with acquired mutations become common with advancing age and can lead to blood cancers1–10. Here we describe shared and population-specific patterns of genomic mutation and clonal selection revealed by 33,250 autosomal mosaic chromosomal alterations (mCAs) we ascertained from 179,417 Japanese participants in the BioBank Japan cohort and compared to analogous analyses of UK Biobank. In this long-lived Japanese population, mCAs were detected in more than 35.0% (s.e. 1.4%) of individuals older than 90 years, suggesting that such clones trend toward inevitability with advancing age. Japanese and Europeans exhibited key differences in the genomic locations of mutations in their respective hematopoietic clones; these differences anticipated the populations’ relative rates of CLL (which is more common among Europeans) and T-cell leukemia (more common among Japanese). Three different mutational precursors of CLL (including trisomy 12, 13q loss, and 13q CN-LOH) were 2–6x less common among the Japanese, suggesting that the Japanese and European populations differ in selective pressures on clones long before the development of clinically apparent CLL. Japanese and UK populations also exhibited very different rates of clones arising in B- and T-cell lineages, anticipating the relative rates of B- and T-cell cancers in these populations. We identified six new loci at which inherited variants predispose to mCAs that duplicate or remove inherited risk alleles, including large-effect rare variants at NBN, MRE11, and CTU2 (OR=28–91). Our results suggest that selective pressures on clones are modulated by factors specific to human populations, and motivate further genomic characterization of clonal selection and cancer in populations around the world.
Clonal hematopoiesis involving cells with genomic alterations commonly occurs in older individuals and confers risk of hematological malignancies and overall mortality1–10. Clones harbor diverse mutations– ranging from point mutations to whole-chromosome gains and losses – on every chromosome.
Though populations can differ greatly in their rates of various cancers, the genomic landscape of mosaicism in the absence of known cancer is currently unexplored outside of European-ancestry cohorts10–13.
Mosaic chromosomal alterations in Japan
We searched for mosaic chromosomal alterations (mCAs) in blood DNA microarray data from 179,417 participants in the BioBank Japan (BBJ) cohort, which was ascertained for 47 diseases14 (including 13 cancers found in 16.7% of participants; Methods). We ascertained mCAs by analyzing allele-specific hybridization intensities for 515,355 genotyped autosomal SNPs (Supplementary Table 1), analyzing these data with a recently developed approach that detects imbalanced abundance of an individual’s two inherited haplotypes by utilizing the long-range haplotype phase information that can be inferred from large population samples10 (Methods and Supplementary Note 1).
This analysis detected 33,250 autosomal mCAs (at FDR = 0.05) in 27,910 unique individuals (Fig. 1 and Supplementary Note 2). (The high rate of events, relative to a contemporaneous analysis of 482,789 UK Biobank (UKB) participants, reflects that BBJ participants were older (mean age at enrollment 62.8 years in BBJ vs. 57 years in UKB; s.d. 14.5 years, range 0–113 years) and a larger fraction were male (54.1% in BBJ vs. 45.8% in UKB)14.) Of these mutations, 5,233 were confidently classified as mosaic deletions, 10,431 as copy-neutral loss of heterozygosity (CN-LOH) events, and 4,044 as duplications (Fig. 2a and Supplementary Table 2); the remaining 13,452 events were present at cell fractions too low or spanned too few genotyping probes to confidently determine copy number (Supplementary Note 1). Some 4,156 individuals harbored two or more non-overlapping mCAs (Supplementary Table 3); analysis of mosaic cell fractions suggested that these events were usually present in distinct clones (Supplementary Note 3). The mCA detection rate was broadly consistent across genotyping arrays (Supplementary Table 4) and across cases of the 47 diseases systematically surveyed by BBJ (Supplementary Table 5); mCAs were strongly enriched (OR=1.93 (1.66–2.25), p=2.1×10⁻¹⁷) among individuals with hematological cancers at registry (i.e., at the time of DNA sampling) as expected from earlier work (Supplementary Note 4), but not among individuals with other illnesses.
Figure 1. Genomic locations of 33,250 autosomal mCAs detected in 27,910 unique BioBank Japan participants.
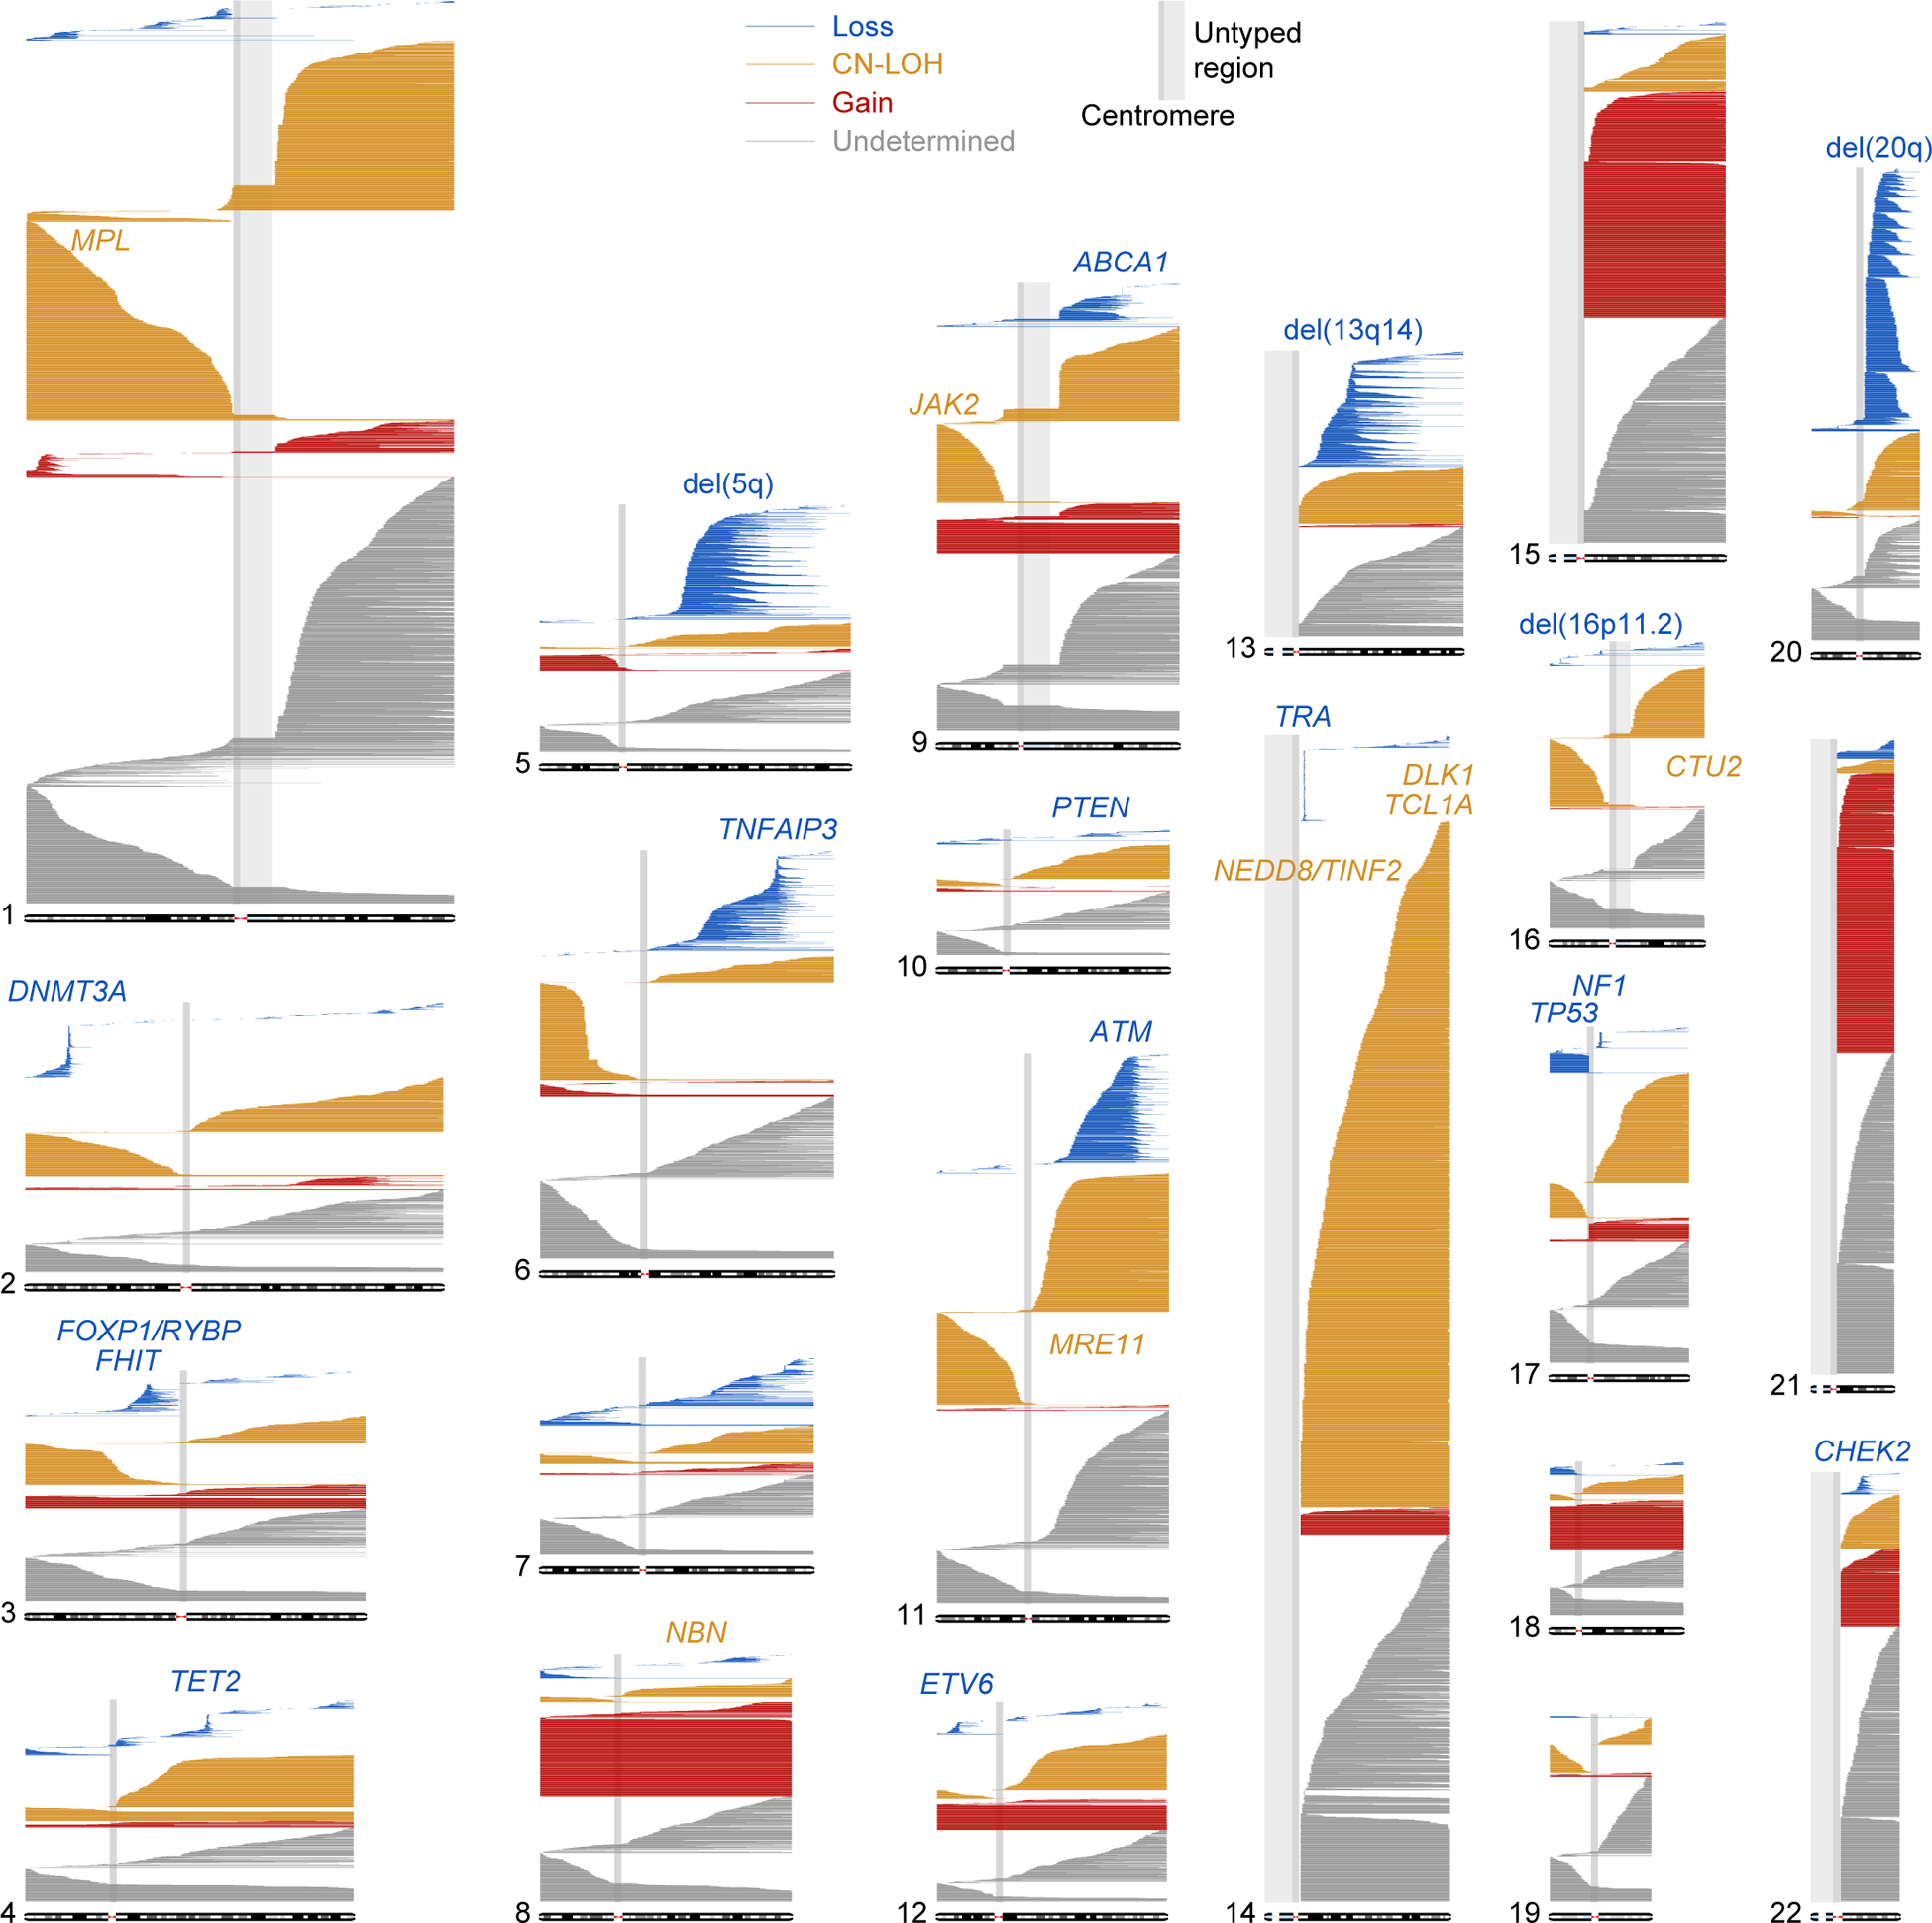
Loss, CN-LOH, and gain events are plotted as blue, orange, and red horizontal lines, respectively. Events with undetermined copy number are plotted in grey. Commonly deleted regions are labeled in blue; loci associated with CN-LOH mutations in cis are labeled in orange.
Figure 2. Classification of mCAs, frequency as a function of age, and comparison of genomic distributions between BBJ and UKB.
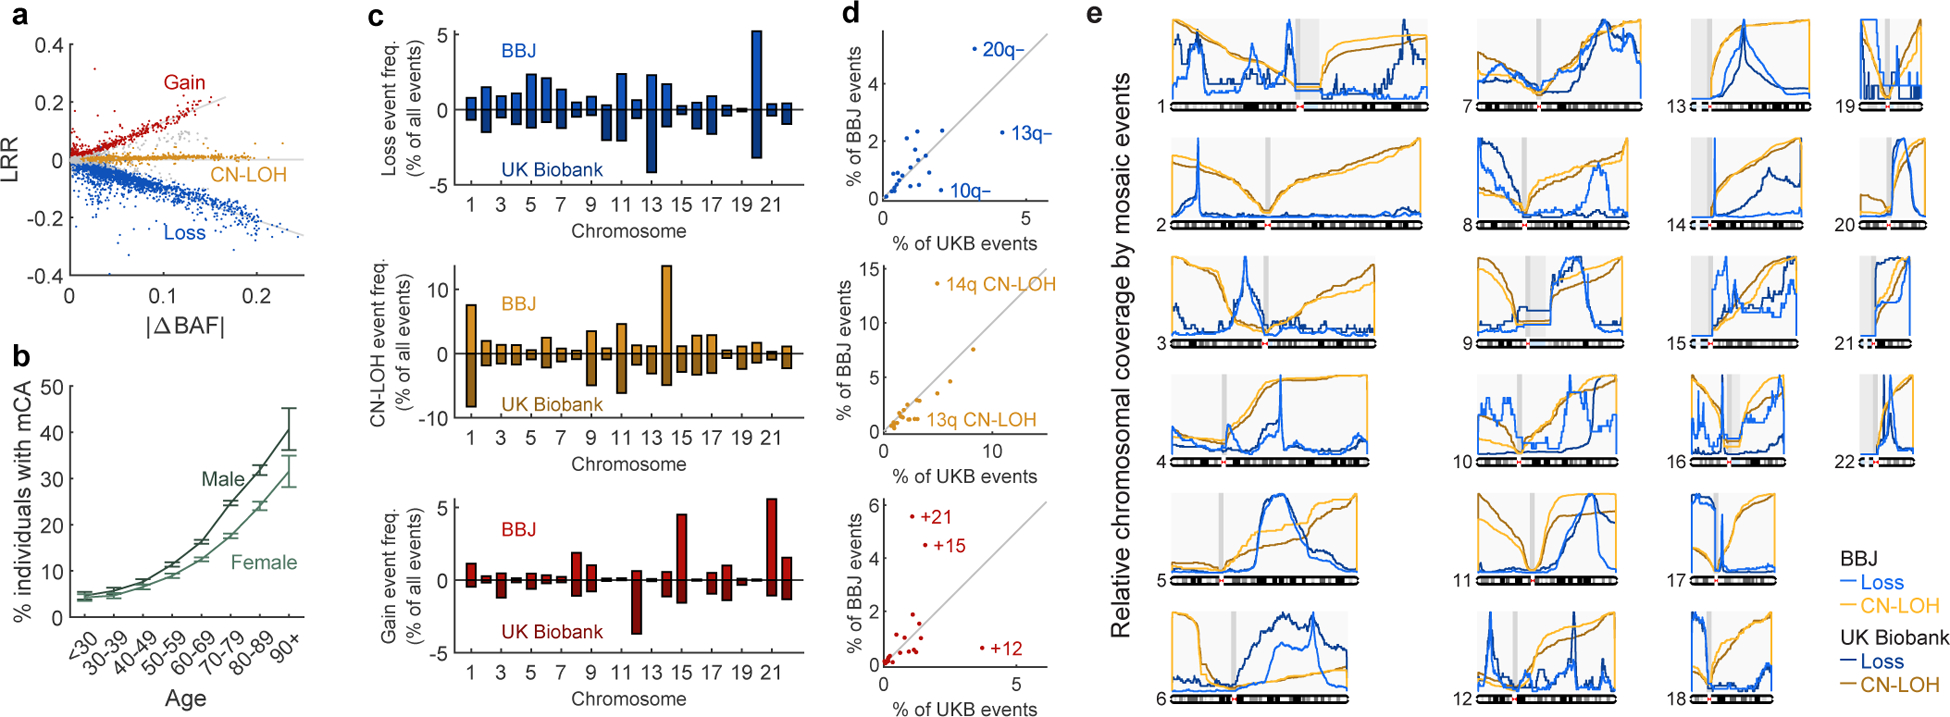
a. Classification of mCAs as loss, CN-LOH, or gain events using log R ratio (LRR, measuring total DNA abundance) and B allele frequency deviation from 0.5 (|ΔBAF|, measuring allelic imbalance; Methods). Unclassified events are indicated in grey.
b. Frequency of detectable mosaicism stratified by age and sex. Frequencies (means) and error bars for 95% CIs are indicated among 179,417 subjects analyzed.
c,d. Distribution of mCAs by chromosome and copy number in BioBank Japan and UK Biobank.
e. Chromosomal coverage of loss and CN-LOH events in BioBank Japan and UK Biobank. Curves indicate frequencies at which each chromosomal position is contained in loss (resp. CN-LOH) events, normalized to 1 on each chromosome.
Numeric data are provided in Supplementary Tables 6 and 13.
Inevitability of mCAs in the elderly
The long-lived Japanese population revealed that clonal hematopoiesis with mCAs becomes extremely common in the very old: detectable mosaicism reached 40.7% (standard error 2.3%) in males and 31.5% (standard error 1.7%) in females over the age of 90 (Fig. 2b and Supplementary Table 6), suggesting inevitability of mCAs in the elderly (Supplementary Note 4). Mosaic chromosomal alterations on different chromosomes and with different copy number changes exhibited various degrees of enrichment in males and in the elderly (Extended Data Fig. 1, Supplementary Tables 7–8 and Supplementary Note 4) and in individuals with anomalous blood counts (Supplementary Table 9), suggesting a spectrum of biological processes involved in the development of different clones.
Population differences in mCA distributions
To compare the genomic distributions of mCAs in the Japanese and UK populations, we co-analyzed BBJ mCAs together with 19,632 autosomal mCAs detected in parallel work15 on the UK Biobank (UKB) cohort16,17 (Fig. 2c–e and Supplementary Note 3 and 5, Supplementary Table 10).
The Japanese have a 10-fold higher incidence of adult T-cell leukemias18 and 5-fold lower incidence of chronic lymphocytic leukemia (CLL, a B-cell malignancy) compared to Europeans19,20. Our analysis indicated that, even among people without cancer, Japanese and UK populations have dramatically different rates of hematopoietic clones arising in the B- and T-cell lineages, as evidenced by deletions that report on V(D)J recombination in developing T and B lymphocytes and thus identify clonal expansions in the T- and B-cell lineages. Mosaic deletions at the TCR alpha locus on 14q (indicating clonal expansion in the T-cell lineage; Supplementary Note 5) were common in BBJ but rare in UKB (82% vs 11% of loss events on chr14 in BBJ and UKB, respectively); in contrast, deletions at the IGH and IGL immunoglobulin loci (indicating clonal expansion in the B-cell lineage) were common in UKB but rare in BBJ (5% vs 39% of loss events on chr14 and 2% vs 58% of loss events on chr22 in BBJ and UKB, respectively) (Fig. 2e and Supplementary Note 5). (We verified that these differences did not arise from differences in genomic coverage by the genotyping arrays used by BBJ and UKB (Extended Data Fig. 2).) Clones arising from the T-cell lineage (as evidenced by deletions at TRA) were also associated with elevated lymphocyte counts (Supplementary Tables 11–12). Thus, the differences in rates of B- and T-cell malignancies between Japanese and UK populations appear to be preceded by distinct relative rates of subclinical clonal expansions in these lineages.
mCAs affect the various human chromosomes at different frequencies. The frequency of CN-LOH varied across chromosome arms in a way that strongly correlated between BBJ and UKB (R=0.73, p=0.00013), with the exception of 14q (more common in BBJ) and 13q (more common in UKB) (Fig. 2c,d, Extended Data Fig. 3 and Supplementary Table 13). In contrast, the most common loss and gain events in each population (including 20q-, 13q-, 10q-, +21, +15, and +12 events) tended to be much more common in one population than the other (Fig. 2c,d and Supplementary Table 13).
A clear pattern among the most strongly population-differentiated mutations involved the 2- to 6-fold lower frequency in BBJ of +12, 13q-, and 13q CN-LOH events (Fig. 2d): all three mutations are commonly observed in CLL21,22 and in individuals who later develop CLL10. Considering the 4–5 times lower incidence of CLL in East Asians, the observation that all three of these precursor mutations are also less common in Japanese hematopoietic clones that have expanded to detectable cell fractions suggests that this population difference in CLL risk originates in reduced selective advantage for clones with (diverse) CLL precursor mutations. Consistent with this hypothesis, we observed that clonal sizes for these events tended to be lower in BBJ than UKB (Supplementary Note 3).
The sub-chromosomal distributions of mosaic deletion events were broadly similar between BBJ and UKB but exhibited a few notable differences (Fig. 2e, Supplementary Table 14 and Supplementary Note 5). Focal deletions frequently targeted DNMT3A, TET2, ETV6, NF1, and CHEK2, as in UK Biobank and previous studies1,2,5,6,10 (Fig. 1 and Fig. 2e). Interestingly, the CLL-related deletion region at 13q14 was less focal in BBJ than in UKB (Fig. 2e), involving longer deletions in a pattern more similar to the 20q, 5q, and 11q deletion regions. We also observed new focal deletion regions in BBJ: at FHIT on 3p, TNFAIP3 on 6q, ABCA1 on 9q, and PTEN on 10q (Fig. 2e, Supplementary Tables 15 and 16); FHIT, TNFAIP3, and PTEN are known tumor suppressor genes associated with blood cancers23–25.
Inherited risk variants for mCAs in cis
Recent work has established an inherited component of clonal hematopoiesis involving both common variants that slightly increase risk (of clones with any mutation)11–13,26 and rare variants that strongly predispose to developing clones with specific mCAs in cis10. The large number of mCAs detected among the Japanese, together with the presence of distinct low-frequency alleles in Japan, could enable detection of additional risk loci. To identify inherited variants associated with mCAs, we first performed association tests aimed at detecting CN-LOH events in cis that promoted clonal expansion by making risk alleles homozygous or removing them from the genome10 (the two-hit model27). We tested variants imputed into BBJ using the 1000 Genomes Phase 3 reference panel28 together with 1,037 sequenced Japanese samples29, setting a significance threshold of p<5×10⁻⁹ (Methods). We further performed binomial tests to determine whether each risk allele was consistently duplicated or removed by CN-LOH events (in individuals heterozygous for the risk allele, Methods).
We identified five new loci at which inherited variants associated with mosaic CN-LOH events in cis (we also replicated previously reported associations at JAK230–32 and MPL10) (Table 1, Extended Data Figs. 4–6 and Supplementary Note 6). Three of the new loci—NBN, MRE11, and CTU2—involved rare variants with large effects. At NBN, the rare stop-gained variant rs756831345 on 8q associated strongly (OR=91 (52–159), p=9.8×10⁻²³) with 8q CN-LOH events, which consistently made the NBN risk allele homozygous (p=0.00012; Table 1 and Extended Data Figs. 5 and 6). At MRE11, a very rare intronic variant (probably tagging a different causal variant; Supplementary Note 7 and Supplementary Table 17) on 11q associated strongly (OR=37 (17–84), p=2.6×10⁻⁹) with 11q CN-LOH events, which always made the MRE11 risk allele homozygous (p=0.016; Table 1 and Extended Data Figs. 5 and 6). Consistent with strong proliferative advantage in these clones, we observed that these rare risk alleles further associated with detection of multiple CN-LOH clones on the same chromosome arm (with different proximal breakpoints; Extended Data Fig. 7, Extended Data Table 1, and Supplementary Notes 3 and 6). NBN, MRE11, and RAD50 (which did not exhibit a similar association; Supplementary Table 18) encode the components of the MRN double strand break repair complex, which recruits ATM in response to DNA damage, leading to phosphorylation of p53 and CHK2 and initiation of cell cycle arrest, apoptosis, or DNA repair33. Together with the observations of focal deletions at ATM, TP53, and CHEK2 (Fig. 1) and rare ATM risk alleles for CN-LOH events in cis10, these results indicate a key role of DNA damage-response dysfunction in clonal selection.
Table 1.
Genome-wide significant associations between inherited variants and mosaic chromosomal alterations.
| Mosaic event | Locus | Chr | Pos | Variant | REF | ALT | AF | P | OR (95%CI) | Allelic imbalance in hets | |
|---|---|---|---|---|---|---|---|---|---|---|---|
| NREF:NALT | P | ||||||||||
| Novel associations with mCAs in cis | |||||||||||
| 8q CN-LOH | NBN | 8 | 90949282 | rs756831345 | C | A | 0.00061 | 9.8×10⁻²³ | 91 (52–159) | 0:14 | 0.00012 |
| 11q CN-LOH | MRE11 | 11 | 94160189 | 11:94160189 | G | A | 0.00011 | 2.6×10⁻⁹ | 37 (17–84) | 0:7 | 0.016 |
| 14q CN-LOH | NEDD8/TINF2 | 14 | 24711798 | rs28372734 | C | G | 0.073 | 1.0×10⁻¹¹ | 1.62 (1.42–1.85) | 58:176 | 5.2×10⁻¹⁵ |
| 14q CN-LOH | TCL1A | 14 | 96180242 | rs1122138 | C | A | 0.05 | 0.015 | 0.88 (0.79–0.98) | 231:107 | 1.3×10⁻¹¹ |
| 14q CN-LOH | DLK1 | 14 | 101175967 | rs10873520 | G | A | 0.30 | 7.1×10−39 | 1.38 (1.31–1.44) | 1121:689 | 2.5×10⁻²⁴ |
| 16q CN-LOH | CTU2 | 16 | 88781475 | rs200779411 | C | T | 0.00065 | 7.3×10⁻²⁰ | 28 (17–45) | 2:11 | 0.022 |
| Previously reported loci associated with mCAs in cis | |||||||||||
| 1p CN-LOH | MPL | 1 | 45444734 | rs560932816 | G | A | 0.00016 | 5.3×10⁻¹⁸ | 54 (30–100) | 14:0 | 0.00012 |
| 1 | 44074454 | rs190159566 | C | T | 0.0049 | 2.5×10⁻¹³ | 4.8 (3.4–6.7) | 29:6 | 0.00012 | ||
| 1 | 47704269 | rs556241419 | G | A | 0.000062 | 2.2×10⁻¹¹ | 81 (34–191) | 7:0 | 0.016 | ||
| 1 | 44579360 | rs184778092 | C | T | 0.00005 | 5.0×10⁻⁹ | 53 (22–128) | 6:0 | 0.031 | ||
| 9p CN-LOH | JAK2 | 9 | 5026293 | rs2183137 | A | G | 0.24 | 1.1×10⁻¹¹ | 1.68 (1.46–1.95) | 54:155 | 1.7×10⁻¹² |
| Novel associations with mCAs in trans | |||||||||||
| 14q CN-LOH | TERT | 5 | 1287194 | rs2853677 | A | G | 0.31 | 1.5×10⁻²² | 1.27 (1.21–1.33) | - | - |
| chr15 gain | MAD1L1 | 7 | 1975624 | rs12699483 | C | G | 0.42 | 6.9×10⁻²³ | 1.61 (1.46–1.77) | - | - |
Chr, chromosome. Pos, base pair position (hg19). REF, reference allele. ALT, alternate allele. AF, allele frequency in controls. P, association P-value. OR, odds ratio (using ALT as effect allele). N_REF (resp. N_ALT), number of individuals heterozygous for the variant in which a mosaic CN-LOH event in cis made the REF allele (resp. ALT allele) homozygous and removed the other allele. At the MPL locus, P-values for the second, third, and fourth SNPs are from stepwise conditional analysis (Methods); the four risk haplotypes are present in disjoint sets of 1p CN-LOH carriers. Analytic results using 173,599 subjects are shown. Subjects carrying other types of mCAs in the same chromosome are excluded from controls (Methods). Fisher’s exact test (two-sided) is used for the associations and binomial test (two-sided) is used for allelic imbalance associations in heterozygote subjects.
At CTU2, the rare missense variant rs200779411 associated strongly (p=7.3 ×10⁻²⁰, OR=28 (17–45)) with 16q CN-LOH events, which consistently made the CTU2 risk allele homozygous (p=0.022; Table 1 and Extended Data Figs. 5 and 6). CTU2 encodes a component of the cytosolic thiouridylase complex, which is required for maintenance of genome integrity34. The missense variant rs200779411 was predicted to be probably damaging by PolyPhen-235 and deleterious by SIFT36, suggesting that impaired CTU2 function may promote clonal expansion by reducing genome stability.
Inherited risk variants for mCAs in trans
To additionally detect inherited variants associated with mCAs in trans, we performed genome-wide association tests on each mCA type (classifying events by chromosome and copy number), setting a genome-wide significance threshold of p<5.7×10⁻¹¹ to account for multiple hypotheses tested (Methods). Two trans associations reached significance: common variants in MAD1L1 associated with gains on chromosome 15, and common variants in TERT (previously associated with mosaic JAK2 V617F mutation12) associated with 14q CN-LOH (Table 1, Extended Data Figs. 4 and 5, and Supplementary Note 6). At MAD1L1, a cluster of five SNPs in near-perfect linkage disequilibrium (including the missense variant rs1801368) associated (p=6.9 ×10⁻²³, OR=1.61 (1.46–1.77); Table 1 and Extended Data Fig. 5d) with chromosome 15 gain events (mostly full trisomies; Fig. 1). We replicated this association in the UK population with a slightly reduced effect size (p=5.1×10⁻⁴, OR=1.40 (1.16–1.69) for rs1801368). MAD1L1 encodes a component of the mitotic spindle assembly checkpoint (SAC) that ensures proper chromosome segregation37. The MAD1L1 risk allele was also previously observed to increase risk of mosaic Y chromosome loss13, consistent with a mechanism involving mis-segregation of chromosomes during mitosis due to impaired SAC function. Lending further support to this hypothesis, the risk haplotype was estimated to also increase risk for large (arm-level or whole-chromosome) gain events in 9 out of 10 chromosomes with at least 50 such events (binomial p=0.02; Supplementary Table 19).
Population-private mCA risk alleles
A comparison of the mCA risk loci detected in BBJ with previously-reported loci from UK Biobank10 revealed ways in which genetic background can differentially shape clonal hematopoiesis in different populations (Supplementary Note 6 and Supplementary Tables 20–23). Four of the risk variants we found in BBJ (at NBN, MRE11, NEDD8/TINF2, and CTU2) were present at much lower allele frequencies in Europeans38 (Supplementary Table 20). Conversely, all rare variants previously associated with mCAs in UKB (at MPL, FRA10B, ATM, and TM2D3/TARSL2)10 were absent from the 1000 Genomes Japanese WGS imputation panels, with the absence of FRA10B fragile alleles explaining the lack of 10q25.2-qter deletions in BBJ (Fig. 1). Notably, MPL variants were associated with 1p CN-LOH events in both BBJ and UKB despite most risk alleles in each cohort being population-private, demonstrating a shared path to mosaicism initiated by different variants in different populations.
mCAs and mortality in Japan
Clonal hematopoiesis has previously been linked to poorer health outcomes, with various types of mosaic events observed to increase risk of future blood cancers, mortality, and cardiovascular disease1–4,10,39. To dissect the link between mCAs and mortality, we analyzed mortality outcomes (including cause of death) available for ~72% of the cohort40 (Methods).
We observed a nearly five-fold increase in the risk of death due to leukemia (HR=4.70 (3.26−6.78); Extended Data Fig. 8, Extended Data Table 2, Supplementary Table 24, and Supplementary Note 8). The increased risk of leukemia mortality did not appear to extend to other hematological malignancies (malignant lymphoma and multiple myeloma; Extended Data Fig. 8 and Supplementary Table 24). We also did not observe significantly increased risk of cardiovascular mortality, suggesting that previous associations of clonal hematopoiesis (primarily involving point mutations in DNMT3A, TET2, JAK2, and ASXL1) with cardiovascular outcomes4,39 may be limited to specific mosaic events (Extended Data Fig 8 and Supplementary Table 24). To refine the association between mosaic status and leukemia mortality, we partitioned mosaic events by chromosome and copy-number change (Methods), identifying six mCAs with significant (p<0.05/88, Cochran-Mantel-Haenszel test), large effects on leukemia mortality risk (Extended Data Fig. 8b and Supplementary Table 25). Mosaic cell fraction and the number of mosaic events carried by an individual each associated with further increases in leukemia mortality risk (Fig. Extended Data Fig. 8c,d and Supplementary Tables 26–27). Mosaic status increased risk of overall mortality (HR=1.10 (1.05–1.16), p=2.7×10⁻⁵; Supplementary Table 24), an association that was driven by mCAs in chromosomes 9 and 14 (HR>1.4; Supplementary Table 28), underscoring the heterogeneity in clinical impact among different mCAs.
Discussion
Our study of hematopoietic clones with mCAs in Japan enabled the first detailed comparison of the genomic landscape of clonal hematopoiesis between populations, revealing broad overall similarities as well as important population differences. A clear pattern among these results was that population differences in cancer rates are preceded by population differences in sub-clinical clonal expansions, at multiple levels: (i) in specific cell lineages (including B- and T-cell lineages), and (ii) with specific cancer-associated mutations (the +12, 13q-, and 13q CN-LOH mutations that are hallmarks of CLL). These results point toward population differences in the clonal advantages that are gained by the same chromosomal mutations in different genetic and environmental contexts.
The interplay between acquired and inherited genetic variation in Japan enabled further insights into the influences of inherited variation on clonal hematopoiesis: population-specific variants at several risk loci pointed to a key role of maintenance of genomic integrity, with corroborating evidence from loci implicated by focal deletions. These results point toward the need for larger and more diverse cohorts in genomic studies of cancer and subclinical clonal expansions as well as inherited variation.
Methods
The BioBank Japan cohort
All the subjects analyzed in this study were participants of the BioBank Japan Project (BBJ). The BBJ is a multi-hospital-based registry that collected clinical information, DNA, and serum samples from approximately 200,000 patients with one or more of 47 target diseases (including 13 cancers) at a total of 66 hospitals between fiscal years 2003 and 200714. The case proportions correlated well with prevalence in the Japanese population and all of the study participants were diagnosed by medical doctors as described elsewhere14. We complied with all relevant ethical regulations. This project was approved by the ethics committees of RIKEN Center for Integrative Medical Sciences and the Institute of Medical Sciences, the University of Tokyo. Written informed consent was obtained from all of the participants.
Genotyping subjects in the BBJ
Subjects were genotyped in three batches using different arrays or set of arrays, namely: (1) a combination of Illumina Infinium Omni Express and Human Exome, (2) Infinium Omni Express Exome v1.0, and (3) Infinium Omni Express Exome v1.2 (Supplementary Table 1). The SNP content of the three methods was quite similar. DNA was obtained from blood samples for all but one individual (for which DNA was obtained from oral mucosa; this sample was negative for mosaic events).
We excluded outliers from East Asian clusters in a plot in which we projected BBJ subjects in combination with 1000 Genomes Project41 samples in the principal component (PC)1 and PC2 space. We also excluded samples genetically identical to another sample, samples with call rates less than 0.98, and samples whose reported sex information was not supported by genotypes in the X chromosome. We further excluded three samples with evidence of potential contamination (as suggested by low-cell-fraction mosaic events called on many chromosomes6,10), leaving 179,417 samples for analysis. We used plink1.9 software42 to handle the genotyping data.
Genotyping intensity data used for calling mosaic events
To call mosaic events, we analyzed genotyping intensity data for variants in the intersection of the three primary arrays used for BBJ genotyping (namely, Illumina Infinium Omni Express and Infinium Omni Express Exome v1.0 and v1.2) to allow analysis of the same set of variants in all individuals (to avoid the possibility of differing detection sensitivity across batches due to different numbers of genotyping probes analyzed). When calling mosaic events, we did not include variants typed on the Human Exome array in some samples (see above) to minimize the potential for batch effects arising from different arrays. We did use variants from the Human Exome array in genetic association analyses (see below) since association tests are robust to genotyping heterogeneity when potential confounders are appropriately controlled by correcting for batch covariates and principal components.
Calculation of BAF and LRR from genotype intensity
We computed B allele frequency (BAF) and log R ratio (LRR) values with the use of the BBJ genotyping intensity data43. We modified previous methods used by Jacobs et al1 and Loh et al10 to fit the current data set. We computed LRR and BAF values in an array-basis in which all of the subjects genotyped in the same arrays were clustered together. Details are provided in the Supplementary Note 1.
Phasing of genotype data for calling mosaic events
We phased the filtered genotypes mentioned above with the use of Eagle2 software44 which enabled us to conduct accurate long-range phasing. This phasing information was used for calling mosaic events (Supplementary Note 1).
Filtering possible non-mosaic trisomy or monosomy events
We excluded chromosomes with mean LRR more than 0.2 or mean LRR less than −0.5 (possible trisomy and monosomy, respectively, Supplementary Note 1).
Calling mosaic events with the use of BAF and LRR
We used the same method to call mosaic events as Loh et al10. This calling method is composed of the following steps: (1) filtering constitutional duplications; (2) evaluating phased BAF for variants on each chromosome using a parameterized hidden Markov model; (3) calling existence of events using a likelihood ratio test; (4) calling event boundaries; (5) calling copy number; (6) filtering remaining possible constitutional duplications; (7) estimating cell fraction of mosaic events. Details of each step are provided in the Supplementary Note 1.
Associations between array batches or disease status at registry and detectable mosaicism
We conducted logistic regression analyses to evaluate associations between detectable mosaicism and 1) array batches or 2) disease status at registry of the BBJ (47 diseases, a binary trait for each of the diseases). For array batches (Supplementary Table 4), we put mosaic detection status as a dependent binary variable and age, sex, smoking, genotyping arrays, and 10 principal components as independent variables. For disease status at registry (Supplementary Table 5), we put disease presence as a dependent variable and presence of mosaic events, age, sex, genotyping arrays, and 10 principal components as independent variables.
Associations between hematological traits and mosaic events
We extracted data from the BBJ of 13 hematological traits, namely, red blood cell count, hemoglobin, hematocrit, mean corpuscular volume, mean corpuscular hemoglobin, mean corpuscular cell hemoglobin, white blood cell count, neutrophil count, lymphocyte count, monocyte count, eosinophil count, basophil count and platelet count. Associations between 13 hematological quantitative traits and presence of 88 types of mosaic events (see below) were analyzed in logistic regression models with event presence as outcomes. Before analysis in logistic models, the 13 traits were regressed out by covariates specified in the previous BBJ study45 for males and females. Residuals were normalized and used as independent variables one by one (a total of 13 models for each mCA). In each logistic model, disease status at registry (for each of the 47 diseases in the BBJ study design), age, sex, smoking, genotyping arrays, and 10 principal components were used as covariates. We took this approach to avoid effects of covariates associated with both mCAs and hematologic traits.
We subdivided mosaic events by copy-number state (loss, CN-LOH, gain) and by p vs. q arm for loss and CN-LOH events. To reduce multiple testing burden, we restricted analyses to mosaic events with more than 20 carriers (Supplementary Table 2). As a result, 88 mosaic events were analyzed in association with 13 hematologic traits. The statistical significance threshold was set at p<0.05/88/13 (4.4×10⁻⁵); results are reported in Supplementary Table 9.
Comparison of mosaic frequency between BBJ and UKB
We co-analyzed BBJ mosaic calls with mosaic calls in UKB from 482,857 individuals15. We calculated frequencies of mosaic events subdivided by chromosome arm and copy number among all mosaic events in both data sets. We assessed correlation of event frequencies in the two data sets using Spearman’s correlation coefficient.
Relative coverage of the genome by mosaic events in BBJ and UKB
We determined mosaic coverage as follows. We divided chromosomes into 0.1Mb bins and calculated the fraction of loss (respectively, CN-LOH) events covering each bin to compute mosaic coverage. We scaled the coverage in each mosaic type in each chromosome (to set maximum coverage as 1). We compared mosaic coverage in BBJ and UKB using Pearson’s correlation coefficient.
Genomic coverage by genotyping arrays in BBJ and UKB
We computed mean numbers of heterozygous genotyped sites across individuals in each 1Mb region of the genome for the BBJ and UKB genotyping arrays to confirm difference in mosaic frequency between the two populations were not driven by different coverage of the genome by DNA microarrays.
Association between mosaic events indicating T-cell expansions and lymphocyte counts
We used a Wilcoxon rank sum test to compare lymphocyte counts between subjects carrying TRA deletions (indicating clonal expansions of T-cells) and subjects without TRA deletion. We also evaluated Spearman correlation between cell fraction of TRA deletions and lymphocyte counts.
Distribution of breakpoints of CN-LOH in BBJ and UKB
We computed relative frequencies of estimated CN-LOH breakpoint locations in each chromosome in BBJ and UKB. We smoothed breakpoints over +/−2Mb and rescaled to 1.
Genes affected by focal deletion
We evaluated importance of genes by taking numbers of gene involved in loss events into account. We counted the number of genes involved in each loss event and defined a score of each loss event as one divided by the number of genes (i.e., when a loss event contained only one gene, the gene received a score of 1). We summed up scores of all loss events containing each gene. To pick up genes frequently involved with focal deletions only in the Japanese, we identified genes covered by at least 5% of loss events in a chromosome, having a 10-fold larger score in BBJ than in UKB, and scoring more than 0.5.
Genetic association studies
We excluded subjects showing high degree of kinship (1st-degree or closer as detected by plink42) with other subjects, leaving 173,599 subjects for genetic association studies. Among related pairs, we retained subjects having mosaic events. We also integrated the genotyping data used for calling mosaic events with genotyping data from additional variants typed on the Human Exome Array in some samples when also available on the Omni Express Exome Arrays in other samples (Supplementary Table 1) to maximize the number of variants used for imputation. (We did not integrate these data at the stage of calling mosaic events to minimize the potential for batch effects.) We phased the integrated data using Eagle2 software46. The phased genotypes were imputed using a reference panel containing 2,504 1000 Genomes Phase 3 samples and 1,037 Japanese high-depth (30x) whole-genome sequencing samples (Data set 1 of ref.29) using Minimac3 software47. Variants imputed with R2>0.3 were used for the association studies. We filtered variants with minor allele count less than 5. Best guess data was used to conduct Fisher’s exact tests using plink software (plink --fisher --ci 0.95). We used Fisher’s exact test to prevent inflated type I error when testing associations between rare variants and rare mosaic events48. To confirm that significant associations were not driven by confounding factors, we re-analyzed significant associations (detected by Fisher’s exact test) in logistic regression with and without covariates (10 principal components, disease status at registry, age, sex, smoking and genotype batches) and verified that the associations were robust. We used GWAS array genotyping data if available to rescue rare variants not included in the reference panel, not well-imputed or with low allele frequency. As a result, 26.6 million variants were used for association studies.
We analyzed mosaic events in each chromosome as distinct phenotypes, treating loss, CN-LOH and gain separately. In order to maximize power to identify significant associations with CN-LOH, we included unclassified “likely CN-LOH” events extending to one telomere with |LRR|<0.02 when testing variants for association with CN-LOH events. We subdivided loss and CN-LOH events in each chromosome into p-arm and q-arm events. We set a threshold of at least 20 event carriers to consider an event in genetic association studies. This led to a total of 88 copy number-chromosome pairs analyzed (Supplementary Table 2). We tested each of these phenotypes for association with variants in cis (i.e., on the same chromosome and contained within a mosaic event) or trans (i.e., on any chromosome). For cis associations, we also conducted allelic imbalance analyses to assess whether one of the alleles at each variant was preferentially duplicated by mosaic CN-LOH events. Details of each test and corresponding significance thresholds are described in Supplementary Note 6.
At significantly-associated loci, we additionally performed stepwise conditional analyses (by iteratively removing carriers of high-risk rare alleles) to test for additional independently-associated variants.
Associations between risk variants and presence of multiple CN-LOH clones with different breakpoints
In a small fraction of individuals, we detected evidence of multiple clonal expansions of CN-LOH events affecting the same chromosome arm but with different breakpoints. To detect such events, we applied a modified hidden Markov model as described previously10 (Supplementary Note 3). Briefly, this analysis searched for evidence of CN-LOH with increasing BAF deviation toward the telomere. We evaluated associations between presence of risk variants found above and presence of single vs. multiple breakpoints among individuals with CN-LOH spanning the variants using Fisher’s exact test. Details are described in Supplementary Note 6.4.6 (“Multiple breakpoints driven by rare penetrant variants”).
Associations between mosaic events and mortality
The BBJ project has follow-up data to survey mortality and cause of death40. A total of 141,612 BBJ subjects who have one of 32 out of 47 diseases were prospectively followed up (~10 years) after DNA collection. For subjects who died, further detailed surveillance was made to identify causes of death coded by ICD10 by accessing national vital registration system used for input survey of medical and social welfare at Ministry of Health, Labor, and Welfare Japanese Government.
We restricted subjects to those who were followed at least one year after registry and free from malignancy at blood collection. We found 86,546 subjects in the current study were included in the follow-up data for mortality. Among them, 16,812 deaths were recorded during the follow-up period. The average follow-up period was 7.6 years (median 8.3 years, s.d. 2.8 years).
Associations between mortality (overall or specific causes) and presence of mosaic events (regardless of mosaic types) were analyzed as an initial evaluation. We analyzed overall mortality, hematopoietic malignancy mortality and non-hematopoietic malignancy mortality. We compared subjects with mosaic events (loss, CN-LOH, or gain) at cell fraction ≥1% to subjects without mosaic events on any chromosomes. Cox regression analysis was used for the analyses conditioning for age, agê2, sex, disease status, genotyping array and smoking. We used follow-up period as censoring factor. When we analyzed specific causes of death (e.g., non-hematopoietic malignancy), we only used subjects whose deaths were not reported during follow-up as controls to use consistent control samples across analyses. We used significance thresholds based on Bonferroni’s correction (based on the number of tested mortality phenotypes).
After evaluating associations between mortality phenotypes and presence of any mosaic event in any chromosome, we searched for associations between specific mosaic event types and mortality. We analyzed the same set of 88 mosaic event types (defined by copy-number state and chromosomal location) we used when testing associations with hematological traits and inherited variants. In these analysis of associations between mortality phenotypes and specific mosaic types, we divided subjects based on age, sex and smoking status and computed associations using Cochran-Mantel-Haenszel tests to avoid inflation of statistics arising from small number of subjects carrying mosaic events. We set a significance level based on Bonferroni’s correction (p<0.00057, 0.05/88).
We also analyzed cardiovascular mortality (defined as ischemic heart diseases and ischemic stroke) as previous studies have reported associations between mosaic point mutations and cardiovascular outcomes.
Definition of cancers based on ICD10 codes for causes of death
We categorized causes of death to decrease multiple testing burden. Hematopoietic malignancy was defined by ICD10 codes of C81-C96 and D45, 46 and D47. Leukemic diseases were defined by ICD10 codes of C91-C96, D45 and D46. Malignant lymphoma was defined by ICD10 codes of C81-C88. Multiple myeloma was defined by C90. Cancers were defined as ICD10 codes starting with “C” together with hematopoietic malignancies defined not starting with “C”. We did not regard other ICD10 codes starting with “D” as cancer since most of them are benign tumors.
Associations between multiple mosaic events and mortality
We extended the mortality analyses to investigate the effect of multiple mosaic events within a single individual. We limited analyses to subjects with at most three mosaic events. We divided subjects into three groups: (1) subjects without mosaic events, (2) subjects with a single mosaic event, (3) subjects with multiple mosaic events (2 or 3 mosaic events in different chromosomes). We analyzed an association of presence of multiple mosaic events with leukemia mortality in comparison with presence of a single mosaic event. The analyses conditioned on age, sex, disease status, genotyping array and smoking status.
Associations between cell fraction of mosaic events and mortality
We also extended the mortality analyses to investigate the effect of mosaic cell fraction. For subjects with multiple mosaic events, we took the highest cell fraction. We divided subjects into categories according to cell fraction of mosaic events and analyzed associations between cell fractions and outcomes with which presence of mosaic events were significantly associated.
Extended Data
Extended Data Fig.1|.
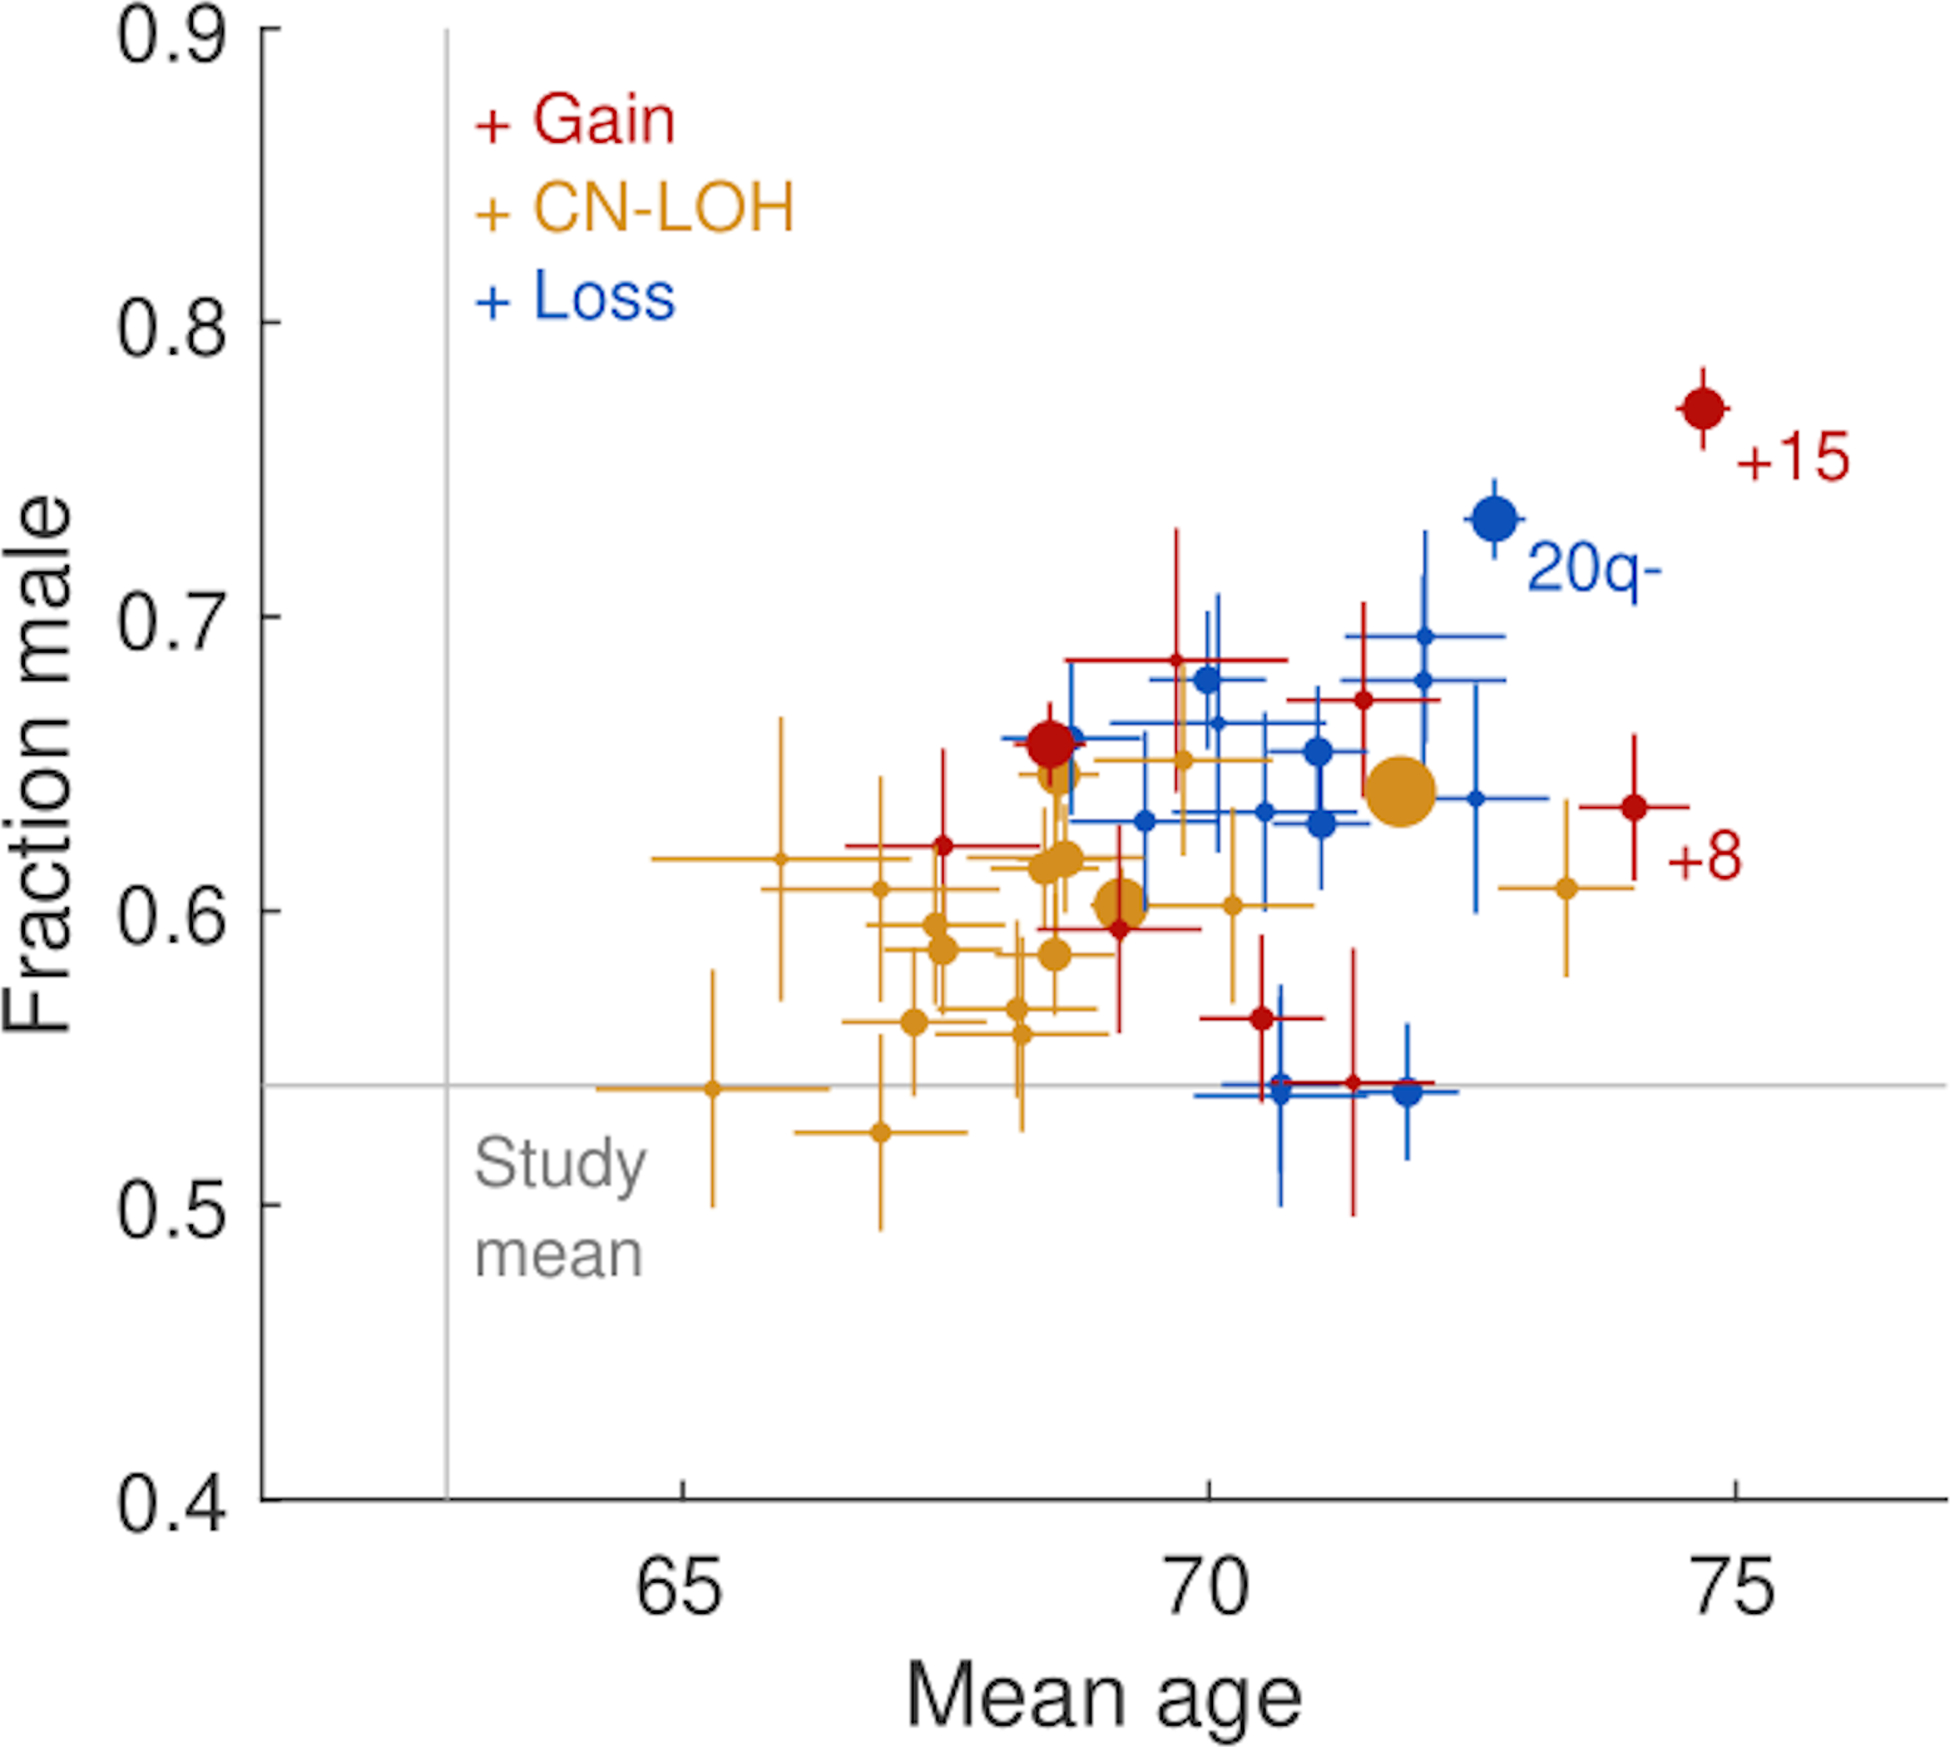
Age and sex of carriers of mosaic event types.
Mean age and sex of carriers of specific mCA types (defined by chromosome and copy number) with at least 100 carriers in the 179,417 subjects. Marker sizes are proportional to mCA frequencies. Error bars, s.e.m. Numeric data are provided in Supplementary Table 7.
Extended Data Fig.2|.
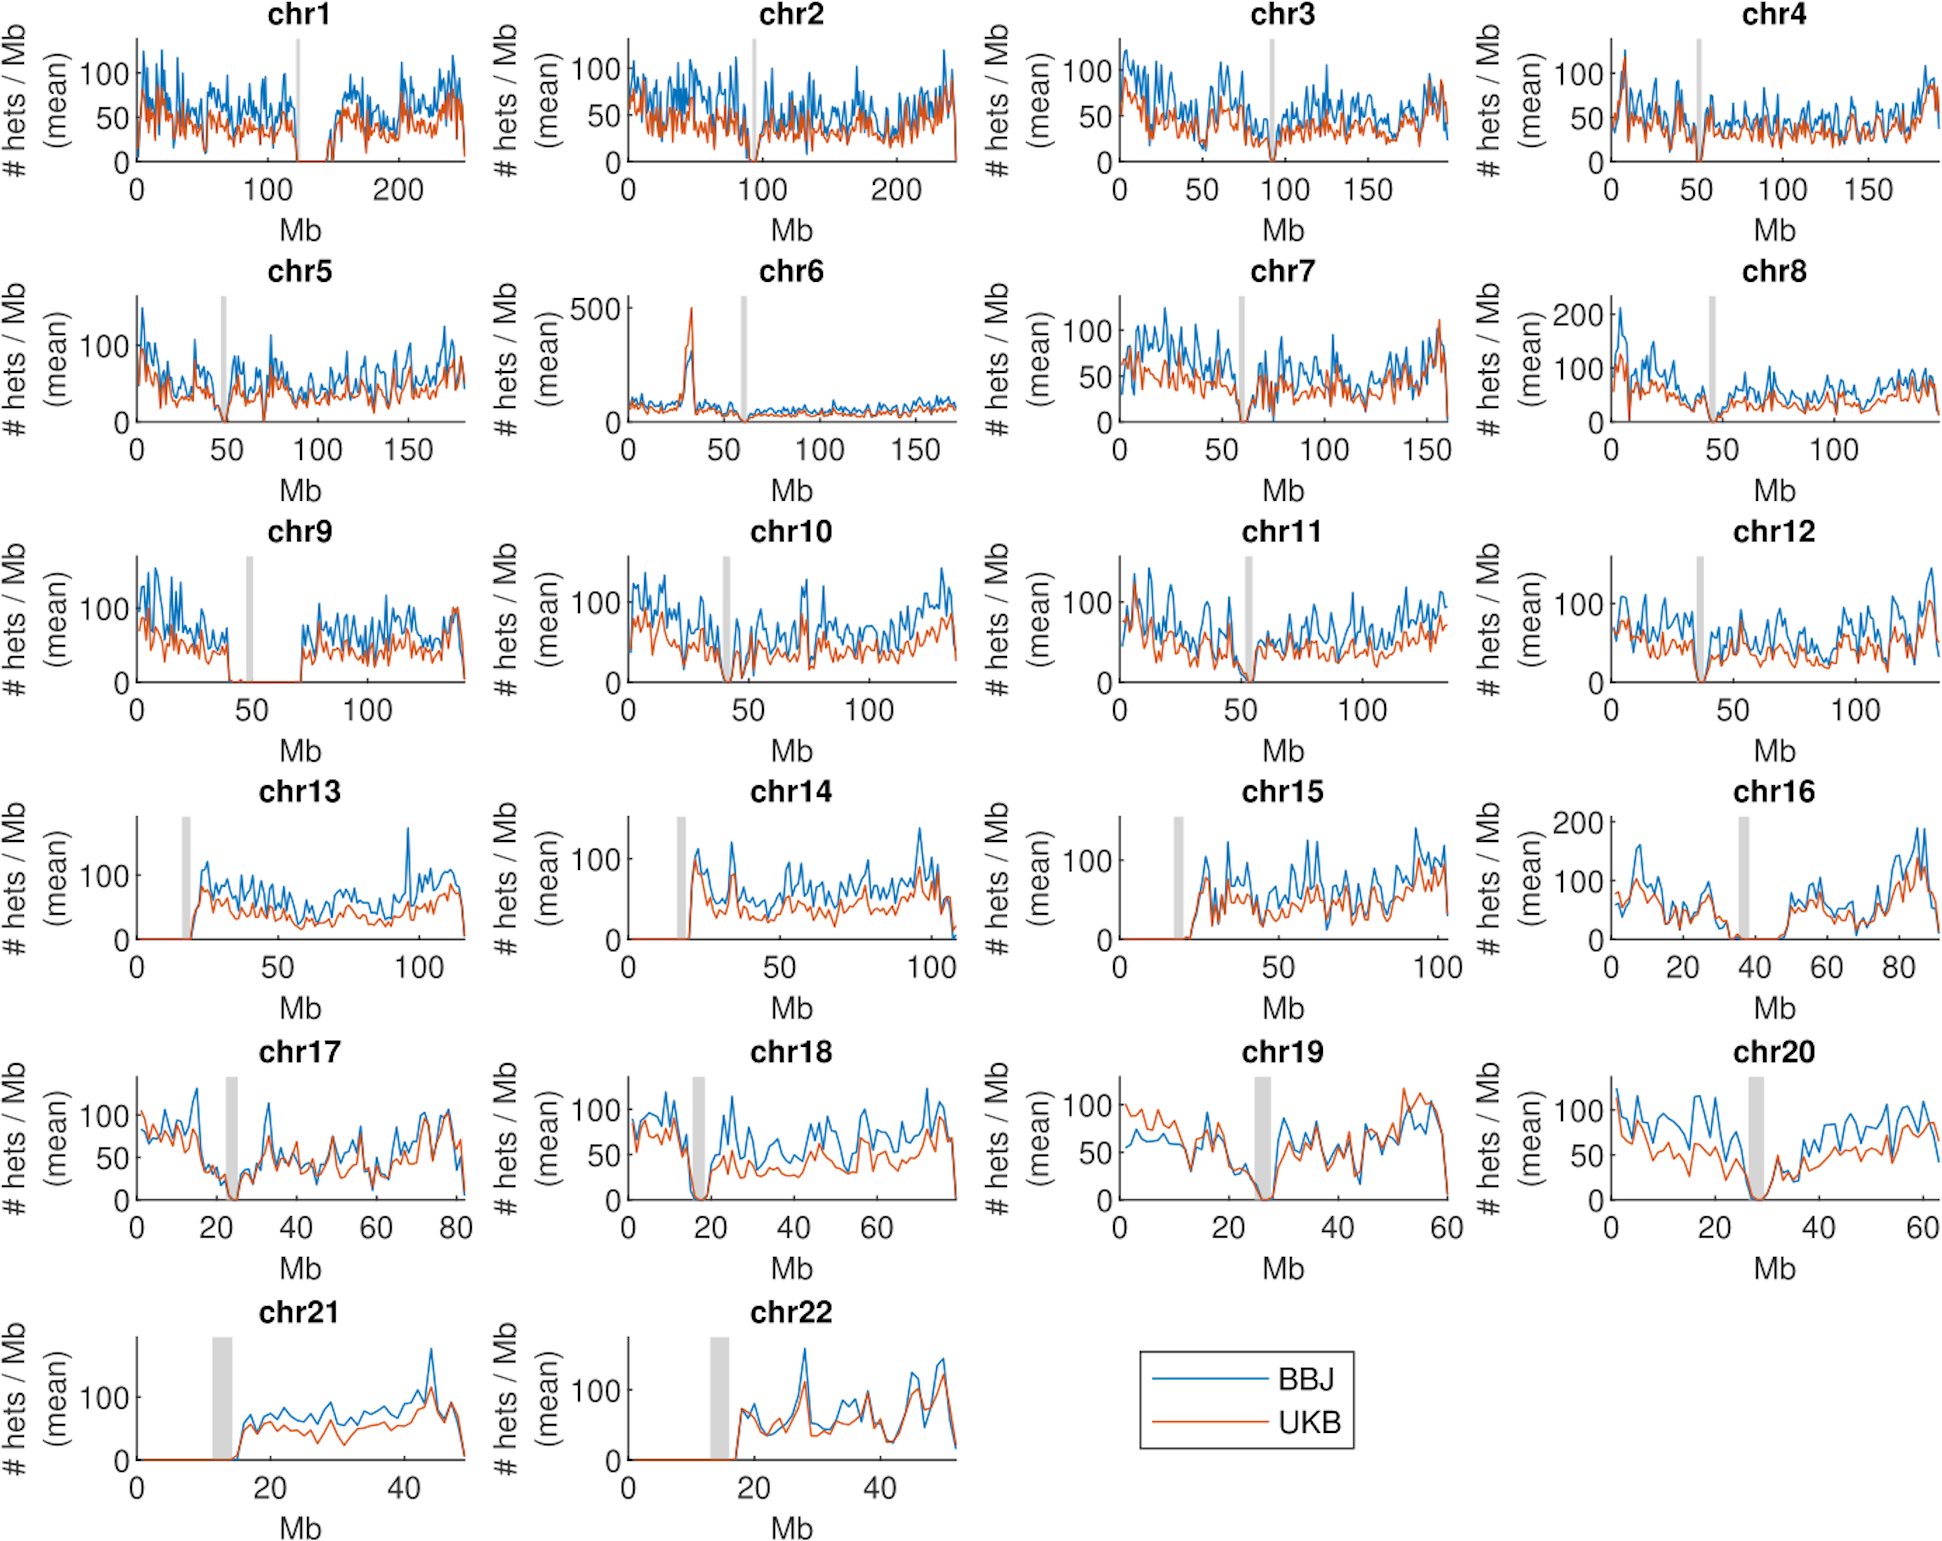
Comparable chromosomal coverage by heterozygous genotypes in BBJ and UKB.
Average numbers of heterozygous genotyped sites (averaged across individuals) in each 1Mb region of the genome for the BioBank Japan and UK Biobank genotyping arrays.
Extended Data Fig.3|.
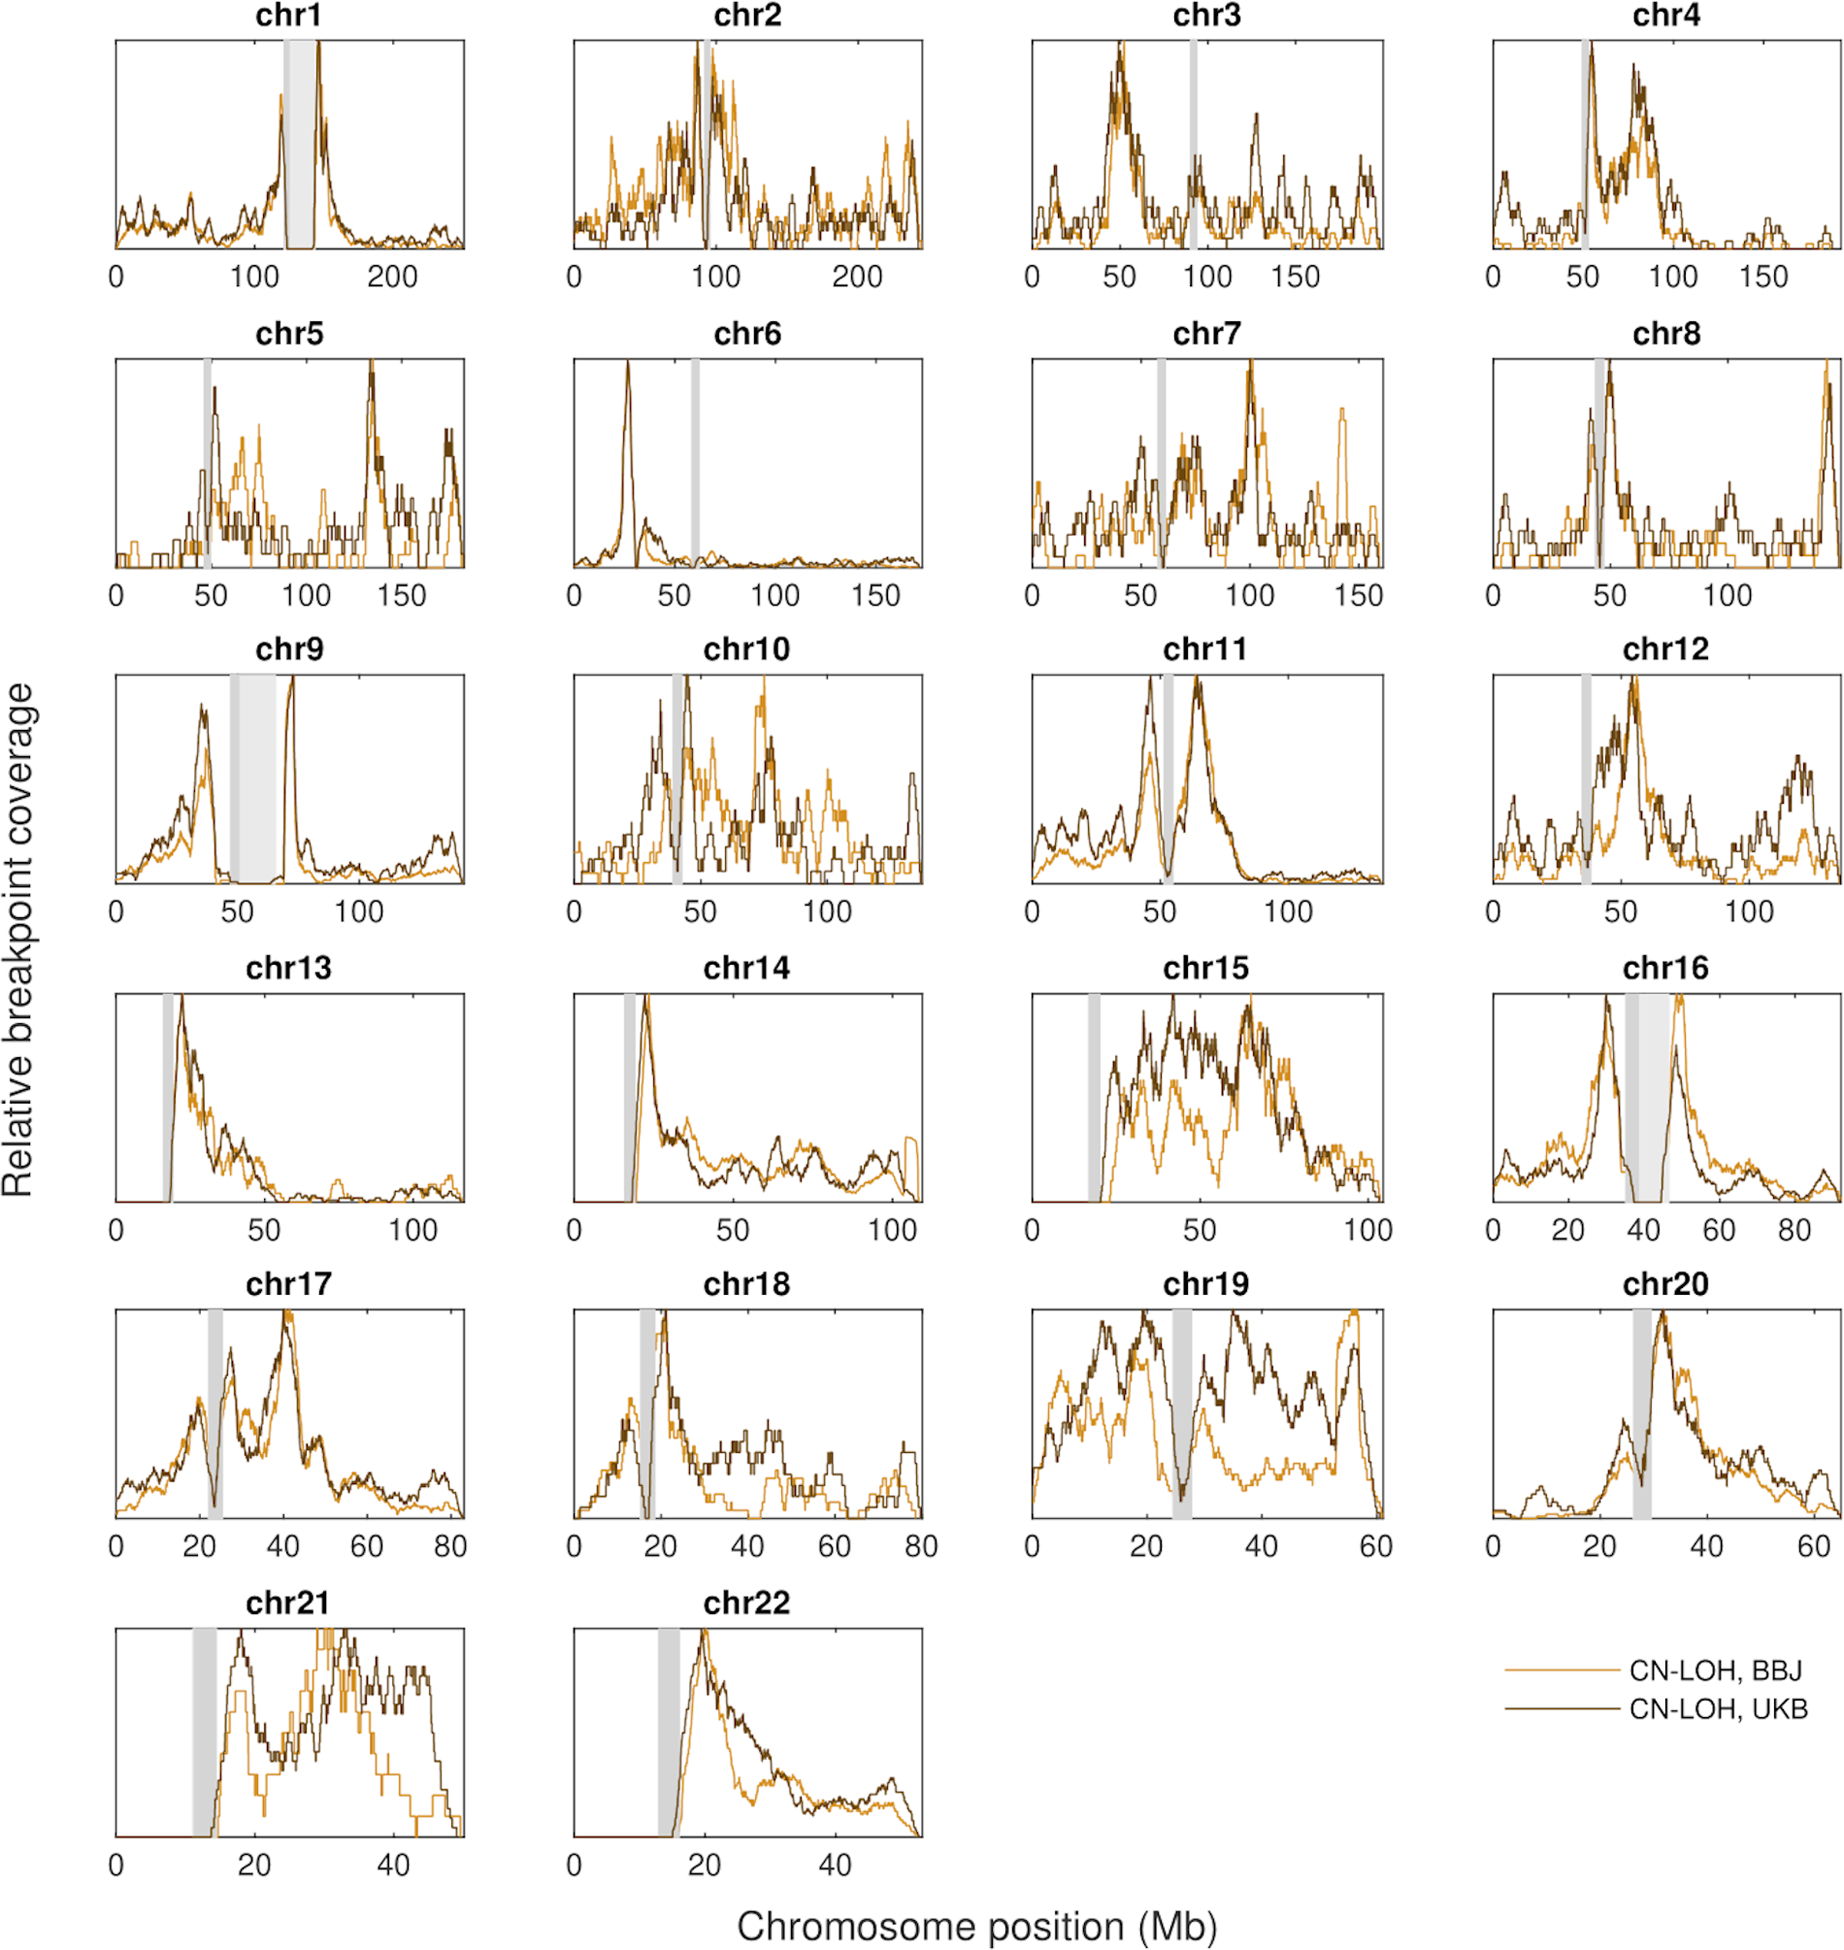
Similar breakpoint distributions of CN-LOH events in the BBJ and UKB.
Relative frequencies of estimated CN-LOH breakpoint locations in BioBank Japan and UK Biobank. Breakpoints were smoothed over +/−2Mb to allow plotting of frequency curves, which were rescaled to 1.
Extended Data Fig.4|.
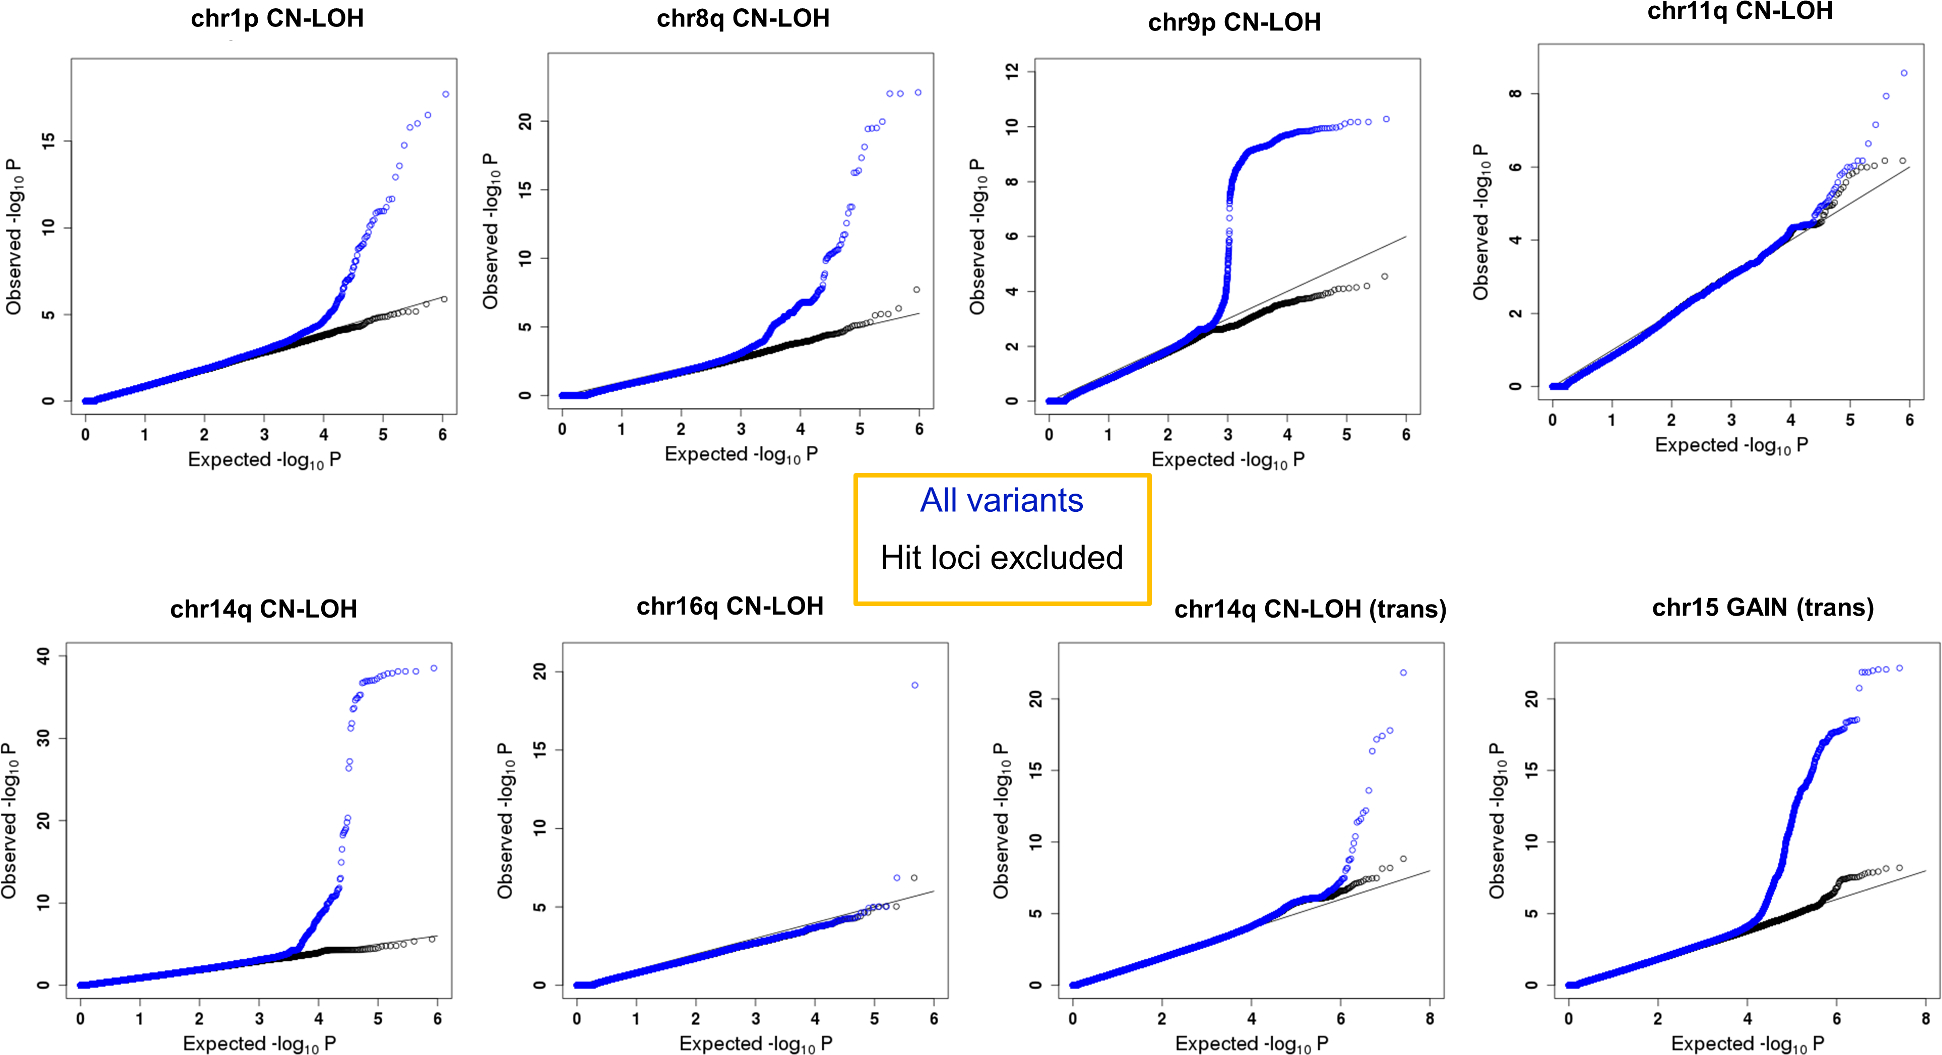
Quantile-quantile plots of mosaic events with significant associations demonstrating no inflation of association statistics.
Quantile-quantile plots of results for mosaic events with significant associations are indicated. Analytic results of Fisher’s exact test (two-sided, nominal p-values) using 173,599 subjects are shown. We defined as hit loci 42–49M at chr1 (1p CN-LOH), 88–94M at chr8 (8q CN-LOH), 92–96M at chr11 (11q CN-LOH), 88–90M at chr16 (16q CN-LOH), 23–26M and 100–103M at chr14 (cis association of 14q CN-LOH), 4–6M at chr9 (9p CN-LOH), 0–2M at chr5 (trans association of 14q CN-LOH) and 1–3M at chr7 (trans association of chr15 gain).
Extended Data Fig.5|.
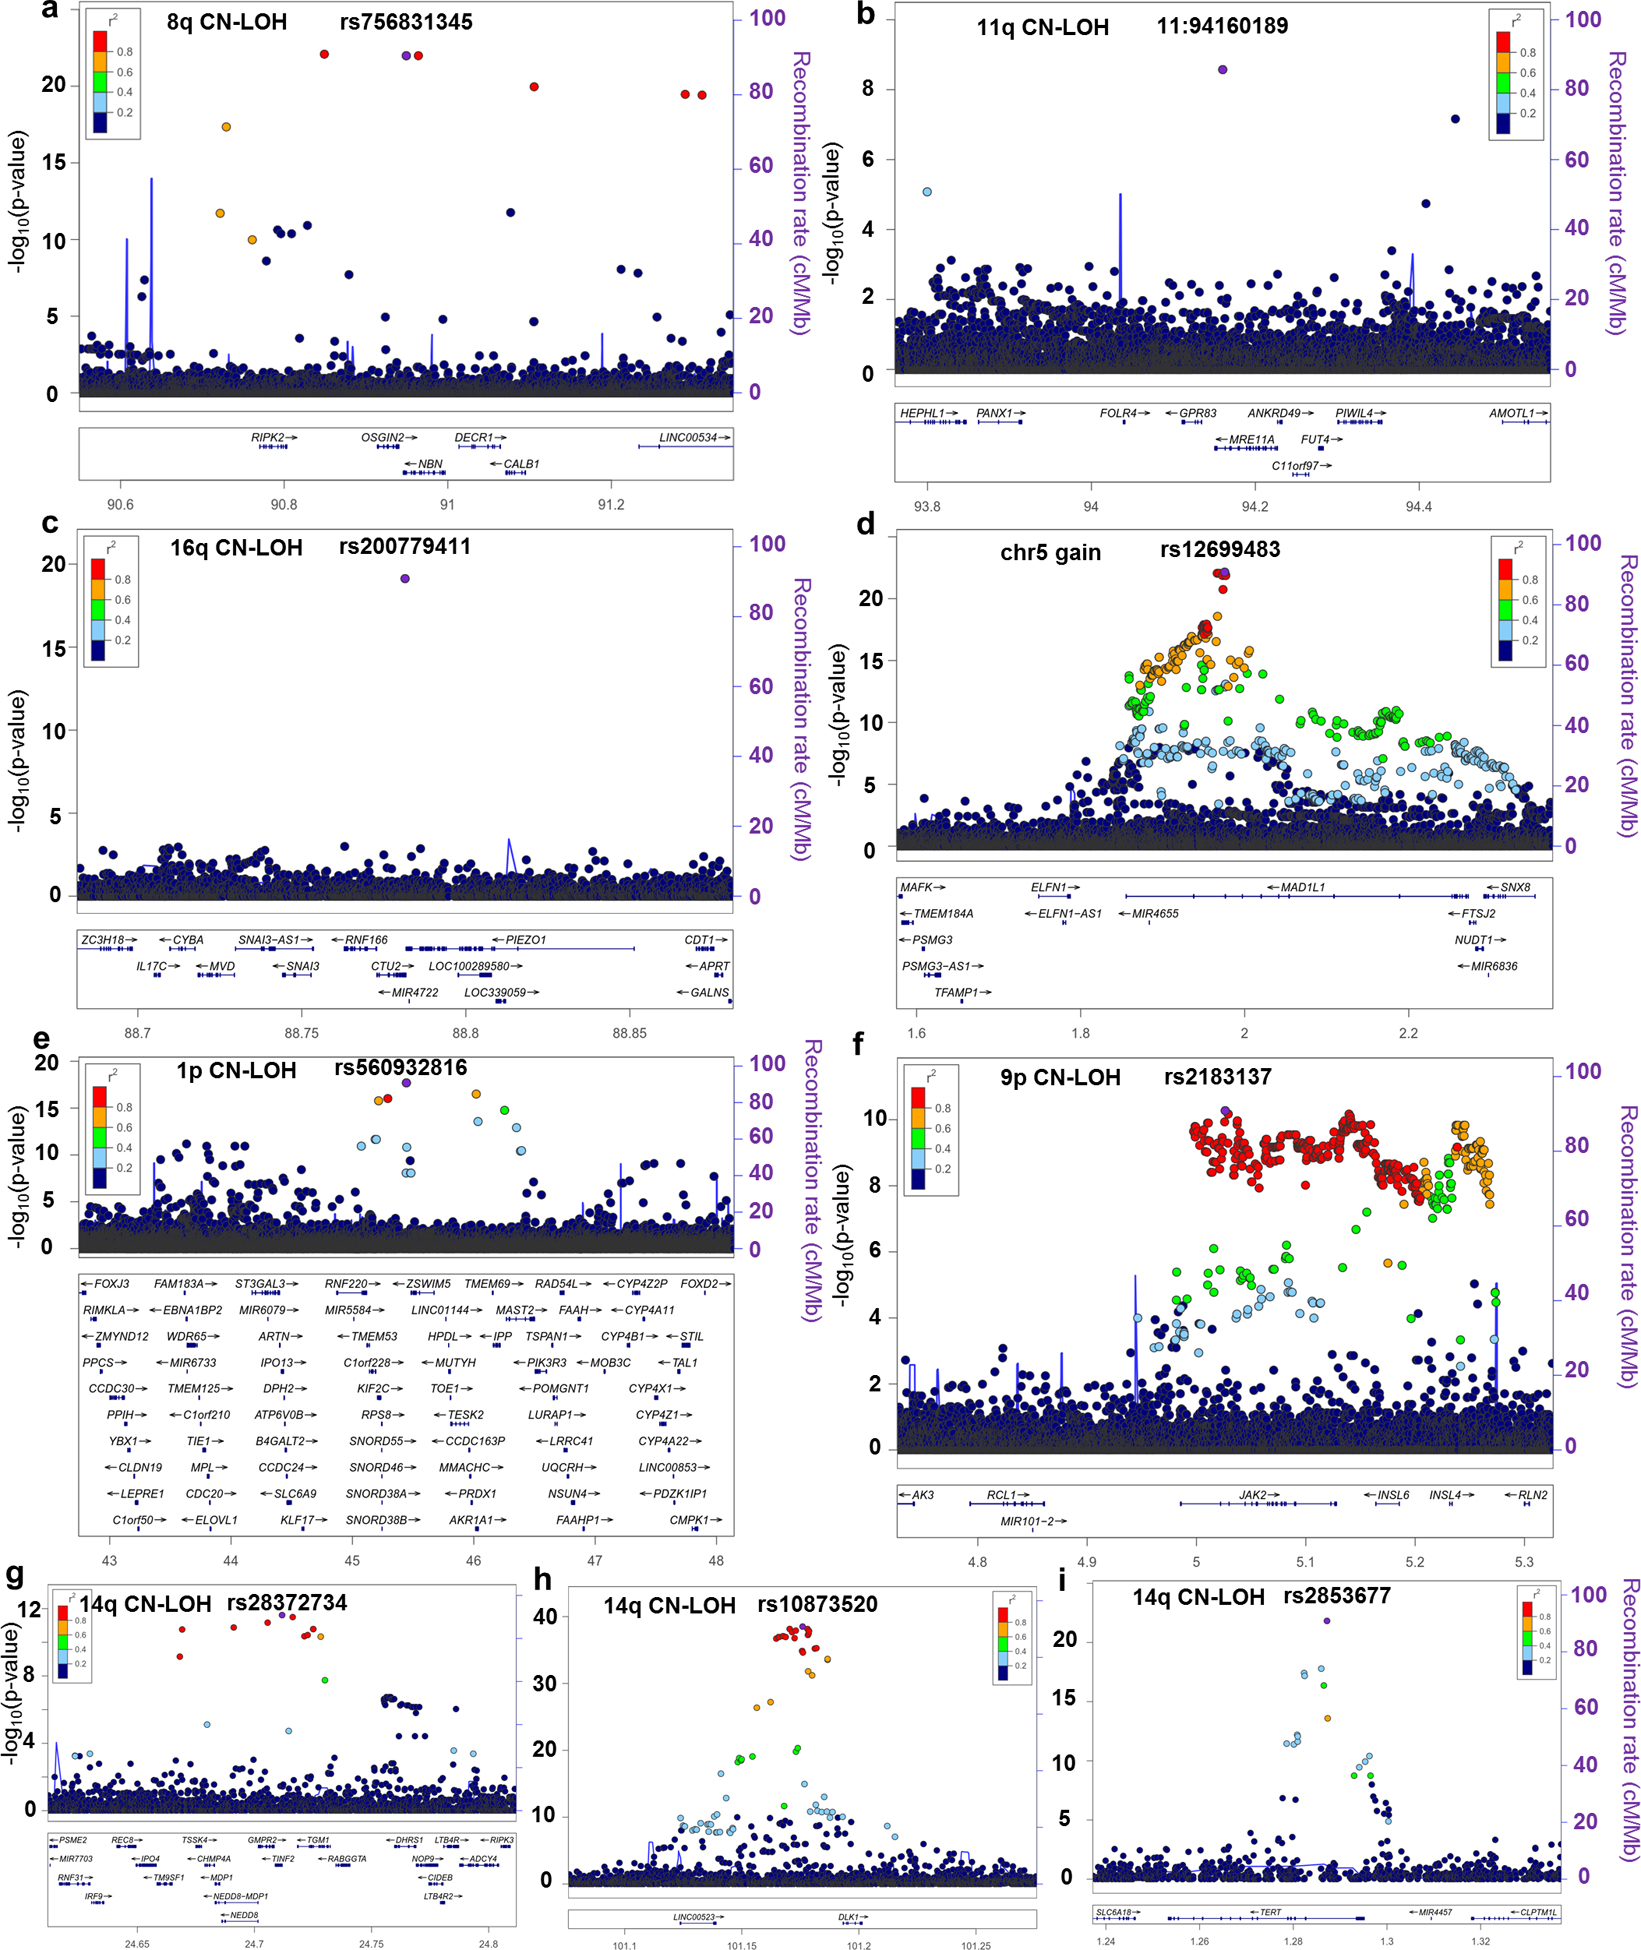
Local plots for cis and trans associations.
Associations of inherited variants with a. 8q CN-LOH, b. 11q CN-LOH, c. 16q CN-LOH, d. chr15 gain, e.1p CN-LOH, f.9p CN-LOH, and g-i. 14q CN-LOH are shown for regions containing the NBN, MRE11, CTU2, MAD1L1, MPL, JAK2, NEDD8/TINF2, DLK1 and TERT loci, respectively. a-c and e indicate rare cis associations, f-h indicate common cis associations and d and i indicate trans associations. a-d and g-i are unreported regions. Purple points indicate lead variants. Other variants are color-coded according to LD with lead variants. The TCL1A variant that significantly associated with 14q CN-LOH allelic imbalance is not shown here because it did not significantly associate with 14q CN-LOH risk. Analytic results of Fisher’s exact test (two-sided, nominal p-values) using 173,599 subjects are shown.
Extended Data Fig.6|.
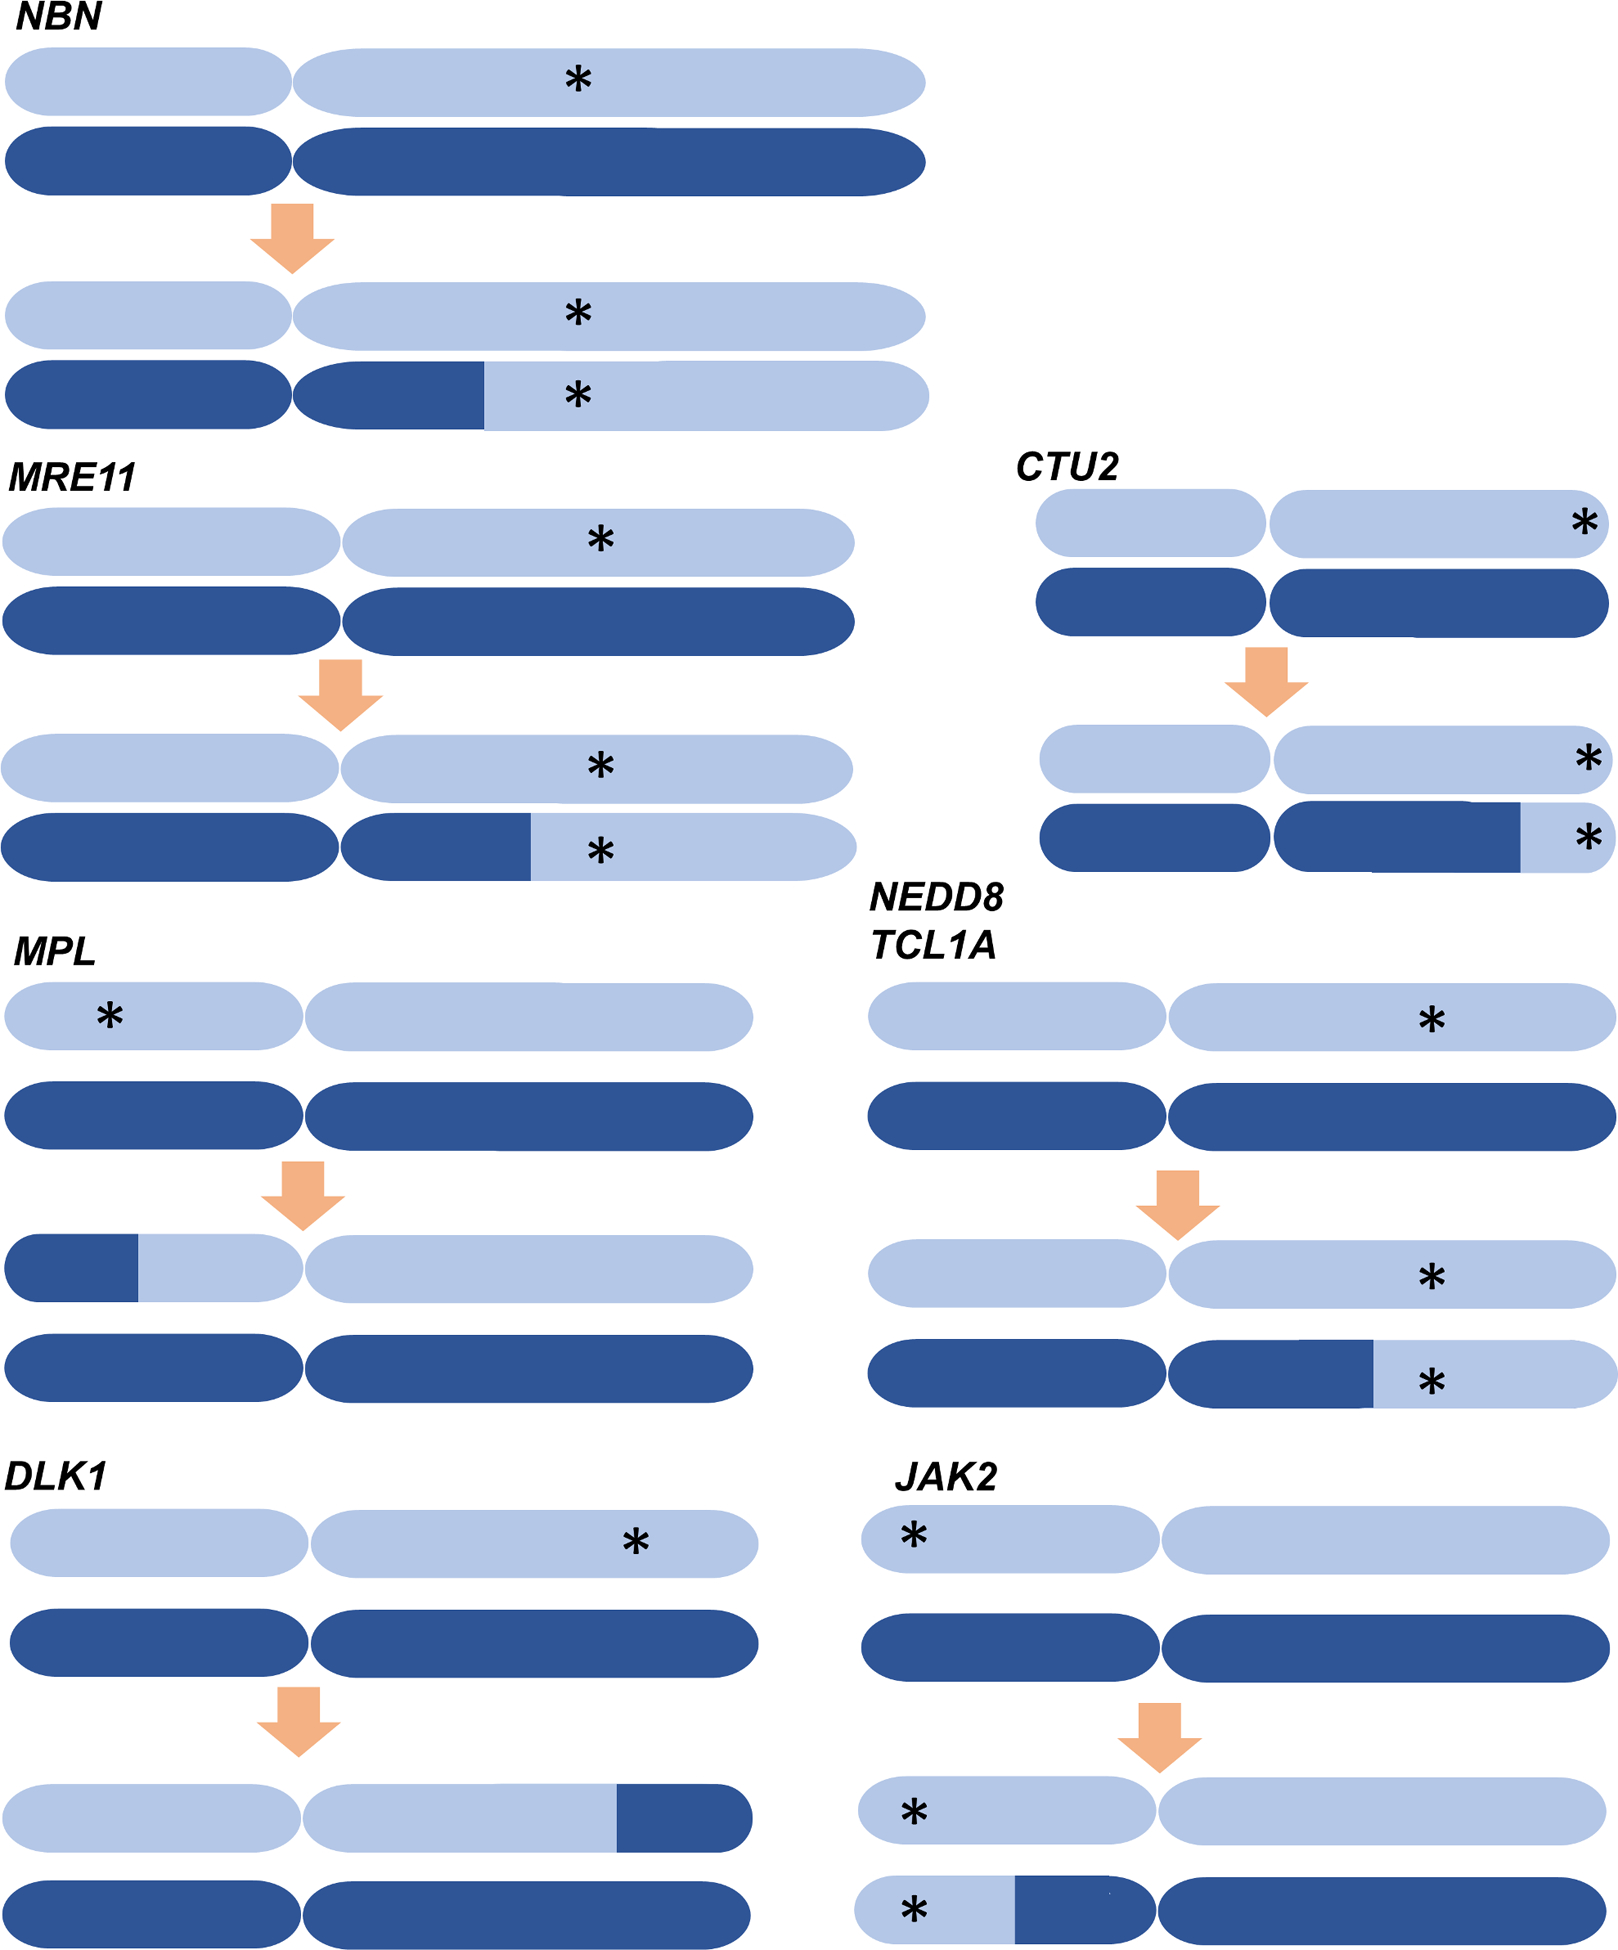
Action of CN-LOH events on rare and common inherited variants.
Schematic images showing the patterns of selection or elimination of inherited variants by CN-LOH events. Asterisks indicate risk alleles. (For the TCL1A locus, which did not significantly associate with presence of 14q CN-LOH, we depict TCL1A as a gene for which mCAs select an allele.)
Extended Data Fig.7|.
Examples of multiple overlapping CN-LOH clones in a single chromosome.
We identified 185 individuals carrying multiple CN-LOH clones on a single chromosome.
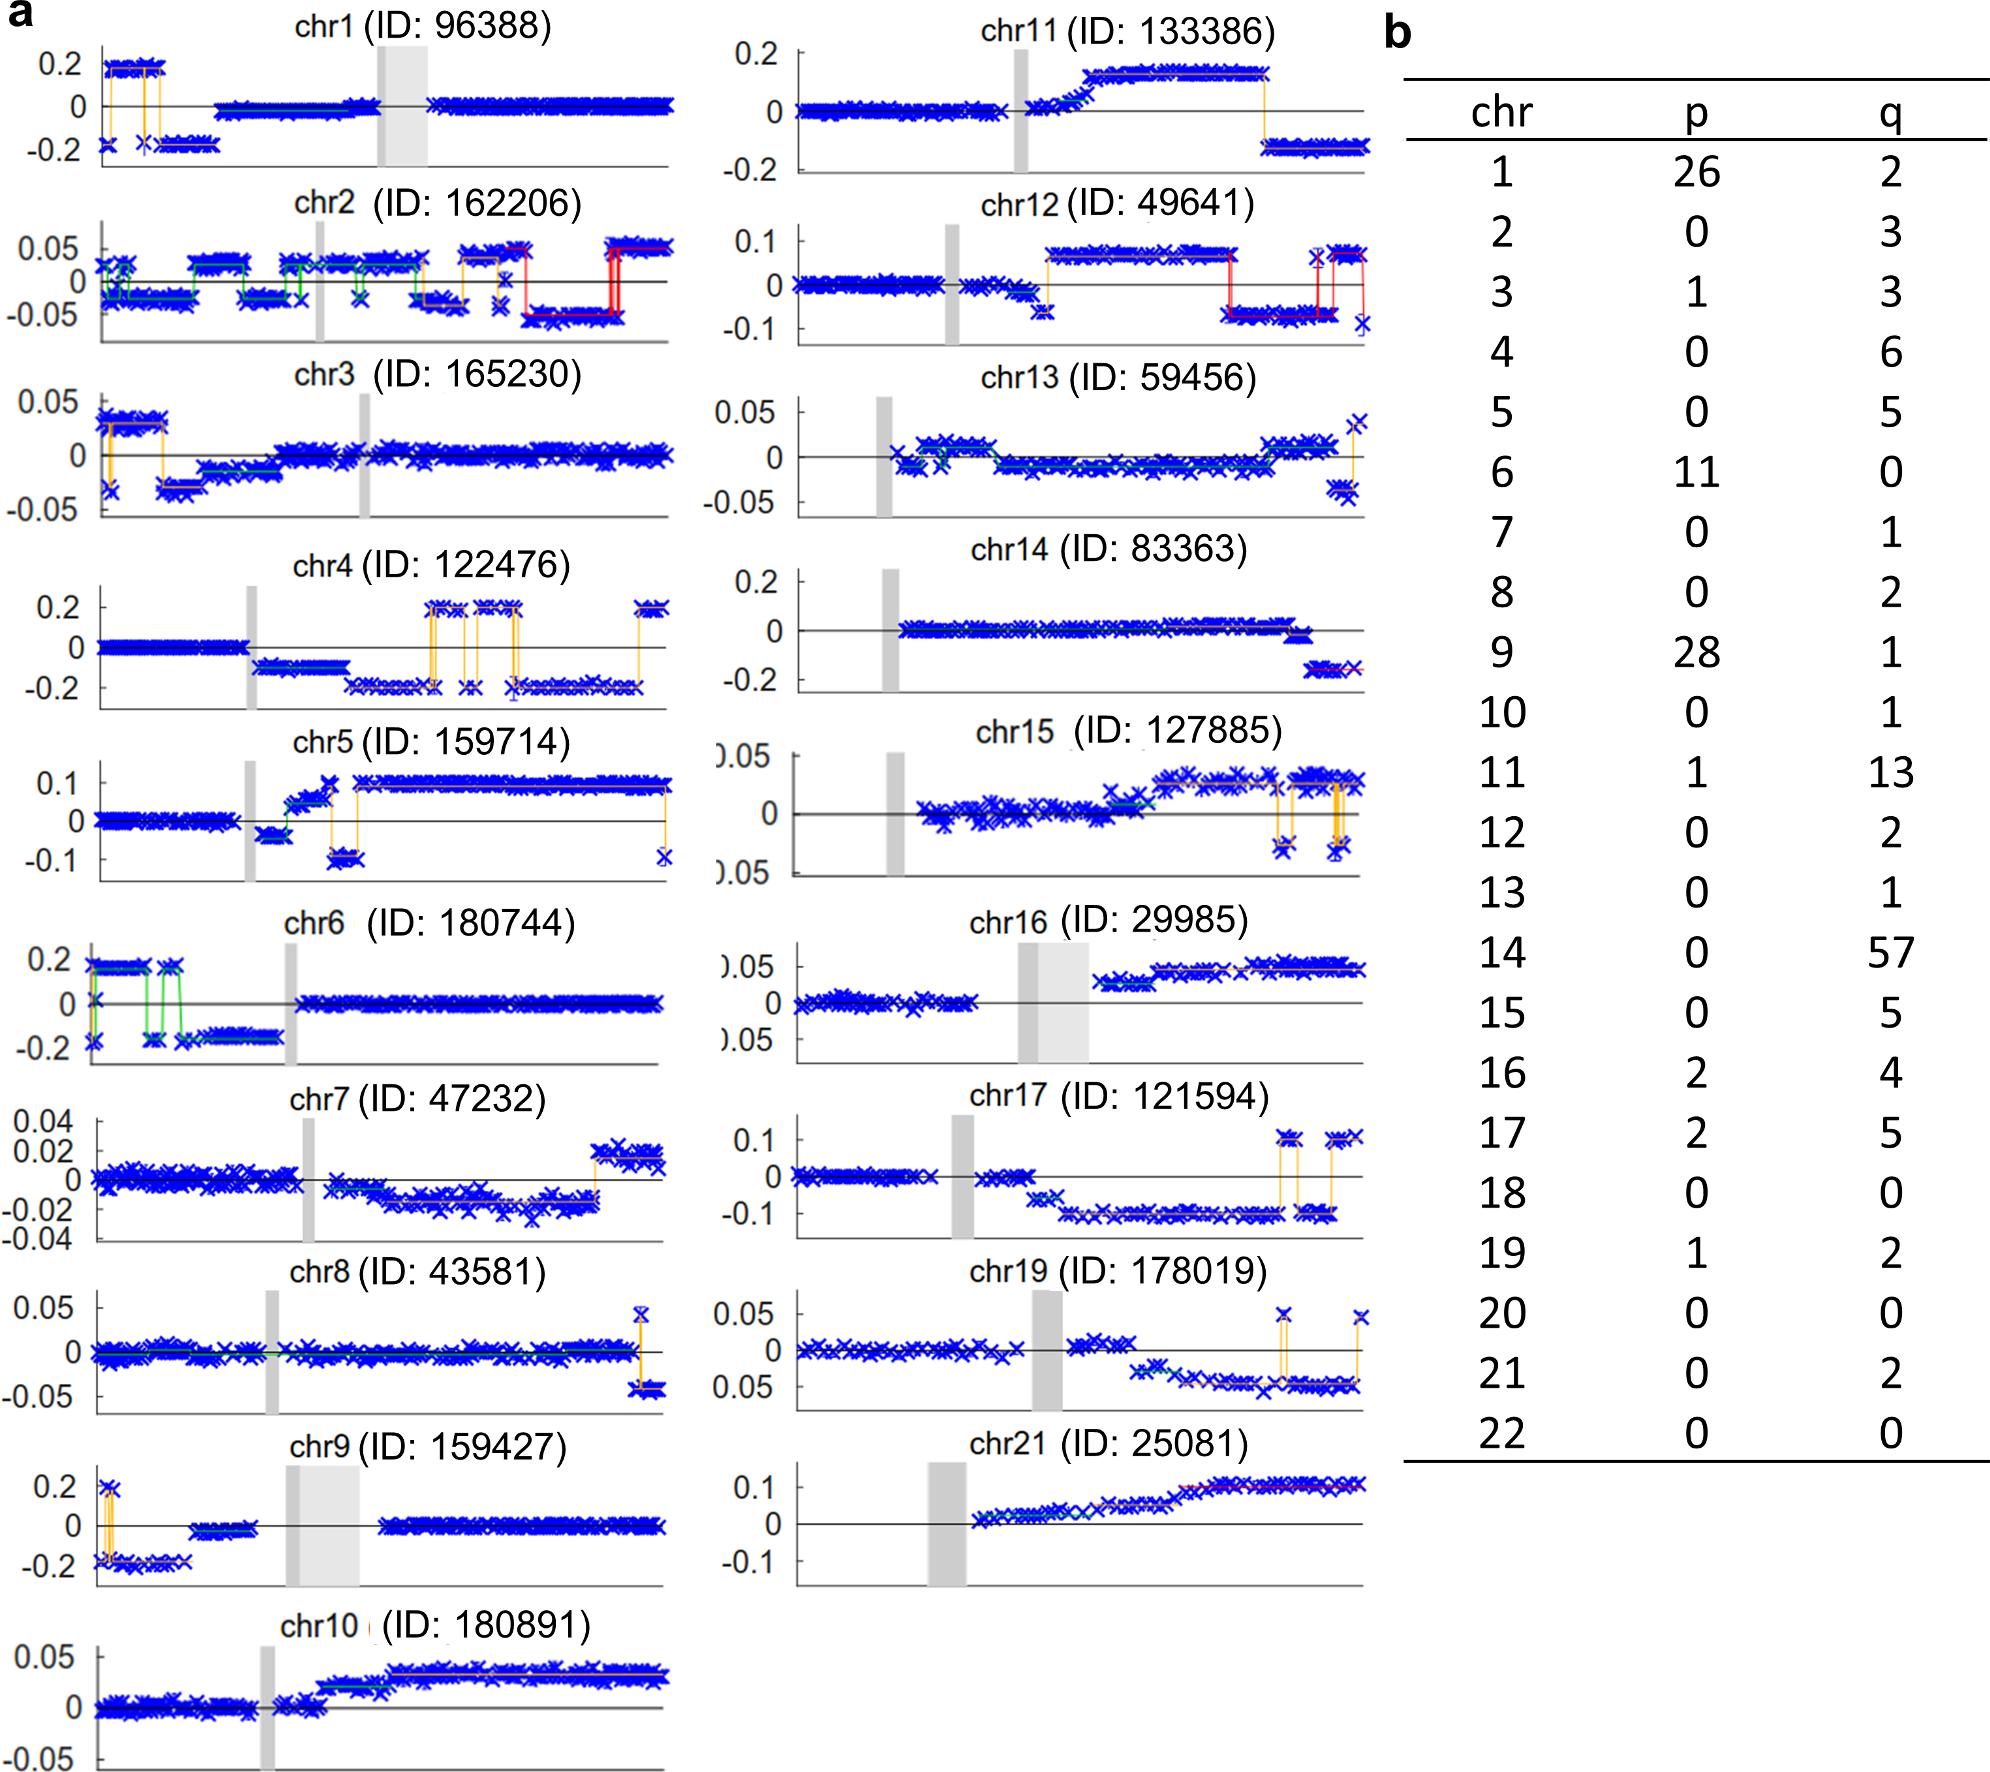
a.Multiple clones were observed in at least one individual for all chromosomes except chromosomes 18, 20 and 22. The plots show phased BAF deviations (y-axis) as a function of chromosome position (x-axis) for the individual with the largest clone per chromosome (among all individuals with multiple CN-LOH clones on that chromosome). Colored horizontal lines of different colors indicate distinct BAF deviations corresponding to overlapping CN-LOH events.
b.the number of subjects carrying multiple CN-LOH clones on a single chromosome is shown in each chromosomal arm.
Extended Data Fig.8|.
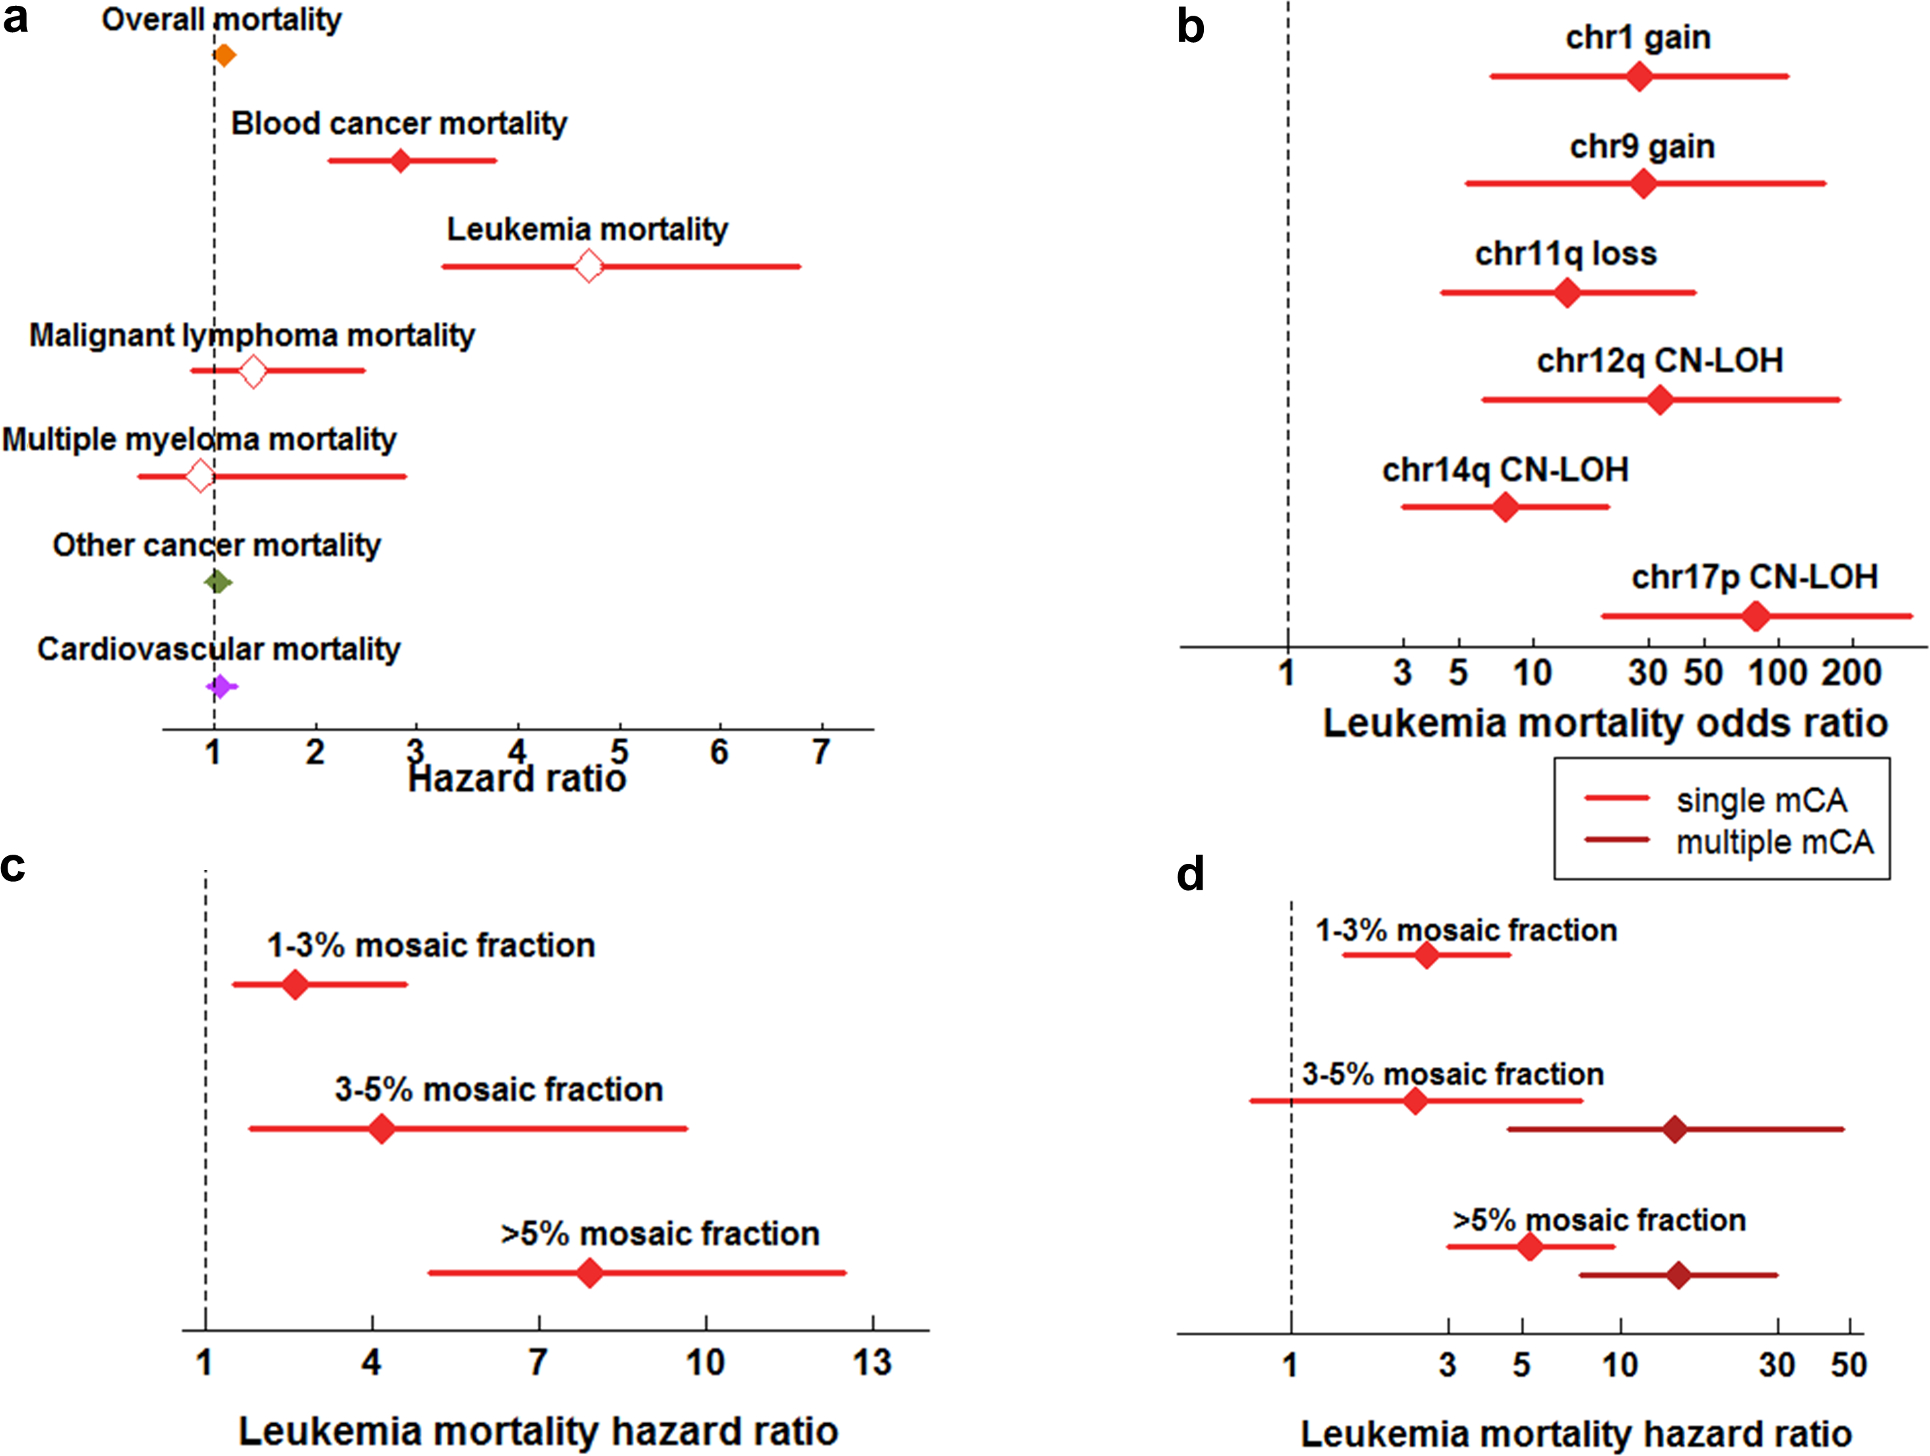
Mortality risk conferred by mosaic chromosomal alterations.
a. Risk of mortality from various causes conferred by presence of an mCA at >1% cell fraction. Leukemia, malignant lymphoma, and multiple myeloma are subdivisions of blood cancer. Cardiovascular mortality includes deaths from coronary artery disease (CAD) and ischemic stroke (IS).
b. Risk of leukemia mortality conferred by specific mCAs (grouped by chromosomal location and copy-number change) reaching Bonferroni significance.
c. Risk of leukemia mortality conferred by mosaic status stratified by mosaic cell fraction.
d. Risk of leukemia mortality conferred by mosaic status stratified by mosaic cell fraction and number of mosaic events detected (one vs. two or more).
All analyses were restricted to individuals with no previous cancer diagnosis and were corrected for age, sex, smoking status, and genotyping array (Methods). Error bars, 95% CIs. Numeric data are provided in Supplementary Tables 24–27. Results using 86,546 subjects are indicated. Cox Proportional Hazard model (two-sided) is applied for a, b, and d. Cochran-Mantel-Haenszel test is applied for c.
Extended Data Table 1.|.
Rare variants associated with CN-LOH further increase risk of multiple overlapping CN-LOH clones.
| Variant | Gene | mCA | Ncarrier / Nmulti-CN-LOH | p | OR (95%CI) |
|---|---|---|---|---|---|
| Rare variants in novel genes | |||||
| rs756831345 | NBN | 8q CN-LOH | 1 / 1 | 0.11 | Inf(0.22-Inf) |
| 11:94160189 | MRE11 | 11q CN-LOH | 3 / 12 | 8.0×10⁻⁵ | 64.8 (8.3–446.9) |
| rs200779411 | CTU2 | 16q CN-LOH | 0 / 4 | 1 | - |
| Previously-reported MPL locus | |||||
| rs560932816 | MPL | 1p CN-LOH | 1 / 20 | 0.29 | 3.2(0.071–23.8) |
| rs190159566 | 0 / 20 | 1 | - | ||
| rs556241419 | 1 / 20 | 0.17 | 6.4 (0.13–57.1) | ||
| rs184778092 | 1 / 20 | 0.15 | 7.7 (0.16–73.9) | ||
| Aggregated very rare variants* | 3 / 20 | 0.027 | 5.5(1.0–21.0) | ||
| Common variants | |||||
| rs2183137 | JAK2 | 9p CN-LOH | 20 / 25 | 0.086 | 2.50 (0.88–8.69) |
| rs28372734 | NEDD8/TINF2 | 14q CN-LOH | 3 / 17 | 1 | 0.76 (0.14–2.75) |
| rs10873520 | DLK1 | 14q CN-LOH | 42 / 57 | 0.074 | 1.77 (0.96–3.44) |
Ncarrier / Nmulti-CN-LOH indicates the fraction of subjects carrying multiple clones spanning the variant who also carried the indicated risk variant(s).
OR: odds ratio for carrying multiple clones spanning the variant vs. carrying a single clone CI:confidence interval
P:p-value in Fisher’s exact test (two-sided)
aggregating rs560932816, rs556241419 and rs184778092 with variant frequency less than 0.001
Extended Data Table 2.|.
Breakdown of associations between mCAs and death of leukemia.
| Phenotype | OR (95%CI) | p value |
|---|---|---|
| All leukemia | 4.70 (3.26–6.78) | 1.0×10⁻¹⁶ |
| 1) myeloid leukemia | 5.18 (3.35–8.01) | 1.4×10⁻¹³ |
| 2) lymphoid leukemia | 3.77 (1.72–8.26) | 0.00093 |
| 2-1) B cell lymphoid leukemia | 4.11 (1.42–11.85) | 0.0090 |
| 2-2) T cell lymphoid leukemia | 3.41 (1.07–10.92) | 0.039 |
CI: confidence interval
Cochran-Mantel-Haenszel test is applied for 86,546 subjects.
Supplementary Material
Acknowledgments
We would like to acknowledge the staff of BioBank Japan for collecting and managing samples and clinical information. This study was funded by the BioBank Japan project, which was supported by the Ministry of Education, Culture, Sports, Sciences and Technology of Japanese government and AMED under grant numbers 17km0305002 and 18km0605001. This research was conducted using the UK Biobank Resource under Application #19808. P.-R.L. was supported by NIH grant DP2 ES030554, a Burroughs Wellcome Fund Career Award at the Scientific Interfaces, the Next Generation Fund at the Broad Institute of MIT and Harvard, a Glenn Foundation for Medical Research and AFAR Grants for Junior Faculty award, and a Sloan Research Fellowship.
Footnotes
No competing interests exist in this paper.
Code availability
All computational codes are available upon request to corresponding authors (but not immediately portable to other computing environments). A standalone software implementation (MoChA) of the algorithm used to call mCAs is available at https://github.com/freeseek/mocha.
Data availability
A table for mosaic events detected in the current study is available as Supplementary Data 1. The BBJ genotype is available from the Japanese Genotype-phenotype Archive (JGA; http://trace.ddbj.nig.ac.jp/jga/index_e.html) by application with an accession code JGAD00000000123. Individual-level linkage of mosaic events can be provided by the BBJ project upon request (https://biobankjp.org/english/index.html).
References
- 1.Jacobs KB et al. Detectable clonal mosaicism and its relationship to aging and cancer. Nat. Genet 44, 651–658, doi: 10.1038/ng.2270 (2012). [DOI] [PMC free article] [PubMed] [Google Scholar]
- 2.Laurie CC et al. Detectable clonal mosaicism from birth to old age and its relationship to cancer. Nat. Genet 44, 642–650, doi: 10.1038/ng.2271 (2012). [DOI] [PMC free article] [PubMed] [Google Scholar]
- 3.Genovese G et al. Clonal hematopoiesis and blood-cancer risk inferred from blood DNA sequence. N. Engl. J. Med 371, 2477–2487, doi: 10.1056/NEJMoa1409405 (2014). [DOI] [PMC free article] [PubMed] [Google Scholar]
- 4.Jaiswal S et al. Age-related clonal hematopoiesis associated with adverse outcomes. N. Engl. J. Med 371, 2488–2498, doi: 10.1056/NEJMoa1408617 (2014). [DOI] [PMC free article] [PubMed] [Google Scholar]
- 5.Machiela MJ et al. Characterization of large structural genetic mosaicism in human autosomes. Am. J. Hum. Genet 96, 487–497, doi: 10.1016/j.ajhg.2015.01.011 (2015). [DOI] [PMC free article] [PubMed] [Google Scholar]
- 6.Vattathil S & Scheet P Extensive Hidden Genomic Mosaicism Revealed in Normal Tissue. Am. J. Hum. Genet 98, 571–578, doi: 10.1016/j.ajhg.2016.02.003 (2016). [DOI] [PMC free article] [PubMed] [Google Scholar]
- 7.Young AL, Challen GA, Birmann BM & Druley TE Clonal haematopoiesis harbouring AML-associated mutations is ubiquitous in healthy adults. Nature communications 7, 12484, doi: 10.1038/ncomms12484 (2016). [DOI] [PMC free article] [PubMed] [Google Scholar]
- 8.Forsberg LA, Gisselsson D & Dumanski JP Mosaicism in health and disease - clones picking up speed. Nat Rev Genet 18, 128–142, doi: 10.1038/nrg.2016.145 (2017). [DOI] [PubMed] [Google Scholar]
- 9.Abelson S et al. Prediction of acute myeloid leukaemia risk in healthy individuals. Nature 559, 400–404, doi: 10.1038/s41586-018-0317-6 (2018). [DOI] [PMC free article] [PubMed] [Google Scholar]
- 10.Loh PR et al. Insights into clonal haematopoiesis from 8,342 mosaic chromosomal alterations. Nature 559, 350–355, doi: 10.1038/s41586-018-0321-x (2018). [DOI] [PMC free article] [PubMed] [Google Scholar]
- 11.Zhou W et al. Mosaic loss of chromosome Y is associated with common variation near TCL1A. Nat. Genet 48, 563–568, doi: 10.1038/ng.3545 (2016). [DOI] [PMC free article] [PubMed] [Google Scholar]
- 12.Hinds DA et al. Germ line variants predispose to both JAK2 V617F clonal hematopoiesis and myeloproliferative neoplasms. Blood 128, 1121–1128, doi: 10.1182/blood-2015-06-652941 (2016). [DOI] [PMC free article] [PubMed] [Google Scholar]
- 13.Wright DJ et al. Genetic variants associated with mosaic Y chromosome loss highlight cell cycle genes and overlap with cancer susceptibility. Nat. Genet 49, 674–679, doi: 10.1038/ng.3821 (2017). [DOI] [PMC free article] [PubMed] [Google Scholar]
- 14.Nagai A et al. Overview of the BioBank Japan Project: Study design and profile. J. Epidemiol 27, S2–S8, doi: 10.1016/j.je.2016.12.005 (2017). [DOI] [PMC free article] [PubMed] [Google Scholar]
- 15.Loh P-R, Genovese G & McCarroll SA Monogenic and polygenic inherited causes of clonal hematopoiesis. bioRxiv (2019). [Google Scholar]
- 16.Sudlow C et al. UK biobank: an open access resource for identifying the causes of a wide range of complex diseases of middle and old age. PLoS Med 12, e1001779, doi: 10.1371/journal.pmed.1001779 (2015). [DOI] [PMC free article] [PubMed] [Google Scholar]
- 17.Bycroft C et al. The UK Biobank resource with deep phenotyping and genomic data. Nature 562, 203–209, doi: 10.1038/s41586-018-0579-z (2018). [DOI] [PMC free article] [PubMed] [Google Scholar]
- 18.Iwanaga M, Watanabe T & Yamaguchi K Adult T-cell leukemia: a review of epidemiological evidence. Front Microbiol 3, 322, doi: 10.3389/fmicb.2012.00322 (2012). [DOI] [PMC free article] [PubMed] [Google Scholar]
- 19.Tamura K et al. Chronic lymphocytic leukemia (CLL) is rare, but the proportion of T-CLL is high in Japan. Eur. J. Haematol 67, 152–157 (2001). [DOI] [PubMed] [Google Scholar]
- 20.Li Y, Wang Y, Wang Z, Yi D & Ma S Racial differences in three major NHL subtypes: descriptive epidemiology. Cancer Epidemiol 39, 8–13, doi: 10.1016/j.canep.2014.12.001 (2015). [DOI] [PMC free article] [PubMed] [Google Scholar]
- 21.Landau DA et al. Mutations driving CLL and their evolution in progression and relapse. Nature 526, 525–530, doi: 10.1038/nature15395 (2015). [DOI] [PMC free article] [PubMed] [Google Scholar]
- 22.Puente XS et al. Non-coding recurrent mutations in chronic lymphocytic leukaemia. Nature 526, 519–524, doi: 10.1038/nature14666 (2015). [DOI] [PubMed] [Google Scholar]
- 23.Iwai M et al. Expression and methylation status of the FHIT gene in acute myeloid leukemia and myelodysplastic syndrome. Leukemia 19, 1367–1375, doi: 10.1038/sj.leu.2403805 (2005). [DOI] [PubMed] [Google Scholar]
- 24.Schmitz R et al. TNFAIP3 (A20) is a tumor suppressor gene in Hodgkin lymphoma and primary mediastinal B cell lymphoma. J. Exp. Med 206, 981–989, doi: 10.1084/jem.20090528 (2009). [DOI] [PMC free article] [PubMed] [Google Scholar]
- 25.Liu Y et al. The genomic landscape of pediatric and young adult T-lineage acute lymphoblastic leukemia. Nat. Genet 49, 1211–1218, doi: 10.1038/ng.3909 (2017). [DOI] [PMC free article] [PubMed] [Google Scholar]
- 26.Zink F et al. Clonal hematopoiesis, with and without candidate driver mutations, is common in the elderly. Blood 130, 742–752, doi: 10.1182/blood-2017-02-769869 (2017). [DOI] [PMC free article] [PubMed] [Google Scholar]
- 27.Knudson AG Jr. Mutation and cancer: statistical study of retinoblastoma. Proc. Natl. Acad. Sci. U. S. A 68, 820–823, doi: 10.1073/pnas.68.4.820 (1971). [DOI] [PMC free article] [PubMed] [Google Scholar]
- 28.Genomes Project C et al. A global reference for human genetic variation. Nature 526, 68–74, doi: 10.1038/nature15393 (2015). [DOI] [PMC free article] [PubMed] [Google Scholar]
- 29.Okada Y et al. Deep whole-genome sequencing reveals recent selection signatures linked to evolution and disease risk of Japanese. Nature communications 9, 1631, doi: 10.1038/s41467-018-03274-0 (2018). [DOI] [PMC free article] [PubMed] [Google Scholar]
- 30.Kilpivaara O et al. A germline JAK2 SNP is associated with predisposition to the development of JAK2(V617F)-positive myeloproliferative neoplasms. Nat. Genet 41, 455–459, doi: 10.1038/ng.342 (2009). [DOI] [PMC free article] [PubMed] [Google Scholar]
- 31.Jones AV et al. JAK2 haplotype is a major risk factor for the development of myeloproliferative neoplasms. Nat. Genet 41, 446–449, doi: 10.1038/ng.334 (2009). [DOI] [PMC free article] [PubMed] [Google Scholar]
- 32.Olcaydu D et al. A common JAK2 haplotype confers susceptibility to myeloproliferative neoplasms. Nat. Genet 41, 450–454, doi: 10.1038/ng.341 (2009). [DOI] [PubMed] [Google Scholar]
- 33.Lee JH & Paull TT ATM activation by DNA double-strand breaks through the Mre11-Rad50-Nbs1 complex. Science 308, 551–554, doi: 10.1126/science.1108297 (2005). [DOI] [PubMed] [Google Scholar]
- 34.Dewez M et al. The conserved Wobble uridine tRNA thiolase Ctu1-Ctu2 is required to maintain genome integrity. Proc. Natl. Acad. Sci. U. S. A 105, 5459–5464, doi: 10.1073/pnas.0709404105 (2008). [DOI] [PMC free article] [PubMed] [Google Scholar]
- 35.Adzhubei I, Jordan DM & Sunyaev SR Predicting functional effect of human missense mutations using PolyPhen-2. Curr Protoc Hum Genet Chapter 7, Unit7 20, doi: 10.1002/0471142905.hg0720s76 (2013). [DOI] [PMC free article] [PubMed] [Google Scholar]
- 36.Sim NL et al. SIFT web server: predicting effects of amino acid substitutions on proteins. Nucleic Acids Res 40, W452–457, doi: 10.1093/nar/gks539 (2012). [DOI] [PMC free article] [PubMed] [Google Scholar]
- 37.DeAntoni A, Sala V & Musacchio A Explaining the oligomerization properties of the spindle assembly checkpoint protein Mad2. Philos. Trans. R. Soc. Lond. B Biol. Sci 360, 637–647, discussion 447–638, doi: 10.1098/rstb.2004.1618 (2005). [DOI] [PMC free article] [PubMed] [Google Scholar]
- 38.Karczewski KJ et al. Variation across 141,456 human exomes and genomes reveals the spectrum of loss-of-function intolerance across human protein-coding genes. bioRxiv (2019). [Google Scholar]
- 39.Jaiswal S et al. Clonal Hematopoiesis and Risk of Atherosclerotic Cardiovascular Disease. N. Engl. J. Med 377, 111–121, doi: 10.1056/NEJMoa1701719 (2017). [DOI] [PMC free article] [PubMed] [Google Scholar]
- 40.Hirata M et al. Overview of BioBank Japan follow-up data in 32 diseases. J. Epidemiol 27, S22–S28, doi: 10.1016/j.je.2016.12.006 (2017). [DOI] [PMC free article] [PubMed] [Google Scholar]
- 41.Genomes Project C et al. A map of human genome variation from population-scale sequencing. Nature 467, 1061–1073, doi: 10.1038/nature09534 (2010). [DOI] [PMC free article] [PubMed] [Google Scholar]
- 42.Purcell S et al. PLINK: a tool set for whole-genome association and population-based linkage analyses. Am. J. Hum. Genet 81, 559–575, doi: 10.1086/519795 (2007). [DOI] [PMC free article] [PubMed] [Google Scholar]
- 43.Staaf J et al. Normalization of Illumina Infinium whole-genome SNP data improves copy number estimates and allelic intensity ratios. BMC Bioinformatics 9, 409, doi: 10.1186/1471-2105-9-409 (2008). [DOI] [PMC free article] [PubMed] [Google Scholar]
- 44.Loh PR et al. Reference-based phasing using the Haplotype Reference Consortium panel. Nat. Genet 48, 1443–1448, doi: 10.1038/ng.3679 (2016). [DOI] [PMC free article] [PubMed] [Google Scholar]
- 45.Kanai M et al. Genetic analysis of quantitative traits in the Japanese population links cell types to complex human diseases. Nat. Genet 50, 390–400, doi: 10.1038/s41588-018-0047-6 (2018). [DOI] [PubMed] [Google Scholar]
- 46.Loh PR, Palamara PF & Price AL Fast and accurate long-range phasing in a UK Biobank cohort. Nat. Genet 48, 811–816, doi: 10.1038/ng.3571 (2016). [DOI] [PMC free article] [PubMed] [Google Scholar]
- 47.Das S et al. Next-generation genotype imputation service and methods. Nat. Genet 48, 1284–1287, doi: 10.1038/ng.3656 (2016). [DOI] [PMC free article] [PubMed] [Google Scholar]
- 48.Ma C, Blackwell T, Boehnke M, Scott LJ & Go TD i. Recommended joint and meta-analysis strategies for case-control association testing of single low-count variants. Genet. Epidemiol 37, 539–550, doi: 10.1002/gepi.21742 (2013). [DOI] [PMC free article] [PubMed] [Google Scholar]
Associated Data
This section collects any data citations, data availability statements, or supplementary materials included in this article.