Abstract
This study aimed to improve the diagnostic accuracy of breast diseases by combining breast imaging–reporting and data system (BI–RADS) with the enhancement intensity and pattern of contrast-enhanced spectral mammography (CESM) (this combination of BI–RADS and CESM was designated as BaC).
BI–RADS was used to evaluate low-energy CESM images. Spearman nonparametric correlation analysis was performed to analyze the correlation between the enhancement intensity of CESM subtraction images and the pathological results. Odds ratio (OR) values were calculated to determine whether the enhancement pattern of CESM subtraction images is a risk factor for benign and malignant lesions. The diagnostic efficacies of BI–RADS, CESM, and BaC scores for benign and malignant breast diseases were analyzed using the receiver operating characteristic (ROC) curve.
Lesions with a high enhancement intensity were more likely to be malignant than those with low enhancement intensity. Lesions with heterogeneous enhancement tended to be malignant, whereas those with homogeneous enhancement tended to be benign. No significant correlation was observed between ring enhancement and the benignity or malignancy of lesions. The area under the ROC curve of BaC was higher than that of BI–RADS or CESM, and the difference was statistically significant.
The diagnostic efficacy of BI–RADS combined with CESM enhancement was superior to that of either method alone.
Keywords: breast, breast cancer, contrast-enhanced spectral mammography, breast imaging–reporting and data system, magnetic resonance
1. Introduction
Breast diseases are common among women. Among these diseases, breast cancer is the most common malignant tumor, with new cases accounting for nearly 30% of malignant tumors among females annually.[1] Early detection, diagnosis, and standard treatment of lesions are crucial to improve the quality of life and increase the survival rate of patients with breast cancer. Digital mammography is widely used in clinical examinations. However, its sensitivity is limited, resulting in missed diagnosis of about 20% of breast cancer cases.[2] For women with dense breast tissues, this sensitivity can be further reduced to 30% to 60%.[3]
Contrast-enhanced spectral mammography (CESM) is a new imaging technology based on digital mammography that uses a contrast agent for examination. After a contrast agent is intravenously injected, high- and low-energy exposures are performed, and low-energy and subtraction images are obtained after image processing. The diagnostic efficiency of low-energy images is equivalent to that of digital mammography (DM).[4] Subtraction images can reflect the ability of breast lesions to absorb iodine contrast agents to a certain extent. Moreover, these images can indirectly reflect the blood supply of lesions and remove the surrounding normal overlapping glandular tissues so that the lesions can be clearly displayed. These features will allow early diagnosis of breast diseases, especially breast cancer.[5] CESM greatly improves the sensitivity, specificity, and accuracy of the diagnosis of breast lesions.[6] Helal et al reported that CESM had higher sensitivity, specificity and accuracy than DM+2-dimensional ultrasound (2DUS).[7] Several studies proved that CESM has the same diagnostic accuracy as breast MRI, and its specificity is even better than that of MRI.[8,9,10]
The evaluation and analysis of digital mammography mainly refer to the breast imaging–reporting and data system (BI–RADS) 2013 edition.[11] However, the evaluation and analysis of CESM enhancement is not mentioned in this edition. These aspects must be further investigated because CESM is increasingly applied in diagnosing breast lesions. Lobbes et al found that CESM enhancement can be used to differentiate benign from malignant lesions.[12] Deng et al quantified the enhancement degree of CESM lesions and concluded that benign and malignant breast lesions have fundamentally different enhancement degrees, and a high CESM enhancement suggests that lesions are likely malignant.[13] These studies demonstrated that CESM enhancement can be used to differentiate benign from malignant breast lesions. However, they did not provide specific quantitative analysis criteria and thus their results cannot be directly applied to clinical practice. Furthermore, they did not incorporate CESM enhancement patterns into the analysis. CESM subtraction images can provide information on enhancement intensity and pattern. The present study aimed to combine BI–RADS with CESM enhancement intensity and pattern to improve the diagnostic accuracy of breast lesions.
2. Materials and methods
2.1. Patients
This retrospective study was approved by the Ethics Committee of Yantai Yuhuangding Hospital. All patients signed the informed consent before the examination. The inclusion criteria were as follows:
-
1.
patients with suspicious breast abnormalities detected by clinical examination or ultrasound;
-
2.
patients with BI-RADS 3-4C lesions;
-
3.
patients whose final diagnosis was confirmed by pathology.
The exclusion criteria were as follows:
-
1.
women who were pregnant, preparing for pregnancy, or breastfeeding;
-
2.
patients with known or suspected allergy to iodine contrast agents or other contrast agents; and
-
3.
patients with known or suspected renal insufficiency;
-
4.
patients with non-enhanced lesions.
As shown in study flow chart (Fig. 1), a total of 312 lesions were found in 304 females (age range of 23–79 years, mean age of 51 ± 13 years) from December 2018 to September 2019.
Figure 1.
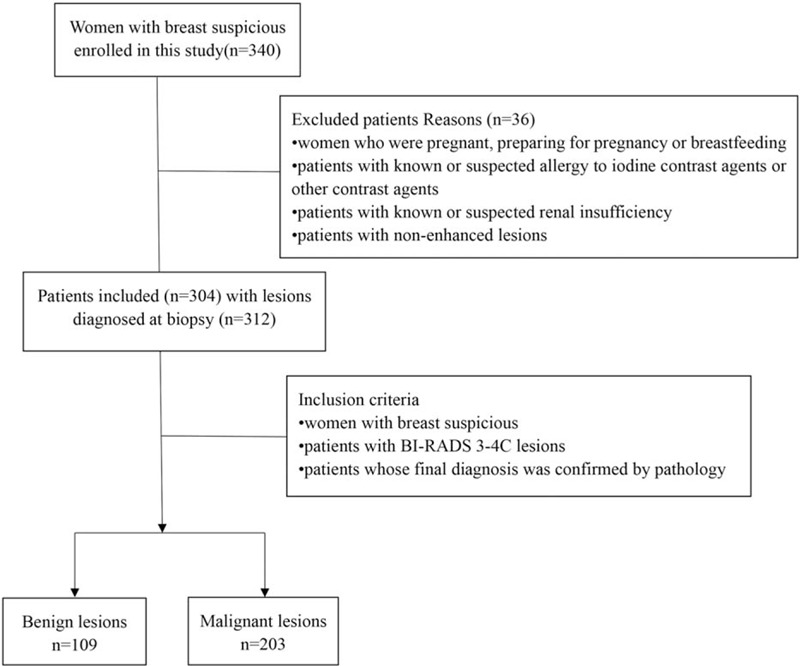
Flow chart of the study.
2.2. Imaging examination
CESM was performed using the Senographe Essential all-digital mammography system (GE Healthcare, Inc., Princeton, USA). Iohexol (containing 350 mg/ml of iodine; Beilu Pharmaceutical Co. Ltd., Beijing, China) was used as the contrast agent at a dose of 1.5 ml/kg. This contrast agent was injected into the upper arm vein through a high-pressure syringe at a flow rate of 3 ml/second. CESM images were photographed 2 minutes after the injection. The images were taken from the bilateral craniocaudal (CC) view of the affected breast to the mediolateral oblique (MLO) view of the affected breast to the CC view of the healthy breast to the MLO view of the healthy breast. The entire process was completed within 7 minutes for each patient. Low- and high-energy exposures were continuously acquired within 1.5 seconds of 1 compression while radiographing the patients according to the position. Two images, namely, a low-energy image and a subtraction image (acquired by subtracting the low-energy image from the high-energy image), were obtained on every radiographing position.
2.3. Image analysis
All images were automatically transmitted to the PACS system after completion of image acquisition, and 2 radiologists with more than 10 years of experience in mammography were double blinded while diagnosing the images from the 2 imaging techniques. Low-energy images (equivalent to digital mammography) were analyzed in accordance with the BI–RADS 2013 edition, including breast density and lesion location and type (symmetry, architectural distortion, calcification, mass, lymph gland, and skin). Differences in case classification were resolved by discussions until a consensus was reached. BI–RADS category 3–4C lesions were selected, and enhanced lesions on CESM subtraction images were included in this study. The BI-RADS classification of all lesions is shown in Table 1. Given that no standard exists for CESM enhancement, the lesions were classified on the basis of enhancement intensity and pattern of the subtraction images. The lesions were divided into 3 types according to enhancement intensity: type 1 enhancement (mild enhancement, i.e., enhancement intensity is similar to background enhancement), type 2 enhancement (moderate enhancement, i.e., between type 1 and type 3), type 3 enhancement (marked enhancement, i.e., enhancement intensity is considerably higher than background enhancement) (Fig. 2). The lesions were also divided into 3 types according to enhancement pattern: homogeneous, ring, and heterogeneous enhancement (Fig. 3). The radiologist was blinded to the pathology results.
Table 1.
The malignant rate of breast lesions for each BI–RADS category.

Figure 2.
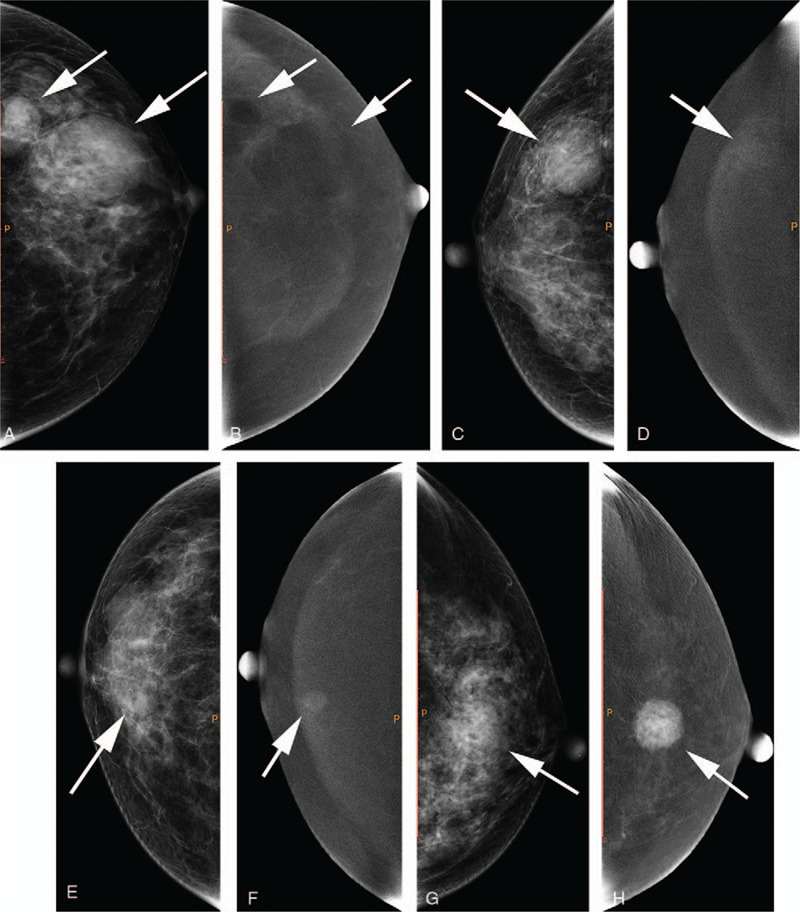
a, b: A 54-year-old female with lesions located at the left breast (white arrows); a, craniocaudal (CC) view of low-energy image; b, CC view of subtraction image. The lesions showed type 0 enhancement. c, d: A 67-year-old female with lesions located at the right breast (white arrow); c, CC view of low-energy image; d, CC view of subtraction image. The lesion showed type 1 enhancement. e, f: A 59-year-old female with lesions located at the right breast (white arrow); e, CC view of low-energy image; f, CC view of subtraction image. The lesion showed type 2 enhancement. g, h: A 51-year-old female with lesions located at the left breast (white arrow); g, CC view of low-energy image; h, CC view of subtraction image. The lesion showed type 3 enhancement.
Figure 3.
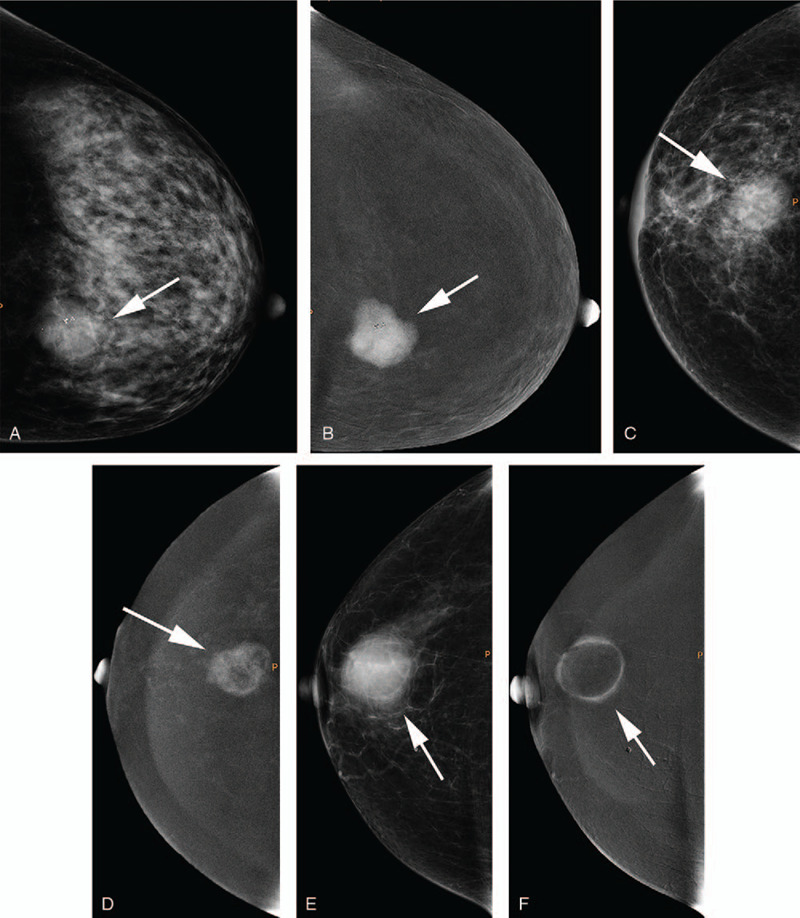
a, b: A 36-year-old female with lesions located at the left breast (white arrow); a, craniocaudal (CC) view of low-energy image; b, CC view of subtraction image. The lesion showed homogeneous enhancement. c, d: A 75-year-old female with lesions located at the right breast (white arrow); c, CC view of low-energy image; d, CC view of subtraction image. The lesion showed heterogeneous enhancement. e, f: A 60-year-old female with lesions located at the right breast (white arrow); e, CC view of low-energy image; f, CC view of subtraction image. The lesion showed ring enhancement.
Enhancement intensity and pattern were regarded as the quantification criteria of CESM. Each lesion was scored in accordance with the CESM quantification table and the BI–RADS classification criteria presented in the data. The lesions were classified as categories 3, 4A, 4B, and 4C to denote different malignancy rates, and their scores were 3, 4, 5, and 6, respectively. CESM score referred to the combination of the scores of enhancement intensity and pattern. Considering that the simultaneous existence of 2 different scoring systems in practical applications will inevitably lead to confusion, integrating them into a unified system may be more practical. Therefore, the BI–RADS and CESM scores were added together to obtain a new scoring system, namely, BI–RADS and CESM (BaC). BaC was then used as the final scoring standard.
2.4. Pathological analysis
All specimens were routinely fixed, embedded, and sectioned, and conventional H&E staining and immunohistochemical analysis were performed.
All pathological sections were interpreted by 2 pathologists, and the histological types of the lesions were obtained by referring to the 2012 WHO pathological classification and diagnosis criteria for breast tumors. The pathologists were blinded to the imaging features.
2.5. Statistical method
All measurements from the 2 observers were averaged. The consistency of the 2 observers was analyzed via Kappa test. 0 < κ ≤ 0.4 indicates poor agreement, 0.4 < κ < 0.75 denotes good agreement, and 0.75 ≤ κ < 1 represents excellent agreement.
The pathological results were used as the gold standard. Different variable, including ages, sex, enhancement pattern (homogeneous/heterogeneous/ring), enhancement type (type1/2/3) was collected. Multivariate logistic regression was applied to assess the relationships between enhancement pattern and malignancy. Odds ratio (OR) value was used to determine whether enhancement pattern was a risk factor for benign and malignant lesions.
The diagnostic efficacy of BI–RADS, CESM, and BaC scores for benign and malignant breast diseases was analyzed using receiver operating characteristic (ROC) curves. Z test was used to compare the area under the ROC curve (AUC). The cut-off value was determined on the basis of the ROC curve, and the specificity and sensitivity of each scoring system were calculated. The correlation between enhancement intensity and pathological results was analyzed via Spearman nonparametric correlation.
Measurement data were calculated using SPSS 13.0 statistical software, and AUC was calculated using Med Calc statistical software. P values <.05 were considered statistically significant.
3. Results
3.1. Pathological diagnosis
The results of the 2 observers were in good agreement, with a Kappa value of 0.789.
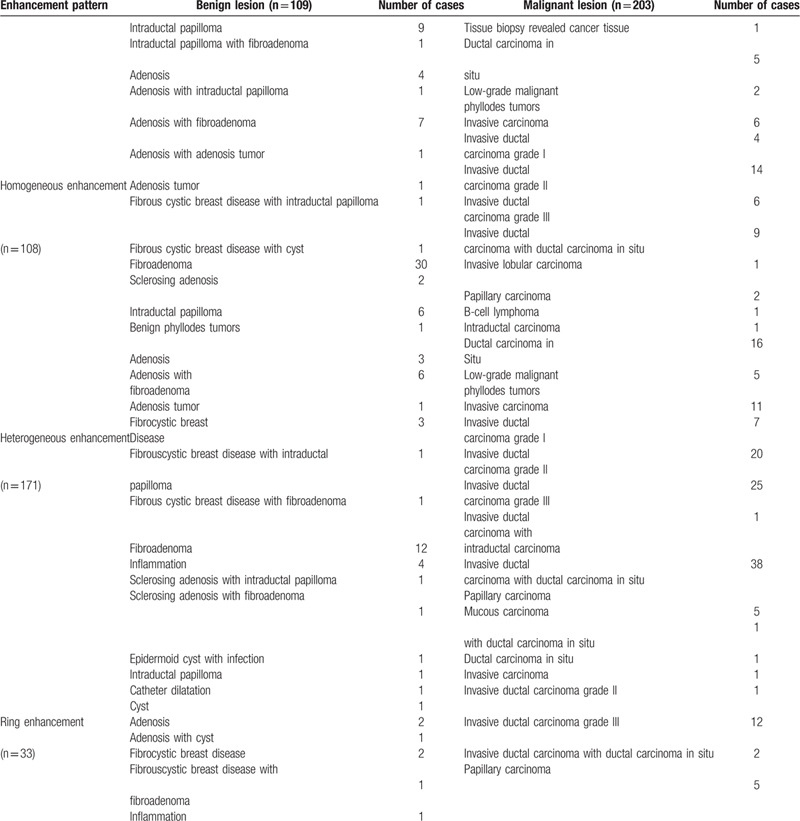
Among the 312 cases of breast lesions, 203 (65.1%) were malignant and 109 (34.9%) were benign (Tables 2 and 3). In addition, 42, 96, and 174 cases were type 1, type 2, and type 3 enhancement, respectively (Table 2). Among these cases, 108, 171, and 33 were homogeneous, heterogeneous, and ring enhancement, respectively (Table 3).
Table 2.
Enhancement intensity of breast lesions.
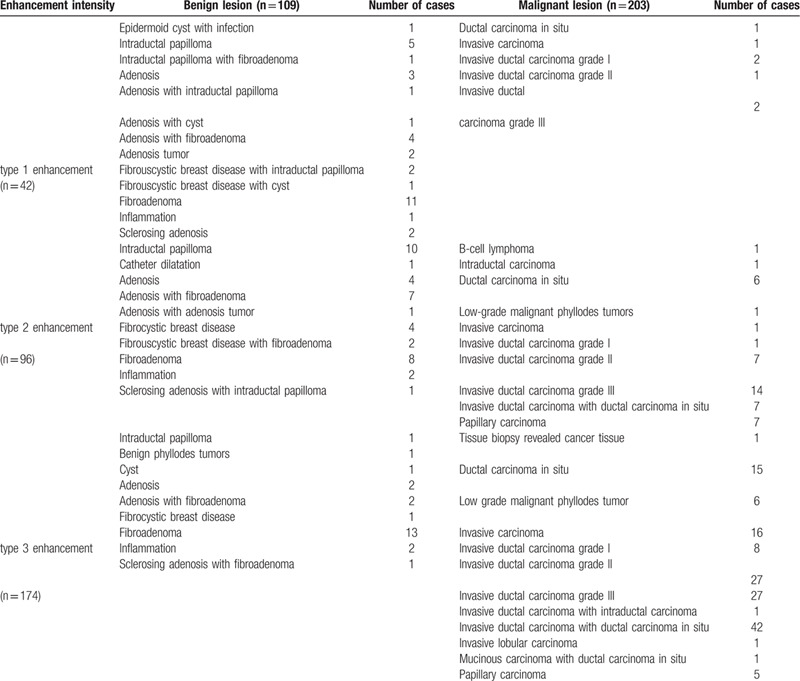
Table 3.
Enhancement pattern of breast lesions.
3.2. Correlation analysis
The lesions were divided into 3 types on the basis of enhancement intensity: mild, moderate, and marked enhancement (Table 4). A moderate correlation was observed between the enhancement degree and pathological result scores (r = 0.533, P = .000). This result indicated that the lesions with a high enhancement intensity were more likely to be malignant. Therefore, mild (type 1), moderate (type 2), and marked (type 3) enhancement were scored 1, 2, and 3, respectively.
Table 4.
The relationship between enhancement intensity and pathological results.

3.3. OR calculation
The lesions were also divided into 3 types on the basis of enhancement pattern: homogeneous, heterogeneous, and ring enhancement (Table 5).
Table 5.
The relationship between enhancement pattern and pathological results.

The relative malignant OR values of different enhancement patterns were calculated via multivariate logistic regression analysis (Table 6). Results showed that lesions with heterogeneous enhancement tended to be malignant, whereas those with homogeneous enhancement tended to be benign. In addition, the 95% confidence interval of the OR value of ring enhancement contained 1, suggesting no significant correlation between ring enhancement and the benignity or malignancy of lesions. Therefore, homogeneous, ring, and heterogeneous enhancement were scored −1,0,1, respectively.
Table 6.
OR values of different enhancement patterns.

3.4. Diagnostic efficacy of BaC
In this study, the minimum BaC score was 3 (BI–RADS) + 1 (enhancement intensity) – 1 (enhancement pattern) = 3, and the maximum BaC score was 6 (BI–RADS) + 3 (enhancement intensity) + 1 (enhancement pattern) = 10 (Fig. 4). The sensitivity and specificity of BaC with a score of 6 were 83.74% and 69.72%, respectively, whereas those of BaC with a score of 8 were 47.78% and 95.41%, respectively. The cut-off point for combining the best sensitivity and specificity was 7, with sensitivity and specificity of 69.46% and 87.16%, respectively (Fig. 5), and the positive and negative predictive values were 91.0% and 60.5%, respectively. The malignancy rate of each BaC score is listed in Table 7. The malignancy rate when 7 was used as the best cut-off point is shown in Table 8.
Figure 4.
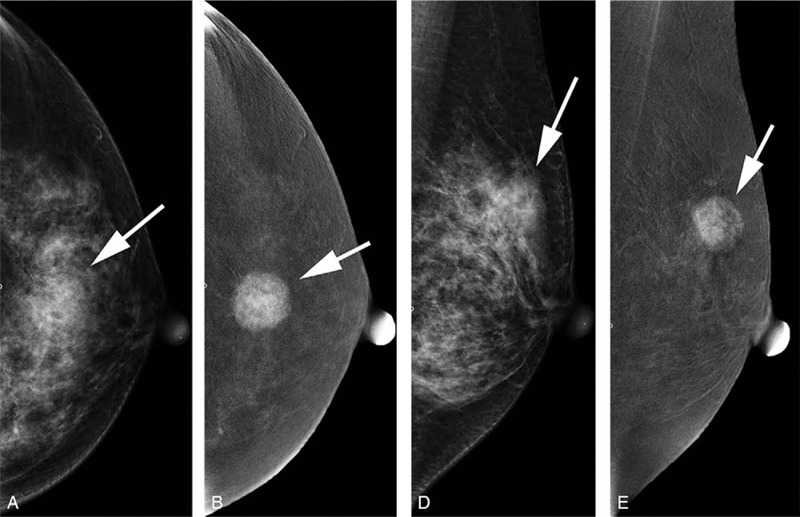
A 51-year-old female with lesions located at the left breast (white arrow); a, craniocaudal (CC) view of low-energy image; b, CC view of subtraction image; c, mediolateral oblique (MLO) view of low-energy image; d, MLO view of subtraction image. The lesion was classified as BI–RADS 4B on the basis of the low-energy image and showed heterogeneous type 3 enhancement according to the subtraction image. BaC: 5 + 3 + 1 = 9. Histopathology results showed invasive ductal carcinoma grade III.
Figure 5.
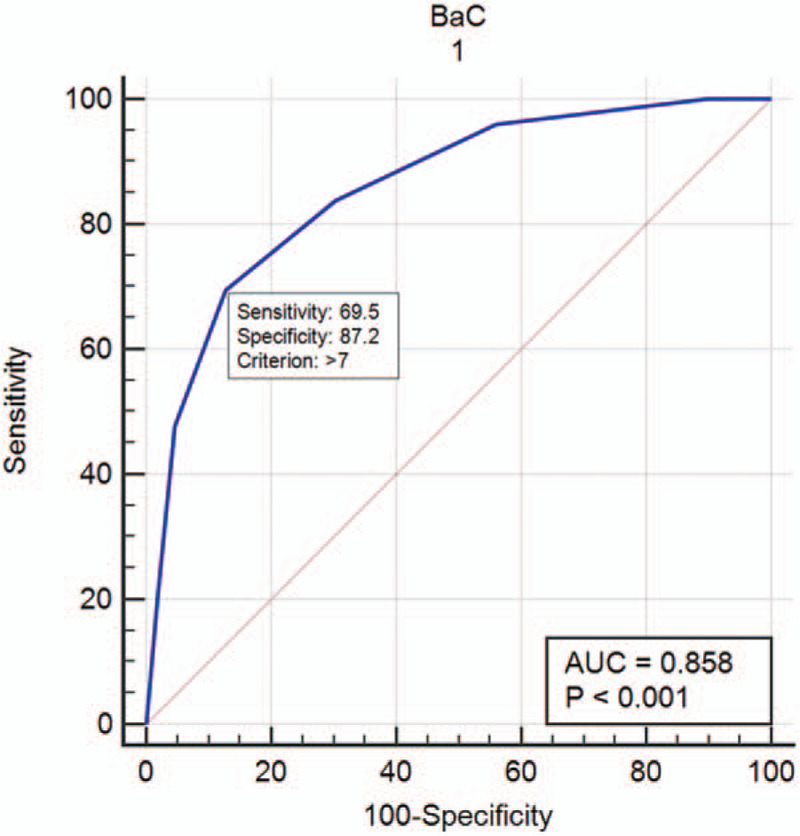
Diagnostic efficacy of BaC.
Table 7.
the malignant rate of breast lesions for each BaC score.
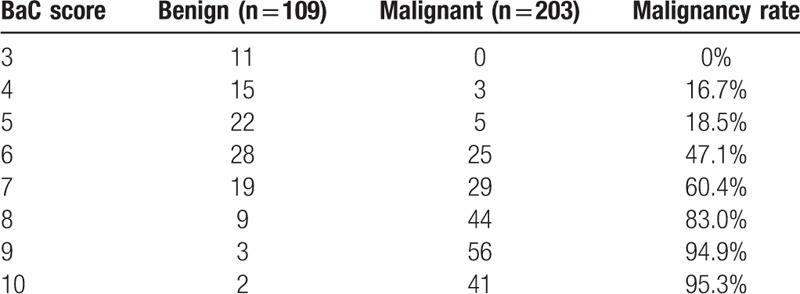
Table 8.
Cumulative malignant rates of BaC ≤ 7 and BaC > 7.

3.5. Comparison of diagnostic efficacies among different scoring systems
With the pathological results as the gold standard, the AUC of the BI–RADS, CESM, and BaC scores for the diagnosis of benign and malignant lesions were 0.814, 0.790, and 0.858, respectively (Table 9). The AUC of the BaC score was the highest, and the difference was statistically significant. The BI–RADS score had the lowest specificity, the CESM score had the lowest sensitivity, and the BaC score had the highest Youden index (Table 10). Therefore, the diagnostic accuracy of BaC was better than that of either BI–RADS or CESM alone. The overall diagnostic efficacy is shown in Figure 6 (ROC curve).
Table 9.
Diagnostic efficacy of different scoring systems.
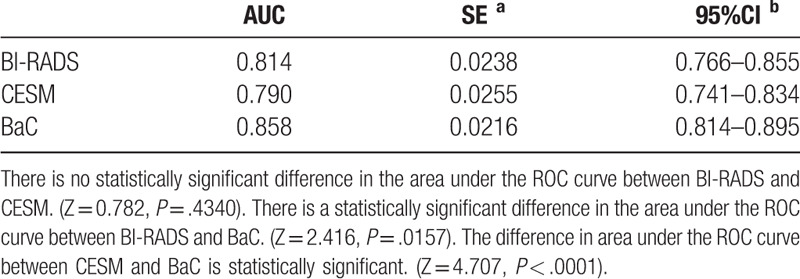
Table 10.
Diagnostic test values.

Figure 6.
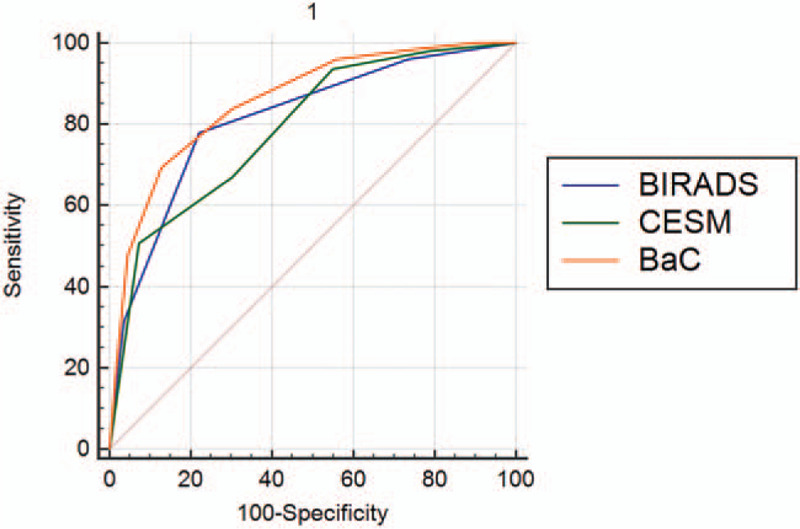
Comparison of the diagnostic efficacy of different scoring systems.
4. Discussion
Results showed that the enhancement intensity was moderately correlated with the pathological results (r = 0.533, P = .000), suggesting that the likelihood of malignancy increases with enhancement intensity. The lesions with heterogeneous enhancement tended to be malignant, whereas those with homogeneous enhancement tended to be benign. No significant correlation was found between ring enhancement and the benignity or malignancy of lesions. The AUC of BaC was higher than that of BI–RADS or CESM, and the difference was statistically significant. Moreover, the Youden index of BaC was the highest. Therefore, the diagnostic efficiency of BI–RADS combined with CESM enhancement (i.e., BaC) was better than that of either method alone. As the BaC value increases, the likelihood of malignancy of the lesion also gradually increases. The cut-off point of the best sensitivity and specificity of BaC was 7, which could best distinguish between benign and malignant lesions.
The most important consideration in the diagnosis of breast diseases is distinguishing benign from malignant lesions. The probability of malignancy of BI–RADS category 4 lesions ranges from 2% to 95%. Although these lesions can be further subdivided into categories 4A, 4B, and 4C, a certain level of subjectivity is inevitable in practical work. Different radiologists may give different classifications.BI–RADS category 3 lesions are clearly defined as noncalcified circumscribed solid mass, focal asymmetry and a solitary group of punctate calcifications.[11] Although the possibility of lesions being benign is high, the likelihood of malignancy is still less than 2%. Therefore, BI–RADS category 3 and 4 lesions must be further studied to improve the diagnostic accuracy of breast lesions.
Several studies on CESM enhancement have been conducted. M.B.I. Lobbes et al demonstrated that CESM enhancement intensity can be used to differentiate benign from malignant breast lesions.[12] Deng et al reported that benign and malignant breast lesions have fundamentally different degrees of enhancement, and a high degree of enhancement suggests that lesions are likely malignant.[13] The results of the studies are consistent with our findings. However, neither of them combined BI–RADS with CESM enhancement to maximize the full benefits of CESM. Thus, the practical application value of these studies is limited. Tsigginou et al highlighted that the combination of BI–RADS and CESM enhancement intensity can differentiate benign and malignant breast lesions better than by using BI–RADS alone.[14] However, they did not include CESM enhancement patterns. The breast MRI imaging section of the BI–RADS 2013 edition emphasized that homogeneous enhancement is an indication of benign lesions, whereas heterogeneous enhancement is a feature of malignant lesions.[11] The present study showed that this principle could also be applied in analyzing CESM enhancement patterns. Although the breast MRI imaging section of the BI–RADS 2013 edition indicated that ring enhancement is an attribute of malignant lesions, Mohamed et al argued that CESM is different from MRI and ring enhancement cannot be used as a reliable sign to judge the nature of lesions.[16] The present findings also supported this view. Instead of assigning the same score to all BI–RADS category 4 lesions, 4A, 4B, and 4C lesions were evaluated separately to enhance the accuracy of the results, because the malignant likelihood of these 3 types of lesions is not the same. This is a novelty of the present study.
CESM has a higher sensitivity and specificity than digital mammography.[15] Several studies proved that the diagnostic accuracy of CESM is comparable to that of MRI.[7,8,9,10] In addition, CESM has a shorter examination time, no noise, and a lower cost. It is especially suitable for patients with contraindications of breast MR examination. Phillips et al reported that high-risk groups prefer CESM over MRI as a screening tool.[17] The information provided by CESM must be thoroughly evaluated and analyzed, especially that CESM is increasingly used in clinical practice.
CESM provides 2 images: a low-energy image and a subtraction image. A low-energy image is equivalent to a digital mammography and can be evaluated by BI–RADS. Subtraction images can show the intensity and pattern of enhancement of the lesion, however, no uniform standard has been proposed for evaluating the enhancement of CESM subtraction images. If low-energy and CESM subtraction images are evaluated separately, confusion will inevitably arise in practical work. Therefore, this study combined BI–RADS and the enhancement intensity and pattern of CESM subtraction images (i.e., BaC) to improve the diagnostic accuracy of breast diseases. Results showed that the diagnostic efficiency of this combination was better than that of either method alone. The BI–RADS 2013 edition requires a follow-up review of all category 3 lesions and recommends tissue biopsy for category 4 lesions. Our research may help patients reduce or eliminate unnecessary follow-up reviews and tissue biopsies.
The present work has limitations. The method adopted for evaluating enhancement intensity and pattern was subjective. Although this method is more convenient than the other methods to apply in actual clinical work, a quantitative analysis of CESM enhancement will obtain more accurate results. This supposition should be investigated in future studies.
5. Conclusion
The diagnostic efficacy of BI–RADS combined with CESM enhancement intensity and pattern was superior to that of either method alone. This combination provides a more accurate evaluation of the nature of breast lesions.
Author contributions
This study was conceived and designed by Yongbin Lv, Xiaoxiao Chi Dong Xing and Qianqian Chen. Xiaoxiao Chi, Lei Zhang, Dong Xing and Peiyou Gong recruited patients for examination. Lei Zhang and Dong Xing collected data. Xiaoxiao Chi, Yongbin Lv and Lei Zhang analyzed and interpreted the data statistically. Xiaoxiao Chi ,Lei Zhang and Dong Xing drafted the manuscript. Yongbin Lv and Qianqian Chen reviewed the manuscript. All authors read and approve the final manuscript.
Footnotes
Abbreviations: 2DUS = 2-dimensional ultrasound, AUC = area under the ROC curve, BI–RADS = breast imaging–reporting and data system, CC = craniocaudal, CESM = contrast-enhanced spectral mammography, DM = digital mammography, MLO = mediolateral oblique, OR = odds ratio, ROC = receiver operating characteristic.
How to cite this article: Chi X, Zhang L, Xing D, Gong P, Chen Q, Lv Y. Diagnostic value of the enhancement intensity and enhancement pattern of CESM to benign and malignant breast lesions. Medicine. 2020;99:37(e22097).
XC is the first author, LZ and DX are co-first author, and PG and QC are the co-author.
The authors declare that they have no competing interests.
This research received no specific grant from any funding agency in the public, commercial, or not-for-profit sectors.
All data generated or analyzed during this study are included in this published article [and its supplementary information files].
References
- [1].Siegel R, Ward E, Brawley O, et al. Cancer statistics, 2011: the impact of eliminating socioeconomic and racial disparities on premature cancer deaths. CA Cancer J Clin 2011;61:212–36.. Epub 2011 Jun 17. PMID: 21685461. [DOI] [PubMed] [Google Scholar]
- [2].Jong RA, Yaffe MJ, Skarpathiotakis M, et al. Contrast-enhanced digital mammography: initial clinical experience. Radiology 2003;228:842–50.. Epub 2003 Jul 24. PMID: 12881585. [DOI] [PubMed] [Google Scholar]
- [3].Pisano ED, Hendrick RE, Yaffe MJ, et al. Diagnostic accuracy of digital versus film mammography: exploratory analysis of selected population subgroups in DMIST. Radiology 2008;246:376–83.. PMID: 18227537; PMCID: PMC2659550. [DOI] [PMC free article] [PubMed] [Google Scholar]
- [4].Lalji UC, Jeukens CR, Houben I, et al. Evaluation of low-energy contrast-enhanced spectral mammography images by comparing them to full-field digital mammography using EUREF image quality criteria. Eur Radiol 2015;25:2813–20.. Epub 2015 Mar 27. PMID: 25813015; PMCID: PMC4562003. [DOI] [PMC free article] [PubMed] [Google Scholar]
- [5].Patel BK, Lobbes MBI, Lewin J. Contrast Enhanced Spectral Mammography: a review. Semin Ultrasound CT MR 2018;39:70–9.. Epub 2017 Aug 24. PMID: 29317041. [DOI] [PubMed] [Google Scholar]
- [6].Dromain C, Thibault F, Diekmann F, et al. Dual-energy contrast-enhanced digital mammography: initial clinical results of a multireader, multicase study. Breast Cancer Res 2012;14:R94.PMID: 22697607; PMCID: PMC3446357. [DOI] [PMC free article] [PubMed] [Google Scholar]
- [7].Helal MH, Mansour SM, Salaleldin LA, et al. The impact of contrast-enhanced spectral mammogram (CESM) and three-dimensional breast ultrasound (3DUS) on the characterization of the disease extend in cancer patients. Br J Radiol 2018;91:20170977.Epub 2018 May 24. PMID: 29641226; PMCID: PMC6221789. [DOI] [PMC free article] [PubMed] [Google Scholar]
- [8].Li L, Roth R, Germaine P, et al. Contrast-enhanced spectral mammography (CESM) versus breast magnetic resonance imaging (MRI): a retrospective comparison in 66 breast lesions. Diagn Interv Imaging 2017;98:113–23.. Epub 2016 Sep 26. PMID: 27687829. [DOI] [PubMed] [Google Scholar]
- [9].Fallenberg EM, Dromain C, Diekmann F, et al. Contrast-enhanced spectral mammography: does mammography provide additional clinical benefits or can some radiation exposure be avoided? Breast Cancer Res Treat 2014;146:371–81.. Epub 2014 Jul 2. PMID: 24986697. [DOI] [PubMed] [Google Scholar]
- [10].Lewin J. Comparison of contrast-enhanced mammography and contrast-enhanced breast mr imaging. Magn Reson Imaging Clin N Am 2018;26:259–63.. Epub 2018 Feb 21. PMID: 29622130. [DOI] [PubMed] [Google Scholar]
- [11].D’Orsi CJ, Sickles EA, Mendelson EB, et al. ACR BI-RADS Atlas, Breast Imaging Reporting and Data System. Reston, VA: American College of Radiology; 2013. [Google Scholar]
- [12].Lobbes MBI, Mulder HKP, Rousch M, et al. Quantification of enhancement in contrast-enhanced spectral mammography using a custom-made quantifier tool (I-STRIP): a proof-of-concept study. Eur J Radiol 2018;106:114–21.. Epub 2018 Jul 24. PMID: 30150032. [DOI] [PubMed] [Google Scholar]
- [13].Deng CY, Juan YH, Cheung YC, et al. Quantitative analysis of enhanced malignant and benign lesions on contrast-enhanced spectral mammography. Br J Radiol 2018;91:20170605.Epub 2018 Feb 27. PMID: 29451413; PMCID: PMC6223273. [DOI] [PMC free article] [PubMed] [Google Scholar]
- [14].Tsigginou A, Gkali C, Chalazonitis A, et al. Adding the power of iodinated contrast media to the credibility of mammography in breast cancer diagnosis. Br J Radiol 2016;89:20160397.Epub 2016 Aug 9. PMID: 27452266; PMCID: PMC5124843. [DOI] [PMC free article] [PubMed] [Google Scholar]
- [15].Mori M, Akashi-Tanaka S, Suzuki S, et al. Diagnostic accuracy of contrast-enhanced spectral mammography in comparison to conventional full-field digital mammography in a population of women with dense breasts. Breast Cancer 2017;24:104–10.. Epub 2016 Mar 4. PMID: 26942415. [DOI] [PubMed] [Google Scholar]
- [16].Mohamed Kamal R, Hussien Helal M, Wessam R, et al. Contrast-enhanced spectral mammography: impact of the qualitative morphology descriptors on the diagnosis of breast lesions. Eur J Radiol 2015;84:1049–55.. Epub 2015 Mar 16. PMID: 25818731. [DOI] [PubMed] [Google Scholar]
- [17].Phillips J, Miller MM, Mehta TS, et al. Contrast-enhanced spectral mammography (CESM) versus MRI in the high-risk screening setting: patient preferences and attitudes. Clin Imaging 2017;42:193–7.. Epub 2016 Dec 28. PMID: 28107737. [DOI] [PubMed] [Google Scholar]


