Abstract
Angiogenic factor with G-patch and FHA domain 1 (AGGF1) is a newly initiator of angiogenesis. Forkhead box C2 (FOXC2) that is a member of the winged spiral transcription factor family plays an important role in epithelial-mesenchymal transition (EMT). Epithelial-cadherin (E-cad) that is an adhesion molecule is also involved in EMT. The purpose of this study is to investigate the expression of AGGF1, FOXC2, and E-cad in esophageal squamous cell carcinoma (ESCC) and their clinical significance.
Immunohistochemistry was performed to investigate the expression of AGGF1, FOXC2, and E-cad in 170 ESCC specimens and corresponding normal esophageal mucosa tissues. Follow-up data was also collected.
The positive rates of AGGF1 and FOXC2 expression were significantly higher in ESCC group when compared with the control group; the positive rate of E-cad expression was significantly lower in ESCC group when compared with the control group. Positive rates of AGGF1, FOXC2, and E-cad expression were significantly associated with grades of differentiation, tumor grades, lymph node metastasis stages, as well as tumor-node-metastasis stages. Kaplan–Meier analysis demonstrated that positive expression of AGGF1 or FOXC2 for ESCC patients had significantly unfavorably overall survival time when compared with patients with negative expression of AGGF1 or FOXC2; and positive expression of E-cad for ESCC patients had significantly longer overall survival time when compared with patients with negative expression of E-cad. Multivariate analysis indicated that AGGF1, FOXC2, and E-cad expression and tumor-node-metastasis stages were postoperative independent prognostic factors for ESCC patients.
AGGF1, FOXC2, and E-cad may be considered promising biomarkers of ESCC patients’ prognosis.
Keywords: angiogenic factor with G-patch and FHA domain 1, E-cadherin, epithelial mesenchymal transition, esophageal squamous cell carcinoma, forkhead box C2, prognosis
1. Introduction
Esophageal cancer ranks 7th in terms of incidence and 6th in terms of mortality in the worldwide.[1] In China, esophageal cancer was estimated 478,000 new cases and 375,000 deaths in 2015.[2] Esophageal squamous cell carcinoma (ESCC) is the most common type in esophageal cancers. Because of asymptomatic or atypical symptoms at early stages, most ESCC patients are in the advanced stage when they are diagnosed in China. Angiogenic factor with G-patch and FHA domain 1 (AGGF1) that was originally identified in 2004 is a new human angiogenic factor.[3] AGGF1 gene is expressed in vascular endothelial cells and can strongly promote angiogenesis in vitro.[3] Some studies have demonstrated that AGGF1 is overexpressed in some malignant tumors and is significantly associated with tumor angiogenesis.[4–7] Knockdown of AGGF1 can inhibit invasion and migration of tumor cells.[4] However, the AGGF1 expression and its prognostic value in ESCC patients have not been reported.
Forkhead-box (FOX) superfamily has been involved in differentiation, proliferation, migration, and apoptosis.[8,9] FOXC2, a member of the FOX superfamily, plays an important role in epithelial-mesenchymal transition (EMT).[10] Expression of FOXC2 is also play an essential role in vascular/lymphatic vessel in cardiovascular disease.[11] It has been demonstrated that overexpression of FOXC2 could induce metastasis and paclitaxel drug resistance.[12,13] FOXC2 can promote tumor cells proliferation through activating mitogen-activated protein kinase and phosphatidylinositol 3-kinase/AKT signaling pathways.[14] It has been demonstrated that FOXC2 overexpression associated with poor prognosis.[15,16] However, the FOXC2 expression and its prognostic value in ESCC patients have not been widely reported.
EMT, which is lost epithelial features and gained mesenchymal features in epithelial cancers, should be involved in the process of invasiveness and metastasis for epithelial cancers. The molecular hallmark of EMT is down-regulation of E-cadherin (E-cad) and up-regulation of vimentin, N-cadherin, Snail, and so on. E-cad that maintain stable cell to cell contact in epithelial cells is a transmembrane glycoprotein. Down-expression of E-cad is closely correlated poor prognosis and also promote invasiveness and metastasis for various epithelial cancers.[17–19]
Overall, accumulating evidence has suggested that AGGF1, FOXC2, and E-cad should be involved in the process of tumor invasiveness and metastasis. However, associations among AGGF1, FOXC2, and E-cad in ESCC have not been widely reported. The purpose of this study is to investigate the expression of AGGF1, FOXC2, and E-cad in ESCC and evaluate the hypothesis that they are correlated with metastasis and prognosis in ESCC.
2. Methods
2.1. Patients and specimens
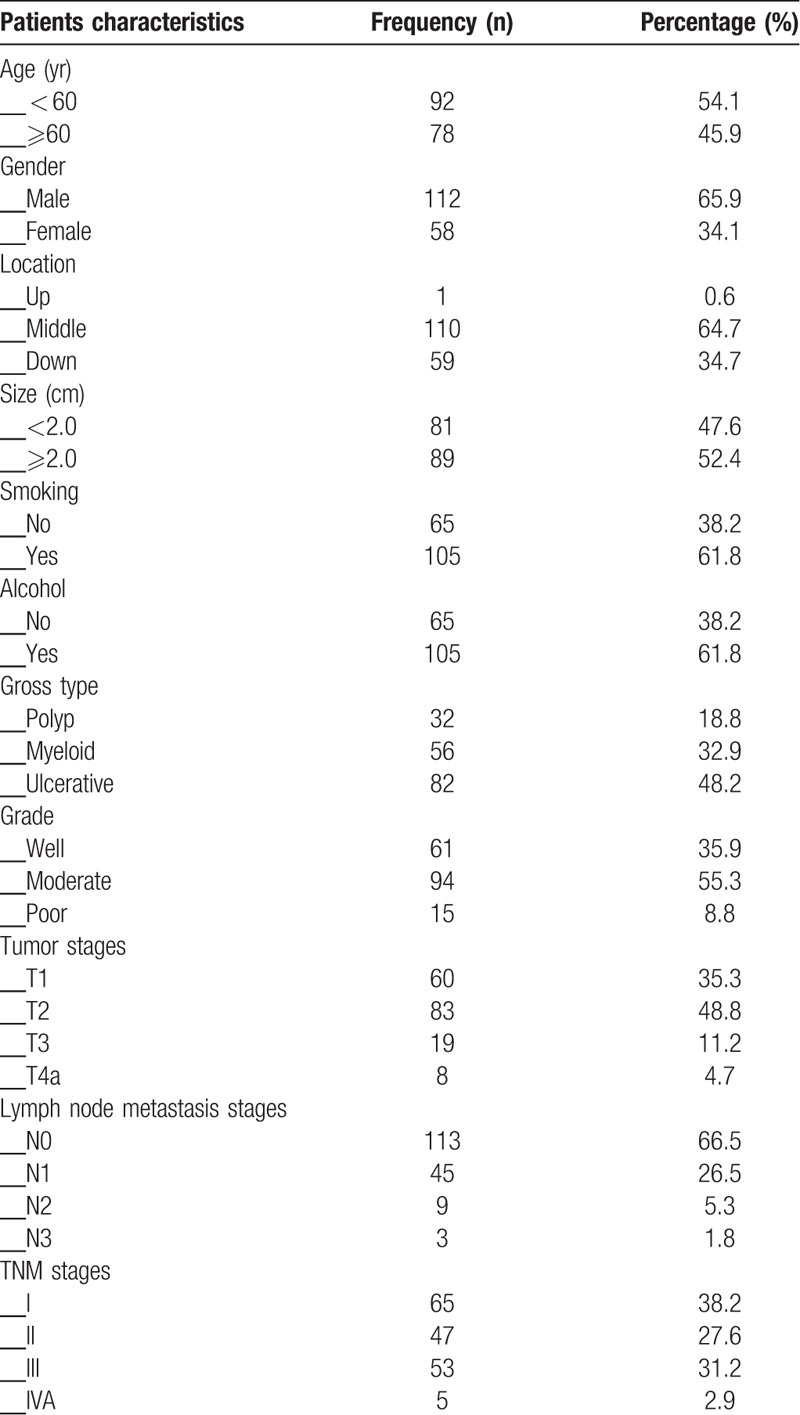
All 170 ESCC's patients who were diagnosed at department of pathology of our hospital, from January 2012 to December 2013, were considered as experimental group. And 170 corresponding normal esophageal mucosa tissues came from the same patients were considered as control group. ESCC's patients who received chemoradiotherpy or any other anti-cancer therapy were excluded. This study was approved by Bengbu Medical University ethical committee and performed in accordance with the guidelines issued of the Declaration of Helsinki. All samples were obtained with patients writing consent. Patients clinicopathological characteristics, demography, and follow-up data were collected. Postoperative overall survival (OS) time was assessed from patients’ surgery date to his/her death date or December 2018. Tumor-node-metastasis stages were assessed on the basis of the 8th edition of the guidelines issued by American Joint Committee on Cancer. Specific characteristics see Table 1.
Table 1.
Patients characteristics.

2.2. Immunohistochemistry
Immunohistochemistry was carried out on the basis of guideline issued by the ElivisionTM Plus detection kit instructions. All samples were fixed in 10% buffered formalin solution, and then embedded in paraffin. Subsequently, continuous 4 μm thick tissue slices were cut. All tissue slices were deparaffinized with xylene and then dehydrated with graded alcohol, washed with phosphate buffer solution (PBS, pH 7.2) for 10 minutes. Endogenous peroxidase activity of tissues was blocked with methanol containing 3% hydrogen peroxide solution. Antigen repaired with citrate buffer (pH 6.0) which was heated to 95°C for 30 minutes. Then several washes with PBS, all slices were blocked with goat serum at room temperature for 20 minutes, incubated with rabbit polyclonal antibody against human AGGF1 and FOXC2 (AGGF1: DF12109; FOXC2: DF3252; Affinity Biosciences, Co., Ltd., Cincinnati, OH), mouse monoclonal antibody against human E-cad (E-cad: MX020; Fuzhou Maixin Biotechnology Development Co., Ltd., China) at 4°C overnight. Then added reagent A (9903-A) and reagent B (9903-B) in sequence. Finally, all slices were developed in diaminobenzidine (DAB) substrate solution and re-dyed with hematoxylin.
2.3. Evaluation of immunostaining
To prevent intratumoral heterogeneity of biomarker expression, 10 areas randomly at high-power-field from different areas of each slice were selected. Two independent pathologists who were blind to clinicopathological, demography, and follow-up data explained immunostaining results. If there was a disagreement, 2 pathologists would re-evaluate immunostaining results and reach a consensus. Immunostaining results were calculated from the product of immunostaining intensity and extent.[17] For ESCC tissues that were positive for three of AGGF1, FOXC2, and E-cad, an average of the product of each slice was taken. Here, the score ≥3 was considered positive result.
2.4. Statistical analysis
Associations between clinicopathological parameters and AGGF1, FOXC2, and E-cad were used Chi-squared test or Fisher exact test. Associations among AGGF1, FOXC2, or E-cad were used Spearman test. The effects of AGGF1, FOXC2, or E-cad on OS were defined using Kaplan–Meier method for univariate analysis. Independently prognostic factors were defined using COX regression model for multivariate analysis. All statistical analyses were used SPSS 19.0 software for Window (Chicago, IL). A value of P < .05 was defined statistically significant.
3. Results
3.1. Expression of AGGF1, FOXC2, and E-cad in ESCC, and its association with clinicopathological parameters
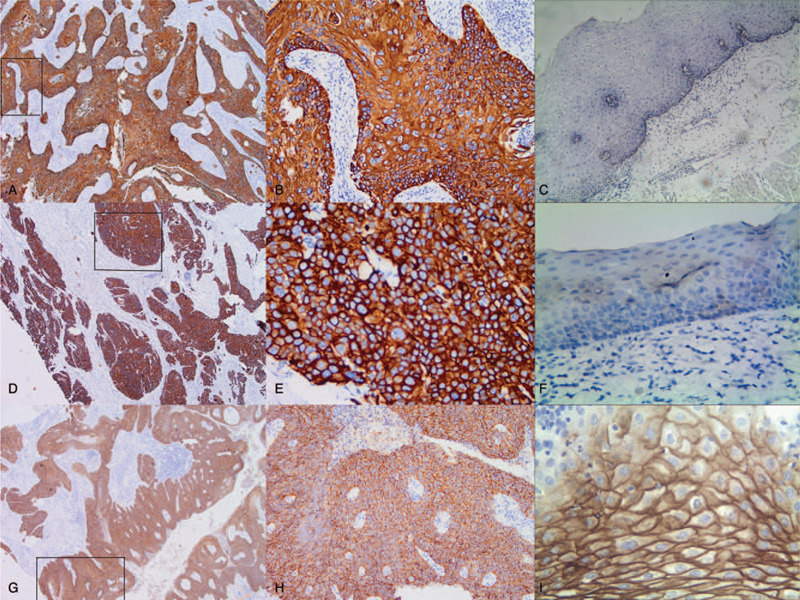
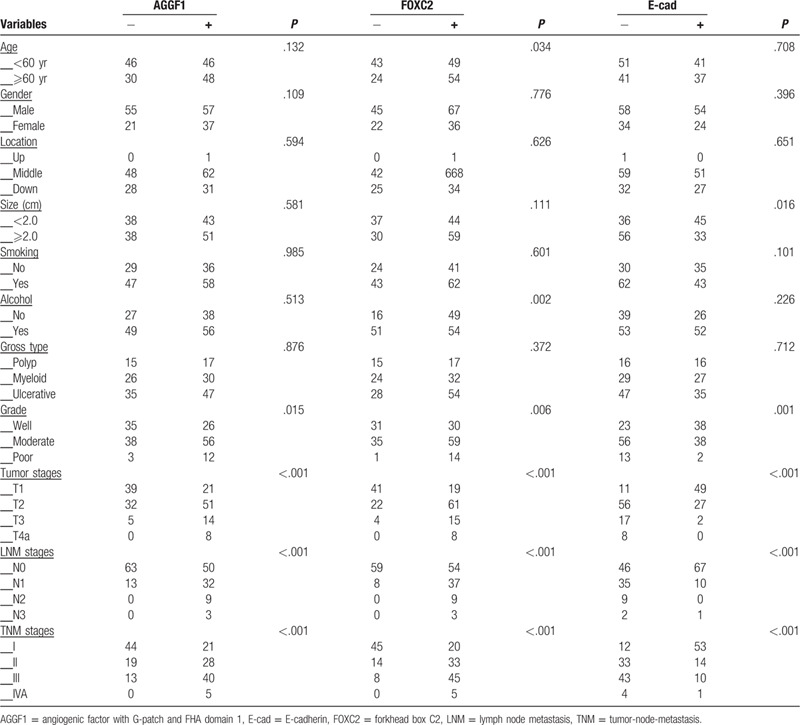
The positive staining of AGGF1 was confined to the cytoplasm of ESCC cases, that of FOXC2 was confined to the cytoplasm, and that of E-cad was confined to the cell cytoplasm and membrane. Overall, AGGF1 expression was detected in 10 (5.9%) in normal esophageal mucosa samples 94/170 (55.3%) and in ECSS cases (Figs. 1A and 1B). The difference between the groups was significant (P < .001). AGGF1 expression positively associated with tumor differentiation, tumor stages, lymph node metastasis (LNM), and tumor-node-metastasis (TNM) stages, but not with patient age, gender, smoking status, alcohol status, tumor location, gross type, and tumor size (Table 2).
Figure 1.

Immunostaining for AGGF1 (angiogenic factor with G-patch and FHA domain 1), FOXC2 (forkhead box C2), and E-cad (E-cadherin) in esophageal squamous cell carcinoma and control tissue. A, Positive AGGF1 in the cytoplasm of esophageal squamous cell carcinoma tissue (40 magnification) B, Positive AGGF1 in the cytoplasm of esophageal squamous cell carcinoma tissue (40 magnification); C, Negative AGGF1 in the control tissue (100 magnification), C: Negative AGGF1 in the control tissue; D, Positive FOXC2 in the cytoplasm of cancer cells (40 magnification); E, Positive FOXC2 in the cytoplasm of cancer cells (400 magnification); F, Negative FOXC2 in the control tissues (100 magnification); G, Positive E-cad in the cytoplasm and membrane of cancer tissue (40 magnification), H, Positive E-cad in the cytoplasm and membrane of cancer tissue (400 magnification); I, Positive E-cad in the cytoplasm and membrane of control cells (400 magnification).
Table 2.
The associations between expression of angiogenic factor with G-patch and FHA domain 1, forkhead box C2, and E-cadherin and clinicopathological characteristics of esophageal squamous cell carcinoma.

There was a significant difference in FOXC2 expression between the control cases (8/170, 4.7%) and ESCC (103/170, 60.6%; P < .001; Figs. 1C and 1D). The expression of FOXC2 positively associated with patients age, tumor differentiation, tumor stages, LNM, and TNM stages as well as alcohol status, but not with patient gender, smoking status, tumor location, gross type, and tumor size (Table 2).
There were significantly more control cases (161/170, 94.7%) expressing E-cad than ESCC cases (78/170, 45.9%; P < .001; Figs. 1E and 1F). The positive expression of E-cad inversely associated with tumor size, differentiation, tumor stages, LNM, and TNM stages, but not with patient age, gender, smoking status, alcohol status, tumor location, and gross type (Table 2).
3.2. Univariate and multivariate analyses
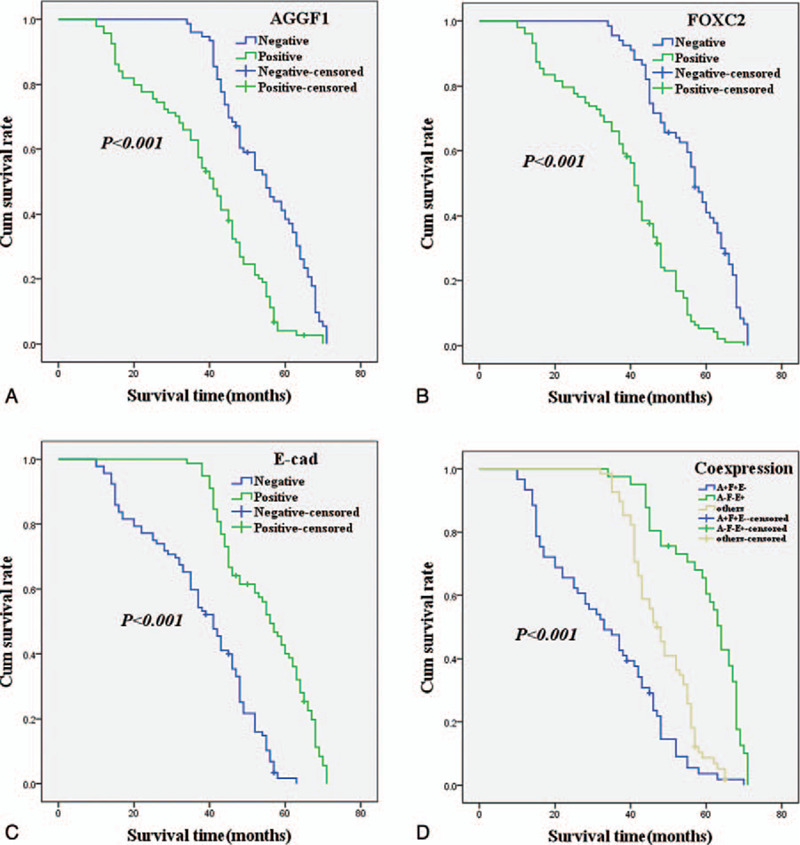
As shown in Figure 2A, the Kaplan–Meier survival analysis demonstrated that the OS time of ESCC patients who expressed AGGF1 was significantly lower than that of patients who did not express the protein (log-rank= 39.498, P < .001). The OS time for FOXC2-positive patients was significantly lower that of FOXC2-negative patients (log-rank= 52.947, P < .001; Fig. 2B), showing similar results to those of AGGF1 expression. The association between E-cad expression and OS time was the inverse to that AGGF1 and FOXC2, with patients who expressed E-cad surviving longer than those who did not express the protein (log-rank= 55.268, P < .001; Fig. 2C). As shown in Fig. 2D, the univariate OS time of the combination of E-cad- and AGGF1+FOXC2+ was significantly lower than that in E-cad+ and AGGF1-FOXC2-patients (log-rank= 71.262, P < .001).
Figure 2.

Kaplan–Meier analysis curve of the survival rate of patients with esophageal squamous cell carcinoma. The y-axis means the percentage of patients; the x-axis means their survival in months. A, OS (overall survival) analysis of all patients in relation to AGGF1 (angiogenic factor with G-patch and FHA domain 1) (log-rank = 39.498, P < .001); B, OS analysis of all patients in relation to FOXC2 (forkhead box C2) expression (log-rank = 52.947, P < .001); C, OS analysis of all patients in relation to E-cad (E-cadherin) expression (log-rank = 55.268, P < .001); A, B, and C analyses, the green line represents patients with positive AGGF1, or FOXC2, or E-cad; the blue line representing the negative AGGF1, or FOXC2, or E-cad group. D, OS survival of all patients in relation to the combination of E-cad, AGGF1, and FOXC2 expression (log-rank = 85.730, P < .001). The green line represents negative E-cad and positive AGGF1, FOXC2, and the blue line represents positive E-cad and negative AGGF1, FOXC2. The brown line represents other positive or negative proteins (log-rank = 71.262, P < .001).
Table 3 showing the number of patients at risk in each time point (20, 40, and 60 months) under the Kaplan–Meier curve.
Table 3.
The number of patients at risk in each time point.

The multivariate analysis indicated that the expression of AGGF1, FOXC2, and E-cad and TNM stages were independently prognostic factors for ESCC (Table 4).
Table 4.
Results of multivariate analyses of overall survival time.

3.3. Association between the expression of AGGF1, FOXC2, and E-cad in ESCC
The spearman correlation coefficient analysis suggested a negative association between E-cad expression and AGGF1 (r= –0.525, P < .001) or FOXC2 (r = –0.610, P < .001) expression. There was a positive association between AGGF1 expression and FOXC2 (r = 0.364, P < .001) (Table 5).
Table 5.
Correlation among expression of angiogenic factor with G-patch and FHA domain 1, forkhead box C2, E-cadherin in esophageal squamous cell carcinoma.

4. Discussion
ESCC is a common malignant tumor of digestive system. Since ESCC is highly heterogeneous, it seriously threatens the lives and health of patients. Therefore, it is urgent to seek effective markers that comprehensively predict the biological behavior of ESCC.
AGGF1 is a marker of angiogenic factor, whose overexpression can promote angiogenesis. Down-expression of AGGF1 can inhibit invasion and migration of tumor cells.[4] In our study, we detected AGGF1 expression in ESCC and the corresponding normal esophageal mucosa tissues and found that the ESCC tissues expressed higher levels of the protein than control tissues. Furthermore, AGGF1 expression positively associated with tumor differentiation, tumor stage, LNM, as well as TNM stages. The OS analysis indicated that ESCC patients expressing AGGF1 survived for less time than patients who did not express AGGF1. Our findings demonstrated that overexpression of AGGF1 is involved in the invasiveness and metastasis of ESCC and that AGGF1 should be considered a valuable and useful marker in prediction of ESCC prognosis.
FOXC2, a member of the family of winged helix/forkhead transcription factors, is reported to be involved in cells proliferation, migration, and angiogenesis.[8,9] It has been demonstrated that overexpression of FOXC2 is associated with Notch, ERK, and Wnt signaling pathway.[20–22] In our study, overexpression of FOXC2 was positively associated with tumor differentiation, tumor stages, LNM, and TNM stages. The OS analysis suggested that patients who expressed FOXC2 survived for less time than patients did not express the protein. These findings suggested that FOXC2 expression plays a key role in ESCC invasiveness and metastasis and that FOXC2 is closely associated with poor prognosis, which are consistent with previous studies.[15,16,23]
E-cad, an adhesive transmembrane glycoprotein, widely exists in epithelial cells. E-cad has ability to mediate the adhesion between epithelial cells and epithelial cells. Aberrant expression of E-cad leads to the adhesion of epithelial cells each other loss or less, causing cells easily to move, finally promote tumor cells invasion and metastasis.[24] Our results suggested that E-cad expression was negatively associated with tumor differentiation, tumor stages, LNM, and TNM stages. In addition, the OS analysis demonstrated that patients expressing E-cad lived longer than those who did not express the protein. These findings indicated that aberrant expression of E-cad promoted ESCC invasiveness and metastasis and should be considered a potential marker to predict ESCC prognosis, which are in accordance with previous studies.[17–19,25]
Previous studies have demonstrated that tumors require nutrient and oxygen supply for growth and metastasis. Overexpression of AGGF1 promotes tumor cells proliferation, migration, angiogenesis, and malignant biological behaviors.[26,27] Knockdown of AGGF1 inhibits tumor cells invasion and metastasis via EMT through Wnt/β-catenin pathway.[4] Overexpression of FOXC2 also promotes tumor cells proliferation, migration, apoptosis, and angiogenesis/lymphangiogenesis.[8,9] Down-regulation of E-cad at epithelial cells junction is an early event in EMT.[28,29] In cancer cells, down- or loss-expression of E-cad can result from transcriptional repression by EMT regulators.[29] FOXC2 is also involved in invasiveness and metastasis of tumor cells through EMT or EMT regulatory pathways.[30] Therefore, up-regulation of AGGF1 and FOXC2 and down-regulation of E-cad may synergistic promote tumor cells progression, invasion, and metastasis through EMT. In this study, we found that positive expression of AGGF1, FOXC2, and E-cad, as well as TNM stages were independently prognostic factors of OS for ESCC patients. We also found that E-cad expression was inversely associated with AGGF1 and FOXC2 expression and that AGGF1 expression was positively associated with FOXC2 expression.
5. Conclusions
The results of this study demonstrated that overexpression of AGGF1 and FOXC2 and down-expression of E-cad could affect the progression, invasiveness, and metastasis of ESCC. Therefore, AGGF1, FOXC2, and E-cad should be considered as valuable and useful markers to predict metastasis and prognosis for ESCC patients.
Acknowledgments
We thank all staffs at the department of pathology of our hospital for assistance with data and project management.
Author contributions
Conceptualization: Hongwei Li.
Data curation: Hongwei Li.
Formal analysis: Ruixue Yang.
Funding acquisition: Li Ma, Hao Jiang, Hongwei Li.
Investigation: Ruixue Yang.
Project administration: Hongwei Li.
Resources: Hao Jiang.
Visualization: Jinxiang Gu.
Writing – original draft: Li Ma.
Writing – review & editing: Hongwei Li.
Footnotes
Abbreviations: AGGF1 = angiogenic factor with G-patch and FHA domain 1, E-cad = E-cadherin, EMT = epithelial mesenchymal transition, ESCC = esophageal squamous cell carcinoma, FOXC2 = forkhead box C2, LNM = lymph node metastasis, MAPK = mitogen-activated protein kinase, OS = overall survival, TNM = tumor-node-metastasis.
How to cite this article: Ma L, Yang R, Gu J, Jiang H, Li H. The expression of AGGF1, FOXC2, and E-cadherin in esophageal carcinoma and their clinical significance. Medicine. 2020;99:37(e22173).
LM and RY contributed equally to this work.
This work was supported by the Clinical Key Specialty Construction Foundation of Anhui Provincial Health Office in the “12th Five-year Plan” (01Z33)and the Nature and Science Foundation of Bengbu Medical University (BYKF1777 and BYKF1809).
All tissue samples were obtained with patients writing extensively informed consent when they were in hospital and the study was approved by the Bengbu Medical University ethical committee and conducted in accordance with the ethical guidelines of the Declaration of Helsinki.
The authors have no conflicts of interest to disclose.
The datasets generated during and/or analyzed during the current study are available from the corresponding author on reasonable request.
References
- [1].Bray F, Ferlay J, Soerjomataram I, et al. Global cancer statistics 2018: GLOBOCAN estimates of incidence and mortality worldwide for 36 cancers in 185 countries. CA Cancer J Clin 2018;68:394–424.. [DOI] [PubMed] [Google Scholar]
- [2].Chen W, Zheng R, Baade PD, et al. Cancer statistics in China, 2015. CA Cancer J Clin 2016;66:115–32.. [DOI] [PubMed] [Google Scholar]
- [3].Tian XL, Kadaba R, You SA, et al. Identification of an angiogenic factor that when mutated causes susceptibility to Klippel-Trenaunay syndrome. Nature 2004;427:640–5.. [DOI] [PMC free article] [PubMed] [Google Scholar]
- [4].Yao HH, Zhao YJ, He YF, et al. Knockdown of AGGF1 inhibits the invasion and migration of gastric cancer via epithelial-mesenchymal transition through Wnt/ β-catenin pathway. Cancer Cell Int 2019;19:41. [DOI] [PMC free article] [PubMed] [Google Scholar]
- [5].Xu Y, Zhou M, Wang J, et al. Role of microRNA-27a in down-regulation of angiogenic factor AGGF1 under hypoxia associated with high-grade bladder urothelial carcinoma. Biochim Biophy Acta 2014;1842:712–25.. [DOI] [PubMed] [Google Scholar]
- [6].Zhao H, Sun Q, Zhou J, et al. High expression levels of AGGF1 and MFAP4 predict primary platinum-based chemoresistance and are associated with adverse prognosis in patients with serous ovarian cancer. J Cancer 2019;10:397–407.. [DOI] [PMC free article] [PubMed] [Google Scholar]
- [7].Tu J, Ying X, Zhang D, et al. High expression of angiogenic factor AGGF1 is an independent prognostic factor for hepatocellular carcinoma. Oncotarget 2017;8:111623–30.. [DOI] [PMC free article] [PubMed] [Google Scholar]
- [8].Myatt SS, Lam EW. The emerging roles of forkhead box (Fox) proteins in cancer. Nat Rev Cancer 2007;7:847–59.. [DOI] [PubMed] [Google Scholar]
- [9].Wang L, Li M, Zhou Y, et al. MicroRNA let-7 g directly targets forkhead box C2 (FOXC2) to modulate bone metastasis in breast cancer. Open Med (Wars) 2017;12:157–62.. [DOI] [PMC free article] [PubMed] [Google Scholar]
- [10].Gozo MC, Jia D, Aspuria PJ, et al. FOXC2 augments tumor propagation and metastasis in osteosarcoma. Oncotarget 2016;7:68792–802.. [DOI] [PMC free article] [PubMed] [Google Scholar]
- [11].Hayashi H, Sano H, Seo S, et al. The Foxc2 transcription factor regulates angiogenesis via induction of integrin beta3 expression. J Biol Chem 2008;283:23791–800.. [DOI] [PMC free article] [PubMed] [Google Scholar]
- [12].Mani SA, Yang J, Brooks M, et al. Mesenchyme forkhead 1 (FOXC2) plays a key role in metastasis and is associated with aggressive basal-like breast cancers. Proc Natl Acad Sci U S A 2007;104:10069–74.. [DOI] [PMC free article] [PubMed] [Google Scholar]
- [13].Hollier BG, Tinnirello AA, Werden SJ, et al. FOXC2 expression links epithelial-mesenchymal transition and stem cell properties in breast cancer. Cancer Res 2013;73:1981–92.. [DOI] [PMC free article] [PubMed] [Google Scholar]
- [14].Wang T, Zheng L, Wang Q, et al. Emerging roles and mechanisms of FOXC2 in cancer. Clin Chim Acta 2018;479:84–93.. [DOI] [PubMed] [Google Scholar]
- [15].Watanabe T, Kobunai T, Yamamoto Y, et al. Gene expression of mesenchyme forkhead 1 (FOXC2) significantly correlates with the degree of lymph node metastasis in colorectal cancer. Int Surg 2011;96:207–16.. [DOI] [PubMed] [Google Scholar]
- [16].Nishida N, Mimori K, Yokobori T, et al. FOXC2 is a novel prognostic factor in human esophageal squamous cell carcinoma. Ann Surg Oncol 2011;18:535–42.. [DOI] [PubMed] [Google Scholar]
- [17].Zhou L, Yu L, Wu S, et al. Clincopathological significance of KAI1 expression and epithelial-mesenchymal transition in non-small cell lung cancer. World J Surg Oncol 2015;13:324. [DOI] [PMC free article] [PubMed] [Google Scholar]
- [18].Ci H, Xu Z, Xu J, et al. Expression of KAI1 and E-cadherin in nonsmall cell lung cancer and their correlation with vasculogenic mimicry. Medicine (Baltimore) 2018;97:e12293. [DOI] [PMC free article] [PubMed] [Google Scholar]
- [19].Chaw SY, Majeed AA, Dalley AJ, et al. Epithelial to mesenchymal transition (EMT) biomarkers—E-cadherin, beta-catenin, APC and Vimentin—in oral squamous cell carcinogenesis and transformation. Oral Oncol 2012;48:997–1006.. [DOI] [PubMed] [Google Scholar]
- [20].Fujita H, Kang M, Eren M, et al. Foxc2 is a common mediator of insulin and transforming growth factor beta signaling to regulate plasminogen activator inhibitor type I gene expression. Circ Res 2006;98:626–34.. [DOI] [PubMed] [Google Scholar]
- [21].Hayashi H, Kume T. Foxc transcription factors directly regulate Dll4 and Hey2 expression by interacting with the VEGF-Notch signaling pathways in endothelial cells. PLoS One 2008;3:e2401. [DOI] [PMC free article] [PubMed] [Google Scholar]
- [22].You W, Gao H, Fan L, et al. Foxc2 regulates osteogenesis and angiogenesis of bone marrow mesenchymal stem cells. BMC Musculoskelet Disord 2013;14:199. [DOI] [PMC free article] [PubMed] [Google Scholar]
- [23].Ahn J, Han KS, Heo JH, et al. FOXC2 and CLIP4: a potential biomarker for synchronous metastasis of ≤7-cm clear cell renal cell carcinomas. Oncotarget 2016;7:51423–34.. [DOI] [PMC free article] [PubMed] [Google Scholar]
- [24].Saito T, Nishimura M, Yamasaki H, et al. Hypermethylation in promoter region of E-cadherin gene is associated with tumor dedifferention and myometrial invasion in endometrial carcinoma. Cancer 2003;97:1002–9.. [DOI] [PubMed] [Google Scholar]
- [25].Juan W, Shan K, Na W, et al. The associations of genetic variants in E-cadherin gene with clinical outcome of epithelial ovarian cancer. Int J Gynecol Cancer 2016;26:1601–7.. [DOI] [PubMed] [Google Scholar]
- [26].Fan C, Ouyang P, Timur AA, et al. Novel roles of GATA1 in regulation of angiogenic factor AGGF1 and endothelial cell function. J Biol Chem 2009;284:23331–43.. [DOI] [PMC free article] [PubMed] [Google Scholar]
- [27].Yang C, Zheng J, Xue Y, et al. The effect of MCM3AP-AS1/miR-211/KLF5/AGGF1 axis regulating glioblastoma angiogenesis. Front Mol Neurosci 2018;10:437. [DOI] [PMC free article] [PubMed] [Google Scholar] [Retracted]
- [28].Thiery JP, Acloque H, Huang RY, et al. Epithelial-mesenchymal transitions in development and disease. Cell 2009;139:871–90.. [DOI] [PubMed] [Google Scholar]
- [29].Pham TND, Perez White BE, Zhao H, et al. Protein kinase C α enhances migration of breast cancer cells through FOXC2- mediated repression of p120-catenin. BMC Cancer 2017;17:832. [DOI] [PMC free article] [PubMed] [Google Scholar]
- [30].Katoh M, Igarashi M, Fukuda H, et al. Cancer genetics and genomics of human FOX family genes. Cancer Lett 2013;328:198–206.. [DOI] [PubMed] [Google Scholar]


