Abstract
This study aims to develop a deep learning framework to determine the Severity of Alopecia Tool (SALT) score for measurement of hair loss in patients with alopecia areata.
Alopecia areata (AA) is a chronic and recurrent disorder resulting in hair loss.1,2 The extent of hair loss is the most important prognostic factor.3 Diverse assessment tools have been developed for objective evaluation4; however, most have limited accuracy and objectivity because of their dependency on naked-eye examination. We postulated that computer-assisted identification of hair loss would enable clinicians to achieve a more accurate assessment and prognostic stratification. This study aimed to develop a deep learning framework to determine the Severity of Alopecia Tool (SALT) score.
Methods
This study included 679 patients with AA receiving care at our institution from 2012 to 2018. This study was approved by the Institutional Review Board of Yonsei University Wonju Severance Christian Hospital (CR319029). Informed consent was obtained from 18 participants whose identified data were used in this study. In total, 2716 images taken from 4 standardized views4 were used to train (n = 1901 [70%]) and validate (n = 815 [30%]) the deep neural network. It consisted of 2 components—the hair loss identifier and the scalp identifier (eFigure 1 in the Supplement). The detailed methods and relevant data including the program code can be found in eMethods in the Supplement and our public repository (https://dx.doi.org/10.17632/75k76546ms.1).
A challenge study was performed to investigate the practical benefits in assessment of patients (eFigure 2 in the Supplement). Eight dermatologists were provided with an additional 400 images (100 patients) and requested to assess each image by naked-eye examination. One week later, they were requested to assess the same images with the model’s (AloNet, version 1.0) assistance.
Results
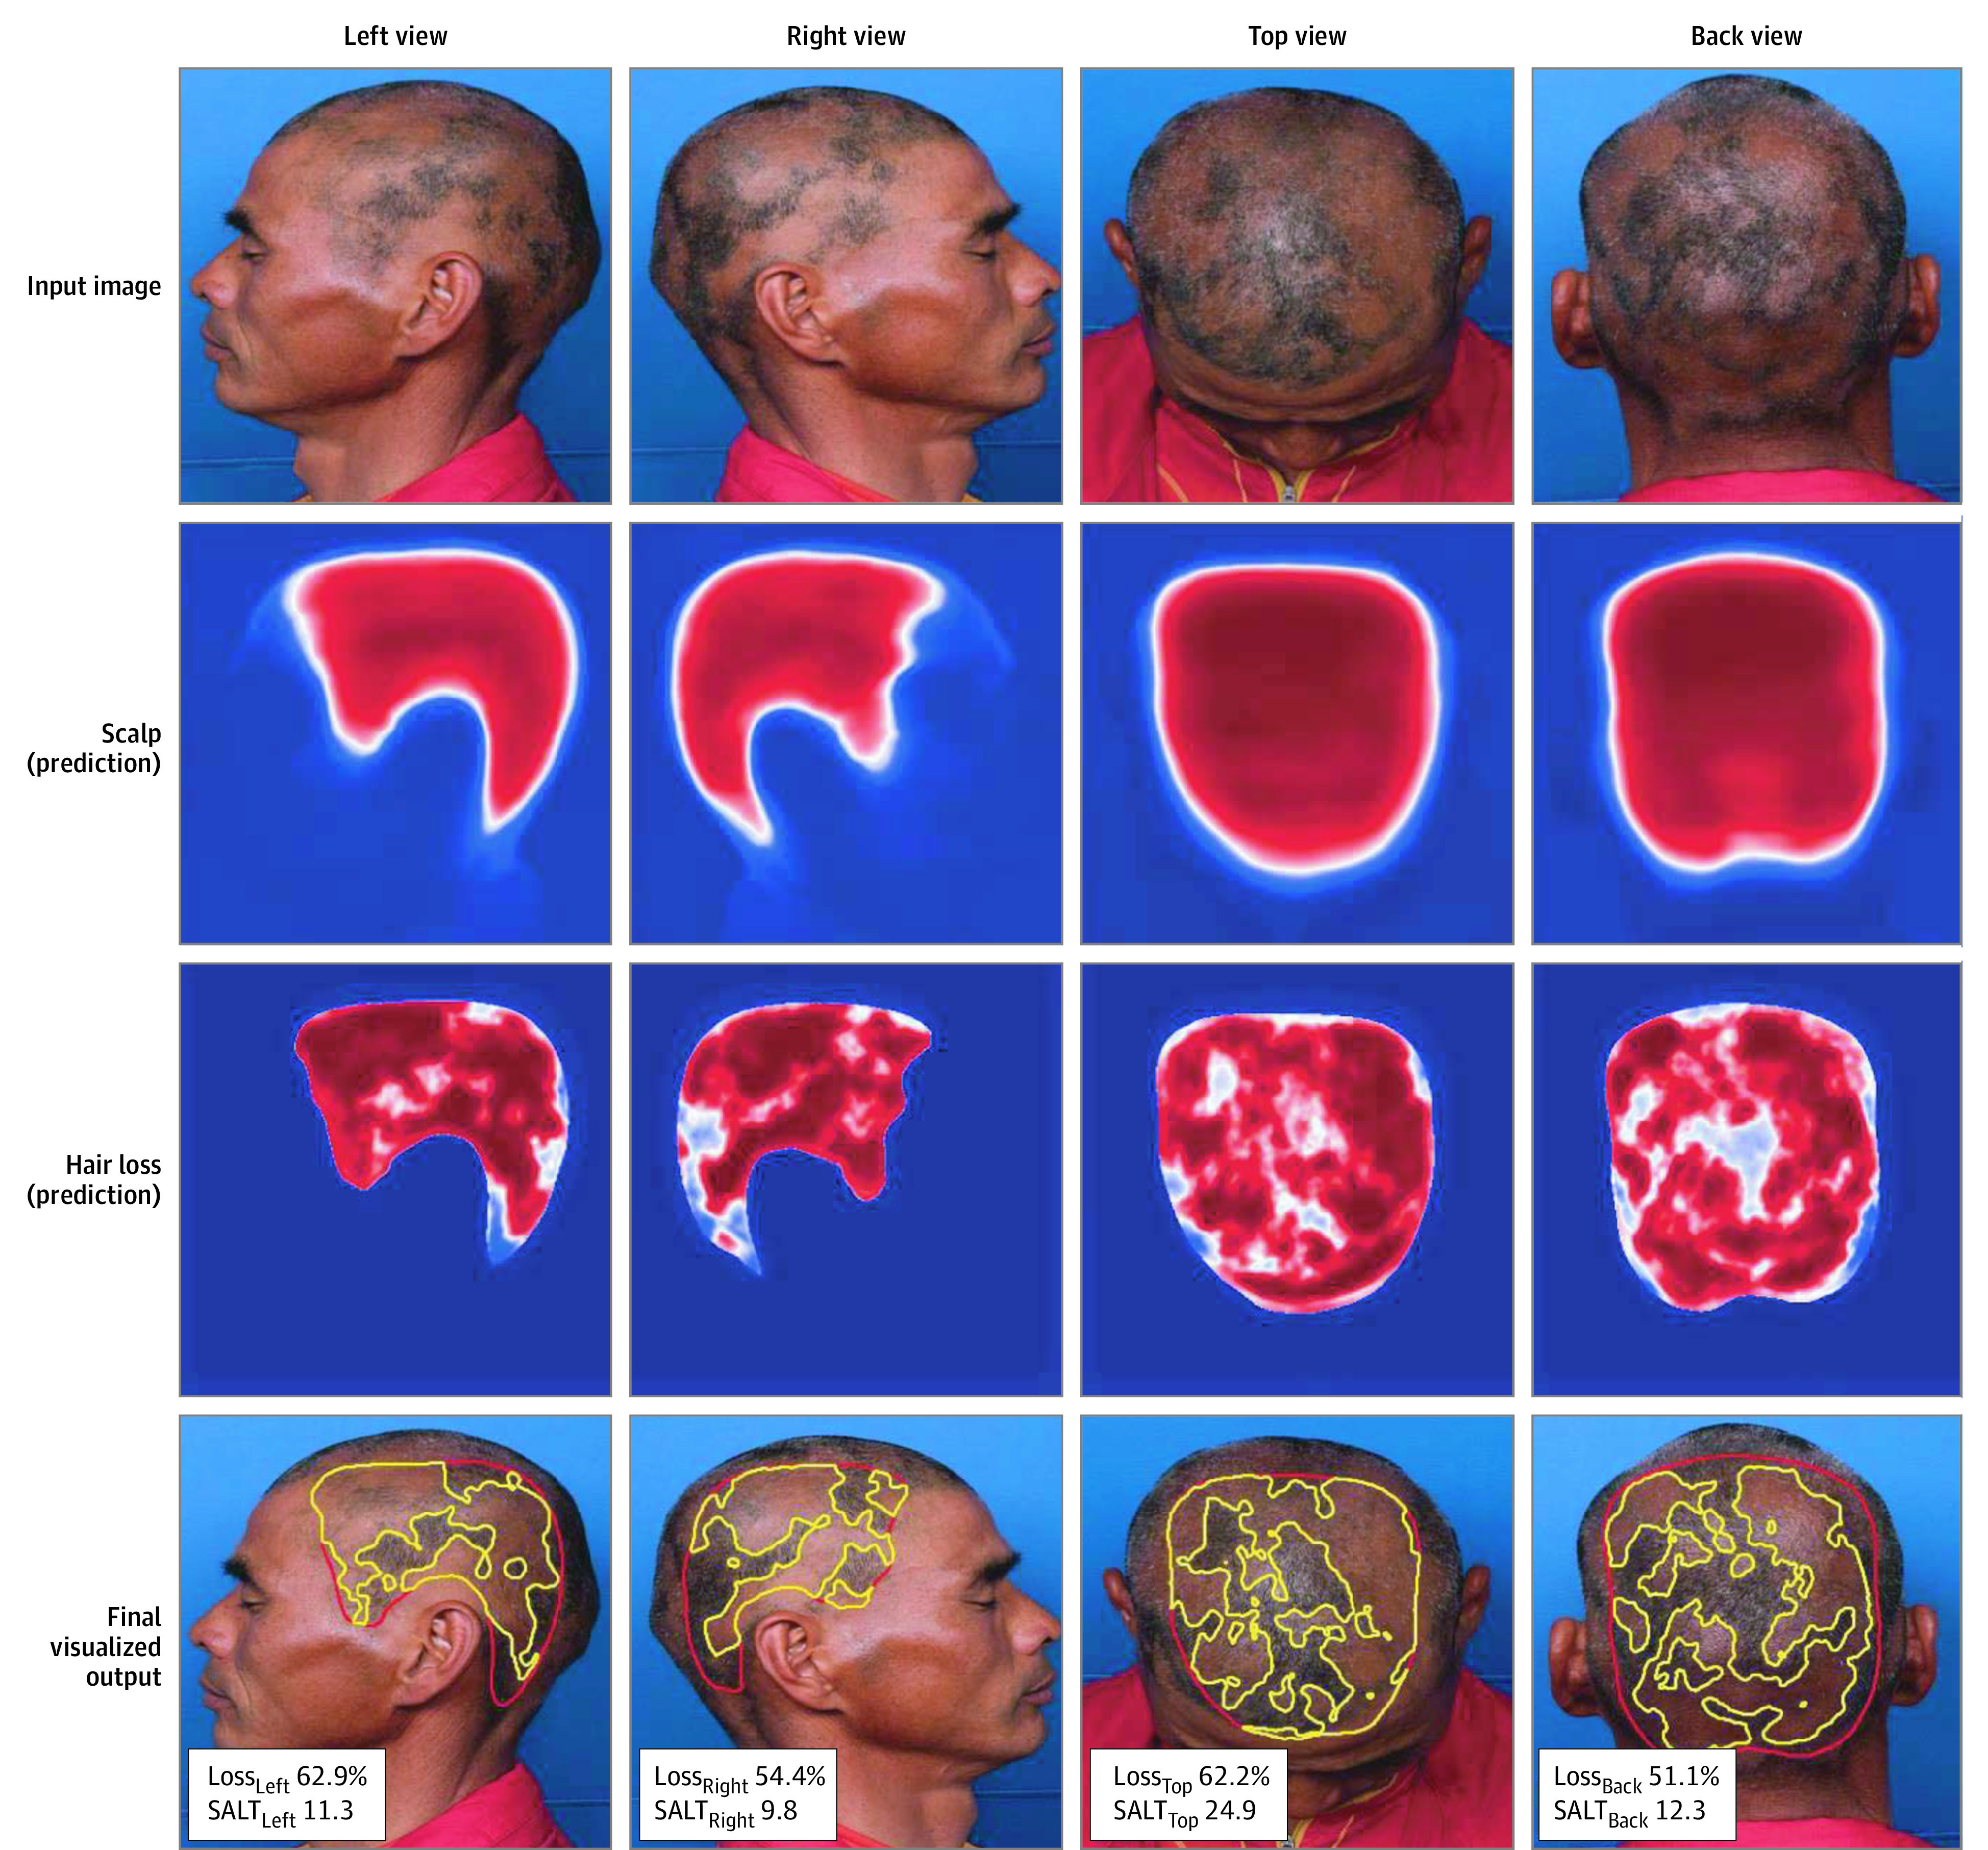
The Jaccard similarity indices were 0.941 and 0.963 for the scalp and hair loss area, respectively. Some representative inputs and outputs are presented in Figure 1. The model showed superior performance in cases with patchy or multifocal alopecia than in cases with ill-defined loss. It also successfully rejected miscellaneous structures, such as hair pins and background anatomical structures, when predicting the regions of interest.
Figure 1. Example Input Image, Prediction Map Derived From Scalp and Hair Loss Identifiers, and Results.

The scalp identifier first yields a prediction map for the scalp area based on the patient’s 4-view standardized photographs (left, right, top, and back views). The hair loss identifier yields a prediction map for the hair loss area by analyzing the masked image, created by synthesizing the input image and scalp prediction. The web application yields the final results along with a calculation of the percentage of hair loss and Severity of Alopecia Tool (SALT) score for each image. A function to adjust each threshold for optimizing the result was incorporated (eFigure 2 in the Supplement).
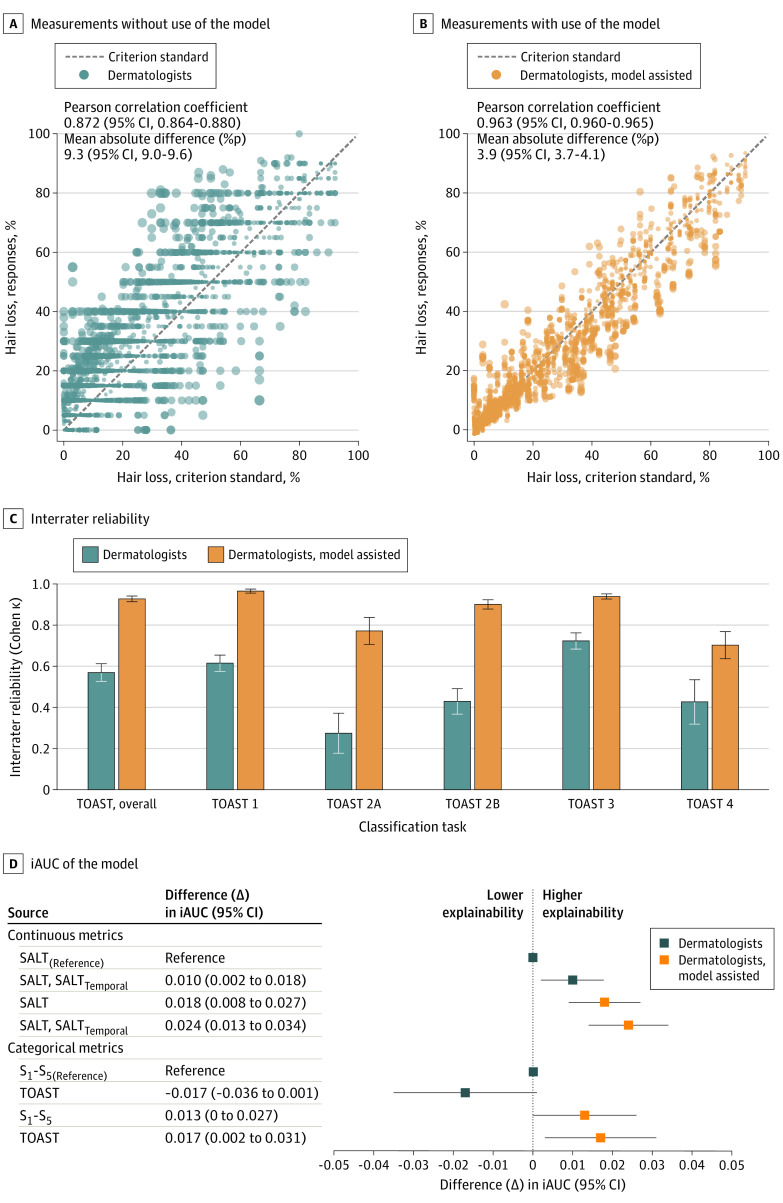
The challenge study results are presented in Figure 2. The measurement errors significantly improved with use of the computer-assisted approach. Furthermore, the interrater reliability also significantly improved when SALT scores were graded using model-assisted metrics.5
Figure 2. Results of the Challenge Study and Prognostic Validation.
A and B, The extent of hair loss from 8 dermatologists’ responses and the criterion standard (manually extracted by a board-certified dermatologist, S. Lee) without and with the aid of the model are demonstrated. The diameter of the dots represents the size of the absolute difference. C, After converting the continuous metrics into categorical metrics using the Topography-based Alopecia Severity Tool (TOAST), significant improvement was seen in the interrater reliability with the computer-aided approach. D, With the continuous metrics, the integrated area under the receiver operating characteristic curve (iAUC) of the model, which took the total Severity of Alopecia Tool (SALT) scores measured with naked-eye examination as an input variable, served as a reference. By substituting the scores measured with the computer-aided approach, the prediction model achieved significantly increased iAUC. Furthermore, by adding a temporal subset of SALT score (SALTtemporal) as an additional input variable, the iAUC was significantly increased further. With the categorical metrics,4,5,6 a similar pattern of change was observed, although with less prominent statistical significance. Similarly, the highest iAUC was reached when the classifications based on the computer-assisted measurements were used.
A Cox proportional hazard model for major hair regrowth3,5 was fitted to investigate whether the computer-assisted measurements could result in better prognostic predictions (Figure 2D). The explanatory power of the SALT score significantly increased with the computer-assisted approach. Furthermore, the performance significantly improved by adding a temporal subset of SALT scores as an additional independent factor.5
Discussion
This study determined that deep neural networks can achieve fair performance in identifying scalp area and hair loss. A computational method using texture analysis has been reported for extracting AA lesions by analyzing preprocessed scalp images.6 However, as an end-to-end framework, our model is advantageous because it does not require cumbersome image preparation. For example, manual cutting of the scalp area or deletion of facial or background information is not required because it can estimate the scalp area from an unprocessed input image. Moreover, it does not require strict control in taking clinical photographs.
In the challenge study, the dermatologists achieved significantly improved accuracy and interrater reliability with the computer-assisted approach. The explanatory power of the SALT score for predicting hair regrowth was also significantly increased. Improved assessments would make the SALT score more reliable for diverse clinical and research purposes. It may be considered a feasible solution to the current lack of objective and reproducible assessment tools in clinical trials for AA.
The study limitation is that the photographs were taken at a single tertiary institution; thus, the model has limited generalizability. Moreover, preparations to photograph hair loss itself could be time intensive and prone to artifacts caused by inappropriate exposure. Furthermore, although hair density is also an essential component in the assessment, the model is a binary discriminator of whether each pixel responds to hair loss. A further model, integrated with hair density, would be required for better evaluation.
eMethods. Deep Learning Method
eFigure 1. Training and Inference Steps of the Model
eFigure 2. Web Application Distributed in the Challenge Study
eFigure 3. Some Representative Examples
References
- 1.Lee S, Lee YB, Kim BJ, Bae S, Lee WS. All-cause and cause-specific mortality risks associated with alopecia areata: a Korean nationwide population-based study. JAMA Dermatol. 2019;155(8):922-928. doi: 10.1001/jamadermatol.2019.0629 [DOI] [PMC free article] [PubMed] [Google Scholar]
- 2.Li SJ, Mostaghimi A, Tkachenko E, Huang KP. Association of out-of-pocket health care costs and financial burden for patients with alopecia areata. JAMA Dermatol. 2019;155(4):493-494. doi: 10.1001/jamadermatol.2018.5218 [DOI] [PMC free article] [PubMed] [Google Scholar]
- 3.Lee S, Kim BJ, Lee YB, Lee WS. Hair regrowth outcomes of contact immunotherapy for patients with alopecia areata: a systematic review and meta-analysis. JAMA Dermatol. 2018;154(10):1145-1151. doi: 10.1001/jamadermatol.2018.2312 [DOI] [PMC free article] [PubMed] [Google Scholar]
- 4.Olsen EA, Roberts J, Sperling L, et al. Objective outcome measures: collecting meaningful data on alopecia areata. J Am Acad Dermatol. 2018;79(3):470-478.e3. doi: 10.1016/j.jaad.2017.10.048 [DOI] [PMC free article] [PubMed] [Google Scholar]
- 5.Lee S, Kim BJ, Lee CH, Lee WS. Topographic phenotypes of alopecia areata and development of a prognostic prediction model and grading system: a cluster analysis. JAMA Dermatol. 2019;155(5):564-571. doi: 10.1001/jamadermatol.2018.5894 [DOI] [PMC free article] [PubMed] [Google Scholar]
- 6.Bernardis E, Castelo-Soccio L. Quantifying alopecia areata via texture analysis to automate the SALT score computation. J Investig Dermatol Symp Proc. 2018;19(1):S34-S40. doi: 10.1016/j.jisp.2017.10.010 [DOI] [PubMed] [Google Scholar]
Associated Data
This section collects any data citations, data availability statements, or supplementary materials included in this article.
Supplementary Materials
eMethods. Deep Learning Method
eFigure 1. Training and Inference Steps of the Model
eFigure 2. Web Application Distributed in the Challenge Study
eFigure 3. Some Representative Examples


