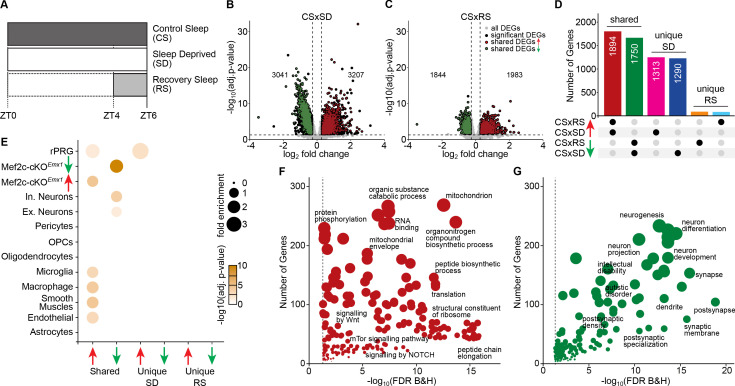
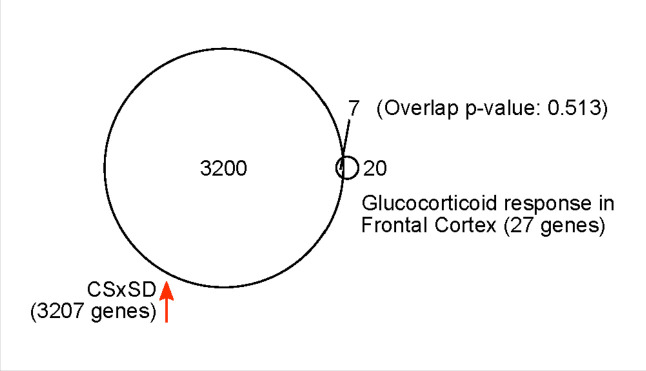
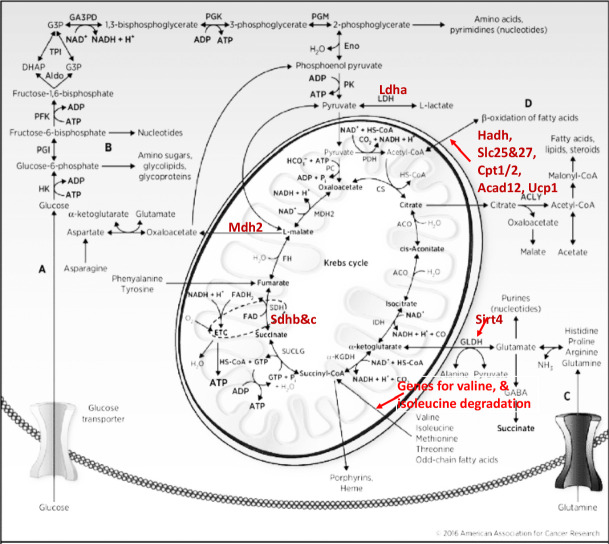
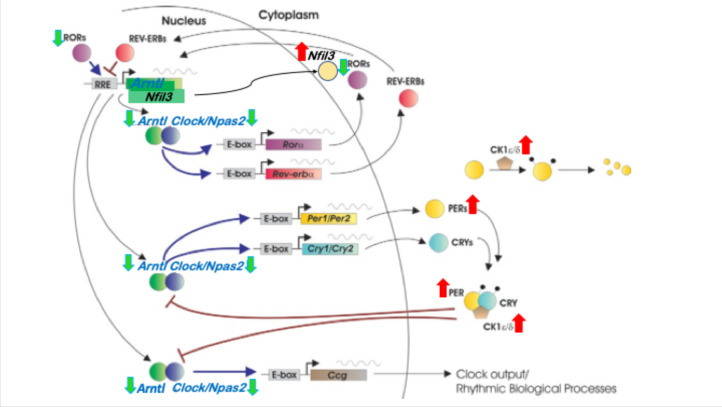
Figure 1. Sleep need induced transcriptomic changes.
(A) Schematic of the experimental design illustrating the protocol for frontal cortex brain tissue collection from three sleep conditions at Zeitgeber Time (ZT) = 6 hours: control sleep (CS), sleep deprived (SD) and recovery sleep (RS). Volcano plots showing differentially expressed genes across (B) CS to SD and (C) CS to RS. Significantly differentially expressed genes (DEGs) (adj. p-value<=0.05, absolute log2 fold change >= 0.3), unique to the sleep condition, are indicated as black dots whereas genes shared by SD and RS are indicated as either red (increased expression) or green (decreased expression) dots. (D) Upset plot showing the shared and unique sets of significant DEGs for CS to SD and CS to RS. (E) Dot plot showing enrichment of significant DEGs for cell-types identified using single cell RNA sequencing data (Hrvatin et al., 2018) from mouse cortex, identified Mef2c target genes (Harrington et al., 2016) and rapid primary response genes (rPRGs) (Tyssowski et al., 2018). A Fisher’s exact test was used to calculate the significance of the overlap of the sleep DEGs and the Mef2c-cKOEmx1 DEGs. The size of the dot indicates the odds ratio for enrichment and the color indicates the p-value. Dot plot showing GO analysis for shared significant DEGs with (F) increased and (G) decreased expression across SD and RS compared to CS (for a complete list of significant GO, see Supplementary file 3).


