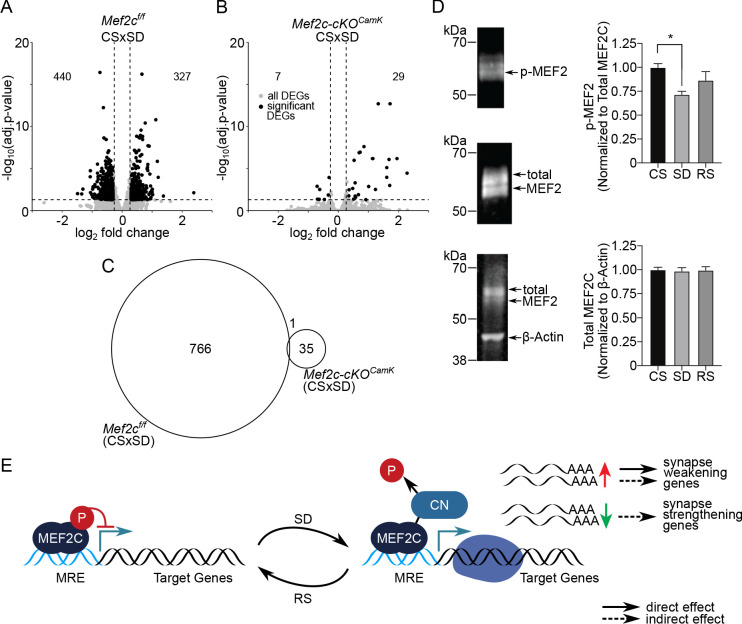
Figure 3. MEF2C, its de-phosphorylation and essential role in sleep-loss-mediated differential gene expression.
(A) Volcano plot showing the DEGs identified for Mef2cf/f and another, (B) for Mef2c-cKOCamk2a-Cre between CS to SD sleep condition. DEGs (adj. P-val <= 0.05; absolute log2(change) => 0.3) are indicated by black dots. (C) A Venn diagram showing overlap between DEGs for Mef2cf/f and Mef2c-cKOCamk2a-Cre between CS and SD sleep states. (D) Immunoprecipitation of MEF2C to detect MEF2C, Phospho-S396 MEF2C Phospho-S396 and total MEF2C for each sleep condition. Phospho-MEF2 (top blot) re-labeled from immunoprecipitation of total MEF2C (middle blot) was quantified and normalized to total MEF2C signal for each sample (n = 4 samples/condition). Total MEF2C from total cell lysate was quantified and normalized to B-actin (bottom blot). Data reported as mean +/- SEM. Statistical significance was determined by one-way ANOVA with Tukey’s multiple comparisons test (interaction = p < 0.05, post-hoc test comparing CS to SD *=p < 0.05). (E) Model showing role of de-phosphorylated, activated MEF2C, increased relative to total MEF2C by loss of sleep and leading to synapse remodeling. MRE = Mef2 response element, CN = calcineurin.

