

ABSTRACT
There is considerable interest in dietary and other approaches to maintaining blood glucose concentrations within the normal range and minimizing exposure to postprandial hyperglycemic excursions. The accepted marker to evaluate the sustained maintenance of normal blood glucose concentrations is glycated hemoglobin A1c (HbA1c). However, although this is used in clinical practice to monitor glycemic control in patients with diabetes, it has a number of drawbacks as a marker of efficacy of dietary interventions that might beneficially affect glycemic control in people without diabetes. Other markers that reflect shorter-term glycemic exposures have been studied and proposed, but consensus on the use and relevance of these markers is lacking. We have carried out a systematic search for studies that have tested the responsiveness of 6 possible alternatives to HbA1c as markers of sustained variation in glycemic exposures and thus their potential applicability for use in dietary intervention trials in subjects without diabetes: 1,5-anhydroglucitol (1,5-AG), dicarbonyl stress, fructosamine, glycated albumin (GA), advanced glycated end products (AGEs), and metabolomic profiles. The results suggest that GA may be the most promising for this purpose, but values may be confounded by effects of fat mass. 1,5-AG and fructosamine are probably not sensitive enough to the range of variation in glycemic exposures observed in healthy individuals. Use of measures based on dicarbonyls, AGEs, or metabolomic profiles would require further research into possible specific molecular species of interest. At present, none of the markers considered here is sufficiently validated and sensitive for routine use in substantiating the effects of sustained variation in dietary glycemic exposures in people without diabetes.
Keywords: dietary intervention; HbA1c; 1,5-anhydroglucitol; dicarbonyl stress; fructosamine; glycated albumin; advanced glycated end products; metabolomics; nondiabetic population; systematic review
Introduction
There is broad consensus that maintenance of blood glucose concentrations within the normal range is beneficial for health. In individuals with normal fasting (blood or plasma) glucose (FG), particular attention is given to minimizing exposure to hyperglycemic excursions (1). Many foods, ingredients, or diets can reduce acute postprandial glycemic responses (PPG), but for assessing and substantiating the cumulative, sustained effects of these on glycemic exposure, the only clearly accepted marker is glycated hemoglobin A1c (HbA1c) (1), which is mainly derived from its use in clinical practice to monitor glycemic control in people with diabetes. PPG is a significant predictor of HbA1c in people without diabetes; however, about half of the variance in HbA1c in this group is explained by nonglycemic variables, much more than in individuals with diabetes (2). Furthermore, the use of HbA1c as the only marker in assessing potential benefits of dietary interventions for sustained blood glucose control has major drawbacks. Reliance on this marker in intervention trials requires a trial duration of ≥3 mo, and the time and cost for this is a substantial barrier for research and development to develop and test products that might beneficially affect glycemic control. In addition, the responsiveness of HbA1c to variation in dietary glycemic exposures achievable from interventions in people without diabetes (either healthy or with impaired glucose tolerance) is uncertain. In subjects with type 2 diabetes (T2D), most glucose-lowering drugs reduce HbA1c by ∼1% (absolute level), but the reduction is greater in individuals with higher baseline concentrations (3, 4). Therefore this marker derived from clinical medicine may not always be the most appropriate, at least in initial research phases, for assessing and characterizing diet-induced changes in glycemic exposures.
Other markers that may reflect glycemic control over shorter periods have been studied and proposed, mainly for their potential use in predicting disease risk in the general population (5–8) or monitoring diabetes management and comorbidity risks (6, 7, 9, 10). However, consensus on the use and relevance of alternative markers is lacking. Furthermore, the potential applicability of such markers to assess variation in sustained dietary glycemic exposures in people without diabetes has been given relatively limited consideration (11).
Here, we review several suggested markers of short- to medium-term glycemic exposures that could potentially be used to evaluate and compare the glycemic impact of dietary interventions in populations without diabetes. A systematic search was undertaken on each marker, to identify intervention and observational studies reporting their relations with dietary exposures in populations without diabetes. This evidence was then evaluated to identify the most promising marker(s), markers that are unlikely to be sensitive enough to the range of variation in glycemic exposures observed in healthy individuals, and markers comprised of metabolite profiles that may require further research into possible specific molecular species of interest.
Methods
Data sources and searches
The protocol was registered on the PROSPERO International prospective register of systematic reviews (ID number CRD42017037408). Several previous reviews of glycemic markers (alternatives to HbA1c) in relation to diabetes risk and monitoring identified possible markers to be considered here (5–8). These markers were supplemented by suggestions from the personal knowledge of the authors and a final list agreed to by consensus. Searches were performed separately for every selected marker: dicarbonyls, 1,5-anhydroglucitol (1,5-AG), fructosamine, glycated albumin (GA; plasma proteins), advanced glycated end products (AGEs), and metabolomics. The full search strategy, methods, and deviation from the registered protocol are available as supplemental material (Supplemental Data 1A and 1B). In brief, MEDLINE, Embase, and the Cochrane Library were used to search for human studies published through to 1 July, 2018, in English, German, Dutch, Spanish, or French, without any restriction of publication date. Screening was in 2 stages, each involving 2 independent assessors. In the first stage, titles and abstracts of sources identified by the systematic searches were evaluated and excluded where both assessors concluded the source would not meet the inclusion criteria (e.g., animal or in vitro studies, not primary research, conference or other abstract only, only subjects with diabetes, drug not diet intervention, etc.). Full articles of the remaining sources were then assessed and considered for inclusion if both assessors agreed the research tested and reported on the marker(s) of interest in individuals without diabetes, either in dietary intervention trials with glycemic outcomes, or in observational studies with analyses of associations with dietary exposures or other measures of glycemia.
Results
Eligible studies
As shown in Figure 1 for all markers together, 4244 unique records identified in the systematic search of titles and abstracts generated 58 eligible studies. These were supplemented by 21 studies identified by hand searches (e.g., from reference lists of other articles or reviews), yielding a final total of 79 studies in the evidence base. Supplemental Figure 1 illustrates the flowcharts for each individual marker.
FIGURE 1.
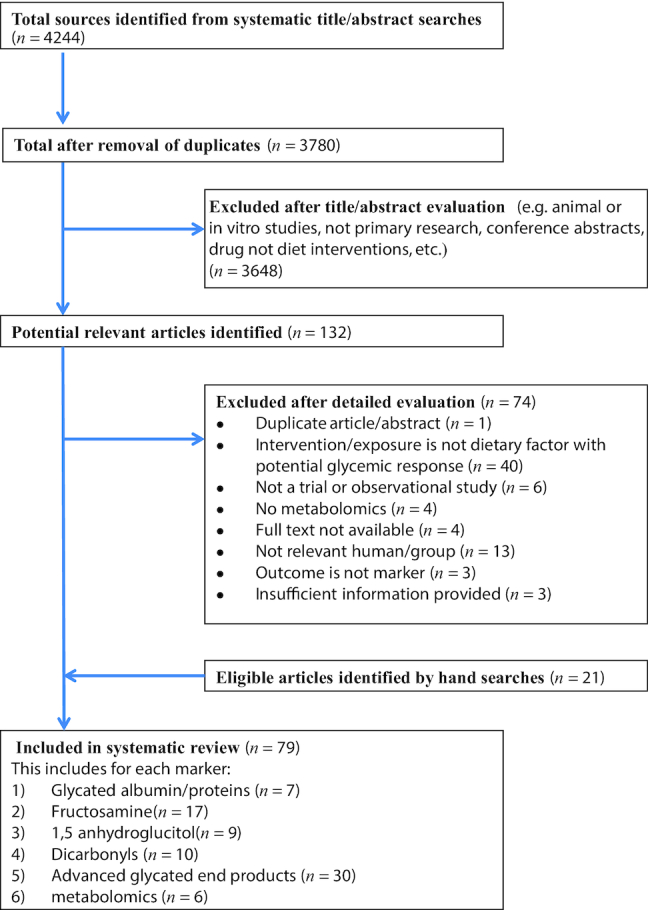
Preferred reporting items for systematic reviews and meta-analyses (PRISMA) flow diagram.
GA
Background
Glycation of proteins occurs in vivo as a reaction between sugars and the amino groups of the protein. With respect to blood glucose monitoring, all glycated serum proteins are referred to as fructosamine (10) (see specific section below). However, serum albumin accounts for 50–60% of total plasma proteins (12), so it is often considered separately. Moreover, due to its high concentration, amino acid composition, and relatively long half-life (∼21 d), serum albumin is more sensitive to glycation than other circulating proteins. GA is expressed as percentage of albumin, and the reference range of GA% in Americans with normal glucose tolerance has been established as 11.9–15.8% (13), whereas typical levels in people with diabetes are 2–5 times higher. GA has been shown to respond to treatment with insulin and hypoglycemic agents in individuals with T2D, paralleling reductions in HbA1c (14).
See Supplemental Data 2A for more complete background details and methods of quantification.
Overview of the literature
From 204 unique records on GA identified from titles and abstracts, 7 studies were included in this review: 6 experimental studies (15–20) and 1 observational study (21) (for details see Supplemental Figure 1A).
In a randomized crossover design of 11 participants without diabetes, Ryle et al. (17) showed that a 6-wk high-soluble-fiber/low-glucose diet (5 g guar gum 3 times daily) and a 6-wk low-soluble-fiber/high-glucose (500 mL glucose drink providing 100 g glucose/d) changed GA in opposite directions. GA concentrations increased from 1.71% (SD: 0.35%) to 1.95% (SD: 0.23%) after the glucose diet and fell to 1.33% (SD: 0.30%) after the soluble fiber diet. Individual data showed that concentrations increased in all but 1 participant after glucose and fell in all but 2 after the fiber diet. The authors concluded that concentrations of GA are more sensitive to small changes in concentrations of glucose than glycosylated hemoglobin.
Stanhope et al. (18) reported on a direct comparison of sustained exposure to low versus high glycemic sugar. They compared fructose- versus glucose-sweetened beverages (giving 25% of energy requirement) in a parallel arm design for 10 wk (8 wk ad libitum followed by 2-wk controlled energy balance) in 32 middle-aged subjects with overweight or obesity without diabetes. GA concentrations were differentially affected by the 2 sugars, with GA concentrations reduced by fructose (−3.3%, SD: 1.3%) and increased by glucose (+2.1%, SD: 1.3%). Interestingly, FG and glucose and insulin peaks during 24-h continuous glucose monitoring were also different at final examination, but fasting fructosamine concentration was not.
Li et al. (16) reported on a 12-wk double-blind, randomized, placebo-controlled trial testing 34 g/d of Nutriose, a mixture of glucose polymers, in 120 overweight Chinese men without diabetes (BMI 24.0–28.0 kg/m2). Although GA values were almost identical at week 12, the values at 4- and 8-wk interim time points were reduced in the intervention versus control group, leading to a significant overall treatment effect (P <0.01). However, mean reductions in GA were only seen in subjects with metabolic syndrome at baseline. In contrast, at 12 wk, FG and HbA1c were significantly lower in the intervention group compared with the control group, although the effect size was significantly greater in subjects with metabolic syndrome at baseline.
Davie et al. (15) investigated the impact of additional vitamin C (1 g/d) on glycation of proteins in a single-arm design in 12 healthy patients without diabetes during a period of 3 mo. The mean concentration of GA reduced by 33% after 1 mo and remained at this lower concentration during supplementation. One month after cessation GA was increased to 12% above basal concentration. HbA1c concentrations also reduced, but fructosamine concentrations reduced to a smaller extent (5%). The authors concluded that vitamin C may inhibit glycation of proteins in vivo by a competitive mechanism.
The 2 remaining intervention studies did not show any significant impact of dietary interventions on GA. Swanson et al. (19) reported on a 2 × 28-d crossover trial comparing a diet with 20% energy from fructose versus isoenergic high-starch diet with <3% fructose in 14 healthy volunteers. There were no significant differences between the study diets at any time in the mean values of HbA1c or serum GA or FG. All values ranged from 1.2 to 1.3%, whereas FG ranged from 4.9 to 5.2 mmol/L and HbA1c from 4.9 to 5.1%.
Vega-Lopez et al. (20) carried out a 2 × 35-d randomized crossover trial comparing diets with either a low (0.7) or high (1.4) Lysine: Arginine (Lys:Arg)ratio (with more animal protein sources) in 30 mildly hypercholesterolemic adults aged >50 y. There were no significant differences in fasting concentrations of GA at the end of the 2 experimental diet phases. The high Lys:Arg ratio diet increased VLDL cholesterol triglycerides and apoA-I but markers of hyperglycemia other than GA were not measured.
An observational study by Koga et al. (21) reported on the association between habitual intake of dairy products and circulating GA in 330 Japanese men and women. A short FFQ was used to collect data on food intake (“Do you eat dairy products every day?”). Dairy use was inversely associated with serum 1,5-AG concentrations, the main outcome of the study, but GA, HbA1c, FG, and 2-h glucose during an oral-glucose-tolerance test (OGTT) did not significantly vary in relation to dairy use, neither in men nor in women.
Conclusion
The results of the review suggest that GA could be a promising alternative to HbA1c as a marker of glycemic dietary exposures in subjects without diabetes, especially in studies with a duration shorter than 3 mo. However, the data directly testing this are limited and not fully consistent, and confirmatory studies are needed (Table 1).
TABLE 1.
Characterization of markers of sustained glycemic exposures
| Marker | Pros | Cons | Period of exposure reflected | Sensitivity to glycemic exposures in healthy or diabetic subjects | Threshold/range |
|---|---|---|---|---|---|
| GA |
|
|
|
|
Normal range GA by enzymatic method 11–16%; affinity chromatography 0.6–3% |
| Fructosamine |
|
|
|
|
No generally accepted standard reference range |
| 1,5-AG |
|
|
|
|
|
| Dicarbonyl (e.g., MG, 3-DG) |
|
|
|
|
|
| AGEs (protein AGE residues and AGE-free adducts) |
|
|
|
|
|
|
|||||
| Metabolomic: 2,6-dihydroxybenzoic acid and 2-aminophenol sulfate | Potentially linked to fiber intake so not specific for glycemic exposure | 5-wk study | Yes | Not determined | |
| Erythronic, sucrose, and fructose | Measurable in urine | Markers of sugars intake as opposed to glycemic exposures | Acute | Yes | Not determined |
AG, anhydroglucitol; AGE, advanced glycated end products; GA, glycated albumin; MG, methylglyoxal; MG-H1, hydroimidazolone; TER, trunk extremity skinfold ratio; 1,5-AG, 1,5-anhydroglucitol; 3-DG, 3-deoxyglucosone.
A disadvantage of GA may be that compounds affecting glycation in particular, such as vitamin C (15), can interfere with the observations on GA. Also, the use in subjects without diabetes may be affected by the presence of other health conditions associated with changes in albumin metabolism (22). An important concern is the lower GA concentrations found in people with overweight, obesity, and metabolic syndrome (8, 23–25). Hence, use of GA read-out in nutritional studies in these types of people, or where the intervention causes significant weight gains or losses, requires further study. Additionally, there are concerns arising from reports of decreased GA in obesity (25), a negative correlation of GA with fat mass and visceral adipose tissue (24), and negative correlations of the GA/HbA1c ratio with BMI in people with normal glucose tolerance and prediabetes (26).
Fructosamine
Characterization
Fructosamine is the common name for isoglucosamine, i.e., 1-amino-1-deoxyfructose (27). With respect to blood glucose monitoring, the term fructosamine refers to all glycated serum proteins (10). Higher glucose concentrations result in higher rates of glycation of serum proteins and thus fructosamine concentrations in vivo (10, 27, 28). As albumin is the most abundant serum protein, fructosamine concentrations predominantly reflect GA. The half-life of fructosamine is 2–3 wk, similar to GA, and serum values are thought to reflect glycemia over the preceding 2–3 wk (29, 30). Fructosamine has been shown, for example, to respond to short-term exercise programs and changes in medication in individuals with T2D, preceding significant changes in HbA1c (31, 32).
There is no generally accepted standard reference range available for fructosamine, and values differ depending on the method of quantification. GA may have some technical advantages over fructosamine as a measure of glycemic exposures, although the range of population variation in GA has been reported to be higher in individuals without diabetes (7, 33).
See Supplemental Data 2B for more complete background details and methods of quantification.
Overview of the literature
From 896 unique records on fructosamine identified from titles and abstracts, 17 relevant articles were included in this review. This includes 2 articles identified by hand searches (see Supplemental Figure 1B for more details). The identified studies differed substantially with respect to the dietary glycemic exposures studied, the duration as well as type of intervention applied.
Only 7 of the identified 17 articles reported a significant variation in fructosamine concentrations in relation to the dietary exposure. Jenkins et al. (29) found a significantly greater reduction in fructosamine after 2 wk of low-glycemic index (GI) versus high-GI diet (−7% and −2%, respectively, for diets with reported GI values of 63 and 104). Juraschek et al. (34) reported a decrease in fructosamine in overweight and obese adults without diabetes by reducing the amount of carbohydrate, regardless of whether the carbohydrates were characterized as low or high GI. Following the 3-wk consumption of Konjak-mannan supplemented biscuits, significantly greater reductions in fructosamine were found than consuming wheat bran biscuits, with no differences in FG (35). Consumption of inulin-enriched pasta but not control pasta for 5 wk led to significantly reduced fructosamine, FG, and HbA1c concentrations versus baseline, though with no significant between-treatment differences (36). Similarly, a combined exercise and diet intervention (soy protein supplement) over 12 wk, but not exercise alone, led to significant reductions in fructosamine and FG versus baseline (no between-treatment statistical comparisons reported) (37). Serum fructosamine was significantly lower after 3 wk of a Fraxinus excelsior (common ash) extract supplement, relative to a 3 g/d maltodextrin control (38). Relative to the control, the supplement exposure also significantly reduced 2-h PPG responses in a glucose challenge test, though not FG. Misciagna et al. (30) reported on a cross-sectional study showing that serum fructosamine was positively associated with dietary glycemic load determined from FFQs.
In contrast, the remaining studies reported no significant effect on fructosamine concentrations by any dietary glycemic exposure. Atabani et al. (39) found no significant effects on fructosamine 2 h after an acute challenge with a 75-g glucose load, which is consistent with no immediate acute effect of a glucose load on fructosamine. A 4-wk intervention with 15–30 g/d high-amylose maize starch did not significantly change fructosamine or FG in men or women with overweight and obesity, although insulin resistance was significantly improved in men (40). Similarly, 6-wk supplementation with bread containing 0 or 12 g/d added resistant starch produced no significant differences in FG or fructosamine, although fructosamine concentrations versus baseline were significantly reduced in both treatments (41). Fructosamine (as well as all other indices of glycemic control) did not significantly change as a result of test breakfasts containing viscous polysaccharides over 2 wk (42). No significant differences in any measures of glycemic control, including fructosamine were observed in groups consuming the New Nordic Diet (based on higher intakes of seafood, fruits, vegetables, and wholegrain products) compared with an average Danish diet for 6 mo (43). Following a 4-wk intervention in healthy volunteers, there were no significant differences in fructosamine concentrations between the consumption of 30 g/d isomaltose or sucrose included in sweet foods (44). No significant differences in fructosamine were reported from a 10-wk intervention with fructose or glucose consumed as a beverage at 25% of daily energy intake (18, 45), whereas there was a differential effect on GA (see previous section). Jenkins et al. (46) did not observe a significant reduction of fructosamine concentrations by lowering the GI of the diet by ∼11 GI units for 4 wk. Vrolix et al. (47) found that after 1 and 11 wk, the serum fructosamine concentration was comparable between the interventions with the consumption of increased GI food variants (GI 51–86) and those with decreased GI food variants (GI 20–48). Bouché et al. (48) reported no modification in fructosamine between a 5-wk low-GI dietary period (GI 41 ± 1%) and a high-GI diet (GI 71.3 ± 1.3%).
Conclusion
The suitability of fructosamine as a potential alternative marker of sustained glycemic exposures to evaluate and compare the glycemic impact of dietary interventions among the population without diabetes is plausible, though in view of the limited number of conclusive articles its utility or advantage as a marker is far from clear. Fructosamine has sometimes been found responsive after relatively short dietary interventions (2–4 wk) in healthy populations without diabetes but appears to require quite substantial differences either in the GI or amount of carbohydrates consumed. Further research is required to validate this marker in trials when less pronounced differences in glycemic exposure are achieved (Table 1).
1,5-AG
Characterization
1,5-AG in plasma is derived from diet and endogenous synthesis. It is not metabolized and competes with glucose for reabsorption, and hyperglycemic excursions leading to glycosuria produce rapid increases in urinary 1,5-AG losses. If this is sustained, the loss of body pools of 1,5-AG are typically reflected in reduced plasma concentrations within a few days. Thus, low 1,5-AG concentrations can reflect acute (24–48 h or more) periods of hyperglycemic excursions in people with diabetes (49). Recovery to the “normal” steady–state concentration generally takes several weeks (50, 51), although significant rises in 1,5-AG have been observed within 2 wk of treatment of people with poorly controlled diabetes (52).
The reference range of 1,5-AG in healthy people as measured in a US population using a current commercial assay is fairly wide, ∼8–29 μg/mL in plasma (53). A concentration of 14 μg/mL has been suggested as a lower limit for normal values and concentrations <10 μg/mL are observed in individuals with glucosuria (54–56).
There are limited data regarding the relevance of variation in 1,5-AG in the general population, or specifically individuals without impaired glucose tolerance or diabetes. However, lower 1,5-AG values have been observed in healthy relatives of individuals with diabetes (57), although this was not statistically significant in another analysis (8).
See Supplemental Data 2C for more complete background details and methods of quantification.
Overview of the literature
From 136 unique records on 1,5-AG identified from titles and abstracts, only 5 articles were considered for the full article analysis. Four additional studies were also identified from hand searching (58–61) (for more details see Supplemental Figure 1C). One other article reporting 1,5-AG was identified from the search for a different section of the review (62), for a total of 9 articles. A further article identified by hand search met the general inclusion criteria, but was excluded from our analyses as the intervention data did not distinguish responses of normoglycemic people from other groups (54). The very low volume of literature reflects the limited amount of research specifically evaluating or applying this marker in populations with good glycemic control.
Four of the included studies assessed changes in 1,5-AG concentrations following acute glycemic challenges. The data largely support 1 of the putative advantages of plasma 1,5-AG as a marker that is little affected by fasting status. Yamanouchi et al. (51) reported 1,5-AG concentrations over a single day in 1 person with “normal” glycemic control, as well as concentrations of 1,5-AG following 75 g glucose in 2 others, along with these same measures in groups of participants with poor glycemic control. The data are consistent with no immediate acute effect of a glucose load on 1,5-AG concentrations, and also little apparent change in plasma 1,5-AG concentrations over the course of a day in these healthy participants, as well as those with poor glycemic control. Akanuma et al. (58) also reported that a glucose challenge (100 g) had no effect on plasma 1,5-AG nor urinary excretion concentrations over 3 h in participants with good glycemic control. These data are fairly consistent with Su et al. (61) who reported very small (though consistent) rises in 1,5-AG in individuals without diabetes after a 75-g glucose load (60), and also after a test meal of steamed bread.
Four studies have reported on changes in 1,5-AG following sustained dietary interventions. The most directly relevant of these, Juraschek et al. (63) reported on 1,5-AG in healthy adults following combinations of diets low and high in GI (≤45 versus ≥65) and carbohydrate (40 versus 58% of energy) for 5 wk each. Although all diets led to a significant (versus baseline) reduction in 1,5-AG, pairwise comparisons indicated larger and additive effects of a lower GI or proportion of carbohydrate. However, the magnitude of the between-diet effects was small, with mean differences of only ∼0.5–1.5 μg/mL, despite large differences in diet composition. Khakimov et al. (43) evaluated metabolomic profiles of groups consuming the New Nordic Diet compared with an average Danish diet for 6 mo. In that trial there were no significant differences between diets in 1,5-AG and fructosamine (43). Bakker et al. (62) gave healthy overweight men a complex “anti-inflammatory” dietary supplement mix (resveratrol, green tea extract, α-tocopherol, vitamin C, n–3 PUFAs, and tomato extract) or placebo for 5 wk. Relative to placebo, the supplement produced a small but significant reduction in 1,5-AG; however, there were no obvious differences in glycemic exposures, and no changes in FG or insulin, nor in glycemic responses to a 500 kcal mixed nutrient challenge test (64). Lastly, Higashikawa et al. (65) reported 1,5-AG concentrations at baseline and following intervention with varied dose combinations of 5-aminoleulinic acid phosphate (ALA-P) and iron for 12 wk, in people with mild hyperglycemia. Although 1 treatment (the highest concentration of ALA-P) led to small but statistically significant reductions in FG and GA (but not HbA1c) relative to the placebo, there were negligible changes in 1,5-AG.
Two studies reported on cross-sectional associations of 1,5-AG with reported dietary behavior. Koga et al. (21) carried out a brief survey of eating habits, focused on the higher versus lower frequency of consumption of meats, fish, soybean, eggs, dairy, fruit, vegetables, and salt-preserved foods, in individuals with confirmed good glycemic control. The data indicate a consistent inverse association between 1,5-AG concentrations (but not HbA1c or GA) and reported frequent intake of dairy products (“every day” versus not). This association also remained significant when measures of glycemic control and intakes of other dietary components were considered. However, it is not clear if this reflects a causal effect of dairy products (e.g., on 1,5-AG metabolism) or whether dairy intake is perhaps indicative of other (unrecorded) dietary behaviors that affect glycemic exposures. Lastly, Inada and Koga (59) reported no association of reported alcohol intakes with 1,5-AG.
Conclusion
Very few articles have explicitly considered whether 1,5-AG could be relevant as a marker of glycemic exposures in the general population. Nevertheless, the available evidence indicates that for individuals with good glycemic control, 1,5-AG concentrations are relatively unresponsive to variation in dietary glycemic exposures. This is not surprising, because under healthy physiological control, blood glucose concentrations will not approach the glycosuric threshold. This is corroborated by the absence of increased 1,5-AG losses in urine of healthy people following large acute glucose loads, under the same conditions where losses are immediately observed among individuals with poor glycemic control (58) (Table 1).
There may still be situations where 1,5-AG might be relevant for “healthy” populations. Within the general population, especially in certain global regions (e.g., India, Middle East), there are significant proportions of individuals with prediabetes and impaired glucose tolerance (66, 67). Furthermore, as noted above, there is evidence that low concentrations of 1,5-AG are seen in the general population (without diabetes), and that these may even be a meaningful marker of increased disease risk (68). It therefore remains plausible, but untested, that 1,5-AG concentrations could be responsive to relatively short dietary intervention periods in susceptible “healthy” populations without diabetes; i.e., where there is likely to be a high prevalence of individuals with relatively weaker (postprandial) glycemic control. However, there is presently no empirical evidence for this, and the utility or advantages of applying 1,5-AG as a marker of potentially beneficial dietary interventions is greatly tempered by its slower responsiveness to reduced (compared with increased) glycemic exposures.
Dicarbonyl stress
Characterization
The term “dicarbonyls” in the context of markers of glycemic exposure usually refers to α-oxoaldehydes such as methylglyoxal (MG), 3-deoxyglucosone (3-DG), and similar compounds (69–71). Dicarbonyls may reflect glycemic exposure because they largely result from the degradation of glycolytic intermediates and glycated protein formation; they are also metabolized presystemically (72).
With increasing FG and PPG exposures, plasma MG and 3-DG concentrations increase as a consequence of increased glucose metabolism and protein glycation by glucose, respectively, and thereby potentially provide a marker of increased glycemic exposure. MG may also indicate risk of reduced glucose tolerance as it may be a mediator of insulin resistance and FG and PPG in experimental obesity and in people with overweight or obesity (23). Increased MG may thereby be both a consequence and cause of hyperglycemia.
See Supplemental Data 2D for more complete background details and methods of quantification.
Overview of the literature
From 194 unique records on dicarbonyl stress identified from titles and abstracts, only 3 studies met the criteria for inclusion in this review. A further 7 records were identified from hand searches of relevant literature (Supplemental Figure 1D).
Only 1 randomized, placebo-controlled trial has evaluated plasma dicarbonyl (MG) in an intervention that improved glycemic status. In a crossover study of people with overweight and obesity, combination treatment with trans-resveratrol-hesperetin (tRES-HESP) for 8 wk decreased fasting plasma MG (by 37%) relative to baseline in highly overweight subjects whereas treatment with placebo did not, although the difference between treatments was not statistically significant. Relative to control, tRES-HESP significantly decreased fasting plasma and postprandial glucose and corrected insulin resistance in this subject group (73).
In observational studies, fasting plasma MG assayed by the reference LC-MS/MS assay was found to be progressively higher in healthy people with normal weight, overweight, or obesity: 132 ± 63 nM, 181 ± 61 nM, and 245 ± 123 nM, respectively (74, 75). Fasting plasma 3-DG was 164 ± 41 nM and increased by 12% after a high-fat meal and 26% after a high-carbohydrate meal (76). Finally, an OGTT increased plasma dicarbonyls in the subsequent 2 h, with plasma concentrations returning to fasting concentrations at 2 h in healthy controls but remained increased in people with impaired glucose tolerance (77).
Conclusion
Further studies are required to confirm this relation and clinical utility of plasma MG or a related biomarker. From observational studies, plasma MG and 3-DG are associated with impaired glucose tolerance and impaired FG, particularly in obesity (Table 1). From a previous randomized controlled trial (RCT) targeting inducing the expression of Glo1 to decrease MG, it appears that plasma MG is linked positively and possibly causally to increased insulin resistance and FG and PPG exposures in people with overweight or obesity (78).
A weakness of plasma dicarbonyls as markers of glycemic exposure is their relatively short metabolic half-life of 10–20 min (79). The steady–state concentrations of dicarbonyls in plasma reflect the balance of their formation and metabolism at the period of sample collection rather than a cumulative measure of their formation over an extended period of days or weeks before donation . Other longer-lived markers related to dicarbonyls, such as a dicarbonyl-modified albumin and hemoglobin, hydroimidazolone advanced glycation endproducts of albumin, and hemoglobin (80–83), may be worthy of investigation (see below). Plasma dicarbonyl measurements of glycemic exposure are also influenced by variation in activities of Glo1 (Glyoxalase I) and AKR (Aldo-keto reductases) which may lead to under- or overreporting for individuals with relatively high and low Glo1 and AKR expression, respectively. An option to avoid this may be to measure the major metabolic products of MG and 3-DG, namely plasma D-lactate and plasma or urinary 3-deoxyfructose (84, 85). With metabolic challenges, such as a glucose tolerance test or meals, steady–state concentrations of plasma dicarbonyls increase due to increased rates of dicarbonyl formation and increased absorption of dietary 3-DG in the absorptive phase (77). Increases of the steady–state concentrations of plasma dicarbonyls in the fasting state over longer periods may occur due to the slow development of dysglycemia and/or decline in activities of the enzymes of dicarbonyl metabolism with age. For example, mean Glo1 activity of the human lens decreases 50% over 30–40 y (86, 87). Dietary interventions that correct dysglycemia and/or increase the expression of enzymes of dicarbonyl metabolism may reverse increased steady–state concentration plasma dicarbonyls over relatively shorter periods; for example, 8-wk treatment with tRES-HESP (78).
AGEs
Characterization
AGEs are stable end-stage adducts formed during the glycation of proteins, and as free adducts or glycated amino acids in physiological fluids (71). AGEs in whole serum/plasma also includes a contribution of AGEs absorbed from food. The major AGEs quantitatively are: hydroimidazolone (MG-H1), Nε-carboxymethyl-lysine (CML), Nε-fructosyl-lysine (FL), and glucosepane (GSP) (83, 88–91). In addition, pentosidine is a low level fluorescent AGE formed from a reaction of proteins with pentoses derived from the pentosephosphate pathway (90).
The concentration of AGE-modified proteins reflects the steady–state concentration maintained by the formation of AGEs during protein glycation and the removal of AGE-modified proteins by cellular proteolysis. Since the precursors driving AGE formation are related to glycemic exposure and glucose metabolism, the steady–state concentrations of AGE-modified proteins in serum or plasma, corrected as needed for dietary AGEs, may provide a summation of glycemic exposure over the half-life of the protein on which they are formed. They are thereby potential markers of medium-term (weeks–months) and long-term (years) glycemic exposure (91, 92). AGEs have been measured by immunoassay and antibodies to several AGEs are available (93). Anti-AGE antibodies were initially produced using protein highly glycated by glucose as the immunogen. Under these conditions CML is often the dominant antigen recognized by antibodies produced (94–96) and is structurally similar to MG-derived Nε-(1-carboxyethyl)lysine (CEL) (97). Assessment of urinary AGEs may potentially also provide a noninvasive measure of glycemic status (78). Reducing glycemic exposures may therefore reduce AGE formation, but for example the drug metformin is believed to reduce AGE accumulation in patients with diabetes by other mechanisms in addition to its hypoglycemic activity (98).
See Supplemental Data 2E for more complete background details and methods of quantification.
Overview of the literature
There are limited data on estimates of AGEs in people without diabetes and the possible relations with glycemic exposures. From 1225 unique records on AGEs identified from titles and abstracts, 23 studies were identified by the systematic search and a further 7 were added from hand searches (Supplemental Figure 1E).
Eight randomized, placebo-controlled trials evaluated plasma, serum, and urinary AGEs as indicators of glycemic control in subjects without diabetes. In a double-blind crossover study of people with overweight and obesity, treatment with a tRES-HESP intervention for 8 wk decreased FG and PPG relative to the control in highly overweight subjects, but without significant differences in plasma protein MG-H1 content. There was, however, a decrease in flux of urinary MG-H1 with the tRES-HESP intervention in the total subject group, relative to baseline and the control treatment. The decrease of urinary flux of MG-H1, corrected for the contribution from food, and urinary flux of pentosidine was associated with improved insulin sensitivity assessed by the oral glucose insulin sensitivity (OGIS) index (73).
In a study measuring plasma-free adduct concentrations of AGEs, CML, and CEL, and the effect of carbohydrate-rich or fat-rich meals, plasma CML-free adduct was increased after both fat- and carbohydrate-rich meals, whereas plasma CEL-free adduct was increased only after carbohydrate-rich meals (76). The precursors of CML formation(glyoxal and FL) are derived from lipids and carbohydrates whereas the major precursor of CEL, MG, is mainly derived from carbohydrates.
Conclusion
There are very limited data available from RCTs on the link of AGEs with glycemic exposures.
A strength of AGE measurements as candidate markers of glycemic exposure is their potential to provide a report on medium- to long-term periods. The period of report relates to the half-life of the protein or AGE, whichever is shorter, of the AGE-modified protein measured. For dicarbonyl-derived AGEs such as MG-H1, 3DG-H, and CEL, measurement of AGEs in albumin and hemoglobin has the potential to provide a report on dicarbonyl stress similar to that provided by GA and HbA1c for glucose exposure but with greater responsiveness since rates of glycation by MG and 3-DG are markedly faster than by glucose (79). GSP is a chemically stable glucose-derived AGE. It is expected to have features of a chemically stable, cumulative glucose exposure reporter (89) and therefore may have advantages over GA and HbA1c which slowly degrade; HbA1c is also repaired enzymatically (99). Pentosidine is derived from pentose sugars and may provide a report on pentosephosphate metabolic activity which has been linked to insulin resistance (100). AGE-modified proteins may thereby provide reports on metabolism related to glycemic exposure different to and advantageous over those provided by GA and HbA1c.
A weakness of AGE assessments remains the difficulties in assaying AGEs with high analytical specificity, sensitivity, and throughput. Immunoassays of AGE-modified proteins are potentially useful if improvements in analytical performance can be made (See Supplemental Data 2E). Corroboration of the stable isotopic dilution analysis LC-MS/MS reference method, preparation of protein extracts to avoid interference from AGE-free adducts, and use of an AGE-free synthetic polypeptide to block nonspecific binding may help. In groups without diabetes but where insulin resistance and obesity are often present, it may be preferable to assess AGEs in hemoglobin or urinary AGE-free adducts (corrected for dietary contribution where necessary) and thereby avoid potential interference from change in the albumin transcapillary escape rate.
Metabolomics
Characterization
Metabolomics is the global measurement of metabolites in biological samples, which has shown potential in the dietary biomarker field. The most common techniques include but are not limited to NMR spectroscopy, LC-MS, GC-MS, and 2-dimensional GC-Time of Flight/MS (GCxGC-TOF/MS). These techniques can be used efficiently in the discovery of biomarkers; further follow-up studies and measurements are then necessary to validate the measurements and to develop quantitative assays. As this field is still in its infancy there are no reference values for the emerging metabolomic biomarkers of glycemic exposure.
Overview of the literature
From 1589 unique records on metabolomics identified from titles and abstracts, only 6 eligible studies were identified from the systematic search (supplemental Figure 1F). There were 5 RCTs of interest (101–105) and 1 trial without a control group (106) (Table 1).
Seventy-seven obese adults were studied by Rasmussen et al. (105), over 6 mo in a randomized parallel controlled trial. Participants were randomly assigned to 1 of 5 intervention groups: low-GI, low-protein (LGI/LP); low-GI, high-protein (LGI/HP); high-GI, low-protein (HGI/LP); high-GI, high-protein (HGI/HP); or control diet. For the analyses, the 2 LGI and 2 HGI diets were pooled, so the diets had a range between 45–50% and 57–62% of energy from carbohydrates and 10–15% and 23–28% from protein, besides that, the fiber content was ∼60 g/d for LGI and 47.8 g/d for HGI. 1H NMR-MS investigation was performed on 24-h urine samples and 1 of the main effects observed was higher formate concentrations in the HGI diet. However, formate is positively associated in the literature both with low-fiber intake (107) or energy intake (108) hence ruling it out as a specific marker of glycemic exposures.
Johansson-Persson et al. (103) performed a 5-wk randomized controlled crossover intervention to examine the effects of a high-fiber diet. Untargeted liquid chromatography-quad time-of-flight)(LC-QTOF)/MS identified 2 new markers, namely 2,6-dihydroxybenzoic acid and 2-aminophenol sulfate, that could differentiate both interventions and were increased after the HF diet (P <0.01). However, it is unclear if these changes were related to glycemic exposures, as the intervention had no significant effects on FG, insulin, or insulin resistance (109). The specificity of these markers for glycemic exposures needs to be determined in future studies.
Barton et al. (101) reported on a pilot metabolic analysis using LC-MS/MS from a subset of 19 individuals in a crossover design RCT (n = 82) in which subjects received a diet with low-glycemic load (LGL, 125 GL/d and 55 g fiber/d) or high-glycemic load (HGL, 250 GL/d and 28 g fiber/d), over 2 × 28-d periods. Comparing the LGL versus HGL diet, there were significant differences in 14 plasma metabolites but, after Bonferroni correction for multiple comparisons, only kynurenate (higher), cystamine (lower), and methyl succinate (higher) remained significant (P <0.01 for all) and satisfied the less stringent false detection rate threshold of q <0.20. However, the absolute concentrations for these metabolites were not given, only the ratio of concentrations after the LGL versus HGL diet, making interpretation of these as biomarkers of glycemic exposure difficult.
A parallel RCT performed by Beckmann et al. (102) assessed 97 female volunteers, who received either 0, 50, or 100 g single dose of sucrose. Urine and plasma were evaluated by flow injection electrospray mass spectrometry (FIE-MS)and gas chromotography time-of-flight mass spectrometry (GC-TOF-MS). Results demonstrated that sucrose, fructose, and erythronic acid in urine were positively related and dose responsive to sucrose intake. Both sucrose and fructose have been previously found to be related to glycemic exposures. The authors suggest that erythronic acid in combination with urinary sucrose and fructose could potentially be a useful marker of sucrose intake. However, further studies are necessary to demonstrate its relevance as a glycemic marker.
Gu et al. (106) assessed 45 “healthy” obese and 30 healthy controls (mean BMI 21.29) participants in an 8-wk single-arm intervention. The obese group received a very low-carbohydrate diet (VLCD; energy intake restricted to <800 kcal/d and carbohydrate <20 g/d), whereas control participants were assessed only at baseline. Serum samples were analyzed by ultra performance liquid chromatography (UPLC)-QTOFMS and GC-TOF-MS, with data from both combined in a new set for analyses by uni- and multivariate methods. Since the control group did not take part in the intervention, it is only possible to report on the analysis comparing the results of the obese group pre- and postdiet. At the end of the intervention period, the metabolic profile of patients with obesity diverged from their own baseline but still remained different from controls. Additionally, the carbohydrates ribose (ratio change over baseline = 2.26, P = 0.00002) and mannose (ratio change = 1.19, P = 0.011) were significantly different in the obese group after an 8-wk VLCD diet compared with the values before the intervention. However, the concentrations of these metabolites are not presented in the article. Additional research is needed to confirm that ribose and mannose are indeed relevant markers of glycemic exposure.
Conclusion
Overall, the articles have identified some putative biomarkers but further work is needed in terms of validation (Table 1). Such work includes demonstration of dose response, sensitivity and specificity, development of quantitative measurement assays, and measurement in larger cohorts. Considering the current evidence we would not recommend any of the above-mentioned metabolites as biomarkers of glycemic intake but would encourage further work to be performed in an attempt to progress these as potential biomarkers.
General Discussion
We found limited data assessing the use or validity of these markers for sustained variation in diet-induced glycemic exposures in people without diabetes. That is perhaps not surprising, given that some are relatively new and for others the main interest has largely been focused on their potential use in diabetes diagnosis or monitoring, and prediction of chronic disease risk including comorbidities of diabetes. Furthermore, the relatively limited range and duration of glycemic excursions above fasting in individuals without diabetes poses a challenge to the sensitivity of markers to reliably capture differences between groups with differing dietary exposures. None of the markers considered here can be recommended for this application based on the current evidence and state of technology. However, given the high levels of interest in lowering the glycemic response to foods, and adverse associations of glycemic exposures with disease risk in the general population (1, 110–112), it is relevant and timely to consider which markers might have promise for future applications in research with healthy individuals.
At present, GA appears perhaps the most promising of the nonglucose molecular markers, but this is tempered by its potential confounding by fat mass. There is some (although very limited) evidence for responsiveness of GA to sustained periods (weeks) of dietary interventions in individuals without diabetes. The analysis of GA is also well developed and applicable for routine use in intervention and cohort studies. The cause of the variation associated with fat mass is unclear, but may relate to increasing dwell time of albumin in the increased volume of the interstitial fluid in people with obesity, whereby the rate of glycation is decreased (23). Future studies may explore measurement of GA in directly relevant interventions and corrections for fat mass or BMI.
In parallel, our assessment suggests that 1,5-AG and fructosamine are unlikely to be sufficiently sensitive for glycemic exposures relevant for the general population, especially individuals with good glycemic control. These markers are therefore probably inherently unsuited for this purpose; however, this has not been rigorously tested in the available studies. In many cases there was no clear characterization of the magnitude or variations in glycemic exposures. It is also important to note that a conclusion regarding the unsuitability of these markers for assessing variation in glycemic exposures in individuals without diabetes is not an assessment of their potential value as markers of disease risk in this population. Variation in each of these markers has been reported to be significantly associated with future risk of diabetes or cardiovascular disease in populations without diabetes (68, 113, 114).
Currently, there is also limited validated concrete support for applying the dicarbonyls and AGEs that have been considered so far, although other specific dicarbonyls and AGEs may be identified as suitable markers. Although MG and 3-DG or related dicarbonyl species have been shown to respond to variation in glycemic exposures, they mainly reflect a relatively acute short-term increase in dicarbonyl formation and, for 3-DG, dietary absorption. A relatively high concentration of plasma dicarbonyls may reflect a relatively low rate of dicarbonyl metabolism rather than increased formation related to increased glucose exposure. Hence, the relation of plasma dicarbonyls to dysglycemia is more complex than that of GA, where the latter analyte is formed directly from glucose and is relatively long-lived. Challenges also remain to minimize interlaboratory variation in estimates of plasma dicarbonyls. Adoption and implementation of the reference LC-MS/MS analytical method or methods that corroborate it for clinical use will help (74). Advances in instrumentation providing automated LC-MS/MS systems for rollout into clinical chemistry laboratories may facilitate this.
In principle, measurement of AGEs in albumin or hemoglobin could provide a cumulative measure of dysglycemia better than GA and HbA1c. For example, GSP is a quantitatively major glucose-derived AGE with longer chemical stability than fructosamine adducts and so may be expected to show improved integration of glucose exposure compared with current conventional measures of GA and HbA1c. However, the lack of commercially available analytical standards and immunoassay for GSP is currently impeding its development as a marker of glucose exposure. There are also a number of confounding factors that can influence the measurement of AGEs, e.g., presence of AGE-free adducts (without a preanalytic protein extraction step), oxidative stress affecting CML, and like GA, measurement in obese subjects. Future use of improved assay methodology for AGE analysis will help (e.g., stable isotopic dilution analysis LC-MS/MS or specific immunoassays). Robust absolute quantitation with chemically defined AGE calibration standards will also help in interlaboratory comparison of AGE estimates.
Finally, metabolomic markers reflecting prior glycemic exposures may eventually find applications, but there is a need to establish that the metabolites proposed to differentiate exposures are specific for glycemia, and generate replicable and robust response patterns that can be sensitively compared between groups. At the moment it is not possible to identify markers with the greatest potential for this purpose; however, it is clear that this approach holds great promise and further investigation is warranted.
Improved glycemic markers may emerge from a combination of biomarker responses assessed, particularly by machine learning techniques with data-driven selection of optimum biomarker combinations, and further validation of candidate markers in blood samples collected and stored under conventional routine clinical conditions for ease of clinical translation (e.g., use of machine learning in plasma metabolomics studies to identify metabolite combinations that predict progression to diabetes [115] and application of an LC-MS/MS assay of AGEs in stored repository blood samples [116]).
There are a number of limitations to the present review, particularly—as repeatedly noted—the limited availability and difficulty of identifying research directly assessing these markers with the populations and outcomes of interest. Furthermore, because these markers may often have been secondary or exploratory outcomes in research, not all relevant studies would be identified by the systematic search process. This is clear from the relatively large proportion of evidence (>25% of articles) identified by hand searching. Lastly, research on other interventions such as physical activity or medications in populations without diabetes was not considered here, but could also be useful in establishing the viability and potential responsiveness of these markers in this population.
General Conclusion
In summary, none of the markers considered here can yet be considered sufficiently validated or sensitive for routine use in assessing sustained variation in glycemic exposures with dietary interventions in individuals without diabetes. Further validation studies would be required, to demonstrate consistently replicable and sensitive responsiveness to a range of dietary interventions that generate well-characterized variation in glycemic exposures in this population. For example, additional research is needed to confirm GA as a good glycemic exposure marker in the general population especially as it is confounded by fat mass. 1,5-AG and fructosamine are poorly suited for this population and purpose of interest here. Measures based on dicarbonyls, AGEs, or metabolomics approaches may eventually become applicable, but further research is needed into the selection of specific markers (molecular species) to be considered for further testing.
Supplementary Material
ACKNOWLEDGEMENTS
The authors’ contributions were as follows—EF, LB, LMEL, DM, NR, WR, FR, CS, ST, PT, and SV: conceptualized, conducted the research, and drafted initial subsections of the manuscript, with further input from PD and MF; PD, EF, MF, and DM: coordinated the implementation of the registered protocol; MF and DM: finalized the manuscript; and all authors read and approved the final manuscript.
Notes
This work was conducted by an expert group of the European branch of the International Life Sciences Institute, ILSI Europe, as an activity supported by the Dietary Carbohydrates Task Force (https://ilsi.eu/task-forces/nutrition/dietary-carbohydrates/). The research reported is the result of a scientific evaluation in line with ILSI Europe's framework to provide a precompetitive setting for public-private partnership (PPP). ILSI Europe facilitated scientific meetings and coordinated the overall project management and administrative tasks relating to the completion of this work. For further information about ILSI Europe, please email info@ilsieurope.be or call + 32 2 771 00 14. The opinions expressed herein and the conclusions of this publication are those of the authors and do not necessarily represent the views of ILSI Europe nor those of its member companies.
Author disclosures: During the time this work was carried out, DM, FR, ST, and SV were employees of companies manufacturing and marketing foods or food ingredients. LB, EF, LMEL, NR, WR, CS, and PT were offered support for travel and accommodation to attend meetings to discuss the manuscript, and a small compensatory sum (honoraria) with the option to decline. The authors carried out the work, i.e. collecting/analyzing data/information and writing the scientific manuscript independent of any other activities of the Task Force and ILSI Europe.
Supplemental Figure 1 and Supplemental Data 1 and 2 are available from the “Supplementary data” link in the online posting of the article and from the same link in the online table of contents at http://academic.oup.com/advances.
Abbreviations used: AGE, advanced glycated end product; AKR, Aldo-keto reductases; ALA-P, 5-aminoleulinic acid phosphate; CEL, Nε-(1-carboxyethyl)lysine; CML, Nε-carboxymethyl-lysin; FG, fasting glucose; FL, Nε-fructosyl-lysine; GA, glycated albumin; GI, glycemic index; Glo1, Glyoxalase I; GSP, glucosepane; HbA1c, glycated hemoglobin; MG, methylglyoxal; MG-H1, hydroimidazolone; OGTT, oral-glucose-tolerance test; PPG, postprandial glycemia; RCT, randomized controlled trial; T2D, type 2 diabetes; tRES-HESP, trans-resveratrol-hesperetin; VLCD, very low-carbohydrate diet; 1,5-AG, 1,5-anhydroglucitol; 3-DG, 3-deoxyglucosone.
References
- 1. Blaak EE, Antoine JM, Benton D, Björck I, Bozzetto L, Brouns F, Diamant M, Dye L, Hulshof T, Holst JJ et al.. Impact of postprandial glycaemia on health and prevention of disease. Obes Rev. 2012;13(10):923–84. [DOI] [PMC free article] [PubMed] [Google Scholar]
- 2. Faerch K, Alssema M, Mela DJ, Borg R, Vistisen D. Relative contributions of preprandial and postprandial glucose exposures, glycemic variability, and non-glycemic factors to HbA 1c in individuals with and without diabetes. Nutr Diabetes. 2018;8(1):38. [DOI] [PMC free article] [PubMed] [Google Scholar]
- 3. Bennett WL, Maruthur NM, Singh S, Segal JB, Wilson LM, Chatterjee R, Marinopoulos SS, Puhan MA, Ranasinghe P, Block L et al.. Comparative effectiveness and safety of medications for type 2 diabetes: an update including new drugs and 2-drug combinations. Ann Intern Med. 2011;154(9):602–13. [DOI] [PMC free article] [PubMed] [Google Scholar]
- 4. Sherifali D, Nerenberg K, Pullenayegum E, Cheng JE, Gerstein HC. The effect of oral antidiabetic agents on A1C levels: a systematic review and meta-analysis. Diabetes Care. 2010;33(8):1859–64. [DOI] [PMC free article] [PubMed] [Google Scholar]
- 5. Chan CL, Pyle L, Kelsey M, Newnes L, Zeitler PS, Nadeau KJ. Screening for type 2 diabetes and prediabetes in obese youth: evaluating alternate markers of glycemia – 1,5-anhydroglucitol, fructosamine, and glycated albumin. Pediatr Diabetes. 2016;17(3):206–11. [DOI] [PubMed] [Google Scholar]
- 6. Dorcely B, Katz K, Jagannathan R, Chiang SS, Oluwadare B, Goldberg IJ, Bergman M. Novel biomarkers for prediabetes, diabetes, and associated complications. Diabetes Metab Syndr Obes. 2017;10:345–61. [DOI] [PMC free article] [PubMed] [Google Scholar]
- 7. Juraschek SP, Steffes MW, Miller ER 3rd, Selvin E. Alternative markers of hyperglycemia and risk of diabetes. Diabetes Care. 2012;35(11):2265–70. [DOI] [PMC free article] [PubMed] [Google Scholar]
- 8. Poon AK, Juraschek SP, Ballantyne CM, Steffes MW, Selvin E. Comparative associations of diabetes risk factors with five measures of hyperglycemia. BMJ Open Diab Res Care. 2014;2(1):e000002. [DOI] [PMC free article] [PubMed] [Google Scholar]
- 9. Colhoun HM, Marcovecchio ML. Biomarkers of diabetic kidney disease. Diabetologia. 2018;61(5):996–1011. [DOI] [PMC free article] [PubMed] [Google Scholar]
- 10. Lee JE. Alternative biomarkers for assessing glycemic control in diabetes: fructosamine, glycated albumin, and 1,5-anhydroglucitol. Ann Pediatr Endocrinol Metab. 2015;20(2):74–8. [DOI] [PMC free article] [PubMed] [Google Scholar]
- 11. Alssema M, Boers HM, Ceriello A, Kilpatrick ES, Mela DJ, Priebe MG, Schrauwen P, Wolffenbuttel BH, Pfeiffer AFH. Diet and glycaemia: the markers and their meaning. A report of the Unilever Nutrition Workshop. Br J Nutr. 2014;113(02):239–48. [DOI] [PMC free article] [PubMed] [Google Scholar]
- 12. Dozio E, Di Gaetano N, Findeisen P, Corsi Romanelli MM. Glycated albumin: from biochemistry and laboratory medicine to clinical practice. Endocrine. 2017;55(3):682–90. [DOI] [PubMed] [Google Scholar]
- 13. Kohzuma T, Yamamoto T, Uematsu Y, Shihabi ZK, Freedman BI. Basic performance of an enzymatic method for glycated albumin and reference range determination. J Diabetes Sci Technol. 2011;5(6):1455–62. [DOI] [PMC free article] [PubMed] [Google Scholar]
- 14. Won HK, Kim KJ, Lee BW, Kang ES, Cha BS, Lee HC. Reduction in glycated albumin can predict change in HbA1c: comparison of oral hypoglycaemic agent and insulin treatments. Diabet Med. 2012;29(1):74–9. [DOI] [PubMed] [Google Scholar]
- 15. Davie SJ, Gould BJ, Yudkin JS. Effect of vitamin C on glycosylation of proteins. Diabetes. 1992;41(2):167–73. [DOI] [PubMed] [Google Scholar]
- 16. Li S, Guerin-Deremaux L, Pochat M, Wils D, Reifer C, Miller LE. NUTRIOSE dietary fiber supplementation improves insulin resistance and determinants of metabolic syndrome in overweight men: a double-blind, randomized, placebo-controlled study. Appl Physiol Nutr Metab. 2010;35(6):773–82. [DOI] [PubMed] [Google Scholar]
- 17. Ryle AJ, Davie S, Gould BJ, Yudkin JS. A study of the effect of diet on glycosylated haemoglobin and albumin levels and glucose tolerance in normal subjects. Diabet Med. 1990;7(10):865–70. [DOI] [PubMed] [Google Scholar]
- 18. Stanhope KL, Griffen SC, Bremer AA, Vink RG, Schaefer EJ, Nakajima K, Schwarz JM, Beysen C, Berglund L, Keim NL et al.. Metabolic responses to prolonged consumption of glucose- and fructose-sweetened beverages are not associated with postprandial or 24-h glucose and insulin excursions. Am J Clin Nutr. 2011;94(1):112–9. [DOI] [PMC free article] [PubMed] [Google Scholar]
- 19. Swanson JE, Laine DC, Thomas W, Bantle JP. Metabolic effects of dietary fructose in healthy subjects. Am J Clin Nutr. 1992;55(4):851–6. [DOI] [PubMed] [Google Scholar]
- 20. Vega-Lopez S, Matthan NR, Ausman LM, Harding SV, Rideout TC, Ai M, Otokozawa S, Freed A, Kuvin JT, Jones PJ et al.. Altering dietary lysine:arginine ratio has little effect on cardiovascular risk factors and vascular reactivity in moderately hypercholesterolemic adults. Atherosclerosis. 2010;210(2):555–62. [DOI] [PMC free article] [PubMed] [Google Scholar]
- 21. Koga M, Murai J, Saito H, Mukai M, Kasayama S. Habitual intake of dairy products influences serum 1,5-anhydroglucitol levels independently of plasma glucose. Diabetes Res Clin Pract. 2010;90(1):122–5. [DOI] [PubMed] [Google Scholar]
- 22. Ueda Y, Matsumoto H. Recent topics in chemical and clinical research on glycated albumin. J Diabetes Sci Technol. 2015;9(2):177–82. [DOI] [PMC free article] [PubMed] [Google Scholar]
- 23. Masania J, Malczewska-Malec M, Razny U, Goralska J, Zdzienicka A, Kiec-Wilk B, Gruca A, Stancel-Mozwillo J, Dembinska-Kiec A, Rabbani N et al.. Dicarbonyl stress in clinical obesity. Glycoconj J. 2016;33(4):581–9. [DOI] [PMC free article] [PubMed] [Google Scholar]
- 24. Wang F, Ma X, Hao Y, Yang R, Ni J, Xiao Y, Tang J, Bao Y, Jia W. Serum glycated albumin is inversely influenced by fat mass and visceral adipose tissue in Chinese with normal glucose tolerance. PLoS One. 2012;7(11):e51098. [DOI] [PMC free article] [PubMed] [Google Scholar]
- 25. Nishimura R, Kanda A, Sano H, Matsudaira T, Miyashita Y, Morimoto A, Shirasawa T, Kawaguchi T, Tajima N. Glycated albumin is low in obese, non-diabetic children. Diabetes Res Clin Pract. 2006;71(3):334–8. [DOI] [PubMed] [Google Scholar]
- 26. Huh JH, Kim KJ, Lee BW, Kim DW, Kang ES, Cha BS, Lee HC. The relationship between BMI and glycated albumin to glycated hemoglobin (GA/A1c) ratio according to glucose tolerance status. PLoS One. 2014;9(2):e89478. [DOI] [PMC free article] [PubMed] [Google Scholar]
- 27. Armbruster DA. Fructosamine: structure, analysis, and clinical usefulness. Clin Chem. 1987;33(12):2153–63. [PubMed] [Google Scholar]
- 28. Ardawi MSM, Nasrat HAN, Bahnassy AA. Fructosamine in obese normal subjects and type 2 diabetes. Diabet Med. 1994;11(1):50–6. [DOI] [PubMed] [Google Scholar]
- 29. Jenkins DJ, Wolever TM, Collier GR, Ocana A, Rao AV, Buckley G, Lam Y, Mayer A, Thompson LU. Metabolic effects of a low-glycemic-index diet. Am J Clin Nutr. 1987;46(6):968–75. [DOI] [PubMed] [Google Scholar]
- 30. Misciagna G, Logroscino G, De Michele G, Cisternino AM, Guerra V, Freudenheim JL. Fructosamine, glycated hemoglobin, and dietary carbohydrates. Clin Chim Acta. 2004;340(1–2):139–47. [DOI] [PubMed] [Google Scholar]
- 31. Moura BP, Amorim PR, Silva BP, Franceschini SC, Reis JS, Marins JC. Effect of a short-term exercise program on glycemic control measured by fructosamine test in type 2 diabetes patients. Diabetol Metab Syndr. 2014;6(1):16. [DOI] [PMC free article] [PubMed] [Google Scholar]
- 32. Baker JR, Johnson RN, Scott DJ. Serum fructosamine concentrations in patients with type II (non-insulin-dependent) diabetes mellitus during changes in management. Br Med J (Clin Res Ed). 1984;288(6429):1484–6. [DOI] [PMC free article] [PubMed] [Google Scholar]
- 33. Danese E, Montagnana M, Nouvenne A, Lippi G. Advantages and pitfalls of fructosamine and glycated albumin in the diagnosis and treatment of diabetes. J Diabetes Sci Technol. 2015;9(2):169–76. [DOI] [PMC free article] [PubMed] [Google Scholar]
- 34. Juraschek SP, Miller ER 3rd, Selvin E, Carey VJ, Appel LJ, Christenson RH, Sacks FM. Effect of type and amount of dietary carbohydrate on biomarkers of glucose homeostasis and C reactive protein in overweight or obese adults: results from the OmniCarb trial. BMJ Open Diabetes Res Care. 2016;4(1):e000276. [DOI] [PMC free article] [PubMed] [Google Scholar]
- 35. Vuksan V, Sievenpiper JL, Owen R, Swilley JA, Spadafora P, Jenkins DJ, Vidgen E, Brighenti F, Josse RG, Leiter LA et al.. Beneficial effects of viscous dietary fiber from konjac-mannan in subjects with the insulin resistance syndrome: results of a controlled metabolic trial. Diabetes Care. 2000;23(1):9–14. [DOI] [PubMed] [Google Scholar]
- 36. Russo F, Riezzo G, Chiloiro M, De Michele G, Chimienti G, Marconi E, D'Attoma B, Linsalata M, Clemente C. Metabolic effects of a diet with inulin-enriched pasta in healthy young volunteers. Curr Pharm Des. 2010;16(7):825–31. [DOI] [PubMed] [Google Scholar]
- 37. Deibert P, Solleder F, König D, Vitolins MZ, Dickhuth H-h, Gollhofer A, Berg A. Soy protein based supplementation supports metabolic effects of resistance training in previously untrained middle aged males. Aging Male. 2011;14(4):273–9. [DOI] [PubMed] [Google Scholar]
- 38. Zulet MA, Navas-Carretero S, Lara y Sánchez D, Abete I, Flanagan J, Issaly N, Fança-Berthon P, Bily A, Roller M, Martinez JA. A Fraxinus excelsior L. seeds/fruits extract benefits glucose homeostasis and adiposity related markers in elderly overweight/obese subjects: a longitudinal, randomized, crossover, double-blind, placebo-controlled nutritional intervention study. Phytomedicine. 2014;21(10):1162–9. [DOI] [PubMed] [Google Scholar]
- 39. Atabani GS, Al-Wali NM, Saeed BO, Al-Mandi AMA. Effect of 75 g oral glucose on fructosamine and glycated haemoglobin concentrations. Ann Clin Biochem. 1990;27(3):270–1. [DOI] [PubMed] [Google Scholar]
- 40. Maki KC, Pelkman CL, Finocchiaro ET, Kelley KM, Lawless AL, Schild AL, Rains TM. Resistant starch from high-amylose maize increases insulin sensitivity in overweight and obese men. J Nutr. 2012;142(4):717–23. [DOI] [PMC free article] [PubMed] [Google Scholar]
- 41. Penn-Marshall M, Holtzman GI, Barbeau WE. African Americans may have to consume more than 12 grams a day of resistant starch to lower their risk for type 2 diabetes. J Med Food. 2010;13(4):999–1004. [DOI] [PubMed] [Google Scholar]
- 42. Taniguchi-Fukatsu A, Yamanaka-Okumura H, Naniwa-Kuroki Y, Nishida Y, Yamamoto H, Taketani Y, Takeda E. Natto and viscous vegetables in a Japanese-style breakfast improved insulin sensitivity, lipid metabolism and oxidative stress in overweight subjects with impaired glucose tolerance. Br J Nutr. 2011;107(08):1184–91. [DOI] [PubMed] [Google Scholar]
- 43. Khakimov B, Poulsen SK, Savorani F, Acar E, Gurdeniz G, Larsen TM, Astrup A, Dragsted LO, Engelsen SB. New Nordic Diet versus Average Danish Diet: a randomized controlled trial revealed healthy long-term effects of the New Nordic Diet by GC-MS blood plasma metabolomics. J Proteome Res. 2016;15(6):1939–54. [DOI] [PubMed] [Google Scholar]
- 44. Gostner A, Schäffer V, Theis S, Menzel T, Lührs H, Melcher R, Schauber J, Kudlich T, Dusel G, Dorbath D et al.. Effects of isomalt consumption on gastrointestinal and metabolic parameters in healthy volunteers. Br J Nutr. 2005;94(04):575. [DOI] [PubMed] [Google Scholar]
- 45. Stanhope KL, Griffen SC, Bremer AA, Vink RG, Schaefer EJ, Nakajima K, Schwarz J-M, Beysen C, Berglund L, Keim NL et al.. Metabolic responses to prolonged consumption of glucose- and fructose-sweetened beverages are not associated with postprandial or 24-h glucose and insulin excursions. Am J Clin Nutr. 2011;94(1):112–9. [DOI] [PMC free article] [PubMed] [Google Scholar]
- 46. Jenkins DJ, Wolever TM, Kalmusky J, Guidici S, Giordano C, Patten R, Wong GS, Bird JN, Hall M, Buckley G. Low-glycemic index diet in hyperlipidemia: use of traditional starchy foods. Am J Clin Nutr. 1987;46(1):66–71. [DOI] [PubMed] [Google Scholar]
- 47. Vrolix R, Mensink RP. Effects of glycemic load on metabolic risk markers in subjects at increased risk of developing metabolic syndrome. Am J Clin Nutr. 2010;92(2):366–74. [DOI] [PubMed] [Google Scholar]
- 48. Bouche C, Rizkalla SW, Luo J, Vidal H, Veronese A, Pacher N, Fouquet C, Lang V, Slama G. Five-week, low-glycemic index diet decreases total fat mass and improves plasma lipid profile in moderately overweight nondiabetic men. Diabetes Care. 2002;25(5):822–8. [DOI] [PubMed] [Google Scholar]
- 49. Suwa T, Ohta A, Matsui T, Koganei R, Kato H, Kawata T, Sada Y, Ishii S, Kondo A, Murakami K et al.. Relationship between clinical markers of glycemia and glucose excursion evaluated by continuous glucose monitoring (CGM). Endocr J. 2010;57(2):135–40. [DOI] [PubMed] [Google Scholar]
- 50. Stickle D, Turk J. A kinetic mass balance model for 1,5-anhydroglucitol: applications to monitoring of glycemic control. Am J Physiol. 1997;273(4):E821–E30. [DOI] [PubMed] [Google Scholar]
- 51. Yamanouchi T, Akanuma H, Asano T, Konishi C, Akaoka I, Akanuma Y. Reduction and recovery of plasma 1,5-anhydro-D-glucitol level in diabetes mellitus. Diabetes. 1987;36(6):709–15. [DOI] [PubMed] [Google Scholar]
- 52. McGill JB, Cole TG, Nowatzke W, Houghton S, Ammirati EB, Gautille T, Sarno MJ. Circulating 1,5-anhydroglucitol levels in adult patients with diabetes reflect longitudinal changes of glycemia: a U.S. trial of the GlycoMark assay. Diabetes Care. 2004;27(8):1859–65. [DOI] [PubMed] [Google Scholar]
- 53. Selvin E, Warren B, He X, Sacks DB, Saenger AK. Establishment of community-based reference intervals for fructosamine, glycated albumin, and 1,5-anhydroglucitol. Clin Chem. 2018;64(5):843–50. [DOI] [PMC free article] [PubMed] [Google Scholar]
- 54. Goto M, Yamamoto-Honda R, Shimbo T, Goto A, Terauchi Y, Kanazawa Y, Noda M. Correlation between baseline serum 1,5-anhydroglucitol levels and 2-hour post-challenge glucose levels during oral glucose tolerance tests. Endocr J. 2011;58(1):13–7. [DOI] [PubMed] [Google Scholar]
- 55. Malkan UY, Gunes G, Corakci A. Rational diagnoses of diabetes: the comparison of 1,5-anhydroglucitol with other glycemic markers. SpringerPlus. 2015;4:587 doi: 10.1186/s40064-015-1389-5. [DOI] [PMC free article] [PubMed] [Google Scholar]
- 56. Yamanouchi T, Akanuma Y. Serum 1,5-anhydroglucitol (1,5 AG): new clinical marker for glycemic control. Diabetes Res Clin Pract. 1994;24:S261–S8. [DOI] [PubMed] [Google Scholar]
- 57. Hu X, He X, Ma X, Su H, Ying L, Peng J, Wang Y, Bao Y, Zhou J, Jia W. A decrease in serum 1,5-anhydroglucitol levels is associated with the presence of a first-degree family history of diabetes in a Chinese population with normal glucose tolerance. Diabet Med. 2018;35(1):1316. [DOI] [PubMed] [Google Scholar]
- 58. Akanuma Y, Morita M, Fukuzawa N, Yamanouchi T, Akanuma H. Urinary excretion of 1,5-anhydro-D-glucitol accompanying glucose excretion in diabetic patients. Diabetologia. 1988;31(11):831–5. [DOI] [PubMed] [Google Scholar]
- 59. Inada S, Koga M. Alcohol consumption reduces HbA1c and glycated albumin concentrations but not 1,5-anhydroglucitol. Ann Clin Biochem. 2016. doi: 10.1177/0004563216675646. [DOI] [PubMed] [Google Scholar]
- 60. Su H, Ma X, Yin J, Wang Y, He X, Bao Y, Zhou J, Jia W. Serum 1,5-anhydroglucitol levels slightly increase rather than decrease after a glucose load in subjects with different glucose tolerance status. Acta Diabetol. 2017;54(5):463–70. [DOI] [PubMed] [Google Scholar]
- 61. Su H, Wang Y, Ma X, He X, Ying L, Tang J, Dong L, Bao Y, Zhou J, Jia W. Comparative agreement analysis of differences in 1,5-anhydroglucitol, glycated albumin, and glycated hemoglobin A1c levels between fasting and postprandial states in steamed bread meal test. Int J Endocrinol. 2017;2017:5917293. [DOI] [PMC free article] [PubMed] [Google Scholar]
- 62. Bakker GC, van Erk MJ, Pellis L, Wopereis S, Rubingh CM, Cnubben NH, Kooistra T, van Ommen B, Hendriks HF. An antiinflammatory dietary mix modulates inflammation and oxidative and metabolic stress in overweight men: a nutrigenomics approach. Am J Clin Nutr. 2010;91(4):1044–59. [DOI] [PubMed] [Google Scholar]
- 63. Juraschek SP, Miller ER 3rd, Appel LJ, Christenson RH, Sacks FM, Selvin E. Effects of dietary carbohydrate on 1,5-anhydroglucitol in a population without diabetes: results from the OmniCarb trial. Diabet Med. 2017;34(10):1407–13. [DOI] [PMC free article] [PubMed] [Google Scholar]
- 64. Pellis L, van Erk MJ, van Ommen B, Bakker GCM, Hendriks HFJ, Cnubben NHP, Kleemann R, van Someren EP, Bobeldijk I, Rubingh CM et al.. Plasma metabolomics and proteomics profiling after a postprandial challenge reveal subtle diet effects on human metabolic status. Metabolomics. 2011;8(2):347–59. [DOI] [PMC free article] [PubMed] [Google Scholar]
- 65. Higashikawa F, Noda M, Awaya T, Tanaka T, Sugiyama M. 5-aminolevulinic acid, a precursor of heme, reduces both fasting and postprandial glucose levels in mildly hyperglycemic subjects. Nutrition. 2013;29(7–8):1030–6. [DOI] [PubMed] [Google Scholar]
- 66. Danaei G, Finucane MM, Lu Y, Singh GM, Cowan MJ, Paciorek CJ, Lin JK, Farzadfar F, Khang YH, Stevens GA et al.. National, regional, and global trends in fasting plasma glucose and diabetes prevalence since 1980: systematic analysis of health examination surveys and epidemiological studies with 370 country-years and 2.7 million participants. Lancet. 2011;378(9785):31–40. [DOI] [PubMed] [Google Scholar]
- 67. Tabak AG, Herder C, Rathmann W, Brunner EJ, Kivimaki M. Prediabetes: a high-risk state for diabetes development. Lancet. 2012;379(9833):2279–90. [DOI] [PMC free article] [PubMed] [Google Scholar]
- 68. Selvin E, Rawlings AM, Grams M, Klein R, Steffes M, Coresh J. Association of 1,5-anhydroglucitol with diabetes and microvascular conditions. Clin Chem. 2014;60(11):1409–18. [DOI] [PMC free article] [PubMed] [Google Scholar]
- 69. Agalou S, Karachalias N, Tucker B, Thornalley PJ, Dawnay A. Estimation of α-oxoaldehydes formed from the degradation of glycolytic intermediates and glucose fragmentation in blood plasma of human subjects with uraemia. Internat Congr Ser. 2002;1245(181):182. [Google Scholar]
- 70. Henning C, Liehr K, Girndt M, Ulrich C, Glomb MA. Extending the spectrum of α-dicarbonyl compounds in vivo. J Biol Chem. 2014;289(41):28676–88. [DOI] [PMC free article] [PubMed] [Google Scholar]
- 71. Rabbani N, Thornalley PJ. Glycation research in amino acids: a place to call home. Amino Acids. 2012;42(4):1087–96. [DOI] [PubMed] [Google Scholar]
- 72. Degen J, Vogel M, Richter D, Hellwig M, Henle T. Metabolic transit of dietary methylglyoxal. J Agric Food Chem. 2013;61(43):10253–60. [DOI] [PubMed] [Google Scholar]
- 73. Xue M, Weickert MO, Qureshi S, Ngianga-Bakwin K, Anwar A, Waldron M, Shafie A, Messenger D, Fowler M, Jenkins G et al.. Improved glycemic control and vascular function in overweight and obese subjects by glyoxalase 1 inducer formulation. Diabetes. 2016;65(8):2282–94. [DOI] [PubMed] [Google Scholar]
- 74. Rabbani N, Thornalley PJ. Measurement of methylglyoxal by stable isotopic dilution analysis LC-MS/MS with corroborative prediction in physiological samples. Nat Protoc. 2014;9(8):1969–79. [DOI] [PubMed] [Google Scholar]
- 75. Masania J, Malczewska-Malec M, Razny U, Goralska J, Zdzienicka A, Kiec-Wilk B, Gruca A, Stancel-Mozwillo J, Dembinska-Kiec A, Rabbani N et al.. Dicarbonyl stress in clinical obesity. Glycoconj J. 2016;33:581–9. [DOI] [PMC free article] [PubMed] [Google Scholar]
- 76. Schindhelm RK, Alssema M, Scheffer PG, Diamant M, Dekker JM, Barto R, Nijpels G, Kostense PJ, Heine RJ, Schalkwijk CG et al.. Fasting and postprandial glycoxidative and lipoxidative stress are increased in women with type 2 diabetes. Diabetes Care. 2007;30(7):1789–94. [DOI] [PubMed] [Google Scholar]
- 77. Maessen DE, Hanssen NM, Scheijen JL, van der Kallen CJ, van Greevenbroek MM, Stehouwer CD, Schalkwijk CG. Post-glucose load plasma α-dicarbonyl concentrations are increased in individuals with impaired glucose metabolism and type 2 diabetes: The CODAM Study. Diabetes Care. 2015;38(5):913–20. [DOI] [PubMed] [Google Scholar]
- 78. Xue M, Weickert MO, Qureshi S, Kandala N-B, Anwar A, Waldron M, Shafie A, Messenger D, Fowler M, Jenkins G et al.. Improved glycemic control and vascular function in overweight and obese subjects by glyoxalase 1 inducer formulation. Diabetes. 2016;65(8):2282–94. [DOI] [PubMed] [Google Scholar]
- 79. Rabbani N, Thornalley PJ. Dicarbonyl stress in cell and tissue dysfunction contributing to ageing and disease. Biochem Biophys Res Commun. 2015;458(2):221–6. [DOI] [PubMed] [Google Scholar]
- 80. Ahmed N, Dobler D, Dean M, Thornalley PJ. Peptide mapping identifies hotspot site of modification in human serum albumin by methylglyoxal involved in ligand binding and esterase activity. J Biol Chem. 2005;280(7):5724–32. [DOI] [PubMed] [Google Scholar]
- 81. Kimzey MJ, Kinsky OR, Yassine HN, Tsaprailis G, Stump CS, Monks TJ, Lau SS. Site specific modification of the human plasma proteome by methylglyoxal. Toxicol Appl Pharmacol. 2015;289(2):155–62. [DOI] [PMC free article] [PubMed] [Google Scholar]
- 82. Chen H-JC, Chen Y-C, Hsiao C-F, Chen P-F. Mass spectrometric analysis of glyoxal and methylglyoxal-induced modifications in human hemoglobin from poorly controlled type 2 diabetes mellitus patients. Chem Res Toxicol. 2015;28(12):2377–89. [DOI] [PubMed] [Google Scholar]
- 83. Ahmed N, Babaei-Jadidi R, Howell SK, Beisswenger PJ, Thornalley PJ. Degradation products of proteins damaged by glycation, oxidation and nitration in clinical type 1 diabetes. Diabetologia. 2005;48(8):1590–603. [DOI] [PubMed] [Google Scholar]
- 84. McLellan AC, Phillips SA, Thornalley PJ. Fluorimetric assay of D-lactate. Anal Biochem. 1992;206(1):12–6. [DOI] [PubMed] [Google Scholar]
- 85. Degen J, Beyer H, Heymann B, Hellwig M, Henle T. Dietary influence on urinary excretion of 3-deoxyglucosone and its metabolite 3-deoxyfructose. J Agric Food Chem. 2014;62(11):2449–56. [DOI] [PubMed] [Google Scholar]
- 86. Haik GM, Lo TWC, Thornalley PJ. Methylglyoxal concentration and glyoxalase activities in the human lens. Exp Eye Res. 1994;59(4):497–500. [DOI] [PubMed] [Google Scholar]
- 87. Mailankot M, Padmanabha S, Pasupuleti N, Major D, Howell S, Nagaraj RH. Glyoxalase I activity and immunoreactivity in the aging human lens. Biogerontology. 2009;10(6):711–20. [DOI] [PMC free article] [PubMed] [Google Scholar]
- 88. Ahmed MU, Thorpe SR, Baynes JW. Identification of Nε-carboxymethyl-lysine as a degradation product of fructoselysine in glycated protein. J Biol Chem. 1986;261(11):4889–94. [PubMed] [Google Scholar]
- 89. Biemel KM, Friedl DA, Lederer MO. Identification and quantification of major Maillard cross-links in human serum albumin and lens protein – evidence for glucosepane as the dominant compound. J Biol Chem. 2002;277(28):24907–15. [DOI] [PubMed] [Google Scholar]
- 90. Sell DR, Monnier VM. Structure elucidation of a senescence crosslink from human extracellular matrix. Implication of pentoses in the aging process. . J Biol Chem. 1989;264(36):21597–602. [PubMed] [Google Scholar]
- 91. Thornalley PJ, Battah S, Ahmed N, Karachalias N, Agalou S, Babaei-Jadidi R, Dawnay A. Quantitative screening of advanced glycation endproducts in cellular and extracellular proteins by tandem mass spectrometry. Biochem J. 2003;375(3):581–92. [DOI] [PMC free article] [PubMed] [Google Scholar]
- 92. Roncero-Ramos I, Niquet-Léridon C, Strauch C, Monnier VM, Tessier FJ, Navarro MP, Delgado-Andrade C. An advanced glycation end product (AGE)-rich diet promotes Nε-carboxymethyl-lysine accumulation in the cardiac tissue and tendons of rats. J Agric Food Chem. 2014;62(25):6001–6. [DOI] [PubMed] [Google Scholar]
- 93. Nagai R, Horiuchi S, Unno Y. Application of monoclonal antibody libraries for the measurement of glycation adducts. Biochem Soc Trans. 2003;31(Pt 6):1438–40. [DOI] [PubMed] [Google Scholar]
- 94. Ikeda K, Higashi T, Sano H, Jinnouchi Y, Yoshida M, Araki T, Ueda S, Horiuchi S. N (epsilon)-(carboxymethyl)lysine protein adduct is a major immunological epitope in proteins modified with advanced glycation end products of the Maillard reaction. Biochemistry. 1996;35(24):8075–83. [DOI] [PubMed] [Google Scholar]
- 95. Makita Z, Vlassara H, Cerami A, Bucala R. Immunochemical detection of advanced glycosylation end products in vivo. J Biol Chem. 1992;267:5133–8. [PubMed] [Google Scholar]
- 96. Reddy S, Bichler J, Wells-Knecht KJ, Thorpe SR, Baynes JW. N epsilon-(carboxymethyl)lysine is a dominant advanced glycation end product (AGE) antigen in tissue proteins. Biochemistry. 1995;34(34):10872–8. [DOI] [PubMed] [Google Scholar]
- 97. Koito W, Araki T, Horiuchi S, Nagai R. Conventional antibody against Nepsilon-(carboxymethyl)lysine (CML) shows cross-reaction to Nepsilon-(carboxyethyl)lysine (CEL): immunochemical quantification of CML with a specific antibody. J Biochem (Tokyo). 2004;136(6):831–7. [DOI] [PubMed] [Google Scholar]
- 98. Kinsky OR, Hargraves TL, Anumol T, Jacobsen NE, Dai J, Snyder SA, Monks TJ, Lau SS. Metformin scavenges methylglyoxal to form a novel imidazolinone metabolite in humans. Chem Res Toxicol. 2016;29(2):227–34. [DOI] [PMC free article] [PubMed] [Google Scholar]
- 99. Delpierre G, Vertommen D, Communi D, Rider MH, Van Schaftingen E. Identification of fructosamine residues deglycated by fructosamine-3-kinase in human hemoglobin. J Biol Chem. 2004;279(26):27613–20. [DOI] [PubMed] [Google Scholar]
- 100. Wang F, Zhao Y, Niu Y, Wang C, Wang M, Li Y, Sun C. Activated glucose-6-phosphate dehydrogenase is associated with insulin resistance by upregulating pentose and pentosidine in diet-induced obesity of rats. Horm Metab Res. 2012;44(13):938–42. [DOI] [PubMed] [Google Scholar]
- 101. Barton S, Navarro SL, Buas MF, Schwarz Y, Gu H, Djukovic D, Raftery D, Kratz M, Neuhouser ML, Lampe JW. Targeted plasma metabolome response to variations in dietary glycemic load in a randomized, controlled, crossover feeding trial in healthy adults. Food Funct. 2015;6(9):2949–56. [DOI] [PMC free article] [PubMed] [Google Scholar]
- 102. Beckmann M, Joosen AM, Clarke MM, Mugridge O, Frost G, Engel B, Taillart K, Lloyd AJ, Draper J, Lodge JK. Changes in the human plasma and urinary metabolome associated with acute dietary exposure to sucrose and the identification of potential biomarkers of sucrose intake. Mol Nutr Food Res. 2015;60(2):444–57. [DOI] [PubMed] [Google Scholar]
- 103. Johansson-Persson A, Barri T, Ulmius M, Önning G, Dragsted LO. LC-QTOF/MS metabolomic profiles in human plasma after a 5-week high dietary fiber intake. Anal Bioanal Chem. 2013;405(14):4799–809. [DOI] [PubMed] [Google Scholar]
- 104. Lankinen M, Schwab U, Seppänen‐Laakso T, Mattila I, Juntunen K, Mykkänen H, Poutanen K, Gylling H, Orešič M. Metabolomic analysis of plasma metabolites that may mediate effects of rye bread on satiety and weight maintenance in postmenopausal women. J Nutr. 2010;141(1):31–6. [DOI] [PubMed] [Google Scholar]
- 105. Rasmussen LG, Winning H, Savorani F, Ritz C, Engelsen SB, Astrup A, Larsen TM, Dragsted LO. Assessment of dietary exposure related to dietary GI and fibre intake in a nutritional metabolomic study of human urine. Genes Nutr. 2011;7(2):281–93. [DOI] [PMC free article] [PubMed] [Google Scholar]
- 106. Gu Y, Yu H, Li Y, Ma X, Lu J, Yu W, Xiao Y, Bao Y, Jia W. Beneficial effects of an 8-week, very low carbohydrate diet intervention on obese subjects. Evid Based Complement Alternat Med. 2013;2013:1–8. [DOI] [PMC free article] [PubMed] [Google Scholar]
- 107. Kane MD, Breznak JA. Effect of host diet on production of organic acids and methane by cockroach gut bacteria. Appl Environ Microbiol. 1991;57(9):2628–34. [DOI] [PMC free article] [PubMed] [Google Scholar]
- 108. Holmes E, Loo RL, Stamler J, Bictash M, Yap IKS, Chan Q, Ebbels T, De Iorio M, Brown IJ, Veselkov KA et al.. Human metabolic phenotype diversity and its association with diet and blood pressure. Nature. 2008;453(7193):396–400. [DOI] [PMC free article] [PubMed] [Google Scholar]
- 109. Johansson-Persson A, Ulmius M, Cloetens L, Karhu T, Herzig KH, Onning G. A high intake of dietary fiber influences C-reactive protein and fibrinogen, but not glucose and lipid metabolism, in mildly hypercholesterolemic subjects. Eur J Nutr. 2014;53(1):39–48. [DOI] [PubMed] [Google Scholar]
- 110. Ceriello A, Colagiuri S. International Diabetes Federation guideline for management of postmeal glucose: a review of recommendations. Diabet Med. 2008;25(10):1151–6. [DOI] [PMC free article] [PubMed] [Google Scholar]
- 111. Livesey G, Taylor R, Livesey H, Liu S. Is there a dose-response relation of dietary glycemic load to risk of type 2 diabetes? Meta-analysis of prospective cohort studies. Am J Clin Nutr. 2013;97(3):584–96. [DOI] [PMC free article] [PubMed] [Google Scholar]
- 112. Russell WR, Baka A, Bjorck I, Delzenne N, Gao D, Griffiths HR, Hadjilucas E, Juvonen K, Lahtinen S, Lansink M et al.. Impact of diet composition on blood glucose regulation. Crit Rev Food Sci Nutr. 2016;56(4):541–90. [DOI] [PubMed] [Google Scholar]
- 113. Santos-Oliveira R, Purdy C, da Silva MP, dos Anjos Carneiro-Leao AM, Machado M, Einarson TR. Haemoglobin A1c levels and subsequent cardiovascular disease in persons without diabetes: a meta-analysis of prospective cohorts. Diabetologia. 2011;54(6):1327–34. [DOI] [PubMed] [Google Scholar]
- 114. Wahid ST, Sultan J, Handley G, Saeed BO, Weaver JU, Robinson AC. Serum fructosamine as a marker of 5-year risk of developing diabetes mellitus in patients exhibiting stress hyperglycaemia. Diabet Med. 2002;19(7):543–8. [DOI] [PubMed] [Google Scholar]
- 115. Peddinti G, Cobb J, Yengo L, Froguel P, Kravic J, Balkau B, Tuomi T, Aittokallio T, Groop L. Early metabolic markers identify potential targets for the prevention of type 2 diabetes. Diabetologia. 2017;60(9):1740–50. [DOI] [PMC free article] [PubMed] [Google Scholar]
- 116. Chiu CJ, Rabbani N, Rowan S, Chang ML, Sawyer S, Hu FB, Willett W, Thornalley PJ, Anwar A, Bar L et al.. Studies of advanced glycation end products and oxidation biomarkers for type 2 diabetes. Biofactors. 2018;44(3):281–8. [DOI] [PMC free article] [PubMed] [Google Scholar]
Associated Data
This section collects any data citations, data availability statements, or supplementary materials included in this article.