

Summary
Duchenne muscular dystrophy is primarily characterized by progressive muscle wasting due to deficiency in the membrane cytoskeletal protein dystrophin but is also associated with body-wide cellular disturbances in a variety of non-muscle tissues. In this study, we have focused on the comparative proteomic analysis of the spleen and established considerable changes in this crucial secondary lymphoid organ from the genetic mdx-4cv mouse model of dystrophinopathy. An apparent short isoform of dystrophin and associated glycoproteins were identified in spleen by mass spectrometry but appear not be affected in muscular dystrophy. In contrast, the mdx-4cv spleen showed significant proteome-wide changes in other protein species that are involved in metabolism, signaling, and cellular architecture. Since the spleen plays a key role in the immune response, these proteomic alterations may reflect pathophysiological cross talk between the lymphoid system and dystrophic muscles, which are affected by both fiber degeneration and inflammation.
Subject Areas: Disease, Pathophysiology, Proteomics
Graphical Abstract
Highlights
-
•
Biochemical and proteomic analyses have identified dystrophin isoform Dp71 in spleen
-
•
Normal Dp71 levels were found in the spleen of the mdx-4cv model of dystrophinopathy
-
•
The enzymes TGM2 and MMP-9 are drastically increased in mdx-4cv spleen
-
•
Apolipoproteins ApoE and ApoB are greatly reduced in mdx-4cv spleen
Disease; Pathophysiology; Proteomics
Introduction
The neuromuscular disorder Duchenne muscular dystrophy is due to primary abnormalities in the DMD gene (Guiraud et al., 2015), which encodes several different isoforms of the protein dystrophin (Muntoni et al., 2003). Large-scale and antibody-based surveys of the tissue-specific presence of individual proteins provide excellent information on the distribution of protein markers throughout the body (Thul and Lindskog, 2018). However, often the reliance on a single, albeit highly specific, antibody for antigen detection does not take into account the existence of multiple protein isoforms with greatly differing cellular expression patterns. This is especially apparent in the case of the extremely large 79 exon-spanning DMD gene, which contains seven promoters that drive the tissue-specific expression of various dystrophin isoforms of differing molecular mass (Muntoni et al., 2003). This includes three full-length isoforms of apparent 427 kDa, i.e., Dp427-M in contractile tissues, Dp427-B in the brain, and Dp427-P in Purkinje cells. Shorter dystrophin isoforms of approximately 116–260 kDa are represented by Dp116-S in Schwann cells, Dp140-B/K in brain and kidney, and Dp260-R in the retina. In addition, an ubiquitous proteoform named Dp71-G exists in the brain and various other tissues (Naidoo and Anthony, 2020).
Dystrophinopathies belong to a group of inherited degenerative diseases of muscles (Mercuri et al., 2019; Thompson et al., 2020) that are characterized by progressive changes in the skeletal musculature, including degeneration of contractile fibers, sterile inflammation, fatty tissue infiltration, and reactive myofibrosis (Allen et al., 2016; Dowling et al., 2020a; Shin et al., 2013; Smith and Barton, 2018; Tidball et al., 2018). The recent mass spectrometry-based proteomic profiling of the vastus lateralis muscle from patients with Duchenne muscular dystrophy has confirmed severe extracellular and cytoskeletal dysregulation in dystrophinopathy (Capitanio et al., 2020). Additional complications manifest themselves as metabolic abnormalities, hormonal disturbances, scoliosis, neuronal deficiencies, and late-onset cardio-respiratory impairments (Birnkrant et al., 2018; Meyers and Townsend, 2019; Saure et al., 2018). Thus, although X-linked muscular dystrophy is primarily a monogenetic disease of contractile tissues, the complexity of its secondary pathophysiology makes it a neuromuscular disorder with a high degree of vulnerability of other tissue and organ systems.
Animal models of Duchenne muscular dystrophy have been instrumental for studying the molecular and cellular details of progressive degeneration in dystrophin-deficient muscle tissues, as well as testing of novel experimental treatment strategies to counteract the dystrophic phenotype (McGreevy et al., 2015; Rodrigues et al., 2016; Wilson et al., 2017). One of the most frequently used models of dystrophinopathy is the mdx-23 mouse, which represents a naturally occurring mutant with a premature stop codon-inducing mutation in exon 23 of the DMD gene (Sicinski et al., 1989). Hence, in analogy to progressive forms of human dystrophinopathy, this animal model almost completely lacks the full-length dystrophin isoform Dp427-M (Partridge, 2013). An alternative mdx-type mouse model (mdx-4cv) was generated by chemical mutagenesis with N-ethyl-N-nitrosourea (Chapman et al., 1989) and resulted in a C to T transition at base 7,916 in exon 53, generating an ochre codon (Banks et al., 2010; Shin et al., 2011; Tichy and Mourkioti, 2017). Importantly, the mdx-4cv model is typified by an approximately 10-fold lower rate of dystrophin-positive revertant fibers as compared with the conventional mdx-23 mouse (Danko et al., 1992; Im et al., 1996; Judge et al., 2006). This feature of the genetic mouse model reflects more accurately the cellular characteristics of affected skeletal muscles from patients with Duchenne muscular dystrophy. Consequently the mdx-4cv musculature represents an attractive tissue source for the systematic evaluation of new therapeutic approaches, such as exon skipping following intramuscular injections of antisense oligomers (Mitrpant et al., 2009), viral vector injection into neonatal muscles for the stable restoration of dystrophin expression (Kimura et al., 2010), or CRISPR-Cas9-based dystrophin gene editing (Bengtsson et al., 2017).
Previous mass spectrometric investigations focusing on the mdx-4cv mouse have established differential changes in the tissue proteome from various skeletal muscles, the heart, the brain, the liver, and the kidney (Murphy et al., 2015, 2016; 2018a, 2019a; 2019b; Dowling et al., 2020b) and have identified elevated levels of biofluid-associated markers in saliva, serum, and urine (Murphy et al., 2017, 2018b; Gargan et al., 2020). In this study, we have extended the proteomic characterization of body-wide alterations in the mdx-4cv mouse model of dystrophinopathy to the spleen, a secondary lymphoid organ that consists of two main types of tissue, the blood-filled red pulp and the lymphatic white pulp (Mebius and Kraal, 2005). The main functions of the spleen include the removal of abnormal erythrocytes, antigen detection, and antibody production (Lewis et al., 2019). In dystrophic organisms with an almost complete loss of the full-length Dp427-M isoform of dystrophin, abnormalities in the spleen were previously reported to include morphological adaptations in relation to lymph nodes in the white pulp region of the mdx mouse spleen (Santos et al., 2013), as well as altered levels of splenic inflammatory monocytes and increased migration of immune cells from the splenic reservoir to injured dystrophic fibers (Farini et al., 2016; Giordano et al., 2015; Mojumdar et al., 2014, 2016; Ouisse et al., 2019; Rizzo et al., 2020).
The proteomic survey presented here has initially identified the experimentally assessable protein constituents of the mouse spleen with the help of an Orbitrap Fusion Tribrid mass spectrometer. The established splenic protein catalog was screened for the presence of markers of spleen function and the potential presence of dystrophin, which had previously been suggested by the RT-PCR analysis of dystrophin in non-muscle tissues (Tokarz et al., 1998), as well as the more widely distributed class of dystrophin-associated proteins. Comparative mass spectrometric analyses of wild-type versus mdx-4cv tissue extracts were then used to determine potential proteome-wide changes due to deficiency in dystrophin isoform Dp427-M. The proteomic findings suggest that a variety of metabolic and cellular processes are affected in the mdx-4cv spleen, which confirms the usefulness of this genetic mouse model for studying the complex pathology of Duchenne muscular dystrophy. A pathophysiological connection appears to exist between skeletal muscle wasting, which is characterized by progressive fiber degeneration and inflammation (Allen et al., 2016; Tidball et al., 2018), and alterations in the lymphoid system due to primary abnormalities in the dystrophin gene (Rizzo et al., 2020).
Results
In order to evaluate the complex pathogenesis of X-linked muscular dystrophy, this study has focused on the proteomic characterization of potential secondary effects in a non-muscle organ, the spleen, in the established mdx-4cv mouse model of dystrophinopathy. Prior to the comparative mass spectrometric analysis of this secondary lymphoid organ, the spleen proteome was evaluated for the presence of dystrophin and spleen marker proteins.
Mass Spectrometric Identification of the Splenic Isoform of Dystrophin
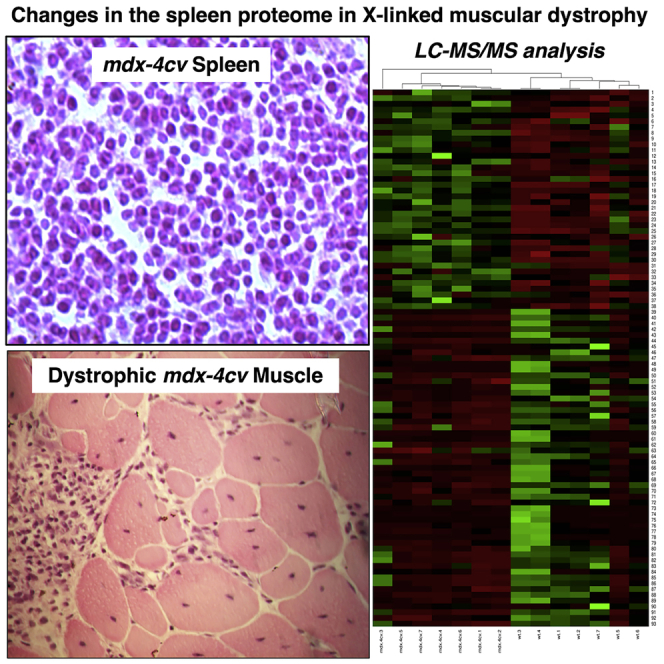
To overcome the restricted specificity of protein isoform coverage by antibody screening using standard immunochemical methodology (Thul and Lindskog, 2018), we have employed here a more sensitive proteomic screening approach with an Orbitrap Fusion Tribrid mass spectrometer for determining the potential presence of low levels of dystrophin in the spleen. As listed in Table 1, dystrophin and various dystrophin-associated proteins were clearly identified by this method, including an apparent short isoform of dystrophin, dystroglycan, beta-sarcoglycan, delta-sarcoglycan, epsilon-sarcoglycan, alpha-dystrobrevin, alpha-1-syntrophin, and beta-1-syntrophin. Dystrophin was recognized by six unique peptides, and these sections of the dystrophin sequence clearly aligned with the domain of the dystrophin protein that is close to the carboxy terminus, as shown in Figures 1A and 1B. Immunoblotting indicated that the expression of this short spleen-associated isoform of dystrophin is not affected in dystrophinopathy (Figures 1C and 1D), but the full-length Dp427-M isoform of dystrophin was clearly shown to be absent from mdx-4cv gastrocnemius muscle, as illustrated in Figures 2C–2E. The histological staining of mdx-4cv muscle depicts the typical hallmarks of X-linked muscular dystrophy, including variations in fiber diameter, a high degree of central nucleation, fibrosis, and inflammation (Figures 2A and 2B).
Table 1.
Proteomic Identification of Dystrophin and Dystrophin-Associated Proteins in Mouse Spleen
| Accession | Protein | Gene | Coverage (%) | Peptides | Unique Peptides | Molecular Mass (kDa) |
|---|---|---|---|---|---|---|
| P11531 | Dystrophin Dp71 | Dmd | 2 | 6 | 6 | 71 |
| Q62165 | Dystroglycan | Dag1 | 13 | 10 | 10 | 96.8 |
| P82349 | Beta-sarcoglycan | Sgcb | 5 | 1 | 1 | 34.9 |
| P82347 | Delta-sarcoglycan | Sgcd | 13 | 3 | 3 | 32.1 |
| O70258 | Epsilon-sarcoglycan | Sgce | 2 | 1 | 1 | 49.7 |
| Q9D2N4 | Alpha-dystrobrevin | Dtna | 6 | 2 | 2 | 84 |
| Q61234 | Alpha-1-syntrophin | Snta1 | 6 | 2 | 1 | 53.6 |
| Q99L88 | Beta-1-syntrophin | Sntb1 | 6 | 3 | 1 | 58 |
Figure 1.

Mass Spectrometric Identification of a Short Isoform of Dystrophin in Mouse Spleen
(A) Diagrammatic presentation of the DMD gene and its 7 promoters.
(B) Overview of unique peptides determined by the mass spectrometric analysis of 12-month-old mouse spleen and their position within the carboxy terminal region of the dystrophin protein sequence
(C and D) Comparative immunoblot analysis of the apparent spleen isoform Dp71 of dystrophin in wild-type versus mdx-4cv preparations. Lanes 1 and 2 contain wild-type and mdx-4cv specimens, respectively (C). In (D) the box plots of the immunoblot analysis are shown (Mann-Whitney U test; n = 5; none significant). The value of molecular mass standards (x10−3 kDa) is marked on the left side of the gel. A representative protein gel of spleen extracts used to produce nitrocellulose replicas is shown in Figure 7A.
Figure 2.

Histological and Immunofluorescence Microscopical Characterization of Skeletal Muscle from the mdx-4cv Mouse Model of Duchenne Muscular Dystrophy
(A–D) Shown are transverse cryosections of wild-type (wt) (A and C) and mdx-4cv (B and D) gastrocnemius muscle stained with hematoxylin and eosin (H&E) (A and B) and labeled with antibodies to the full-length Dp427 isoform of dystrophin (C and D). In (E) the analysis of immunofluorescence intensities is shown (unpaired Student's t test; mean values ± SEM; n = 4; ∗∗p < 0.01). Dystrophic muscle fibers show abnormal fiber diameters, central nucleation, cellular degeneration, and inflammation, as well as the almost complete loss of dystrophin. Scale bar, 50 μm.
Mass Spectrometric Profiling of the Mouse Spleen Proteome
Prior to carrying out a comprehensive proteome-wide comparison between wild-type and mdx-4cv spleen, it was essential to first establish how well the chosen proteomic approach covered the accessible splenic protein constituents using total tissue extracts. The biochemical cataloging of 12-month-old mouse spleen with the help of an Orbitrap Fusion Tribrid mass spectrometer resulted in the identification of 5,688 splenic protein species. This table was deposited as a supplementary multi-consensus file to the Open Science Framework repository under the following link: https://osf.io/f85ve/. In addition, individual files include data from the analysis of 14 separate mass spectrometric sample runs (representing 7 biological repeats of wild-type spleen preparations and 7 biological repeats of mdx-4cv spleen preparations, which were also deposited to the OSF entry “f85ve”) and consists of high-confidence peptides that were filtered based on Xcorr values. Importantly, a wide range of spleen-associated proteins were confirmed to be present in the examined tissue extracts.
Figure 3 shows a pie chart that summarizes the results from the bioinformatic PANTHER analysis of protein families that were mass spectrometrically identified in mouse spleen preparations. Protein classes included a variety of enzyme families, such as hydrolases, oxidoreductases, and transferases, as well as enzyme modulators, nucleic acid-binding proteins, transcription factors, transporters, and cytoskeletal components. The identification of proteins by the highest percent of sequence coverage agreed with the involvement of the spleen with the removal of abnormal erythrocytes and the immune system. Spleen-associated proteins with a protein sequence coverage above 90% included hemoglobin subunit beta-1 (P02088), hemoglobin subunit beta-2 (P02089), and the immunoglobulin Ig kappa chain (P01654). Splenic proteins that were identified by more than 80 peptides included the crucial cytoskeletal proteins filamin, plectin, talin, myosin-9, myosin-11, dynein heavy chain, erythrocytic alpha/beta spectrin, and non-erythrocytic alpha/beta spectrin, as well as prolow-density lipoprotein receptor-related protein 1 and basement membrane-specific heparan sulfate proteoglycan core protein.
Figure 3.

Proteomic Profiling of the Mouse Spleen
Shown is the result of the bioinformatic PANTHER analysis of the distribution of protein classes within the accessible proteome from 12-month-old mouse spleen, as determined by LC-MS/MS analysis.
Of note, the proteomic survey of mouse spleen included the identification of major types of splenic receptors, enzymes, and lymphoid proteins, such as cell surface antigens. The spleen marker named CD5 antigen-like protein, which was previously shown to be one of the most highly expressed splenic proteins (Uhlén et al., 2015), was clearly identified as CD5L protein of 38.8 kDa (Q9QWK4; 47% coverage; 14 unique peptides). Other major spleen components that were covered by the mass spectrometric survey included the spleen-associated tyrosine kinase SYK of 71.3 kDa (P48025; 56% coverage; 25 unique peptides), the tyrosine-protein phosphatase non-receptor type substrate 1 SIRPA of 56.4 kDa (P97797; 20% coverage; 7 unique peptides), the abundant spleen marker protein FH1/FH2 domain-containing protein FHOD1 of 129.5 kDa (Q6P9Q4; 19% coverage; 17 unique peptides), the scavenger receptor stabilin STAB2 of 277.3 kDa (Q8R4U0; 20% coverage; 32 unique peptides), CD81 antigen of 25.8 kDa (P35762; 31% coverage; 4 unique peptides), CD82 antigen of 29.6 kDa (P40237; 20% coverage; 5 unique peptides), B-cell receptor CD22 of 96.5 kDa (P35329; 31% coverage; 17 unique peptides), B-lymphocyte antigen CD20 of 31.9 kDa (P19437; 29% coverage; 8 unique peptides), CD209 antigen-like protein B of 37.1 kDa (Q8CJ91; 38% coverage; 10 unique peptides), and CD2-associated protein of 70.4 kDa (Q9JLQ0; 22% coverage; 11 unique peptides).
The screening of the experimentally accessible mouse spleen proteome revealed the coverage of major protein constituents belonging to the family of “classical plasma proteins” (Anderson and Anderson, 2002), as listed in Table 2, including serum albumin; complement factors H, C3, C4-B, C5, C8, and C9; inter alpha-trypsin inhibitor heavy chains 4, H1, H2, and H3; murinoglobulin; haptoglobin; serotransferrin; ferritin light and heavy chains; ceruloplasmin; plasminogen; the alpha, beta, and gamma chains of fibrinogen; plasma kallikrein and von Willebrand factor, as well as the alpha-2-HS, alpha-1B, and beta-2 glycoproteins (Geyer et al., 2017; Moulder et al., 2018; Schwenk et al., 2017). A large number of the crucial class of serum lipid-binding proteins was also covered by the proteomic analysis of the spleen. This included the apolipoproteins of classes A to M, such as apolipoproteins A-I, A-II, A-IV, A-V, B-100, C-I, C-III, C-IV, D, E, F, and M (Table 3). Serum proteins with relevance to muscle diagnostics that are generally defined as “tissue leak markers” (Anderson and Anderson, 2002) were also identified, including myoglobin of 17.1 kDa (P04247; 60% coverage; 10 unique peptides), the muscle-specific Tnnc2 isoform of troponin TnC of 18.1 kDa (P20801; 15% coverage; 1 unique peptide), and M-type creatine kinase of 43 kDa (P07310; 49% coverage; 15 unique peptides).
Table 2.
Proteomic Identification of Serum Protein Markers in Mouse Spleen
| Accession | Protein | Gene | Coverage (%) | Unique Peptides | Molecular Mass (kDa) |
|---|---|---|---|---|---|
| P07724 | Serum albumin | Alb | 73 | 47 | 68.6 |
| P06909 | Complement factor H | Cfh | 56 | 46 | 139 |
| P01027 | Complement C3 | C3 | 50 | 67 | 186.4 |
| P01029 | Complement C4-B | C4b | 22 | 28 | 192.8 |
| P06684 | Complement C5 | C5 | 22 | 27 | 188.8 |
| Q8K182 | Complement C8 alpha | C8a | 39 | 16 | 66j |
| P06683 | Complement C9 | C9 | 37 | 19 | 62 |
| A6X935 | Inter alpha-trypsin inhibitor, heavy chain 4 | Itih4 | 34 | 23 | 104.6 |
| Q61702 | Inter-alpha-trypsin inhibitor, heavy chain H1 | Itih1 | 26 | 16 | 101 |
| Q61703 | Inter-alpha-trypsin inhibitor, heavy chain H2 | Itih2 | 24 | 16 | 105.9 |
| Q61704 | Inter-alpha-trypsin inhibitor, heavy chain H3 | Itih3 | 13 | 8 | 99.3 |
| P28665 | Murinoglobulin-1 | Mug1 | 38 | 43 | 165.2 |
| Q61646 | Haptoglobin | Hp | 35 | 11 | 38.7 |
| Q921I1 | Serotransferrin | Tf | 61 | 48 | 76.7 |
| P09528 | Ferritin heavy chain | Fth1 | 70 | 14 | 21.1 |
| P29391 | Ferritin light chain 1 | Ftl1 | 66 | 12 | 20.8 |
| Q61147 | Ceruloplasmin | Cp | 34 | 28 | 121.1 |
| P20918 | Plasminogen | Plg | 62 | 33 | 90.7 |
| E9PV24 | Fibrinogen alpha chain | Fga | 39 | 19 | 87.4 |
| Q8K0E8 | Fibrinogen beta chain | Fgb | 69 | 33 | 54.7 |
| Q8VCM7 | Fibrinogen gamma chain | Fgg | 64 | 23 | 49.4 |
| P26262 | Plasma kallikrein | Klkb1 | 12 | 6 | 71.3 |
| Q8CIZ8 | von Willebrand factor | Vwf | 27 | 51 | 309.1 |
| P29699 | Alpha-2-HS-glycoprotein | Ahsg | 46 | 10 | 37.3 |
| Q19LI2 | Alpha-1B-glycoprotein | A1bg | 27 | 11 | 56.5 |
| Q01339 | Beta-2-glycoprotein 1 | Apoh | 46 | 16 | 38.6 |
Table 3.
Proteomic Identification of Apolipoproteins in Mouse Spleen
| Accession | Protein | Gene | Coverage (%) | Unique Peptides | Molecular Mass (kDa) |
|---|---|---|---|---|---|
| Q00623 | Apolipoprotein A-I | Apoa1 | 53 | 19 | 30.6 |
| P09813 | Apolipoprotein A-II | Apoa2 | 49 | 6 | 11.3 |
| P06728 | Apolipoprotein A-IV | Apoa4 | 68 | 22 | 45 |
| Q8C7G5 | Apolipoprotein A-V | Apoa5 | 27 | 8 | 41.2 |
| E9Q414 | Apolipoprotein B-100 | Apob | 19 | 69 | 509.1 |
| P34928 | Apolipoprotein C-I | Apoc1 | 20 | 2 | 9.7 |
| P33622 | Apolipoprotein C-III | Apoc3 | 27 | 2 | 11 |
| Q61268 | Apolipoprotein C-IV | Apoc4 | 9 | 1 | 14.3 |
| P51910 | Apolipoprotein D | Apod | 6 | 1 | 21.5 |
| P08226 | Apolipoprotein E | Apoe | 63 | 20 | 35.8 |
| Q91V80 | Apolipoprotein F | Apof | 6 | 1 | 34.3 |
| Q9Z1R3 | Apolipoprotein M | Apom | 12 | 2 | 21.3 |
Proteomic Profiling of the mdx-4cv Spleen
The comparative mass spectrometric survey of wild-type versus mdx-4cv spleen extracts identified 10.93% change in protein constituents. Of these components, 93 protein species were identified by a coverage of their amino acid sequence by at least 2 peptides and a minimum fold change of 1.5. A reduced expression was found to occur in 55 proteins, and 38 proteins were shown to be increased in their abundance, as listed in Table 4 and Table 5, respectively. The tables with the findings from the comparative proteomic analysis provide information on accession number, protein name, gene symbol, number of unique peptides, confidence score, adjusted p value, and fold change. In addition to changed proteins that were identified by at least 2 unique peptides, another 159 decreased proteins and 145 increased proteins were identified by only 1 unique peptide (not shown). Owing to their low sequence coverage, these proteomic hits were not included in the subsequent bioinformatic analysis of the mdx-4cv spleen. The most decreased and the most increased spleen-associated proteins were identified as apolipoprotein B-100 (E9Q414) and protein-glutamine gamma-glutamyl-transferase TGM2 (P21981), respectively, in mdx-4cv preparations. The heatmap of the comparative mass spectrometric survey is provided in Figure 4 and summarizes the differential expression pattern of changed proteins in wild-type versus the mdx-4cv spleen.
Table 4.
Decreased Proteins in the mdx-4cv Spleen as Determined by LC-MS/MS Analysis
| Accession | Protein | Gene | Unique Peptides | Confidence Score | Adjusted p value | Max Fold Change |
|---|---|---|---|---|---|---|
| E9Q414 | Apolipoprotein B-100 | Apob | 2 | 5.4283 | 0.0176 | 296.2 |
| A6X935 | Inter alpha-trypsin inhibitor, heavy chain 4 | Itih4 | 2 | 4.6726 | 0.0172 | 163.3 |
| Q91ZX7 | Prolow-density lipoprotein receptor-related protein 1 | Lrp1 | 2 | 4.9936 | 0.0453 | 48.3 |
| P08226 | Apolipoprotein E | Apoe | 2 | 7.0306 | 0.0413 | 41.2 |
| Q91WT9 | Cystathionine beta-synthase | Cbs | 4 | 9.0211 | 0.0168 | 21.1 |
| P03987 | Ig gamma-3 chain C region | – | 5 | 13.0469 | 0.0168 | 20.3 |
| Q6P8U6 | Pancreatic triacylglycerol lipase | Pnlip | 2 | 4.9116 | 0.0285 | 15.3 |
| P28665 | Murinoglobulin-1 | Mug1 | 5 | 18.5175 | 0.0216 | 8.7 |
| P20918 | Plasminogen | Plg | 5 | 14.0486 | 0.0264 | 8.2 |
| P01027 | Complement C3 | C3 | 2 | 6.9290 | 0.0265 | 5.8 |
| Q8K0C5 | Zymogen granule membrane protein 16 | Zg16 | 2 | 4.7425 | 0.0205 | 5.3 |
| Q91X79 | Chymotrypsin-like elastase family member 1 | Cela1 | 2 | 6.6288 | 0.0255 | 5 |
| Q64285 | Bile salt-activated lipase | Cel | 2 | 4.0527 | 0.0213 | 4.4 |
| P32261 | Antithrombin-III | Serpinc1 | 4 | 13.3814 | 0.0174 | 4.2 |
| Q9D8U3 | Endoplasmic reticulum resident protein 27 | Erp27 | 2 | 3.8992 | 0.0173 | 4.2 |
| Q504N0 | Carboxypeptidase A2 | Cpa2 | 4 | 11.1796 | 0.0181 | 4 |
| Q9JK88 | Serpin I2 | Serpini2 | 6 | 15.7950 | 0.0174 | 3.7 |
| P07724 | Serum albumin | Alb | 3 | 9.5456 | 0.0140 | 3.7 |
| Q5BKQ4 | Inactive pancreatic lipase-related protein 1 | Pnliprp1 | 5 | 12.4300 | 0.0237 | 3.6 |
| P00688 | Pancreatic alpha-amylase | Amy2 | 5 | 15.8377 | 0.0175 | 3.5 |
| A6H584 | Collagen alpha-5(VI) chain | Col6a5 | 4 | 12.5493 | 0.0174 | 3.3 |
| Q61024 | Asparagine synthetase (glutamine-hydrolyzing) | Asns | 5 | 12.0815 | 0.0172 | 3.2 |
| Q7TPZ8 | Carboxypeptidase A1 | Cpa1 | 2 | 9.3357 | 0.0239 | 3 |
| Q9CR35 | Chymotrypsinogen B | Ctrb1 | 2 | 4.0493 | 0.0361 | 3 |
| D3Z6P0 | Protein disulfide-isomerase A2 | Pdia2 | 11 | 34.7523 | 0.0173 | 2.9 |
| P21614 | Vitamin D-binding protein | Gc | 4 | 10.5449 | 0.0298 | 2.9 |
| Q61838 | Pregnancy zone protein | Pzp | 11 | 30.1861 | 0.0268 | 2.8 |
| P15947 | Kallikrein-1 | Klk1 | 3 | 7.0787 | 0.0276 | 2.8 |
| P49290 | Eosinophil peroxidase | Epx | 5 | 13.9853 | 0.0169 | 2.7 |
| P07758 | Alpha-1-antitrypsin 1-1 | Serpina1 | 4 | 13.4458 | 0.0233 | 2.5 |
| P23953 | Carboxylesterase 1C | Ces1c | 3 | 10.9205 | 0.0292 | 2.5 |
| Q8VDJ3 | Vigilin | Hdlbp | 2 | 5.4235 | 0.0301 | 2.5 |
| P50172 | Corticosteroid 11-beta-dehydrogenase isozyme 1 | Hsd11b1 | 2 | 5.8113 | 0.0207 | 2.3 |
| Q921I1 | Serotransferrin | Tf | 9 | 25.5997 | 0.0268 | 2.2 |
| Q00897 | Alpha-1-antitrypsin 1-4 | Serpina1d | 3 | 9.79536 | 0.0314 | 2 |
| Q64511 | DNA topoisomerase 2-beta | Top2b | 2 | 4.0629 | 0.0477 | 1.9 |
| P15626 | Glutathione S-transferase Mu 2 | Gstm2 | 3 | 10.3769 | 0.0340 | 1.8 |
| Q9D855 | Cytochrome b-c1 complex subunit 7 | Uqcrb | 3 | 8.1900 | 0.0126 | 1.8 |
| Q8R2E9 | ERO1-like protein beta | Ero1b | 2 | 4.7424 | 0.0168 | 1.8 |
| Q62087 | Serum paraoxonase/lactonase 3 | Pon3 | 4 | 13.6453 | 0.0167 | 1.7 |
| Q99K85 | Phosphoserine aminotransferase | Psat1 | 4 | 11.5566 | 0.0174 | 1.7 |
| Q9DBF1 | Alpha-aminoadipic semialdehyde dehydrogenase | Aldh7a1 | 4 | 10.4946 | 0.0308 | 1.7 |
| O08807 | Peroxiredoxin-4 | Prdx4 | 3 | 8.6493 | 0.0172 | 1.7 |
| P61620 | Protein transport protein Sec61 subunit alpha isoform 1 | Sec61a1 | 3 | 11.7206 | 0.0167 | 1.7 |
| Q06138 | Calcium-binding protein 39 | Cab39 | 2 | 5.5638 | 0.0338 | 1.7 |
| P10852 | 4F2 cell-surface antigen heavy chain | Slc3a2 | 4 | 12.8087 | 0.0122 | 1.6 |
| P09103 | Protein disulfide-isomerase | P4hb | 4 | 10.0713 | 0.0189 | 1.6 |
| P58252 | Elongation factor 2 | Eef2 | 3 | 9.4214 | 0.0256 | 1.6 |
| Q6ZWQ7 | Signal peptidase complex subunit 3 | Spcs3 | 2 | 4.2641 | 0.0210 | 1.6 |
| P35564 | Calnexin | Canx | 2 | 5.9499 | 0.0312 | 1.6 |
| Q78PY7 | Staphylococcal nuclease domain-containing protein 1 | Snd1 | 5 | 13.1260 | 0.0295 | 1.5 |
| O35855 | Branched-chain-amino-acid aminotransferase, mitochondrial | Bcat2 | 2 | 6.0829 | 0.0174 | 1.5 |
| Q64674 | Spermidine synthase | Srm | 2 | 5.6741 | 0.0172 | 1.5 |
| Q922Q8 | Leucine-rich repeat-containing protein 59 | Lrrc59 | 2 | 4.9835 | 0.0170 | 1.5 |
| Q922R8 | Protein disulfide-isomerase A6 | Pdia6 | 2 | 6.9604 | 0.0234 | 1.5 |
Table 5.
Increased Proteins in the mdx-4cv Spleen as Determined by LC-MS/MS Analysis
| Accession | Protein | Gene | Unique Peptides | Confidence Score | Adjusted p Value | Max Fold Change |
|---|---|---|---|---|---|---|
| P21981 | Protein-glutamine gamma-glutamyl-transferase 2 | Tgm2 | 2 | 4.74003 | 0.0124 | 3.8 |
| P01878 | Ig alpha chain C region | – | 2 | 5.5789 | 0.0332 | 2.9 |
| Q8CJ91 | CD209 antigen-like protein B | Cd209b | 2 | 5.1658 | 0.0152 | 2.5 |
| P41245 | Matrix metalloproteinase-9 | Mmp9 | 2 | 5.9333 | 0.0175 | 2.3 |
| P08071 | Lactotransferrin | Ltf | 15 | 49.8443 | 0.0136 | 2.1 |
| P54869 | Hydroxymethylglutaryl-CoA synthase, mitochondrial | Hmgcs2 | 3 | 7.7425 | 0.0130 | 2 |
| P21300 | Aldo-keto reductase family 1 member B7 | Akr1b7 | 2 | 5.8779 | 0.0183 | 2 |
| P50608 | Fibromodulin | Fmod | 2 | 4.9599 | 0.0190 | 1.9 |
| Q3UMY5 | Echinoderm microtubule-associated protein-like 4 | Eml4 | 2 | 6.1649 | 0.0120 | 1.9 |
| P82343 | N-acylglucosamine 2-epimerase | Renbp | 2 | 6.3056 | 0.0170 | 1.9 |
| O08692 | Neutrophilic granule protein | Ngp | 2 | 5.4646 | 0.0185 | 1.9 |
| P26039 | Talin-1 | Tln1 | 2 | 5.7934 | 0.0181 | 1.8 |
| Q9CWK8 | Sorting nexin-2 | Snx2 | 2 | 6.9348 | 0.0183 | 1.8 |
| Q8VEE1 | LIM and cysteine-rich domains protein 1 | Lmcd1 | 2 | 6.8011 | 0.0085 | 1.8 |
| P19070 | Complement receptor type 2 | Cr2 | 2 | 5.0366 | 0.0295 | 1.8 |
| P27870 | Proto-oncogene vav | Vav1 | 3 | 7.4085 | 0.0192 | 1.7 |
| Q9ES52 | Phosphatidylinositol 3,4,5-trisphosphate 5-phosphatase 1 | Inpp5d | 3 | 8.2105 | 0.0152 | 1.7 |
| Q8R1G6 | PDZ and LIM domain protein 2 | Pdlim2 | 2 | 6.4459 | 0.0286 | 1.7 |
| Q6P8X1 | Sorting nexin-6 | Snx6 | 2 | 6.9493 | 0.0176 | 1.7 |
| P49710 | Hematopoietic lineage cell-specific protein | Hcls1 | 2 | 6.3795 | 0.0295 | 1.7 |
| P63038 | 60 kDa heat shock protein, mitochondrial | Hspd1 | 2 | 4.9004 | 0.0312 | 1.7 |
| Q61823 | Programmed cell death protein 4 | Pdcd4 | 2 | 5.2918 | 0.0147 | 1.7 |
| Q6P4T2 | U5 small nuclear ribonucleoprotein 200 kDa helicase | Snrnp200 | 2 | 6.1287 | 0.0154 | 1.7 |
| Q62230 | Sialoadhesin | Siglec1 | 6 | 19.4232 | 0.0124 | 1.6 |
| Q8VCW8 | Medium-chain acyl-CoA ligase ACSF2, mitochondrial | Acsf2 | 5 | 16.0841 | 0.0118 | 1.6 |
| Q9QVP9 | Protein-tyrosine kinase 2-beta | Ptk2b | 3 | 11.6718 | 0.0265 | 1.6 |
| Q8K2T1 | NmrA-like family domain-containing protein 1 | Nmral1 | 3 | 9.4830 | 0.0122 | 1.6 |
| Q921T2 | Torsin-1A-interacting protein 1 | Tor1aip1 | 2 | 4.2835 | 0.0135 | 1.6 |
| Q3UP87 | Neutrophil elastase | Elane | 2 | 4.6109 | 0.0260 | 1.6 |
| Q99KQ4 | Nicotinamide phosphoribosyltransferase | Nampt | 2 | 6.6515 | 0.0164 | 1.6 |
| Q9QXS1 | Plectin | Plec | 11 | 34.4355 | 0.0152 | 1.5 |
| Q80SU7 | Gvin1 | Gvin1 | 4 | 12.9185 | 0.0293 | 1.5 |
| P05555 | Integrin alpha-M | Itgam | 4 | 11.3340 | 0.0157 | 1.5 |
| Q62261 | Spectrin beta chain, non-erythrocytic 1 | Sptbn1 | 3 | 10.1324 | 0.0265 | 1.5 |
| O70318 | Band 4.1-like protein 2 | Epb41l2 | 2 | 4.2166 | 0.0138 | 1.5 |
| P23475 | X-ray repair cross-complementing protein 6 | Xrcc6 | 2 | 6.1252 | 0.0180 | 1.5 |
| Q9CQE5 | Regulator of G-protein signaling 10 | Rgs10 | 2 | 5.1948 | 0.0124 | 1.5 |
| P55194 | SH3 domain-binding protein 1 | Sh3bp1 | 2 | 7.2682 | 0.0149 | 1.5 |
Figure 4.

Heatmap of the Comparative Proteomic Analysis of Wild-Type versus mdx-4cv Spleen
Shown are the findings from hierarchical clustering of the mean protein expression values of statistically significant differentially abundant spleen proteins.
The bioinformatic PANTHER and STRING analyses depicted in Figure 5 summarize the proteome-wide changes in the mdx-4cv spleen, as well as potentially altered protein-protein interaction patterns of changed spleen-associated proteins. Both considerable decreases and increases were observed for metabolic interconversion enzymes, such as hydrolases, ligases, lyases, oxidoreductases, and transferases. Striking increases included protein modifiers such as proteases, protein modulators such as protease inhibitors, and transfer carriers. In relation to altered protein interactions, especially striking is the apolipoprotein hub with ApoE and ApoB of reduced protein species. Immunofluorescence microscopy clearly confirmed the drastic reduction of ApoE in the mdx-4cv spleen (Figures 6E, 6F, and 6J) and indicated that the expression of the short spleen-associated isoform of dystrophin is not affected in dystrophinopathy (Figures 6C, 6D, and 6I). No major histological changes (Figures 6A and 6B) and comparable expression levels of the molecular chaperone HspB2 (Figures 6G, 6H, and 6K) were observed in the mdx-4cv spleen.
Figure 5.

Bioinformatic Analysis of Proteomic Changes in the mdx-4cv Spleen
Overview of the distribution of changed protein classes and potential protein-protein interaction patterns of decreased versus increased proteoforms in the spleen from the mdx-4cv mouse model of Duchenne muscular dystrophy, as determined by the bioinformatics software programs PANTHER (A) and STRING (B), respectively.
Figure 6.

Histological and Immunofluorescence Microscopical Characterization of the Spleen from the mdx-4cv Mouse Model of Duchenne Muscular Dystrophy
(A–H) Shown are transverse cryosections of wild-type (wt) (A, C, E, and G) and mdx-4cv (B, D, F, and H) spleen stained with hematoxylin and eosin (H&E) (A and B) and labeled with antibodies to dystrophin (Dys) (C and D), apolipoprotein ApoE (E and F), and the molecular chaperone HspB2 (G and H).
(I–K) Analysis of immunofluorescence intensities (unpaired Student's t test; mean values ± SEM; n = 4; ∗∗p < 0.01). Scale bar, 25 μm.
Potentially excreted forms of proteins were identified as transglutaminase 2 (protein-glutamine gamma-glutamyl-transferase TGM2) and matrix metalloproteinase MMP9. The protein band pattern of gel electrophoretically separated spleen samples did not show major differences between wild-type and mdx-4cv preparations (Figure 7A). However, the increased abundance of TGM2 and MMP9 in the mdx-4cv spleen was confirmed by immunoblotting (Figures 7B, 7C, 7E, and 7F). In contrast, the spleen-associated alpha-subunit of the Na+/K+-ATPase showed no major changes in its density in the dystrophic phenotype (Figures 7D and 7G).
Figure 7.

Immunoblot Analysis of the Spleen from the mdx-4cv Mouse Model of Duchenne Muscular Dystrophy
(A–D) Shown is a protein gel of wild-type (wt) versus mdx-4cv spleen samples (A) and identical nitrocellulose replicas labeled with an antibody to matrix metalloproteinase MMP9 (B), transglutaminase TGM2 (C), and Na+/K+-ATPase (D). Lanes 1 and 2 contain wild-type and mdx-4cv specimens, respectively.
(E–G) In panels (E–G) the box plots of the immunoblot analysis are shown (Mann-Whitney U test; n = 7; ∗p < 0.05; ∗∗p < 0.01). The values of molecular mass standards (x10−3 kDa) are marked on the left side of the gel and immunoblots.
Discussion
The mdx-4cv Mouse Model of Dystrophinopathy
Spontaneous or bioengineered mdx-type mouse models of dystrophinopathy have been widely used in muscular dystrophy research (Partridge, 2013; Wilson et al., 2017), and there are ongoing efforts to improve specific aspects of dystrophic mice to better mirror the human pathology (Yucel et al., 2018). The mdx-4cv model has been successfully employed for the evaluation of experimental therapeutic approaches for the restoration of dystrophin (Mitrpant et al., 2009; Kimura et al., 2010; Bengtsson et al., 2017) and the systematic identification of novel biomarker candidates to improve differential diagnosis, prognosis, and therapy monitoring (Hathout et al., 2014; Dowling et al., 2019). The cell biological characterization of the mdx-4cv mouse, which was generated by chemical mutagenesis (Chapman et al., 1989) and is characterized by a 10-fold lower rate of Dp427-positive revertant muscle fibers as compared with the naturally occurring mdx-23 mouse (Danko et al., 1992), has established distinct pathological alterations throughout the lifetime of this animal model (Latroche et al., 2015). This includes varying degrees of fiber degeneration, reactive myofibrosis, sterile inflammation, and metabolic disturbances in limb muscles (Murphy et al., 2019a), the diaphragm (Murphy et al., 2019b), and the heart (Murphy et al., 2016), as well as proteome-wide alterations in the brain (Murphy et al., 2015), the liver (Murphy et al., 2018a), and the kidney (Dowling et al., 2020b). The concentration of distinct protein biomarkers is also markedly affected in mdx-4cv serum (Murphy et al., 2017), saliva (Murphy et al., 2018b), and urine (Gargan et al., 2020). These complex and body-wide changes make the mdx-4cv mouse a suitable model system to study the molecular pathogenesis of dystrophinopathy.
The Spleen Proteome and Muscular Dystrophy
The comparative mass spectrometric analysis presented in this report is based on an excellent coverage of the experimentally accessible spleen proteome in wild-type versus mdx-4cv extracts. Previous large-scale surveys using both systematic mass spectrometric and antibody-based methodology have established a wide range of spleen-associated proteins (Andersson et al., 2014; Dudekula and Le Bihan, 2016; Goltsev et al., 2018; Thul and Lindskog, 2018; Uhlén et al., 2015; Wilhelm et al., 2014). Many of these key marker proteins of the spleen were identified by a high degree of sequence coverage by unique peptides in this study. In agreement with established splenic changes in dystrophic animal models of Duchenne muscular dystrophy, such as morphological adaptations in the white pulp domain of the spleen (Santos et al., 2013) and altered levels of immune cells in the spleen and enhanced migration of inflammatory cells from the splenic reservoir to dystrophic muscle tissues (Farini et al., 2016; Giordano et al., 2015; Mojumdar et al., 2014, 2016; Ouisse et al., 2019), this investigation has established considerable effects on the spleen proteome owing to deficiency in the full-length dystrophin isoform Dp427-M. Since the spleen acts as a dominant reservoir for inflammatory cells (Ingersoll et al., 2011) and splenic monocytes were recently shown to play an important role during chronic inflammation of dystrophic fibers (Rizzo et al., 2020), the novel proteomic findings are in agreement with the pathophysiological idea of a connection between the lymphoid system and dystrophic muscles with an inflammatory phenotype (Villalta et al., 2015; Tidball et al., 2018).
Preserved Expression of a Short Isoform of Dystrophin in the mdx-4cv Spleen
X-linked muscular dystrophy is a complex neuromuscular disorder that is characterized by necrosis, myofibrosis, and inflammation in the skeletal musculature, as well as late-onset cardiomyopathy, respiratory impairments, neurological deficiencies, scoliosis, and metabolic disturbances (Mercuri et al., 2019; Thompson et al., 2020). The neuromuscular symptoms are due to primary abnormalities in the extremely large DMD gene, which encodes several isoforms of the protein dystrophin (Muntoni et al., 2003). The proteomic survey of the spleen presented here has identified unique peptides that belong to the dystrophin protein sequence. This not-well-characterized spleen-associated proteoform of the dystrophin protein is most likely a short version of the DMD gene product, such as the ubiquitously expressed Dp71-G isoform (Tokarz et al., 1998). The proteomic analysis found the presence of this dystrophin isoform in all analyzed spleen samples with high confidence; thus, the nonsense mutation in exon 53 of the DMD gene does not appear to affect the production of this short dystrophin isoform in the mdx-4cv mouse (Im et al., 1996). However, immunofluorescence microscopy clearly showed that the full-length Dp427-M isoform of dystrophin is absent from dystrophic mdx-4cv gastrocnemius muscle fibers (Murphy et al., 2019a), confirming the dystrophic phenotype.
Proteomic Identification of Dystrophin-Associated Proteins in the Spleen
The full-length isoform of dystrophin, Dp427-M, functions in contractile fibers as a membrane cytoskeletal component and forms a supramolecular assembly with a variety of sarcolemma-associated proteins. The dystrophin core complex, consisting of Dp427-M, dystroglycans, sarcoglycans, dystrobrevins, syntrophins, and sarcospan, links the extracellular matrix component laminin to the intracellular actin cytoskeleton (Ohlendieck, 1996). This trans-plasmalemmal structure plays a key role in lateral force transmission and the stabilization of the fiber surface during excitation-contraction-relaxation cycles (Murphy and Ohlendieck, 2015). In dystrophinopathy, the almost complete loss of Dp427-M causes a drastic reduction in the members of the dystrophin-associated glycoprotein complex, which in turn triggers sarcolemmal micro-rupturing and calcium-induced proteolytic degradation (Guiraud et al., 2015). Here, we have extended the characterization of dystrophin-associated glycoproteins to the spleen and have identified by mass spectrometry the presence of dystroglycan, sarcoglycans, dystrobrevin, and syntrophins in this crucial secondary lymphoid organ.
Drastic Reduction of Apolipoproteins and Related Serum Proteins in the mdx-4cv Spleen
A variety of complex changes in the immunobiology of dystrophic skeletal muscles have been established that might be reflected by variations in the lymphoid system (Villalta et al., 2015; Lozanoska-Ochser et al., 2018; Tidball et al., 2018). The most striking finding of this investigation is the drastic reduction in a variety of serum proteins in the mdx-4cv spleen. This includes proteins that are involved in lipid transport and metabolism (apolipoproteins ApoB-100 and ApoE, lipoprotein receptor Lrp1, and various lipases), the complement system (complement C3), metabolite transportation (albumin), digestion (amylase), and factors involved in the acute response and inflammation (kallikrein, inter alpha-trypsin inhibitor). Spleen-associated proteins with a drastic reduction in the mdx-4cv mouse model were previously shown to be also reduced in mdx-4cv serum (Murphy et al., 2017). This included the most significantly decreased protein species in the mdx-4cv spleen, apolipoprotein B-100, as well as antithrombin-III, complement C3, alpha-1-antitrypsin, murinoglobulin-1, plasminogen, inter-alpha-trypsin inhibitor heavy chain, chymotrypsin-like elastase, vitamin D-binding protein, and serotransferrin.
Apolipoproteins are crucial plasma proteins involved in the regulation of lipid homeostasis, and their concentration is a good indicator of the metabolic status of the organism (Geyer et al., 2017). Surprisingly, in the ApoE-null mdx mouse reduced atherosclerotic plaque formation was found, as well as decreased numbers of CD3+ cells in the spleen (Shami et al., 2015). In the case of the mdx-4cv model of dystrophinopathy, the reduced abundance of these plasma proteins in the spleen could reflect their lower concentration in the circulatory system. Impaired blood flow due to weakened cardiac output of the dystrophin-deficient heart might also be a crucial factor that causes a decrease in plasma components in the mdx-4cv spleen. In dystrophinopathy, late-onset cardiomyopathy causes cardiac weakness (Finsterer and Cripe, 2014) and this is reflected by drastic proteome-wide changes especially at the level of metabolic enzymes (Murphy et al., 2016). This cardiac impairment could cause a decreased rate of circulation of blood and concomitant chronic lack of proper supply of oxygen and nutrients to peripheral organs. The proteomic findings on the mdx-4cv spleen presented here agrees with this pathophysiological concept.
Increased Transglutaminase TGM2 and Matrix Metalloproteinase MMP9 in the mdx-4cv Spleen
The most increased protein in the mdx-4cv spleen was identified as protein-glutamine gamma-glutamyl-transferase TGM2, also more commonly referred to as transglutaminase 2, which is a multi-functional enzyme that mediates the cross-linking of proteins and catalyzes the conjugation of polyamines to proteins (Beninati et al., 2017). In addition, more recently transglutaminase 2 was shown to be intrinsically involved in the maintenance of proteostasis (D'Eletto et al., 2019). Since chronic cellular stress results in the increased occurrence of abnormal protein folding or detrimental protein aggregation, the regulation of chaperone function is upregulated under dystrophic conditions (Doran et al., 2006; Brinkmeier and Ohlendieck, 2014). Thus, the elevated levels of transglutaminase TGM2 might be involved in a key aspect of the regulation of protein homeostasis in the stressed mdx-4cv spleen. The increased abundance of the matrix metalloproteinase MMP9 agrees with the findings from the previous screening of serum from the mdx mouse and patients with Duchenne muscular dystrophy for minimally invasive biomarker candidates (Nadarajah et al., 2011; Hathout et al., 2014; Anaya-Segura et al., 2015). The serum-associated proteoform of this member of the large family of matrix metalloproteinases was shown to be increased significantly in muscular dystrophy, which might explain its elevated levels in the mdx-4cv spleen. Although MMP9 probably plays a differential role during the progression of muscle degeneration (Shiba et al., 2015), its primary effect in muscular dystrophy appears to be the promotion of inflammation, tissue remodeling, and reactive myofibrosis (Kherif et al., 1999; Hindi et al., 2013; Shin et al., 2013). This confirms MMP9 as a good biomarker candidate for secondary changes in muscular dystrophy due to sterile inflammation and fibrotic changes.
Novel Biomarker Candidates of Muscular Dystrophy-Associated Changes in the Spleen
In conclusion, although the expression levels of a short spleen-associated dystrophin isoform and its associated proteins do not appear to be majorly affected in muscular dystrophy, the absence of the full-length dystrophin isoform in contractile tissues seems to trigger secondary effects in the lymphoid system. This includes a drastic reduction in the apolipoproteins ApoB-100 and ApoE and a concomitant increase in the enzyme protein-glutamine gamma-glutamyl-transferase TGM2 and the matrix metalloproteinase MMP9, which might be useful candidates as novel biomarkers of dystrophinopathy-related changes in the spleen (Dowling et al., 2019; Al-Khalili Szigyarto, 2020). The proteomic findings suggest that pathophysiological cross talk and/or anatomical interconnectivity affects the spleen in muscular dystrophy, which substantiates the appropriateness of the mdx-4cv mouse model for studying secondary changes in non-muscle tissues in dystrophinopathy.
Limitations of the Study
In this report, we have characterized for the first time the secondary impact of dystrophin deficiency on the spleen and established considerable proteome-wide changes in this lymphoid organ. However, the study was carried out with a genetic animal model of dystrophinopathy, the mdx-4cv mouse, which shows a milder pattern of neuromuscular degeneration in most skeletal muscles as compared with patients with Duchenne muscular dystrophy. It will therefore be crucial to extend these studies in the future to the evaluation of secondary abnormalities in X-linked muscular dystrophy to patient specimens. Although comparative proteomics is an excellent bioanalytical approach to determine systematic changes in the dystrophic phenotype, mass spectrometric lists of altered protein expression levels do neither give detailed information on the pathobiochemical time course of cellular alterations nor provide a deep mechanistic understanding of disease progression. Thus, based on the comparative proteomic data supplied in this report, it will be crucial to further study the underlying disturbances that cause proteome-wide changes in the spleen in association with dystrophinopathy.
Resource Availability
Lead Contact
For further information, requests should be directed to the Lead Contact: Kay Ohlendieck (kay.ohlendieck@mu.ie).
Materials Availability
This study did not generate new unique reagents.
Data and Code Availability
The proteomic datasets from the mass spectrometric analysis of 14 separate spleen sample runs have been deposited to the Open Science Framework repository as OSF entry “f85ve” under the following link: https://osf.io/f85ve/. This link also features a multi-consensus file of the proteomic cataloging of mouse spleen with the help of an Orbitrap Fusion Tribrid mass spectrometer.
Methods
All methods can be found in the accompanying Transparent Methods supplemental file.
Acknowledgments
Research was supported by the Kathleen Lonsdale Institute for Human Health Research at Maynooth University. The Orbitrap Fusion Tribrid mass spectrometer was funded under a Science Foundation Ireland Infrastructure Award to Dublin City University (SFI 16/RI/3701). We also thank Drs. Hemmen Sabir, Stephan Baader and Jens Reimann, University of Bonn, for their support of this project.
Author Contributions
P.D., D.S., and K.O. initiated the project and designed the research. S.G. and P.D. performed the biochemical experiments and analyzed the data. M.Z. carried out the preparation of tissue samples and cell biological analysis. M.H. and P.M. performed the mass spectrometric and bioinformatic analysis. All authors were involved in the writing and final editing of the manuscript.
Declaration of Interests
The authors declare no competing interests.
Published: September 25, 2020
Footnotes
Supplemental Information can be found online at https://doi.org/10.1016/j.isci.2020.101500.
Supplemental Information
References
- Al-Khalili Szigyarto C. Duchenne Muscular Dystrophy: recent advances in protein biomarkers and the clinical application. Expert Rev. Proteomics. 2020;17:365–375. doi: 10.1080/14789450.2020.1773806. [DOI] [PubMed] [Google Scholar]
- Allen D.G., Whitehead N.P., Froehner S.C. Absence of dystrophin disrupts skeletal muscle signaling: roles of Ca2+, reactive oxygen species, and nitric oxide in the development of muscular dystrophy. Physiol. Rev. 2016;96:253–305. doi: 10.1152/physrev.00007.2015. [DOI] [PMC free article] [PubMed] [Google Scholar]
- Anaya-Segura M.A., García-Martínez F.A., Montes-Almanza L.A., Díaz B.G., Avila-Ramírez G., Alvarez-Maya I., Coral-Vazquez R.M., Mondragón-Terán P., Escobar-Cedillo R.E., García-Calderón N. Non-invasive biomarkers for duchenne muscular dystrophy and carrier detection. Molecules. 2015;20:11154–11172. doi: 10.3390/molecules200611154. [DOI] [PMC free article] [PubMed] [Google Scholar]
- Anderson N.L., Anderson N.G. The human plasma proteome: history, character, and diagnostic prospects. Mol. Cell. Proteomics. 2002;1:845–867. doi: 10.1074/mcp.r200007-mcp200. [DOI] [PubMed] [Google Scholar]
- Andersson S., Nilsson K., Fagerberg L., Hallström B.M., Sundström C., Danielsson A., Edlund K., Uhlen M., Asplund A. The transcriptomic and proteomic landscapes of bone marrow and secondary lymphoid tissues. PLoS One. 2014;9:e115911. doi: 10.1371/journal.pone.0115911. [DOI] [PMC free article] [PubMed] [Google Scholar]
- Banks G.B., Combs A.C., Chamberlain J.S. Sequencing protocols to genotype mdx, mdx(4cv), and mdx(5cv) mice. Muscle Nerve. 2010;42:268–270. doi: 10.1002/mus.21700. [DOI] [PMC free article] [PubMed] [Google Scholar]
- Bengtsson N.E., Hall J.K., Odom G.L., Phelps M.P., Andrus C.R., Hawkins R.D., Hauschka S.D., Chamberlain J.R., Chamberlain J.S. Muscle-specific CRISPR/Cas9 dystrophin gene editing ameliorates pathophysiology in a mouse model for Duchenne muscular dystrophy. Nat. Commun. 2017;8:14454. doi: 10.1038/ncomms14454. [DOI] [PMC free article] [PubMed] [Google Scholar]
- Beninati S., Piacentini M., Bergamini C.M. Transglutaminase 2, a double face enzyme. Amino Acids. 2017;49:415–423. doi: 10.1007/s00726-017-2394-5. [DOI] [PubMed] [Google Scholar]
- Birnkrant D.J., Bushby K., Bann C.M., Apkon S.D., Blackwell A., Brumbaugh D., Case L.E., Clemens P.R., Hadjiyannakis S., Pandya S. Diagnosis and management of Duchenne muscular dystrophy, part 1: diagnosis, and neuromuscular, rehabilitation, endocrine, and gastrointestinal and nutritional management. Lancet Neurol. 2018;17:251–267. doi: 10.1016/S1474-4422(18)30024-3. [DOI] [PMC free article] [PubMed] [Google Scholar]
- Brinkmeier H., Ohlendieck K. Chaperoning heat shock proteins: proteomic analysis and relevance for normal and dystrophin-deficient muscle. Proteomics Clin. Appl. 2014;8:875–895. doi: 10.1002/prca.201400015. [DOI] [PubMed] [Google Scholar]
- Capitanio D., Moriggi M., Torretta E., Barbacini P., De Palma S., Viganò A., Lochmüller H., Muntoni F., Ferlini A., Mora M. Comparative proteomic analyses of Duchenne muscular dystrophy and Becker muscular dystrophy muscles: changes contributing to preserve muscle function in Becker muscular dystrophy patients. J. Cachexia Sarcopenia Muscle. 2020;11:547–563. doi: 10.1002/jcsm.12527. [DOI] [PMC free article] [PubMed] [Google Scholar]
- Chapman V.M., Miller D.R., Armstrong D., Caskey C.T. Recovery of induced mutations for X chromosome-linked muscular dystrophy in mice. Proc. Natl. Acad. Sci. U S A. 1989;86:1292–1296. doi: 10.1073/pnas.86.4.1292. [DOI] [PMC free article] [PubMed] [Google Scholar]
- Danko I., Chapman V., Wolff J.A. The frequency of revertants in mdx mouse genetic models for Duchenne muscular dystrophy. Pediatr. Res. 1992;32:128–131. doi: 10.1203/00006450-199207000-00025. [DOI] [PubMed] [Google Scholar]
- Doran P., Martin G., Dowling P., Jockusch H., Ohlendieck K. Proteome analysis of the dystrophin-deficient MDX diaphragm reveals a drastic increase in the heat shock protein cvHSP. Proteomics. 2006;6:4610–4621. doi: 10.1002/pmic.200600082. [DOI] [PubMed] [Google Scholar]
- Dudekula K., Le Bihan T. Data from quantitative label free proteomics analysis of rat spleen. Data Brief. 2016;8:494–500. doi: 10.1016/j.dib.2016.05.058. [DOI] [PMC free article] [PubMed] [Google Scholar]
- Dowling P., Murphy S., Zweyer M., Raucamp M., Swandulla D., Ohlendieck K. Emerging proteomic biomarkers of X-linked muscular dystrophy. Expert Rev. Mol. Diagn. 2019;19:739–755. doi: 10.1080/14737159.2019.1648214. [DOI] [PubMed] [Google Scholar]
- Dowling P., Gargan S., Zweyer M., Swandulla D., Ohlendieck K. Proteomic profiling of fatty acid binding proteins in muscular dystrophy. Expert Rev. Proteomics. 2020;17:137–148. doi: 10.1080/14789450.2020.1732214. [DOI] [PubMed] [Google Scholar]
- Dowling P., Zweyer M., Raucamp M., Henry M., Meleady P., Swandulla D., Ohlendieck K. Proteomic and cell biological profiling of the renal phenotype of the mdx-4cv mouse model of Duchenne muscular dystrophy. Eur. J. Cell Biol. 2020;99:151059. doi: 10.1016/j.ejcb.2019.151059. [DOI] [PubMed] [Google Scholar]
- D'Eletto M., Rossin F., Fedorova O., Farrace M.G., Piacentini M. Transglutaminase type 2 in the regulation of proteostasis. Biol. Chem. 2019;400:125–140. doi: 10.1515/hsz-2018-0217. [DOI] [PubMed] [Google Scholar]
- Farini A., Sitzia C., Cassani B., Cassinelli L., Rigoni R., Colleoni F., Fusco N., Gatti S., Bella P., Villa C. Therapeutic potential of immunoproteasome inhibition in duchenne muscular dystrophy. Mol. Ther. 2016;24:1898–1912. doi: 10.1038/mt.2016.162. [DOI] [PMC free article] [PubMed] [Google Scholar]
- Finsterer J., Cripe L. Treatment of dystrophin cardiomyopathies. Nat. Rev. Cardiol. 2014;11:168–179. doi: 10.1038/nrcardio.2013.213. [DOI] [PubMed] [Google Scholar]
- Gargan S., Dowling P., Zweyer M., Swandulla D., Ohlendieck K. Identification of marker proteins of muscular dystrophy in the urine proteome from the mdx-4cv model of dystrophinopathy. Mol. Omics. 2020;16:268–278. doi: 10.1039/c9mo00182d. [DOI] [PubMed] [Google Scholar]
- Geyer P.E., Holdt L.M., Teupser D., Mann M. Revisiting biomarker discovery by plasma proteomics. Mol. Syst. Biol. 2017;13:942. doi: 10.15252/msb.20156297. [DOI] [PMC free article] [PubMed] [Google Scholar]
- Giordano C., Mojumdar K., Liang F., Lemaire C., Li T., Richardson J., Divangahi M., Qureshi S., Petrof B.J. Toll-like receptor 4 ablation in mdx mice reveals innate immunity as a therapeutic target in Duchenne muscular dystrophy. Hum. Mol. Genet. 2015;24:2147–6212. doi: 10.1093/hmg/ddu735. [DOI] [PMC free article] [PubMed] [Google Scholar]
- Goltsev Y., Samusik N., Kennedy-Darling J., Bhate S., Hale M., Vazquez G., Black S., Nolan G.P. Deep profiling of mouse splenic architecture with CODEX multiplexed imaging. Cell. 2018;174:968–981. doi: 10.1016/j.cell.2018.07.010. [DOI] [PMC free article] [PubMed] [Google Scholar]
- Guiraud S., Aartsma-Rus A., Vieira N.M., Davies K.E., van Ommen G.J., Kunkel L.M. The pathogenesis and therapy of muscular dystrophies. Annu. Rev. Genomics Hum. Genet. 2015;16:281–308. doi: 10.1146/annurev-genom-090314-025003. [DOI] [PubMed] [Google Scholar]
- Hathout Y., Marathi R.L., Rayavarapu S., Zhang A., Brown K.J., Seol H., Gordish-Dressman H., Cirak S., Bello L., Nagaraju K. Discovery of serum protein biomarkers in the mdx mouse model and cross-species comparison to Duchenne muscular dystrophy patients. Hum. Mol. Genet. 2014;23:6458–6469. doi: 10.1093/hmg/ddu366. [DOI] [PMC free article] [PubMed] [Google Scholar]
- Hindi S.M., Shin J., Ogura Y., Li H., Kumar A. Matrix metalloproteinase-9 inhibition improves proliferation and engraftment of myogenic cells in dystrophic muscle of mdx mice. PLoS One. 2013;8:e72121. doi: 10.1371/journal.pone.0072121. [DOI] [PMC free article] [PubMed] [Google Scholar]
- Im W.B., Phelps S.F., Copen E.H., Adams E.G., Slightom J.L., Chamberlain J.S. Differential expression of dystrophin isoforms in strains of mdx mice with different mutations. Hum. Mol. Genet. 1996;5:1149–1153. doi: 10.1093/hmg/5.8.1149. [DOI] [PubMed] [Google Scholar]
- Ingersoll M.A., Platt A.M., Potteaux S., Randolph G.J. Monocyte trafficking in acute and chronic inflammation. Trends Immunol. 2011;32:470–477. doi: 10.1016/j.it.2011.05.001. [DOI] [PMC free article] [PubMed] [Google Scholar]
- Judge L.M., Haraguchiln M., Chamberlain J.S. Dissecting the signaling and mechanical functions of the dystrophin-glycoprotein complex. J. Cell Sci. 2006;119:1537–1546. doi: 10.1242/jcs.02857. [DOI] [PubMed] [Google Scholar]
- Kherif S., Lafuma C., Dehaupas M., Lachkar S., Fournier J.G., Verdière-Sahuqué M., Fardeau M., Alameddine H.S. Expression of matrix metalloproteinases 2 and 9 in regenerating skeletal muscle: a study in experimentally injured and mdx muscles. Dev. Biol. 1999;205:158–170. doi: 10.1006/dbio.1998.9107. [DOI] [PubMed] [Google Scholar]
- Kimura E., Li S., Gregorevic P., Fall B.M., Chamberlain J.S. Dystrophin delivery to muscles of mdx mice using lentiviral vectors leads to myogenic progenitor targeting and stable gene expression. Mol. Ther. 2010;18:206–213. doi: 10.1038/mt.2009.253. [DOI] [PMC free article] [PubMed] [Google Scholar]
- Latroche C., Matot B., Martins-Bach A., Briand D., Chazaud B., Wary C., Carlier P.G., Chrétien F., Jouvion G. Structural and functional alterations of skeletal muscle microvasculature in dystrophin-deficient mdx mice. Am. J. Pathol. 2015;185:2482–2494. doi: 10.1016/j.ajpath.2015.05.009. [DOI] [PubMed] [Google Scholar]
- Lozanoska-Ochser B., Benedetti A., Rizzo G., Marrocco V., Di Maggio R., Fiore P., Bouche M. Targeting early PKCθ-dependent T-cell infiltration of dystrophic muscle reduces disease severity in a mouse model of muscular dystrophy. J. Pathol. 2018;244:323–333. doi: 10.1002/path.5016. [DOI] [PubMed] [Google Scholar]
- Lewis S.M., Williams A., Eisenbarth S.C. Structure and function of the immune system in the spleen. Sci. Immunol. 2019;4(33):eaau6085. doi: 10.1126/sciimmunol.aau6085. [DOI] [PMC free article] [PubMed] [Google Scholar]
- McGreevy J.W., Hakim C.H., McIntosh M.A., Duan D. Animal models of Duchenne muscular dystrophy: from basic mechanisms to gene therapy. Dis. Model Mech. 2015;8:195–213. doi: 10.1242/dmm.018424. [DOI] [PMC free article] [PubMed] [Google Scholar]
- Mebius R.E., Kraal G. Structure and function of the spleen. Nat. Rev. Immunol. 2005;5:606–616. doi: 10.1038/nri1669. [DOI] [PubMed] [Google Scholar]
- Mercuri E., Bönnemann C.G., Muntoni F. Muscular dystrophies. Lancet. 2019;394:2025–2038. doi: 10.1016/S0140-6736(19)32910-1. [DOI] [PubMed] [Google Scholar]
- Meyers T.A., Townsend D. Cardiac pathophysiology and the future of cardiac therapies in duchenne muscular dystrophy. Int. J. Mol. Sci. 2019;20:E4098. doi: 10.3390/ijms20174098. [DOI] [PMC free article] [PubMed] [Google Scholar]
- Mitrpant C., Fletcher S., Iversen P.L., Wilton S.D. By-passing the nonsense mutation in the 4 CV mouse model of muscular dystrophy by induced exon skipping. J. Gene Med. 2009;11:46–56. doi: 10.1002/jgm.1265. [DOI] [PubMed] [Google Scholar]
- Mojumdar K., Liang F., Giordano C., Lemaire C., Danialou G., Okazaki T., Bourdon J., Rafei M., Galipeau J., Divangahi M., Petrof B.J. Inflammatory monocytes promote progression of Duchenne muscular dystrophy and can be therapeutically targeted via CCR2. EMBO Mol. Med. 2014;6:1476–1492. doi: 10.15252/emmm.201403967. [DOI] [PMC free article] [PubMed] [Google Scholar]
- Mojumdar K., Giordano C., Lemaire C., Liang F., Divangahi M., Qureshi S.T., Petrof B.J. Divergent impact of Toll-like receptor 2 deficiency on repair mechanisms in healthy muscle versus Duchenne muscular dystrophy. J. Pathol. 2016;239:10–22. doi: 10.1002/path.4689. [DOI] [PubMed] [Google Scholar]
- Moulder R., Bhosale S.D., Goodlett D.R., Lahesmaa R. Analysis of the plasma proteome using iTRAQ and TMT-based Isobaric labeling. Mass Spectrom. Rev. 2018;37:583–606. doi: 10.1002/mas.21550. [DOI] [PubMed] [Google Scholar]
- Muntoni F., Torelli S., Ferlini A. Dystrophin and mutations: one gene, several proteins, multiple phenotypes. Lancet Neurol. 2003;2:731–740. doi: 10.1016/s1474-4422(03)00585-4. [DOI] [PubMed] [Google Scholar]
- Murphy S., Ohlendieck K. The biochemical and mass spectrometric profiling of the dystrophin complexome from skeletal muscle. Comput. Struct. Biotechnol. J. 2015;14:20–27. doi: 10.1016/j.csbj.2015.11.002. [DOI] [PMC free article] [PubMed] [Google Scholar]
- Murphy S., Zweyer M., Henry M., Meleady P., Mundegar R.R., Swandulla D., Ohlendieck K. Label-free mass spectrometric analysis reveals complex changes in the brain proteome from the mdx-4cv mouse model of Duchenne muscular dystrophy. Clin. Proteomics. 2015;12:27. doi: 10.1186/s12014-015-9099-0. [DOI] [PMC free article] [PubMed] [Google Scholar]
- Murphy S., Dowling P., Zweyer M., Mundegar R.R., Henry M., Meleady P., Swandulla D., Ohlendieck K. Proteomic analysis of dystrophin deficiency and associated changes in the aged mdx-4cv heart model of dystrophinopathy-related cardiomyopathy. J. Proteomics. 2016;145:24–36. doi: 10.1016/j.jprot.2016.03.011. [DOI] [PubMed] [Google Scholar]
- Murphy S., Dowling P., Zweyer M., Henry M., Meleady P., Mundegar R.R., Swandulla D., Ohlendieck K. Proteomic profiling of mdx-4cv serum reveals highly elevated levels of the inflammation-induced plasma marker haptoglobin in muscular dystrophy. Int. J. Mol. Med. 2017;39:1357–1370. doi: 10.3892/ijmm.2017.2952. [DOI] [PMC free article] [PubMed] [Google Scholar]
- Murphy S., Zweyer M., Henry M., Meleady P., Mundegar R.R., Swandulla D., Ohlendieck K. Proteomic profiling of liver tissue from the mdx-4cv mouse model of Duchenne muscular dystrophy. Clin. Proteomics. 2018;15:34. doi: 10.1186/s12014-018-9212-2. [DOI] [PMC free article] [PubMed] [Google Scholar]
- Murphy S., Zweyer M., Mundegar R.R., Swandulla D., Ohlendieck K. Proteomic identification of elevated saliva kallikrein levels in the mdx-4cv mouse model of Duchenne muscular dystrophy. Biochem. Biophys. Rep. 2018;18:100541. doi: 10.1016/j.bbrep.2018.05.006. [DOI] [PMC free article] [PubMed] [Google Scholar]
- Murphy S., Zweyer M., Henry M., Meleady P., Mundegar R.R., Swandulla D., Ohlendieck K. Proteomic analysis of the sarcolemma-enriched fraction from dystrophic mdx-4cv skeletal muscle. J. Proteomics. 2019;191:212–227. doi: 10.1016/j.jprot.2018.01.015. [DOI] [PubMed] [Google Scholar]
- Murphy S., Zweyer M., Raucamp M., Henry M., Meleady P., Swandulla D., Ohlendieck K. Proteomic profiling of the mouse diaphragm and refined mass spectrometric analysis of the dystrophic phenotype. J. Muscle Res. Cell. Motil. 2019;40:9–28. doi: 10.1007/s10974-019-09507-z. [DOI] [PubMed] [Google Scholar]
- Nadarajah V.D., van Putten M., Chaouch A., Garrood P., Straub V., Lochmüller H., Ginjaar H.B., Aartsma-Rus A.M., van Ommen G.J., den Dunnen J.T. Serum matrix metalloproteinase-9 (MMP-9) as a biomarker for monitoring disease progression in Duchenne muscular dystrophy (DMD) Neuromuscul. Disord. 2011;21:569–578. doi: 10.1016/j.nmd.2011.05.011. [DOI] [PubMed] [Google Scholar]
- Naidoo M., Anthony K. Dystrophin Dp71 and the neuropathophysiology of duchenne muscular dystrophy. Mol. Neurobiol. 2020;57:1748–1767. doi: 10.1007/s12035-019-01845-w. [DOI] [PMC free article] [PubMed] [Google Scholar]
- Ohlendieck K. Towards an understanding of the dystrophin-glycoprotein complex: linkage between the extracellular matrix and the membrane cytoskeleton in muscle fibers. Eur. J. Cell Biol. 1996;69:1–10. [PubMed] [Google Scholar]
- Ouisse L.H., Remy S., Lafoux A., Larcher T., Tesson L., Chenouard V., Guillonneau C., Brusselle L., Vimond N., Rouger K. Immunophenotype of a rat model of Duchenne's disease and demonstration of improved muscle strength after anti-CD45RC antibody treatment. Front. Immunol. 2019;10:2131. doi: 10.3389/fimmu.2019.02131. [DOI] [PMC free article] [PubMed] [Google Scholar]
- Partridge T.A. The mdx mouse model as a surrogate for Duchenne muscular dystrophy. FEBS J. 2013;280:4177–4186. doi: 10.1111/febs.12267. [DOI] [PMC free article] [PubMed] [Google Scholar]
- Rizzo G., Di Maggio R., Benedetti A., Morroni J., Bouche M., Lozanoska-Ochser B. Splenic Ly6Chi monocytes are critical players in dystrophic muscle injury and repair. JCI Insight. 2020;5:130807. doi: 10.1172/jci.insight.130807. [DOI] [PMC free article] [PubMed] [Google Scholar]
- Rodrigues M., Echigoya Y., Fukada S.I., Yokota T. Current translational research and murine models for Duchenne muscular dystrophy. J. Neuromuscul. Dis. 2016;3:29–48. doi: 10.3233/JND-150113. [DOI] [PMC free article] [PubMed] [Google Scholar]
- Santos A.C., Olivera D.M., Bertassoli B.M., Viana D.C., Vasconcelos B.G., Assis Neto A.C. Morphologic features from mdx mice spleens, used for Duchenne muscular dystrophy studies. J. Morphol. 2013;30:21–27. [Google Scholar]
- Saure C., Caminiti C., Weglinski J., Pérez F.D. Energy expenditure, body composition, and prevalence of metabolic disorders in patients with Duchenne muscular dystrophy. Diabetes Metab. Syndr. 2018;12:81–85. doi: 10.1016/j.dsx.2017.08.006. [DOI] [PubMed] [Google Scholar]
- Schwenk J.M., Omenn G.S., Sun Z., Campbell D.S., Baker M.S., Overall C.M., Aebersold R., Moritz R.L., Deutsch E.W. The human plasma proteome draft of 2017: building on the human plasma PeptideAtlas from mass spectrometry and complementary assays. J. Proteome Res. 2017;16:4299–4310. doi: 10.1021/acs.jproteome.7b00467. [DOI] [PMC free article] [PubMed] [Google Scholar]
- Shami A., Knutsson A., Dunér P., Rauch U., Bengtsson E., Tengryd C., Murugesan V., Durbeej M., Gonçalves I., Nilsson J. Dystrophin deficiency reduces atherosclerotic plaque development in ApoE-null mice. Sci. Rep. 2015;5:13904. doi: 10.1038/srep13904. [DOI] [PMC free article] [PubMed] [Google Scholar]
- Shiba N., Miyazaki D., Yoshizawa T., Fukushima K., Shiba Y., Inaba Y., Imamura M., Takeda S., Koike K., Nakamura A. Differential roles of MMP-9 in early and late stages of dystrophic muscles in a mouse model of Duchenne muscular dystrophy. Biochim. Biophys. Acta. 2015;1852:2170–2182. doi: 10.1016/j.bbadis.2015.07.008. [DOI] [PubMed] [Google Scholar]
- Shin J., Tajrishi M.M., Ogura Y., Kumar A. Wasting mechanisms in muscular dystrophy. Int. J. Biochem. Cell Biol. 2013;45:2266–2279. doi: 10.1016/j.biocel.2013.05.001. [DOI] [PMC free article] [PubMed] [Google Scholar]
- Shin J.H., Hakim C.H., Zhang K., Duan D. Genotyping mdx, mdx3cv, and mdx4cv mice by primer competition polymerase chain reaction. Muscle Nerve. 2011;43:283–286. doi: 10.1002/mus.21873. [DOI] [PMC free article] [PubMed] [Google Scholar]
- Sicinski P., Geng Y., Ryder-Cook A.S., Barnard E.A., Darlison M.G., Barnard P.J. The molecular basis of muscular dystrophy in the mdx mouse: a point mutation. Science. 1989;244:1578–1580. doi: 10.1126/science.2662404. [DOI] [PubMed] [Google Scholar]
- Smith L.R., Barton E.R. Regulation of fibrosis in muscular dystrophy. Matrix Biol. 2018;68:602–615. doi: 10.1016/j.matbio.2018.01.014. [DOI] [PMC free article] [PubMed] [Google Scholar]
- Thompson R., Spendiff S., Roos A., Bourque P.R., Warman Chardon J., Kirschner J., Horvath R., Lochmüller H. Advances in the diagnosis of inherited neuromuscular diseases and implications for therapy development. Lancet Neurol. 2020;19:522–532. doi: 10.1016/S1474-4422(20)30028-4. [DOI] [PubMed] [Google Scholar]
- Thul P.J., Lindskog C. The human protein atlas: a spatial map of the human proteome. Protein Sci. 2018;27:233–244. doi: 10.1002/pro.3307. [DOI] [PMC free article] [PubMed] [Google Scholar]
- Tichy E.D., Mourkioti F. A new method of genotyping MDX4CV mice by PCR-RFLP analysis. Muscle Nerve. 2017;56:522–524. doi: 10.1002/mus.25566. [DOI] [PMC free article] [PubMed] [Google Scholar]
- Tidball J.G., Welc S.S., Wehling-Henricks M. Immunobiology of inherited muscular dystrophies. Compr. Physiol. 2018;8:1313–1356. doi: 10.1002/cphy.c170052. [DOI] [PMC free article] [PubMed] [Google Scholar]
- Tokarz S.A., Duncan N.M., Rash S.M., Sadeghi A., Dewan A.K., Pillers D.A. Redefinition of dystrophin isoform distribution in mouse tissue by RT-PCR implies role in nonmuscle manifestations of duchenne muscular dystrophy. Mol. Genet. Metab. 1998;65:272–281. doi: 10.1006/mgme.1998.2763. [DOI] [PubMed] [Google Scholar]
- Uhlén M., Fagerberg L., Hallström B.M., Lindskog C., Oksvold P., Mardinoglu A., Sivertsson Å., Kampf C., Sjöstedt E., Asplund A. Proteomics. Tissue-based map of the human proteome. Science. 2015;347:1260419. doi: 10.1126/science.1260419. [DOI] [PubMed] [Google Scholar]
- Villalta S.A., Rosenberg A.S., Bluestone J.A. The immune system in Duchenne muscular dystrophy: friend or foe. Rare Dis. 2015;3:e1010966. doi: 10.1080/21675511.2015.1010966. [DOI] [PMC free article] [PubMed] [Google Scholar]
- Wilhelm M., Schlegl J., Hahne H., Gholami A.M., Lieberenz M., Savitski M.M., Ziegler E., Butzmann L., Gessulat S., Marx H. Mass-spectrometry-based draft of the human proteome. Nature. 2014;509:582–587. doi: 10.1038/nature13319. [DOI] [PubMed] [Google Scholar]
- Wilson K., Faelan C., Patterson-Kane J.C., Rudmann D.G., Moore S.A., Frank D., Charleston J., Tinsley J., Young G.D., Milici A.J. Duchenne and becker muscular dystrophies: a review of animal models, clinical end points, and biomarker quantification. Toxicol. Pathol. 2017;45:961–976. doi: 10.1177/0192623317734823. [DOI] [PMC free article] [PubMed] [Google Scholar]
- Yucel N., Chang A.C., Day J.W., Rosenthal N., Blau H.M. Humanizing the mdx mouse model of DMD: the long and the short of it. NPJ Regen. Med. 2018;3:4. doi: 10.1038/s41536-018-0045-4. [DOI] [PMC free article] [PubMed] [Google Scholar]
Associated Data
This section collects any data citations, data availability statements, or supplementary materials included in this article.
Supplementary Materials
Data Availability Statement
The proteomic datasets from the mass spectrometric analysis of 14 separate spleen sample runs have been deposited to the Open Science Framework repository as OSF entry “f85ve” under the following link: https://osf.io/f85ve/. This link also features a multi-consensus file of the proteomic cataloging of mouse spleen with the help of an Orbitrap Fusion Tribrid mass spectrometer.