

Abstract
Cellular functions are performed by a vast and diverse set of proteoforms. Proteoforms are the specific forms of proteins produced as a result of genetic variations, RNA splicing, and post-translational modifications (PTMs). Top-down mass spectrometric analysis of intact proteins enables proteoform identification, including proteoforms derived from sequence cleavage events or harboring multiple PTMs. In contrast, bottom-up proteomics identifies peptides, which necessitates protein inference and does not yield proteoform identifications. We seek here to exploit synergies between these two data types to improve the quality and depth of the overall proteomic analysis. To this end, we automated the large-scale integration of results from multi-protease bottom-up and top-down analyses in the software program Proteoform Suite and applied it to the analysis of proteoforms from the human Jurkat T lymphocyte cell line. We implemented the recently developed proteoform-level classification scheme for top-down MS/MS identifications in Proteoform Suite, which enables users to observe the level and type of ambiguity for each proteoform identification, including which of the ambiguous proteoform identifications are supported by bottom-up-level evidence. We used Proteoform Suite to find instances where top-down identifications aid in protein inference from bottom-up analysis, and conversely where bottom-up peptide identifications aid in proteoform PTM localization. We also show the use of bottom-up data to infer proteoform candidates potentially present in the sample, allowing confirmation of such proteoform candidates by intact-mass analysis of MS1 spectra. The implementation of these capabilities in the freely available software program Proteoform Suite enables users to integrate large-scale top-down and bottom-up datasets and to utilize synergies between them to improve and extend proteomic analysis.
Keywords: top-down proteomics, bottom-up proteomics, proteoforms, post-translational modification, protein inference, software
Graphical Abstract
INTRODUCTION
Protein diversity accounts for much of biological complexity. Proteoforms are the different forms of a protein derived from the same gene due to variations such as genetic variation, alternative splicing, and post translational modifications (PTMs).1 It is important to identify proteoforms in biological systems because different proteoforms from the same gene can execute different biological functions in the cell.2, 3
In bottom-up proteomics, proteoforms are digested into peptides prior to LC-MS/MS analysis.4 Recent informatics advances in bottom-up proteomics have enabled the large-scale identification of post-translational modifications, including those that were not previously annotated.5–7 However, in bottom-up proteomics, proteoforms are digested into peptides and thus information about the coexistence of PTMs and sequence variations within a given proteoform is lost. Additionally, peptides rather than proteins are identified in bottom-up proteomics, so protein inference must be applied to determine what proteins are in the sample.8 As many peptides are shared between different proteins, the identified peptides sometimes do not uniquely represent the proteins present; if there are no unique peptides present from a particular protein, an ambiguous protein group containing more than one protein results.
In bottom-up quantitative studies, proteins are typically quantified based on summing their most abundant peptides; therefore, proteoform-level changes are either undetected or can even introduce complications in protein-level quantification. In contrast, top-down proteomics analyzes intact proteoforms, enabling identification and quantification of the proteoforms and localization of their PTMs.9–12 However, LC-MS/MS analysis of intact proteins is much more challenging than for peptides. The signal-to-noise is lower for intact proteins than peptides13, due to charge state and isotopic complexity, as well as other factors, and higher instrument resolution is required. These and other challenges in acquiring high quality MS2 spectra of proteoforms can compromise their confident identification. A proteoform level classification scheme was recently introduced to address the problem in reporting ambiguous proteoform identifications.14
Previous studies have integrated results from both bottom-up and top-down proteomic analyses.15–19 Some studies have utilized both approaches to determine differences in proteome quantification between bottom-up and top-down analyses.20, 21 Until recently however, there were no software tools available to facilitate the integration of large-scale bottom-up and top-down datasets, in order to enable the observation and utilization of shared sequence and PTM information. ProteoCombiner was recently developed to visualize the results from both bottom-up and top-down analyses (https://proteocombiner.pasteur.fr/). Here, we enable the automatic large-scale integration of bottom-up and top-down results in the open-source software program Proteoform Suite. We applied the data integration strategy to improve proteoform and protein identifications in Jurkat cell lysate by disambiguating proteoform and protein group identifications. We also use the bottom-up data to delineate proteoforms potentially present in the sample; some of these proteoforms can then be identified from their presence in MS1 spectra acquired in the top-down process. Proteoform Suite is freely available and provides a valuable tool for integrating bottom-up and top-down data to improve proteoform identification and quantification.
METHODS
Data acquisition
Previously acquired data was used for the bottom-up analysis, available on the MassIVE platform (https://massive.ucsd.edu; ID: MSV000083304).22–24 Briefly, Jurkat T lymphocyte cells25 were lysed and separated into six aliquots. Six different proteases (Arg-C, Asp-N, chymotrypsin, Glu-C, Lys-C, and trypsin) were utilized to digest each separate aliquot into peptides. Each digest sample was fractionated with high pH liquid chromatography, and the fractions were analyzed by LC-MS/MS on an Orbitrap Velos. For the top-down analysis, a Jurkat cell pellet of 4.5 × 10⁷ cells was lysed in 500 μL of lysis buffer. Lysis buffer contained 0.5 units/μL of benzonase nuclease (Sigma Aldrich), 4% sodium dodecyl sulfate (Sigma Aldrich), 100 mM Tris-HCl pH 7.5 (Teknova), 10 mM dithiothreitol (Sigma Aldrich), 10 mM sodium butyrate (Sigma Aldrich), and 1X protease and phosphatase inhibitors (Thermo Fisher Scientific). The cell lysate was incubated at 37°C for 20 minutes, and then centrifuged for 20 minutes at 20000g to remove insoluble material. Acetone precipitation was performed for 1 h with 4 volumes of acetone, and the sample was centrifuged at 15,000 g for 10 min. The supernatant was removed, and the pellet was solubilized in 1% SDS. A BCA assay was performed to determine protein concentration; 400 μg of protein was size-fractionated by gel-eluted fraction entrapment electrophoresis on a 12% cartridge (GELFrEE, Expedeon).26 SDS was removed from each fraction with methanol/ chloroform precipitation, followed by resuspension in 5% acetonitrile and 0.1% formic acid. Each fraction was analyzed by HPLC-ESI-MS/MS (nanoACQUITY, Waters and QE-HF, ThermoFisher Scientific). HPLC separation was performed with a 100 × 365 μm fused silica capillary micro-column packed with 20 cm of 5 μm-diameter, 1000 Angstrom pore size, PLRP-S resin (Agilent) with an emitter tip pulled to approximately 1 μm using a laser puller (Sutter Instruments). Sample was loaded onto the column at a flow-rate of 600 nL/min. for 20 minutes at 5% acetonitrile, then the flow rate was lowered to 500nL/min. and the gradient increased to 20% acetonitrile over the next two minutes. Proteoforms were then eluted over 35min. at a flow-rate of 500 nL/min. with a gradient of 20% to 65% acetonitrile in 0.2% formic acid. A source-induced dissociation (SID) setting of 15.0 eV was used to help remove adducts. MS1 scans were performed between 600–2000 m/z at a resolution of 240,000, utilizing 3 microscans with a maximum injection time of 50 ms and an automatic gain control (AGC) target setting of 1×10⁶. The top eight most abundant ions were selected for high-energy collisional dissociation (HCD) fragmentation with an HCD normalized collision energy setting of 25. The isolation window was 4 m/z units, the MS2 resolution was 120,000 and 1 microscan was acquired. Dynamic exclusion was enabled with a duration of 30s. Top-down raw files are available on the MassIVE platform (https://massive.ucsd.edu; ID: MSV000085414).
Data Analysis
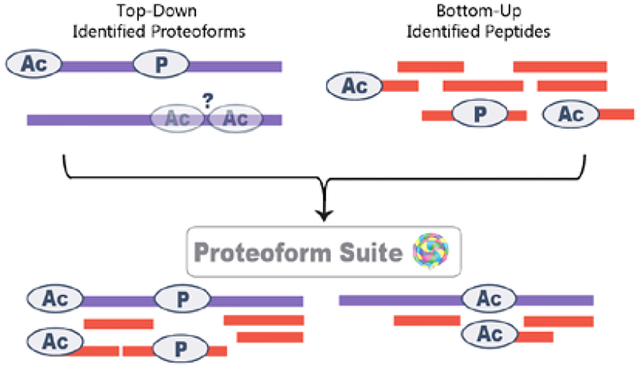
An overview of the data analysis strategy is shown in Figure 1. All .raw files were analyzed using MetaMorpheus version 0.0.305, which is freely available at https://github.com/smith-chem-wisc./MetaMorpheus. An .xml database containing canonical sequences for homo sapiens was downloaded from UniProt March 2017. Calibration was first performed with the following settings: 2 maximum missed cleavages, variable initiator methionine, variable oxidation on methionine, precursor mass tolerance of ±15 ppm, product mass tolerance of ±25 ppm, maximum of 2 modifications per peptide, fixed carbamidomethyl on cysteine and selenocysteine. Protein parsimony was applied post-search of all proteases, as previously described24, to improve the parsimony output. The output AllPeptides.psmtsv file was used for all further analysis, filtering at a peptide-level q-value of 1% determined by the posterior error probability (PEP) score in MetaMorpheus. For the top-down analysis, the following search settings were used: variable initiator methionine, variable N-terminal acetylation, precursor mass tolerance of ±5 ppm, product mass tolerance of ±20 ppm, up to 3 missed monoisotopic mass units, maximum of 5 modifications per proteoform. The AllPSMs.psmtsv file with proteoform spectral matches (PrSMs) was filtered to contain proteoforms at a 1% proteoform-level FDR using the PEP q-value. Briefly, we made a spreadsheet with unique proteoform identifications (including decoys) with the best PrSM selected for each identification, and the rows were sorted by PEP value. Each proteoform’s PEP was calculated as the sum of all PEPs for previous rows divided by the row number, setting a 1% cutoff.
Figure 1.
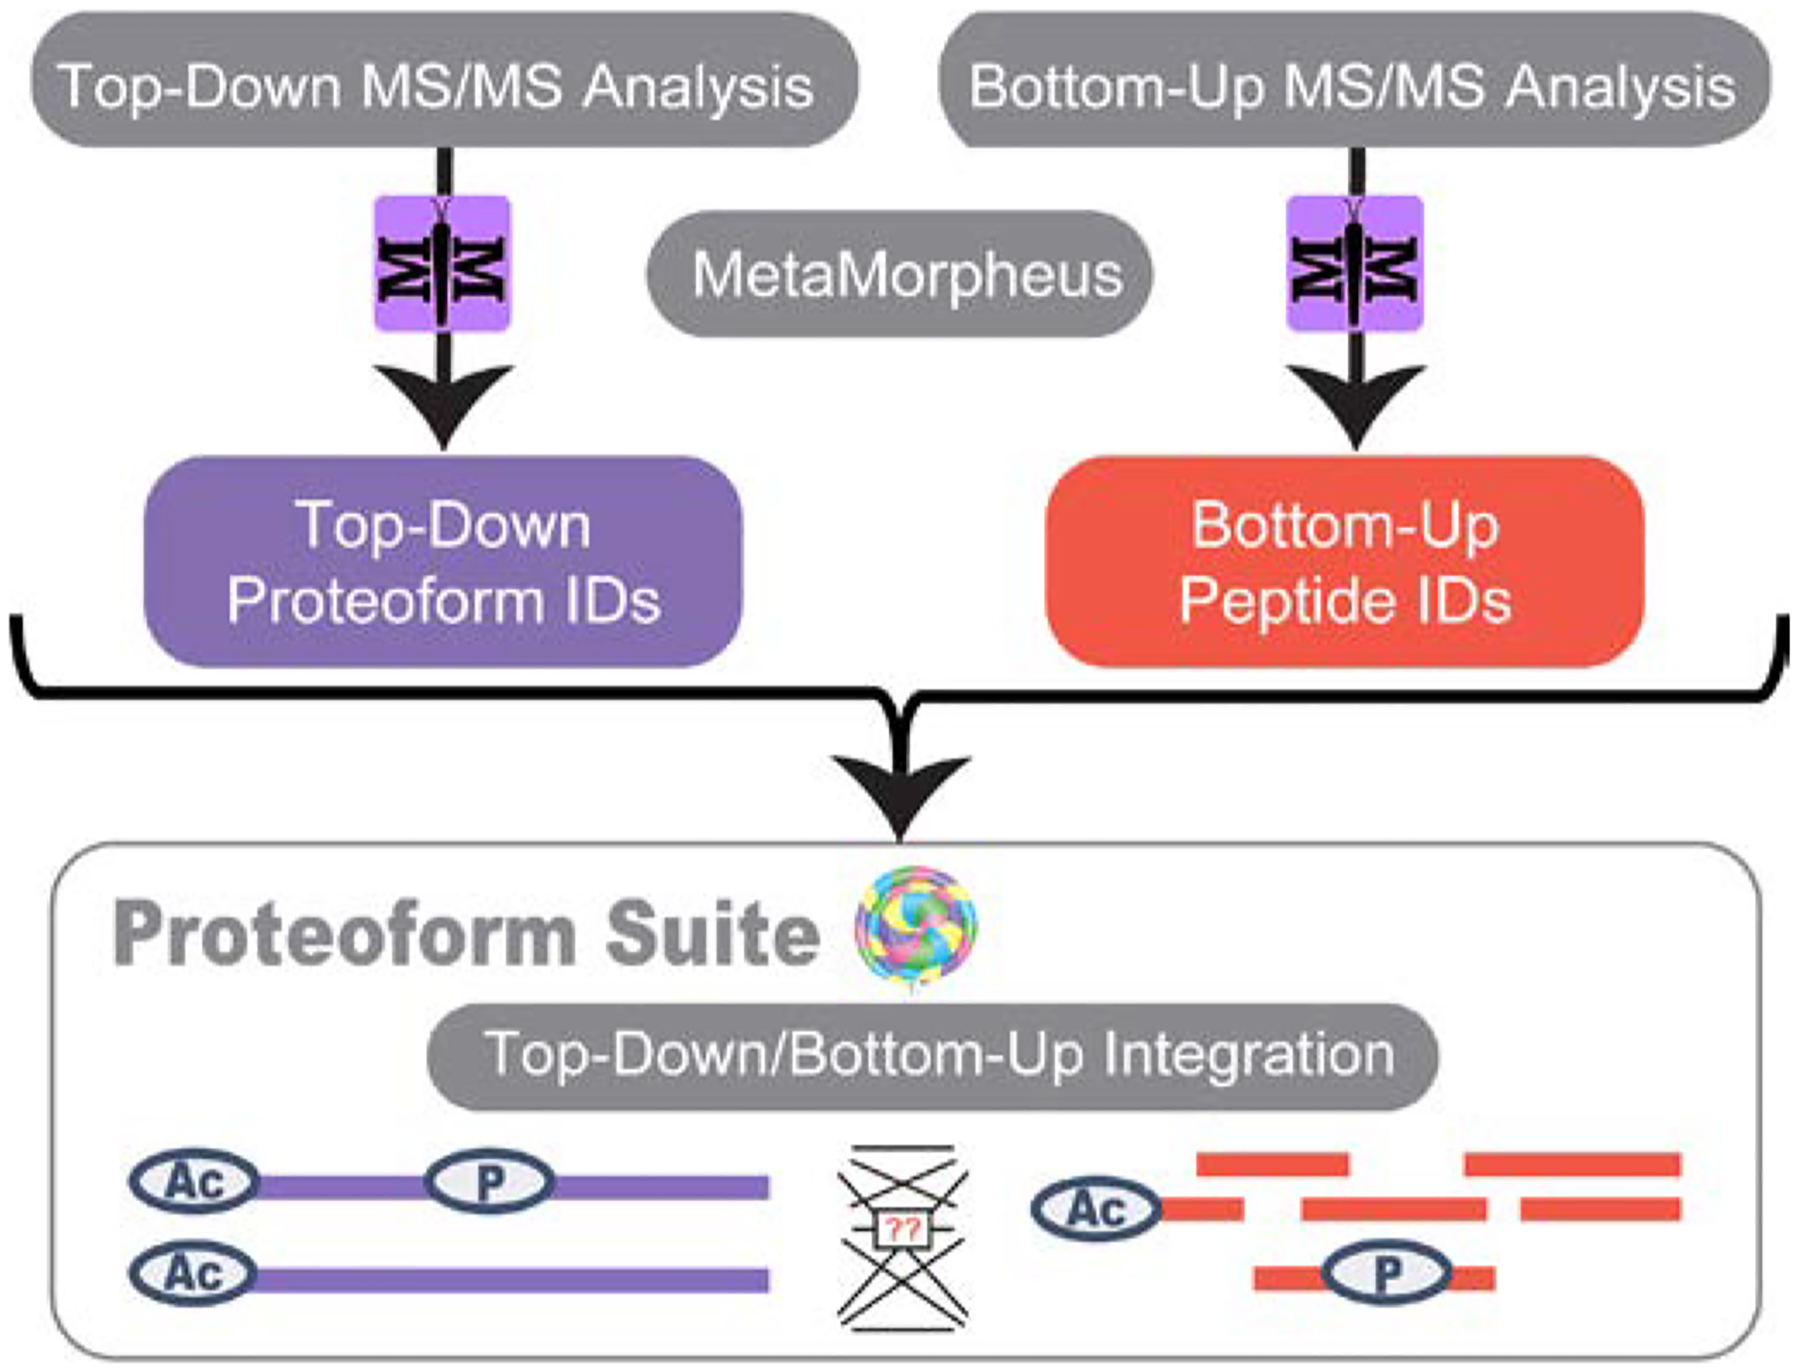
Overview of the strategy employed for integration of bottom-up and top-down data. Raw files were searched with MetaMorpheus, and results were integrated in Proteoform Suite.
Integration of bottom-up and top-down data in Proteoform Suite
Proteoform Suite version 0.3.6 was used for all further analysis. The unique bottom-up peptide identifications file and the PrSMs file were read into Proteoform Suite. For top-down proteoforms, any ambiguous ID explained by a different less ambiguous PrSM was discarded. The list of bottom-up peptides was parsed into any of the top-down proteoforms from which it could be derived, i.e., matching protein accession, the sequence was part of the proteoform’s sequence, and the peptide did not contain any non-artifactual modifications not contained by the proteoform (Figure 2). Ammonia loss, oxidation, deamidation, water loss, and carbamylation were considered to be artifactual modifications. Peptides that were ambiguous with respect to their sequence or PTM localization were discarded. Peptides that were only ambiguous with respect to protein identification (i.e., shared peptides) were read in and stored with each protein in the protein group.
Figure 2.
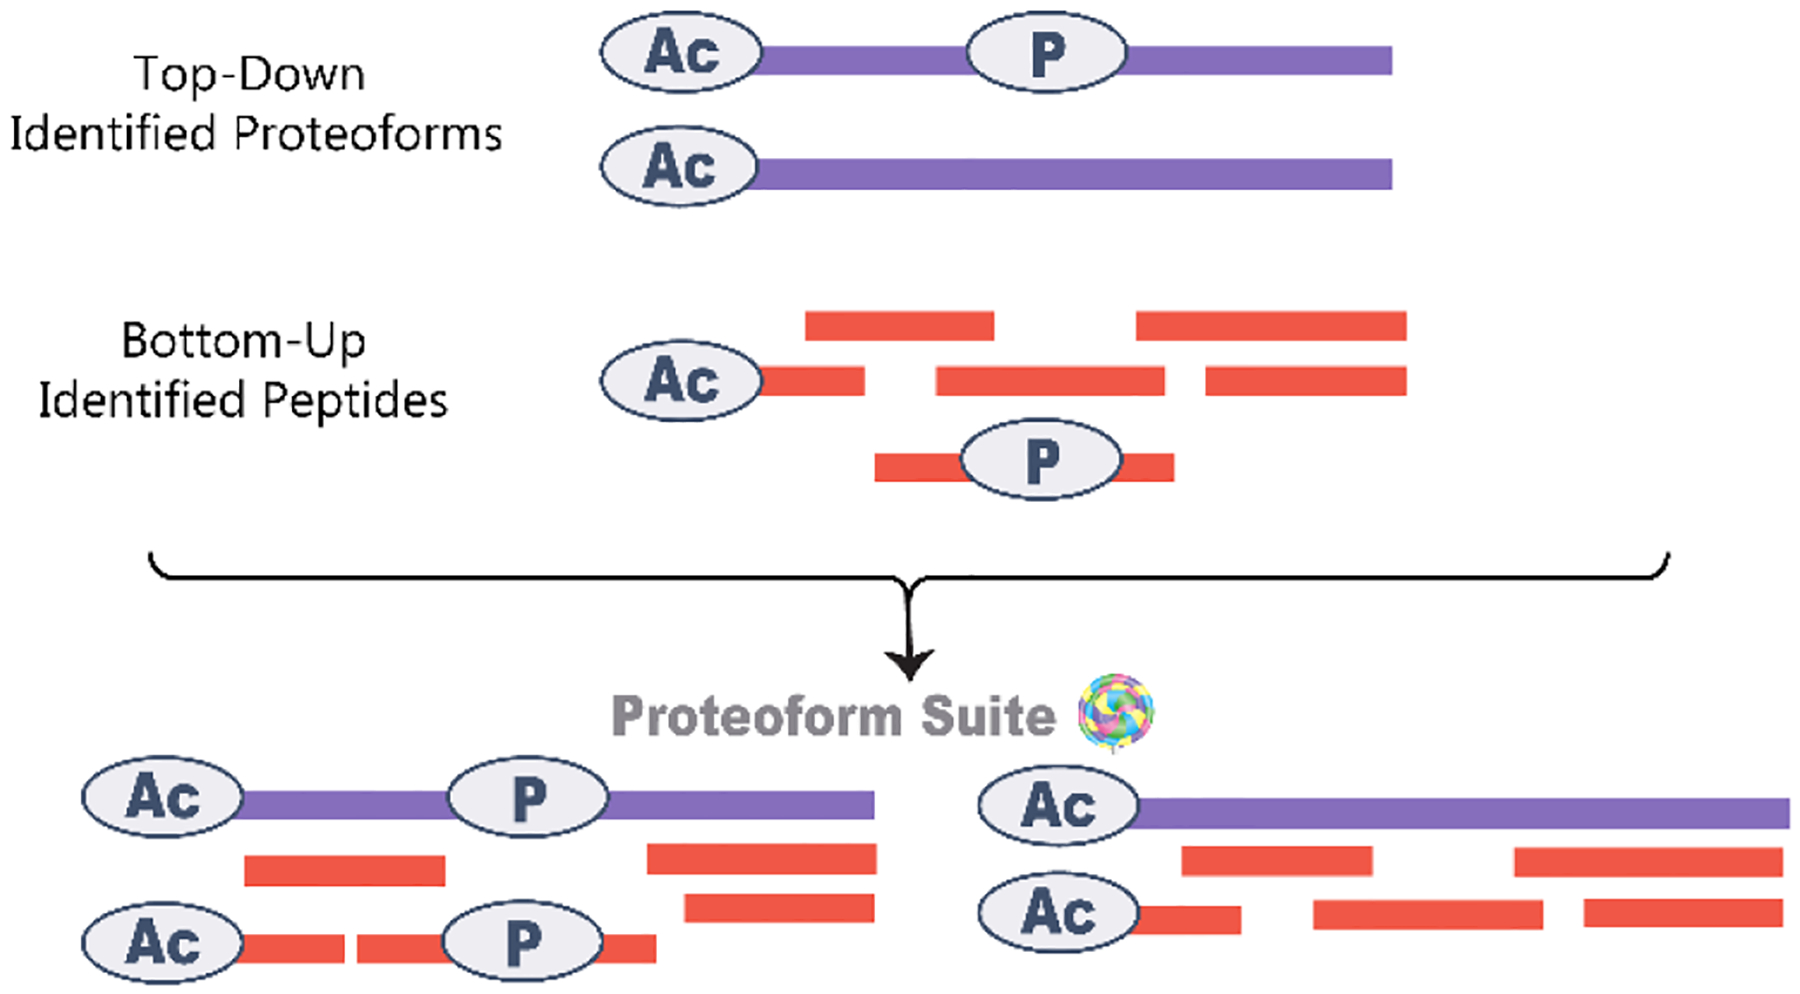
In Proteoform Suite, bottom-up peptides are associated with proteoforms from which they could be derived based on the sequence and PTMs present. For example, unmodified peptides are only associated with proteoforms not modified at that sequence, and modified peptides are only associated with proteoforms with the same modification.
Inference of potential proteoforms based upon bottom-up evidence
Using the list of bottom-up peptide identifications, a list of potential proteoforms supported by bottom-up evidence was created (Figure 3). For each peptide containing a begin or end residue for a full or subsequence annotated in UniProt, a proteoform with that subsequence and any modifications observed on the peptide was placed on the list. If additional peptides were identified for regions of the sequence not explained by an already added potential proteoform, a full-length sequence was added including any modifications observed on the peptide.
Figure 3.
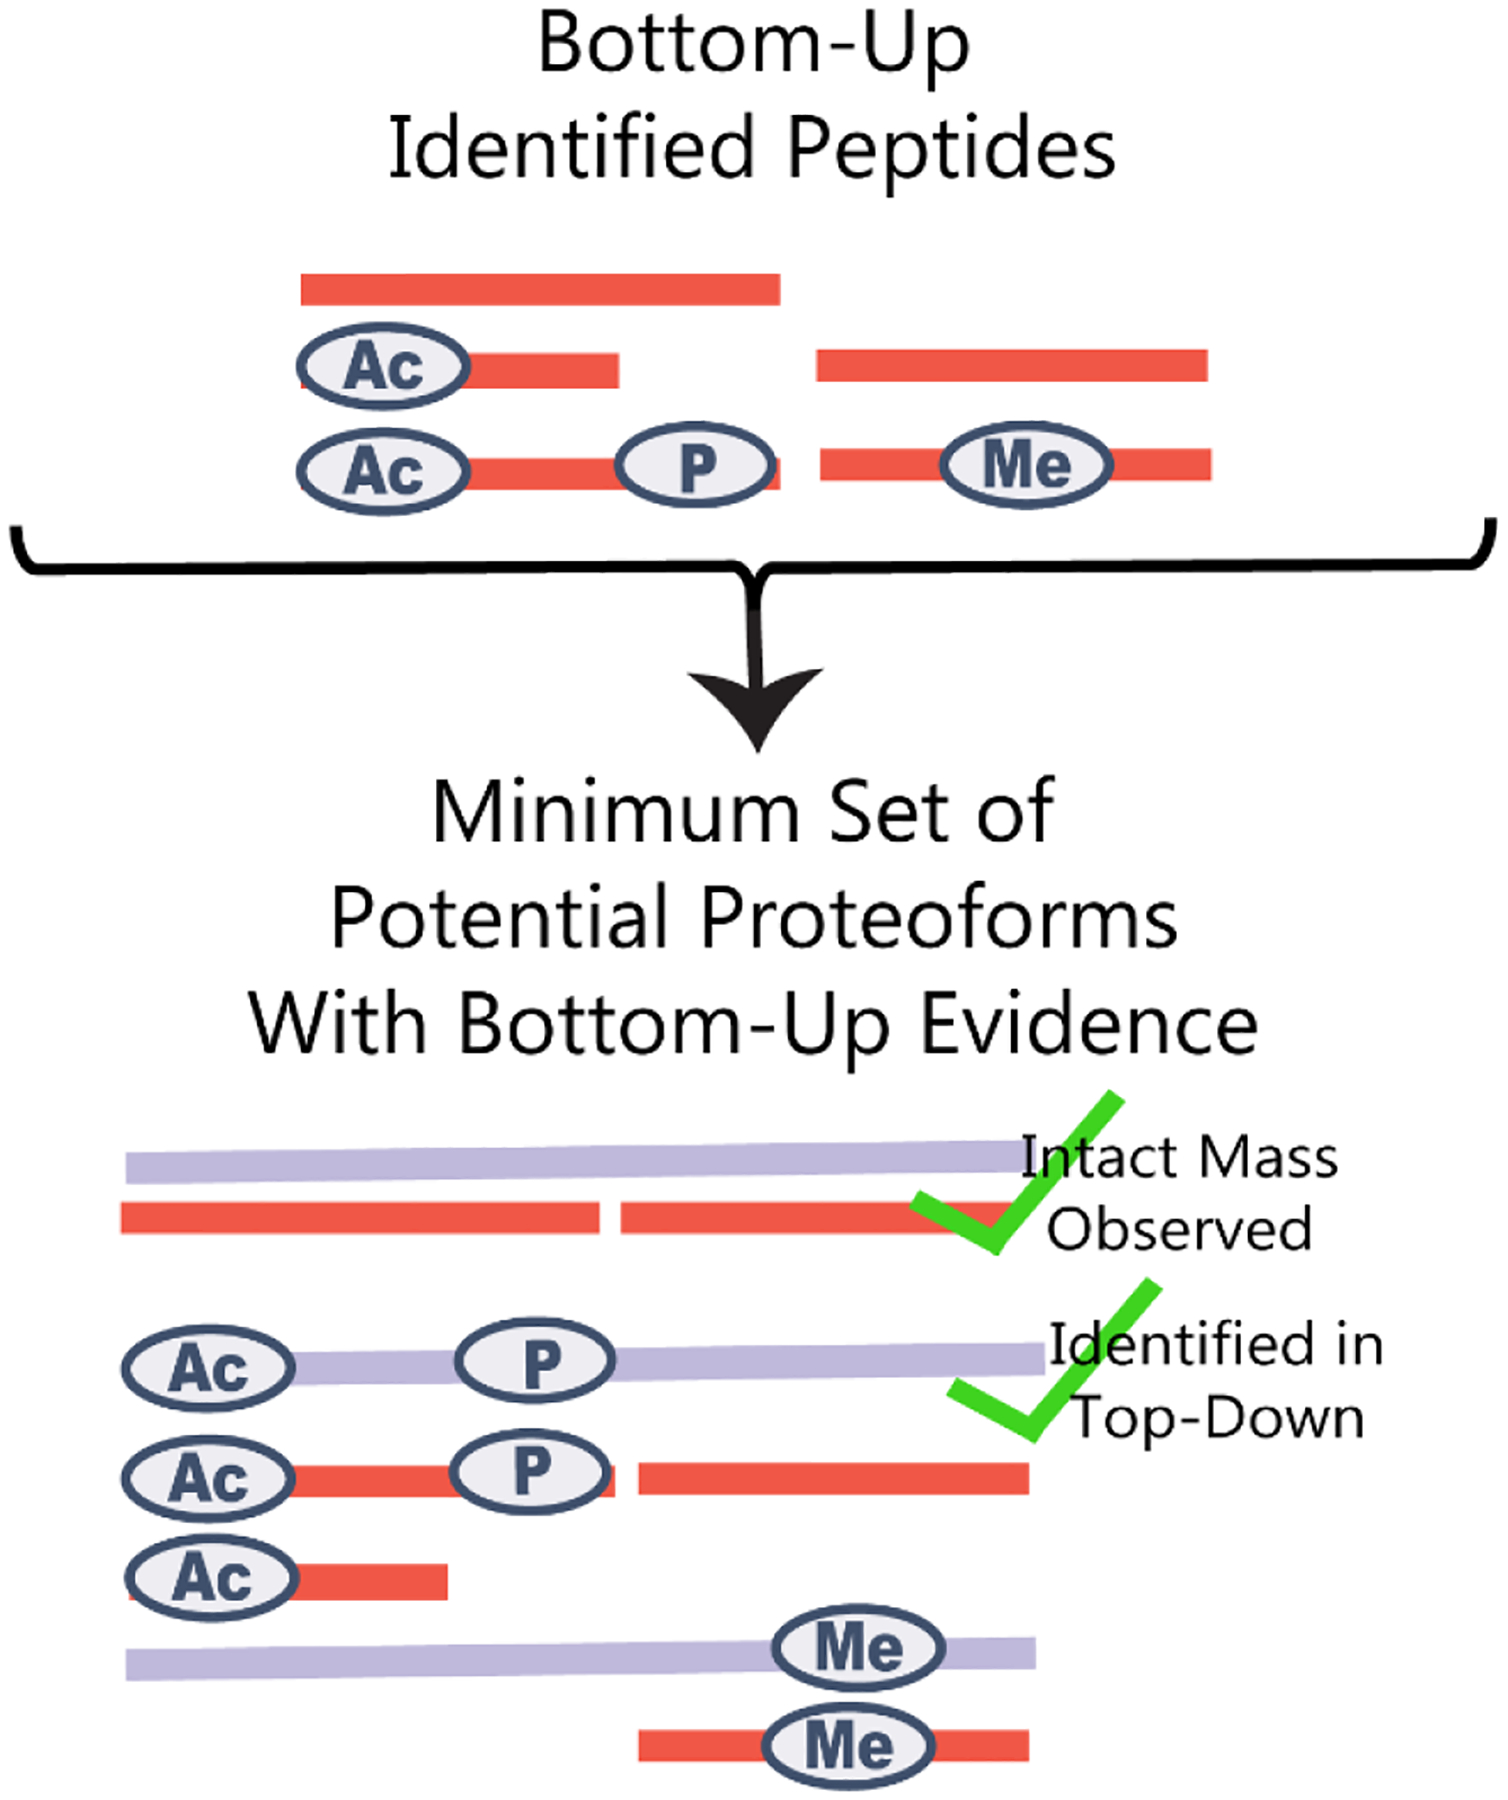
Bottom-up peptide identifications were used to make a list of potential proteoforms with bottom-up evidence. We compared this list against previously acquired intact-mass proteoform data to confirm the existence of some proteoforms.
RESULTS AND DISCUSSION
Bottom-up and top-down identifications
At 1% peptide-level FDR, the bottom-up search for six proteases resulted in the identification of 7930 proteins and 46 protein groups with more than one protein. There were 125,797 identified unique peptides (Supporting Table S1). The Global Post-Translational Modification (G-PTM) strategy27 implemented in MetaMorpheus searches for modifications annotated in UniProt. We identified 2404 unique modified peptidoforms, including 1224 acetylated peptides, 1070 phosphorylated peptides, and 158 methylated peptides. There were 208 peptides with more than one PTM.
From the MetaMorpheus top-down search of the 12 fractions of Jurkat lysate, we identified 38,063 proteoform spectral matches (PrSMs), corresponding to 5197 unique proteoform identifications and 214 unique protein accessions (Supporting Table S2). We implemented the recently developed five-level proteoform-level classification scheme, which indicates the level of ambiguity for a proteoform identification28, in Proteoform Suite (Table I). In this classification scheme, level 1 identifications are unambiguous, level 2 identifications have one source of ambiguity, level 3 identifications have two sources of ambiguity, level 4 identifications have three sources of ambiguity, and level 5 proteoforms have four sources of ambiguity. Possible sources of ambiguity are PTM identification, PTM localization, sequence ambiguity and gene of origin ambiguity. The level of ambiguity is dependent on the search parameters and database utilized. For example, the MetaMorpheus task used here only searches for modified residues annotated in the .xml database downloaded from UniProt, which introduces less potential for ambiguity than a totally open variable modification search. However, it is still helpful to know the level of ambiguity reported for each proteoform identification in the context of the search and database utilized. There were 3603 unambiguous level 1 proteoform identifications, consisting of 206 unique protein accessions.
Table 1.
Number of proteoform identifications at each level of the proteoform five-level classification system
| Level Number | Description | Proteoform Count |
|---|---|---|
| 1 | No sources of ambiguity | 3603 |
| 2A | Ambiguity in PTM localization | 1390 |
| 2B | Ambiguity in PTM identification | 121 |
| 2C | Ambiguity in sequence | 0 |
| 2D | Ambiguity in gene of origin | 0 |
| 3 | Two sources of ambiguity | 60 |
| 4 | Three sources of ambiguity | 1 |
| 5 | Four sources of ambiguity | 22 |
The majority of the level 1 proteoform identifications were histones (3245 unique proteoforms and 36 proteins). Histones are highly abundant and heavily modified proteoforms. 938 of these proteoforms were the full-length protein sequence, and the remaining 2307 had the N-terminal methionine cleaved. 3196 of the histone proteoforms contained at least one modification. The most prevalent modifications were methylation, dimethylation, trimethylation, acetylation, phosphorylation, citrullination, and N6-crotonyllysine. There were 1511 level 2 identifications, 60 level 3 identifications, 1 level 4 identification, and 22 level 5 identifications. Of the 1511 level 2 identifications, 1390 were due to ambiguous PTM localization (level 2A), and 121 were due to ambiguous PTM identification (level 2B). There were no level 2 proteoforms with ambiguity in the sequence (level 2C) or gene of origin (level 2D); the 25 proteoform identifications with sequence or gene ambiguity had one or more other sources of ambiguity and were therefore level 3 or higher.
Integration Analysis in Proteoform Suite
We augmented the software program Proteoform Suite to integrate results from MetaMorpheus bottom-up and top-down analyses. A list of proteoform identifications is displayed on the top-down page of the Proteoform Suite graphical user interface (GUI). When a proteoform is selected, all bottom-up peptides derived from this proteoform are displayed in a separate table. For ambiguous proteoform identifications, peptides from any possible proteoform are displayed to aid in potential disambiguation. Annotated sequences are shown for all selected proteoform and peptide identifications, facilitating manual evaluation of PTM localization and MS2 sequence coverage (Figure 4).
Figure 4.
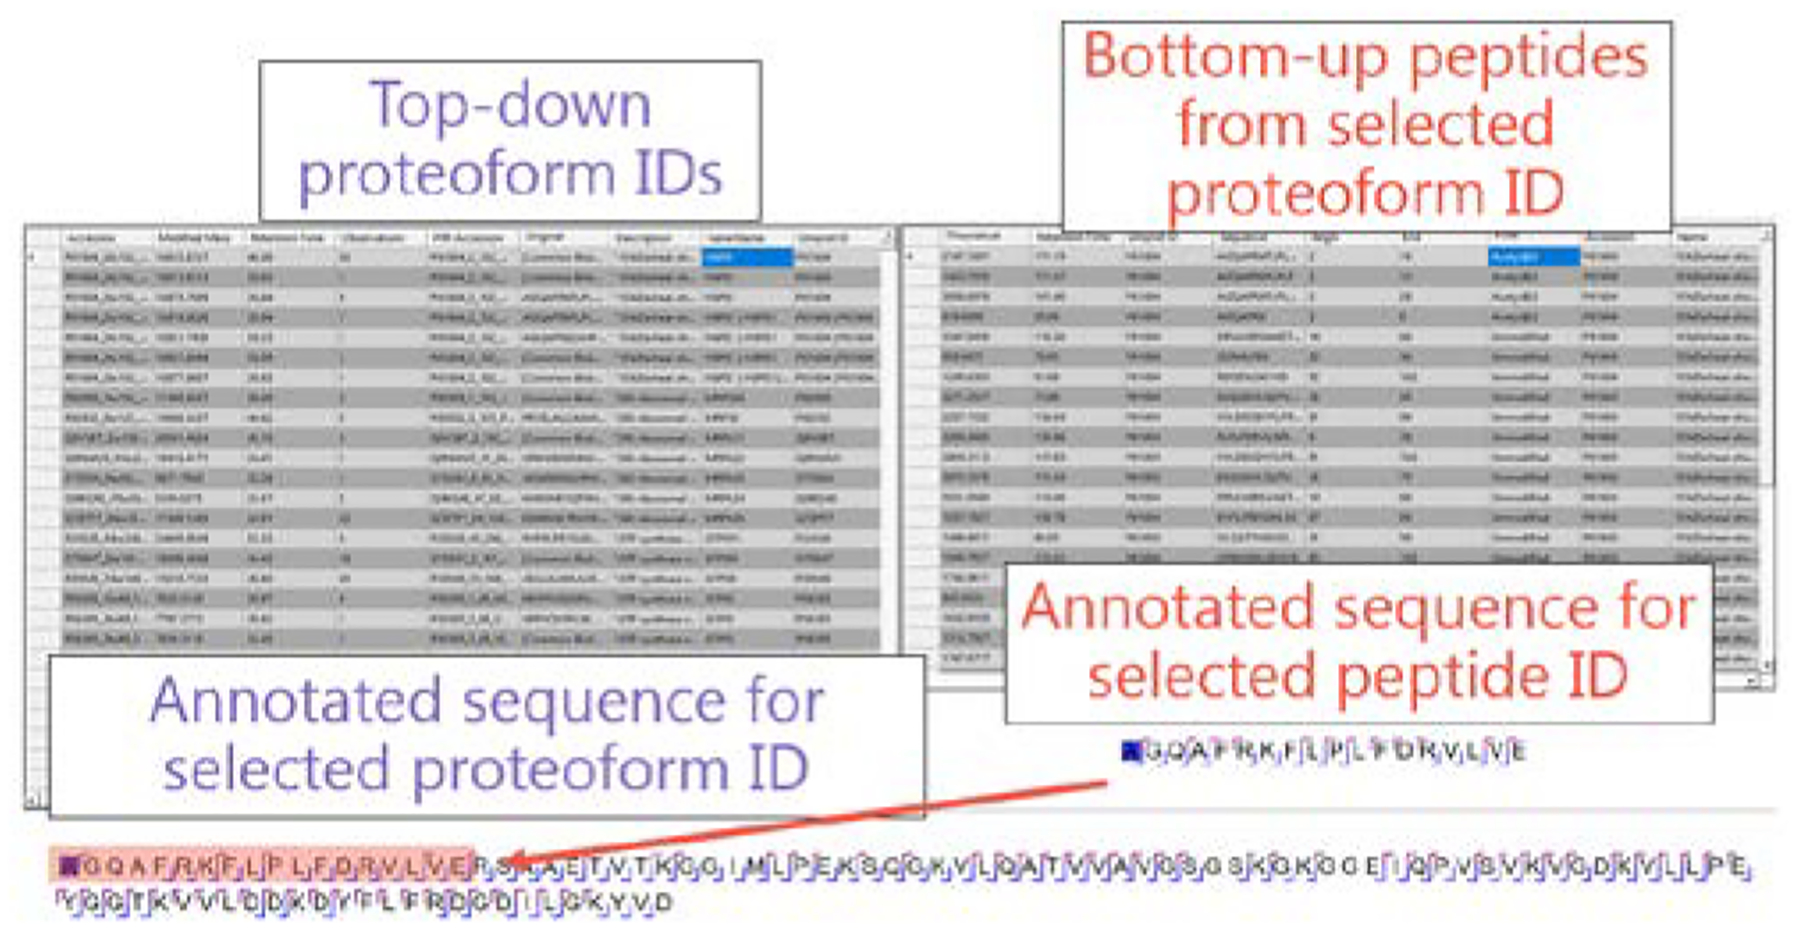
Proteoform Suite graphical user interface. When a proteoform identification is selected, all bottom-up peptides derived from the proteoform are displayed. Annotated sequences are also displayed when a proteoform or peptide is selected.
In bottom-up proteomic analyses, proteoforms have been digested into peptides, so peptides observed may be derived from one or more different proteoforms present in the sample. We determined the number of identified proteoforms that correspond to each identified peptide in Jurkat lysate (displayed in Supporting Table S1). There were 125,797 unique peptides corresponding to 7930 proteins; only 2671 of these peptides from 173 proteins corresponded to at least one observed top-down proteoform. Only around 2% of all unique peptides were derived from a proteoform identified by top-down analysis; this is because the vast majority of unique peptides (123,083 out of 125,797) were derived from proteins with no identified proteoform. This illustrates the current limitations of sensitivity and proteome coverage in top-down proteomics, with a factor of ~45-fold fewer top-down protein identifications than were obtained in bottom-up. Six proteases were used for the bottom-up analysis here, resulting in a particularly large number of bottom-up protein identifications; in previous trypsin-only studies, we have observed closer to 20 times the number of proteins by bottom-up than by top-down.21 Of the 2671 peptides with at least one top-down proteoform also identified that contained it, there were 1672 with only one corresponding identified proteoform and 999 with more than one identified proteoform. This proteoform-level ambiguity for peptide identifications has important implications for protein quantification but has largely been ignored in bottom-up quantification studies to date. Protein quantification in bottom-up analyses is typically performed by summing the most abundant peptides for each protein to give a single intensity value for each protein. However, often these peptides could belong to different proteoforms from the same protein, and these different proteoforms can undergo different quantitative changes upon biological perturbation (ex: some proteoforms from a given family increase while others decrease). Some studies have addressed this problem by inferring proteoform-level quantitative differences based upon abundance changes of different variant or PTM containing peptides.29, 30
We have previously described the visualization of proteoform families as networks, where each node corresponds to a proteoform and each edge corresponds to a mass difference representing an amino acid change or modification difference. We expanded this approach here to visualize the integration of bottom-up and top-down data in Cytoscape31, similar to the visualization of peptide-to-protein networks29, 32. Each top-down proteoform identification and bottom-up peptide identification is represented as a purple or orange node, respectively; edges are drawn between each peptide and the identified proteoforms from which it could be derived. An example of this visualization for modified peptides is shown in Figure 5. Visualization of bottom-up and top-down results is useful to determine which peptides are ambiguous between different proteoform identifications when interpreting quantitative data.
Figure 5.
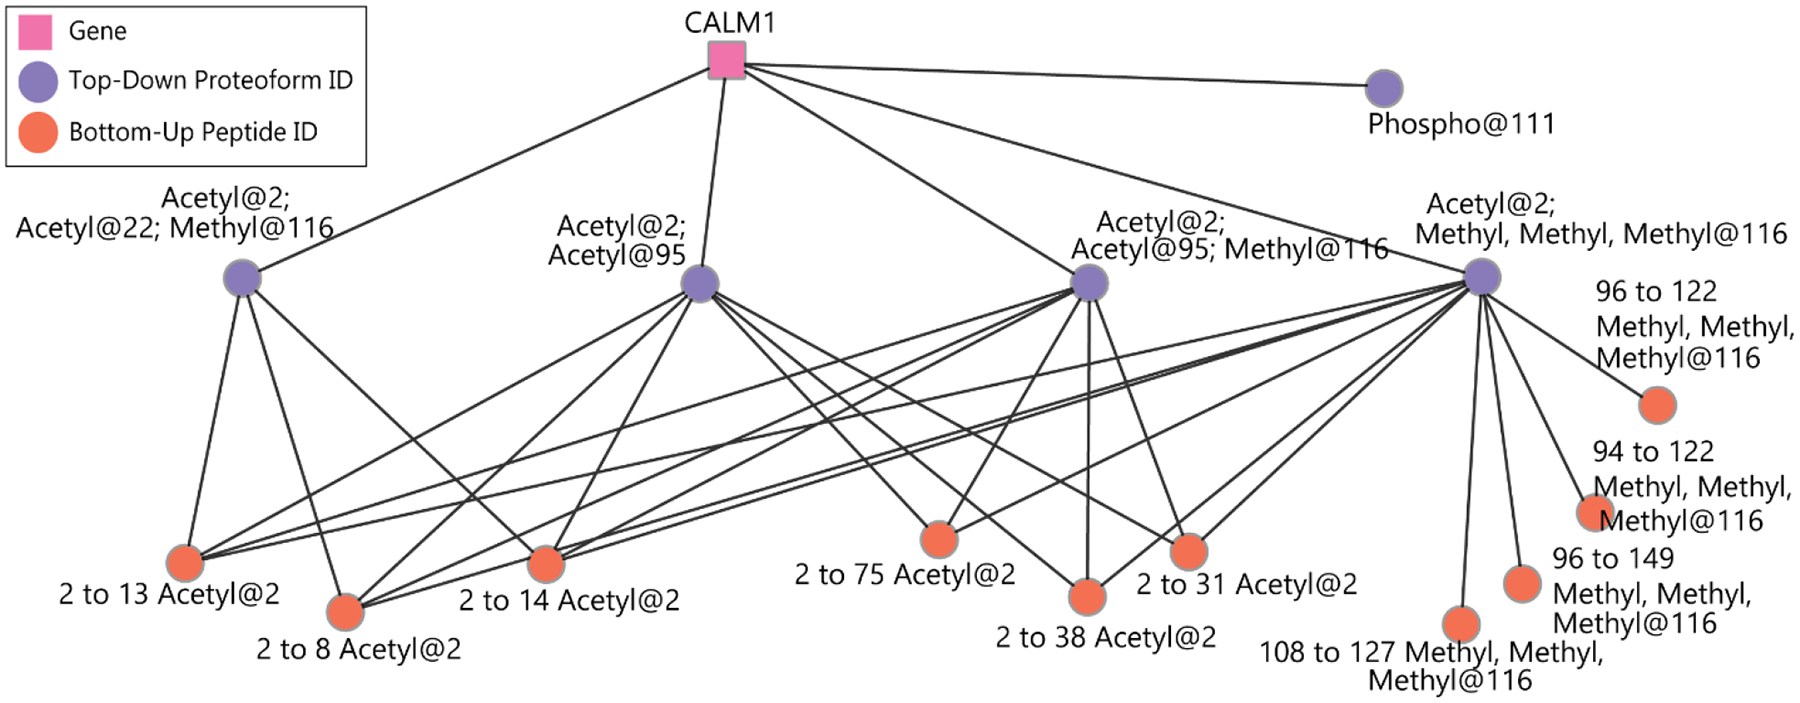
Visualization of relationships between modified bottom-up peptide and proteoform identifications. Each orange node is a unique peptide identification and each purple node is a proteoform identification. Edges are drawn between each peptide and the proteoforms from which it could be derived based on sequence and modifications. The notation used to specify peptide identities is as follows: “2 to 13 Acetyl@2”, refers to a peptide starting at the 2nd residue of the protein and ending after the 13th residue (12 amino acids in length); and with an acetyl group present on that 2nd residue (in this case an N-terminal acetylation of the peptide).
Using bottom-up to improve proteoform identification in top-down
We determined the overlap of PTM identification and localization between the bottom-up and top-down analysis of Jurkat lysate (displayed in Supporting Table S2). Of the 3603 level 1 proteoform identifications, 137 proteoforms were unmodified, 325 proteoforms had all PTMs and PTM localizations confirmed by bottom-up analysis, and 787 proteoforms had some of their modifications confirmed by bottom-up. There were 1651 proteoforms with bottom-up peptide sequence evidence but no modifications confirmed by bottom-up. The remaining 703 proteoforms had no bottom-up peptide evidence. It is useful to know for proteoform identifications and modifications of interest whether the modification and its localization was confirmed in both bottom-up and top-down data, and Proteoform Suite’s automated integration facilitates this analysis. The ability to easily observe which peptides were identified from each proteoform, including the annotated sequences for both peptide and proteoform identifications, enables researchers to manually inspect and validate identifications using the additional bottom-up evidence.
The bottom-up data is particularly useful for evaluating ambiguous proteoform identifications. Proteoform Suite displays and exports a .tsv file containing the bottom-up peptide evidence for each ambiguous proteoform identification, allowing the user to determine whether one of the potential proteoform identifications is supported by more bottom-up evidence than the other. There were 618 ambiguous proteoforms where the different potential proteoform identifications were supported by differing numbers of corresponding bottom-up peptides. Of these ambiguous proteoforms, there were 240 modified proteoforms where only some of the modification localizations were supported by bottom-up peptide evidence.
We further investigated these cases to see if there were examples where bottom-up evidence could be used to disambiguate an ambiguous proteoform identification by localizing a PTM. Two examples are shown in Figure 6. There was a proteoform identified from the DBI gene with insufficient b-ion sequence coverage to localize an acetyl modification; a bottom-up peptide from the N-terminus of this proteoform was identified with the acetylation successfully localized to the N-terminus. In another example, a HIST2H3A proteoform had an acetylation localized but a nearby methylation was ambiguous between two adjacent residues. A bottom-up peptide from this proteoform was identified containing both the methylated residue and the acetylated residue, providing strong evidence that the methylation on this proteoform is at the 37th amino acid.
Figure 6.
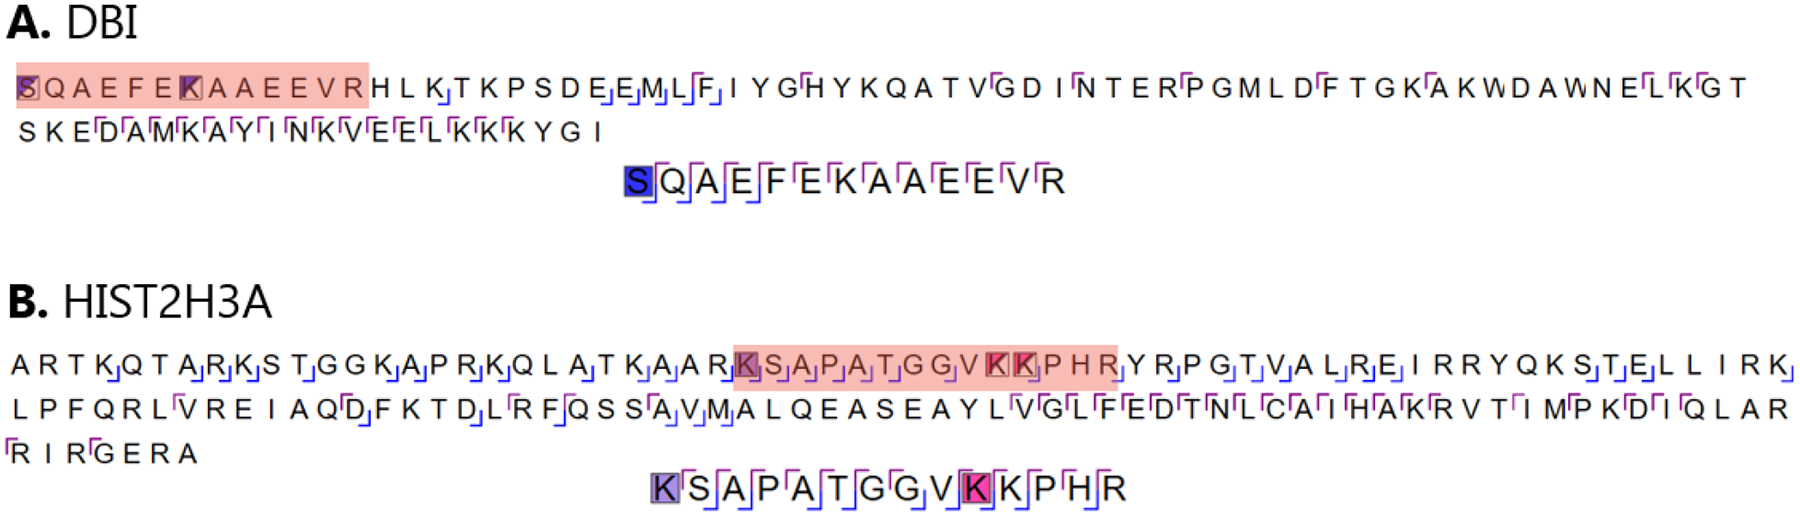
Integration of top-down and bottom-up data to aid in PTM localization. The bottom-up identified peptide sequence is highlighted in the proteoform sequence in orange. A. The acetylation in a proteoform from the DBI gene was not localized between two UniProt annotated positions (S2 and K8). Bottom-up identified a peptide from the N-terminus with the acetylation localized (S2). B. An ambiguous proteoform identification from HIST2H3A localized a dimethyl PTM group (K28) but a methylation was not localized (K37 or K38); bottom-up analysis identified a peptide with both PTMs co-localized (dimethyl at K28 and methyl at K37).
We note that a major limitation of bottom-up proteomics with regard to proteoform identification results from the fact that the original proteoform molecule has been digested into peptides. Therefore, it cannot truly be known whether this specific peptide is derived from the identified proteoform or whether there is a different unidentified or undetected proteoform containing these modified residues. The peptide may be derived from a proteoform with a different combination of modifications on other regions of the sequence not covered by the peptide. This issue is more pronounced for ultra-modified proteoforms such as histones, which contain many different combinations of modifications. Nevertheless, the bottom-up data adds weight to the probability of the corresponding proteoform identification being correct. In future work we hope to be able to develop a sound statistical framework for the calculation of such probabilities, but in the absence of such statistical metrics the use of this capability is presently as a subjective aid. Although currently this analysis requires manual inspection of the bottom-up and top-down annotated sequences, in future work we hope to also automate this process and reflect the results in the proteoform level schema reporting.
Using top-down to improve protein parsimony in bottom-up
In bottom-up proteomic analyses, proteins must be inferred based on the peptides identified. A parsimonious strategy is utilized for protein inference by MetaMorpheus, meaning that the simplest list of proteins is determined based on the peptides identified.24 For example, if peptide A could be from protein A, B, or C and peptide B could be from protein A or B, then the final reported protein group will be A and B. Protein C will have been parsed out, and there are no additional unique peptides to differentiate the protein group between A and B.
After integrating bottom-up and top-down data in Proteoform Suite, we sought cases where top-down identifications could reduce the ambiguity of protein inference by identifying a proteoform from one of the proteins in the protein group. There were 4335 shared peptides; 186 of which belonged to an ambiguous protein group that could not be disambiguated based on the peptides identified (Supporting Table S3). There were 46 ambiguous protein groups, where all identified peptides were shared between more than one protein. In two of these protein groups, there was top-down evidence for one of the proteins in the protein group and not the other (Figure 7). Each of these protein groups contained two proteins; the bottom-up peptides were shared because they were from regions of the protein sequences that were identical between the two proteins in the protein group. A proteoform was identified in top-down analysis for one of the two proteins, with MS2 sequence coverage crossing the region of the sequence differing between the two proteins in the protein group. We note that we cannot conclude that the protein without top-down evidence is necessarily not present in the sample; however, we can conclude that the protein with top-down evidence is present.
Figure 7.
Examples where top-down differentiated between ambiguous proteins in a protein group identified by bottom-up analysis. The yellow highlighted regions show the region of the protein sequence that differ. The orange highlighted region shows the region of the sequence where a bottom-up peptide was identified.
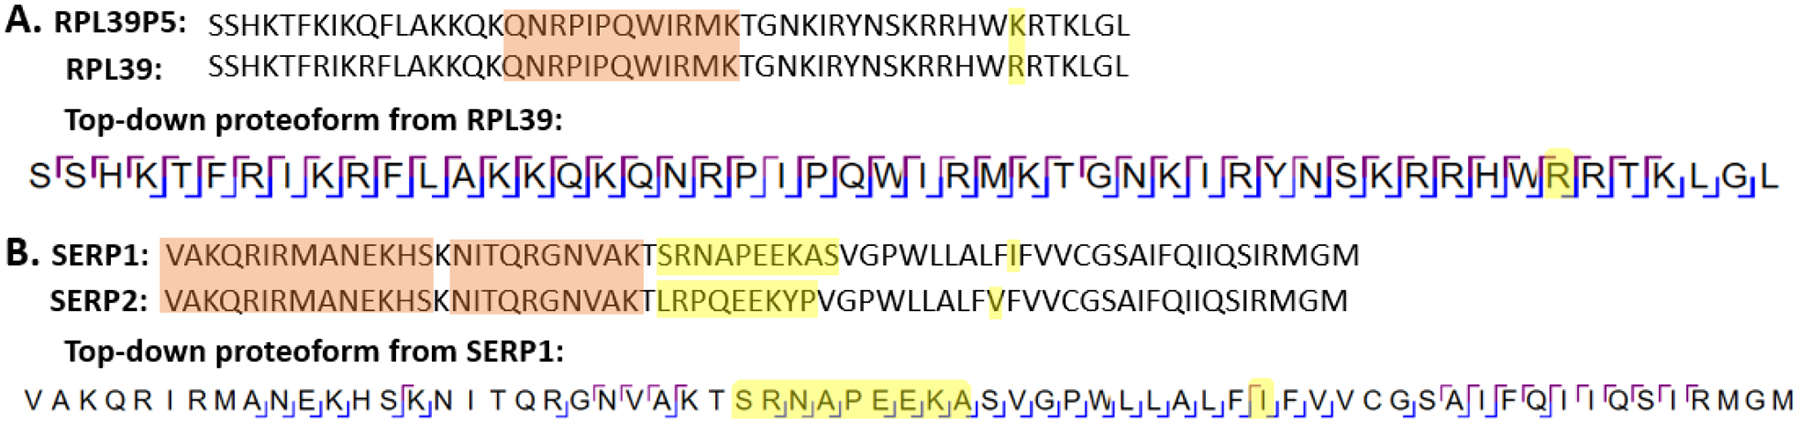
We next sought to determine whether there were cases where bottom-up protein parsimony parsed out a protein that did have top-down protein evidence. We ran a MetaMorpheus bottom-up search with the same parameters described in the Materials and Methods section but without protein parsimony. There were 17 proteins with top-down-level proteoform evidence that had been parsed out by bottom-up protein parsimony. We further investigated this list for examples where the top-down sequence coverage was strong and covered the areas of the protein that disambiguated it from other proteins in the same original protein group. We found an interesting example in the three proteins from the family of genes for ORM-like proteins. Bottom-up analysis identified two peptides from this family, including one peptide from a sequence present in all three and one peptide from a sequence only present in ORM-like protein 1 and ORM-like 3; due to protein parsimony rules, ORM-like protein 2 was parsed out. The other peptide could not differentiate between ORM-like protein 1 and ORM-like protein 3, so a protein group with these two proteins was reported in the parsimonious bottom-up search. However, we identified a top-down proteoform from each of these three proteins with MS2 sequence coverage crossing the portions of the sequence that differ between the three proteins (Figure 8). These examples show how parsimony is an imperfect process that can be aided at times with top-down proteoform analysis.
Figure 8.
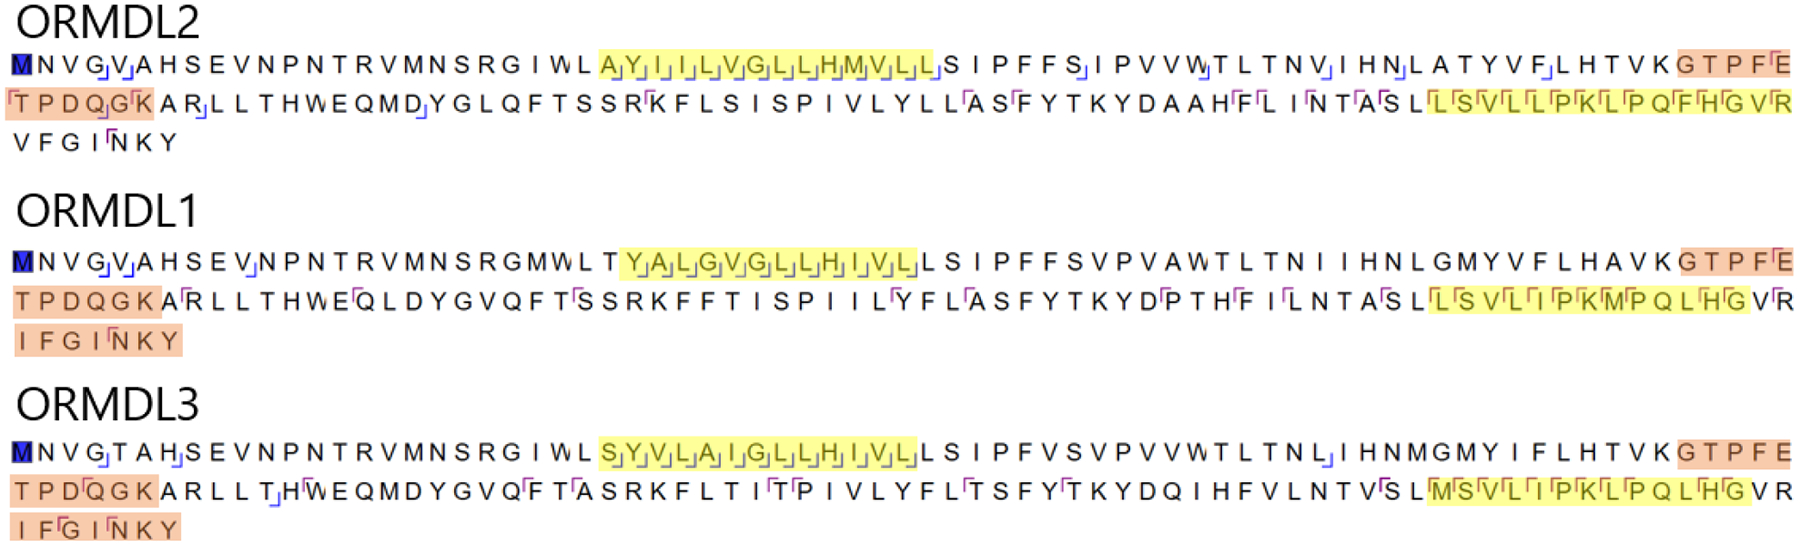
Annotated sequence coverage for three identified top-down proteoforms. Yellow highlighted regions represent main regions of the three different proteins that differ. Orange highlighted regions show the regions of the sequence where a bottom-up peptide was identified. In the bottom-up protein parsimony analysis, ORMDL2 was parsed out and a protein group with ORMDL1 and ORMDL3 was reported. However, top-down identified a proteoform for each of these three proteins.
Inference of Potential Proteoform Candidates with Bottom-Up Evidence
We sought to use the bottom-up evidence to infer a list of potential proteoform candidates for which there is bottom-up evidence but that were not identified by top-down analysis (Figure 3). For example, if a peptide is identified from protein A and that same peptide is observed with an acetylation, those two peptides could not be derived from the same proteoform and thus there is evidence for two separate proteoforms in the sample. We employ here a parsimony strategy similar to that used in bottom-up proteomics for protein inference to infer the presence of potential proteoform candidates.33 We refer to these proteoforms as potential proteoform candidates until they are either confirmed by top-down or at least observed at the intact protein MS1-level.
Using the process described in the Materials and Methods section, we determined that there was bottom-up evidence for 9133 distinct proteoforms (Supporting Table S4); 171 of these proteoforms were determined in the top-down analysis to be level 1 unambiguous proteoform identifications. There were an additional 28 potential proteoform candidates which were identified ambiguously (level 2 or higher) in the top-down analysis. We compared the list of 9133 inferred potential proteoforms with a previously acquired list of deconvoluted proteoforms from MS1-only spectra obtained from NeuCode-labeled Jurkat lysate.19 There were 108 intact-mass observations that were within 5 ppm and with the same lysine count as one of the potential proteoform candidates with bottom-up evidence. Of these 108 proteoform observations, 41 were proteoforms that had not been identified by top-down analysis, and therefore are additional intact-mass proteoform identifications (Supporting Table S5). This analysis shows how the list of potential proteoforms informed by bottom-up data combined with MS1 intact-mass analysis can identify additional proteoforms over traditional top-down analysis alone.
Previous studies have used quantitative bottom-up data to infer the presence of proteoforms based on quantified peptides.29, 30 Due to the higher sensitivity of bottom-up proteomics, there are many more potential proteoform candidates supported by such bottom-up evidence than are identified by top-down. However, the bottom-up analysis in this study did not employ any PTM enrichment methods which limited the number of identified modified peptides and thereby prevented inference of corresponding modified potential proteoform candidates. Additionally, proteoforms with combinations of modifications on different regions of the sequence could not be inferred with bottom-up analysis.
A list of such candidates generated by large-scale bottom-up analysis of a complex system provides a defined set of potential proteoforms, which can be used to identify additional proteoforms by intact-mass analysis using MS1 data. Additionally, these candidates can be targeted for identification in subsequent MS2 top-down analyses, providing a valuable tool for targeted experiments seeking to increase proteome coverage.
CONCLUSIONS
We augmented the software program Proteoform Suite to enable the large-scale integration of bottom-up and top-down proteomics data. We used this integration strategy to determine cases where bottom-up could help localize a PTM site on a proteoform and where top-down could improve protein inference in bottom-up. Additionally, Proteoform Suite reveals how many identified proteoforms can be the source of each peptide, and implements the visualization of these results. Finally, Proteoform Suite generates a list of inferred potential proteoforms based upon bottom-up evidence for their sequence and PTMs, allowing additional proteoform identifications to be made based upon MS1 intact mass determinations. Proteoform Suite provides a versatile tool for making use of the synergies between bottom-up and top-down data to improve proteoform analysis in complex systems.
Supplementary Material
ACKNOWLEDGMENTS
L.M.S. was supported by the National Institute of General Medical Sciences of the National Institutes of Health (NIH) under Award Number R35GM126914. L.V.S., R.J.M., and M.R.S. were supported by the National Institute of Biomedical Imaging and Bioengineering of the NIH under Award Number R01EB025268. We thank Caitlin Pavelec and Yuling Dai for contributions to sample preparation.
Footnotes
Supporting Information. Table S-1, Bottom-up identified peptides; Table S-2, Top-down identified proteoforms; Table S-3, Bottom-up shared peptides; Table S-4, Potential proteoform candidates; Table S-5, Intact-mass matched potential proteoform candidates.
The authors declare no competing financial interests.
REFERENCES
- 1.Smith LM; Kelleher NL; Consortium for Top Down Proteomics, Proteoform: a single term describing protein complexity. Nat Methods 2013, 10, (3), 186–7. [DOI] [PMC free article] [PubMed] [Google Scholar]
- 2.Santos-Rosa H; Kirmizis A; Nelson C; Bartke T; Saksouk N; Cote J; Kouzarides T, Histone H3 tail clipping regulates gene expression. Nat Struct Mol Biol 2009, 16, (1), 17–22. [DOI] [PMC free article] [PubMed] [Google Scholar]
- 3.Yang X; Coulombe-Huntington J; Kang S; Sheynkman GM; Hao T; Richardson A; Sun S; Yang F; Shen YA; Murray RR; Spirohn K; Begg BE; Duran-Frigola M; MacWilliams A; Pevzner SJ; Zhong Q; Trigg SA; Tam S; Ghamsari L; Sahni N; Yi S; Rodriguez MD; Balcha D; Tan G; Costanzo M; Andrews B; Boone C; Zhou XJ; Salehi-Ashtiani K; Charloteaux B; Chen AA; Calderwood MA; Aloy P; Roth FP; Hill DE; Iakoucheva LM; Xia Y; Vidal M, Widespread Expansion of Protein Interaction Capabilities by Alternative Splicing. Cell 2016, 164, (4), 805–17. [DOI] [PMC free article] [PubMed] [Google Scholar]
- 4.Han X; Aslanian A; Yates JR 3rd, Mass spectrometry for proteomics. Curr Opin Chem Biol 2008, 12, (5), 483–90. [DOI] [PMC free article] [PubMed] [Google Scholar]
- 5.Kong AT; Leprevost FV; Avtonomov DM; Mellacheruvu D; Nesvizhskii AI, MSFragger: ultrafast and comprehensive peptide identification in mass spectrometry-based proteomics. Nat Methods 2017, 14, (5), 513–520. [DOI] [PMC free article] [PubMed] [Google Scholar]
- 6.Li Q; Shortreed MR; Wenger CD; Frey BL; Schaffer LV; Scalf M; Smith LM, Global Post-Translational Modification Discovery. J Proteome Res 2017, 16, (4), 1383–1390. [DOI] [PMC free article] [PubMed] [Google Scholar]
- 7.Solntsev SK; Shortreed MR; Frey BL; Smith LM, Enhanced Global Post-translational Modification Discovery with MetaMorpheus. J Proteome Res 2018, 17, (5), 1844–1851. [DOI] [PubMed] [Google Scholar]
- 8.Nesvizhskii AI; Aebersold R, Interpretation of shotgun proteomic data: the protein inference problem. Mol Cell Proteomics 2005, 4, (10), 1419–40. [DOI] [PubMed] [Google Scholar]
- 9.Schaffer LV; Millikin RJ; Miller RM; Anderson LC; Fellers RT; Ge Y; Kelleher NL; LeDuc RD; Liu X; Payne SH; Sun L; Thomas PM; Tucholski T; Wang Z; Wu S; Wu Z; Yu D; Shortreed MR; Smith LM, Identification and Quantification of Proteoforms by Mass Spectrometry. Proteomics 2019, e1800361. [DOI] [PMC free article] [PubMed] [Google Scholar]
- 10.Chen B; Brown KA; Lin Z; Ge Y, Top-Down Proteomics: Ready for Prime Time? Anal Chem 2018, 90, (1), 110–127. [DOI] [PMC free article] [PubMed] [Google Scholar]
- 11.Cai W; Tucholski TM; Gregorich ZR; Ge Y, Top-down Proteomics: Technology Advancements and Applications to Heart Diseases. Expert Rev Proteomics 2016, 13, (8), 717–30. [DOI] [PMC free article] [PubMed] [Google Scholar]
- 12.Toby TK; Fornelli L; Kelleher NL, Progress in Top-Down Proteomics and the Analysis of Proteoforms. Annu Rev Anal Chem (Palo Alto Calif) 2016, 9, (1), 499–519. [DOI] [PMC free article] [PubMed] [Google Scholar]
- 13.Compton PD; Zamdborg L; Thomas PM; Kelleher NL, On the scalability and requirements of whole protein mass spectrometry. Anal Chem 2011, 83, (17), 6868–74. [DOI] [PMC free article] [PubMed] [Google Scholar]
- 14.Smith LM; Thomas PM; Shortreed MR; Schaffer LV; Fellers RT; LeDuc RD; Tucholski T; Ge Y; Agar JN; Anderson LC; Chamot-Rooke J; Gault J; Loo JA; Pasa-Tolic L; Robinson CV; Schluter H; Tsybin YO; Vilaseca M; Vizcaino JA; Danis PO; Kelleher NL, A five-level classification system for proteoform identifications. Nat Methods 2019, 16, (10), 939–940. [DOI] [PMC free article] [PubMed] [Google Scholar]
- 15.Wu S; Yang F; Zhao R; Tolic N; Robinson EW; Camp DG 2nd; Smith RD; Pasa-Tolic L, Integrated workflow for characterizing intact phosphoproteins from complex mixtures. Anal Chem 2009, 81, (11), 4210–9. [DOI] [PMC free article] [PubMed] [Google Scholar]
- 16.Wu S; Lourette NM; Tolic N; Zhao R; Robinson EW; Tolmachev AV; Smith RD; Pasa-Tolic L, An integrated top-down and bottom-up strategy for broadly characterizing protein isoforms and modifications. J Proteome Res 2009, 8, (3), 1347–57. [DOI] [PMC free article] [PubMed] [Google Scholar]
- 17.VerBerkmoes NC; Bundy JL; Hauser L; Asano KG; Razumovskaya J; Larimer F; Hettich RL; Stephenson JL Jr., Integrating ‘top-down” and “bottom-up” mass spectrometric approaches for proteomic analysis of Shewanella oneidensis. J Proteome Res 2002, 1, (3), 239–52. [DOI] [PubMed] [Google Scholar]
- 18.Dai Y; Shortreed MR; Scalf M; Frey BL; Cesnik AJ; Solntsev S; Schaffer LV; Smith LM, Elucidating Escherichia coli Proteoform Families Using Intact-Mass Proteomics and a Global PTM Discovery Database. J Proteome Res 2017, 16, (11), 4156–4165. [DOI] [PMC free article] [PubMed] [Google Scholar]
- 19.Dai Y; Buxton KE; Schaffer LV; Miller RM; Millikin RJ; Scalf M; Frey BL; Shortreed MR; Smith LM, Constructing Human Proteoform Families Using Intact-Mass and Top-Down Proteomics with a Multi-Protease Global Post-Translational Modification Discovery Database. J Proteome Res 2019, 18, (10), 3671–3680. [DOI] [PMC free article] [PubMed] [Google Scholar]
- 20.Ntai I; LeDuc RD; Fellers RT; Erdmann-Gilmore P; Davies SR; Rumsey J; Early BP; Thomas PM; Li S; Compton PD; Ellis MJ; Ruggles KV; Fenyo D; Boja ES; Rodriguez H; Townsend RR; Kelleher NL, Integrated Bottom-Up and Top-Down Proteomics of Patient-Derived Breast Tumor Xenografts. Mol Cell Proteomics 2016, 15, (1), 45–56. [DOI] [PMC free article] [PubMed] [Google Scholar]
- 21.Schaffer LV; Rensvold JW; Shortreed MR; Cesnik AJ; Jochem A; Scalf M; Frey BL; Pagliarini DJ; Smith LM, Identification and Quantification of Murine Mitochondrial Proteoforms Using an Integrated Top-Down and Intact-Mass Strategy. J Proteome Res 2018, 17, (10), 3526–3536. [DOI] [PMC free article] [PubMed] [Google Scholar]
- 22.Sheynkman GM; Shortreed MR; Frey BL; Scalf M; Smith LM, Large-scale mass spectrometric detection of variant peptides resulting from nonsynonymous nucleotide differences. J Proteome Res 2014, 13, (1), 228–40. [DOI] [PMC free article] [PubMed] [Google Scholar]
- 23.Sheynkman GM; Shortreed MR; Frey BL; Smith LM, Discovery and mass spectrometric analysis of novel splice-junction peptides using RNA-Seq. Mol Cell Proteomics 2013, 12, (8), 2341–53. [DOI] [PMC free article] [PubMed] [Google Scholar]
- 24.Miller RM; Millikin RJ; Hoffmann CV; Solntsev SK; Sheynkman GM; Shortreed MR; Smith LM, Improved Protein Inference from Multiple Protease Bottom-Up Mass Spectrometry Data. J Proteome Res 2019, 18, (9), 3429–3438. [DOI] [PMC free article] [PubMed] [Google Scholar]
- 25.Abraham RT; Weiss A, Jurkat T cells and development of the T-cell receptor signalling paradigm. Nat Rev Immunol 2004, 4, (4), 301–8. [DOI] [PubMed] [Google Scholar]
- 26.Tran JC; Doucette AA, Gel-eluted liquid fraction entrapment electrophoresis: an electrophoretic method for broad molecular weight range proteome separation. Anal Chem 2008, 80, (5), 1568–73. [DOI] [PubMed] [Google Scholar]
- 27.Shortreed MR; Wenger CD; Frey BL; Sheynkman GM; Scalf M; Keller MP; Attie AD; Smith LM, Global Identification of Protein Post-translational Modifications in a Single-Pass Database Search. J Proteome Res 2015, 14, (11), 4714–20. [DOI] [PMC free article] [PubMed] [Google Scholar]
- 28.Smith LM; Thomas PM; Shortreed MR; Schaffer LV; Fellers RT; LeDuc RD; Tucholski T; Ge Y; Agar JN; Anderson LC; Chamot-Rooke J; Gault J; Loo JA; Pasa-Tolic L; Robinson CV; Schluter H; Tsybin YO; Vilaseca M; Vizcaino JA; Danis PO; Kelleher NL, A five-level classification system for proteoform identifications. Nat Methods 2019. [DOI] [PMC free article] [PubMed] [Google Scholar]
- 29.Bamberger C; Martinez-Bartolome S; Montgomery M; Pankow S; Hulleman JD; Kelly JW; Yates JR 3rd, Deducing the presence of proteins and proteoforms in quantitative proteomics. Nat Commun 2018, 9, (1), 2320. [DOI] [PMC free article] [PubMed] [Google Scholar]
- 30.Malioutov D; Chen T; Airoldi E; Jaffe J; Budnik B; Slavov N, Quantifying Homologous Proteins and Proteoforms. Mol Cell Proteomics 2019, 18, (1), 162–168. [DOI] [PMC free article] [PubMed] [Google Scholar]
- 31.Shannon P; Markiel A; Ozier O; Baliga NS; Wang JT; Ramage D; Amin N; Schwikowski B; Ideker T, Cytoscape: a software environment for integrated models of biomolecular interaction networks. Genome Res 2003, 13, (11), 2498–504. [DOI] [PMC free article] [PubMed] [Google Scholar]
- 32.Rinner O; Mueller LN; Hubalek M; Muller M; Gstaiger M; Aebersold R, An integrated mass spectrometric and computational framework for the analysis of protein interaction networks. Nat Biotechnol 2007, 25, (3), 345–52. [DOI] [PubMed] [Google Scholar]
- 33.Lee JY; Choi H; Colangelo CM; Davis D; Hoopmann MR; Kall L; Lam H; Payne SH; Perez-Riverol Y; The M; Wilson R; Weintraub ST; Palmblad M, ABRF Proteome Informatics Research Group (iPRG) 2016 Study: Inferring Proteoforms from Bottom-up Proteomics Data. J Biomol Tech 2018, 29, (2), 39–45. [DOI] [PMC free article] [PubMed] [Google Scholar]
Associated Data
This section collects any data citations, data availability statements, or supplementary materials included in this article.