

Abstract
HIV-1 capsid plays multiple key roles in viral replication, and inhibition of capsid assembly is an attractive target for therapeutic intervention. Here, we report the atomic-resolution structure of the capsid protein (CA) tubes, determined by magic-angle-spinning NMR and data-guided molecular dynamics simulations. Functionally important regions, including the NTD β-hairpin, the cyclophilin A loop, residues in the hexamer center pore, and the NTD-CTD linker region, are well defined. The structure of individual CA chains, their arrangement in the pseudo-hexameric units of the tube and the inter-hexamer interfaces are consistent with those in intact capsid cores and substantially different from the organization in crystal structures, which featured flat hexamers. The inherent curvature in the CA tubes is controlled by conformational variability of residues in the linker region and of dimer and trimer interfaces. The present structure reveals atomic-level detail into capsid architecture and provides important guidance for the design of novel capsid inhibitors.
Within the HIV-1 virion, the RNA genome is packaged inside a proteinaceous shell, the HIV-1 capsid core, comprised of 1000–1500 molecules of the capsid protein (CA)1–4. The capsid core (or capsid) is critically involved throughout all steps of the replication cycle5. Capsid plays pivotal roles in how the virus negotiates the treacherous race through the cellular cytoplasm towards the nucleus, such as in uncoating6, recognition by host factors7–10, trafficking along microtubules11,12, nuclear import13,14 and genome integration15. Its integrity and characteristics are indispensable for the fitness of the virus, protecting the genome from premature detection and destruction in the host cell6–10,16. These diverse functions require an intricate interplay between the structural and dynamic properties of the capsid, necessary for its overall architecture and optimally balanced stability17.
CA, a 231-residue α-helical protein, possesses two independently folded N-terminal and C-terminal domains (NTD and CTD), joined by a flexible linker18. The NTD β-hairpin (residues 1–13) is critical for capsid assembly19. The cyclophilin A (CypA)-binding loop (residues 83–100) is another functionally important region, which interacts with the cellular human protein cyclophilin A. CypA binding modulates viral uncoating and viral infectivity20.
The structural variability of HIV-1 conical capsid is a hallmark of HIV virions, and capsid’s inherent plasticity has hampered efforts to experimentally determine its overall structure. In solution, CA forms dimers and higher-order oligomers21. It can crystallize into hexamers22, which are flat and therefore do not recapitulate the varied curvature associated with assembled tubes or the closed cone4. In crystal structures of CA, the β-hairpin can adopt different conformations, rendering the hexamer pore either open or closed22,23.
CA can also assemble into tubes in vitro, exhibiting varying helical symmetries4,18. Tubes possess several structural parameters similar to those of conical capsids4. In tubes, the NTDs are located on the outer surface in an pseudo-hexameric arrangement, with hexamers connected on the inside via CTD dimers. The average CA tube diameter is similar to that of CA cones4. Structural similarity between in vitro assembled tubes and conical capsid cores has inspired several groups, including ours, to use tubular assemblies as valuable models for conical capsids4,24,25. An all-atom model of a HIV-1 conical capsid core was generated, integrating cryo-EM, solution NMR and MD simulations4. Other recent studies have also provided further details on the architecture of CA in HIV-1 capsid26.
Here, we report the atomic-resolution structure of CA tubes, determined by magic-angle-spinning (MAS) NMR spectroscopy integrated with low-resolution cryo-EM data and molecular dynamics (MD) simulations. The structure of a single polypeptide chain was calculated using 1,311 non-redundant C-C and N-C distance and 390 torsion angle restraints. An atomic-resolution structure of the CA hexamer was derived by integrating the NMR restraints and the low-resolution (8.0 Å) electron density map of a CA hexamer unit from tubular assemblies. The final structure of a CA tube was determined by data-guided MD simulations. The structure of the CA tubular assembly presented here provides critical information, including conformations of the functionally important regions, which were inaccessible from the X-ray and cryo-EM structures reported previously4,26, due to static conformational heterogeneity or motions. The structure of individual CA chains, their arrangement in the pseudo-hexamers as well as the unique details at the dimer and trimer interfaces in the tube are substantially different from those of CA in crystals comprised of flat hexamers22. The N-terminal β-hairpin, the CypA-binding loop, the key residues in the center cavity of the hexamer, the flexible linker region, and the dynamically disordered CTD tail are clearly defined from the experimental NMR restraints. Moreover, the integration of MAS NMR experiments and data-guided MD simulations with rigorous model-free statistical analysis permitted assessment of distinct conformational clusters in these regions, denoting their relative populations. The conformational heterogeneity, captured here with atomic-level detail, appears to be a hallmark of CA assemblies and the key ingredient underlying the capsid’s structural plasticity.
RESULTS
Distance restraints
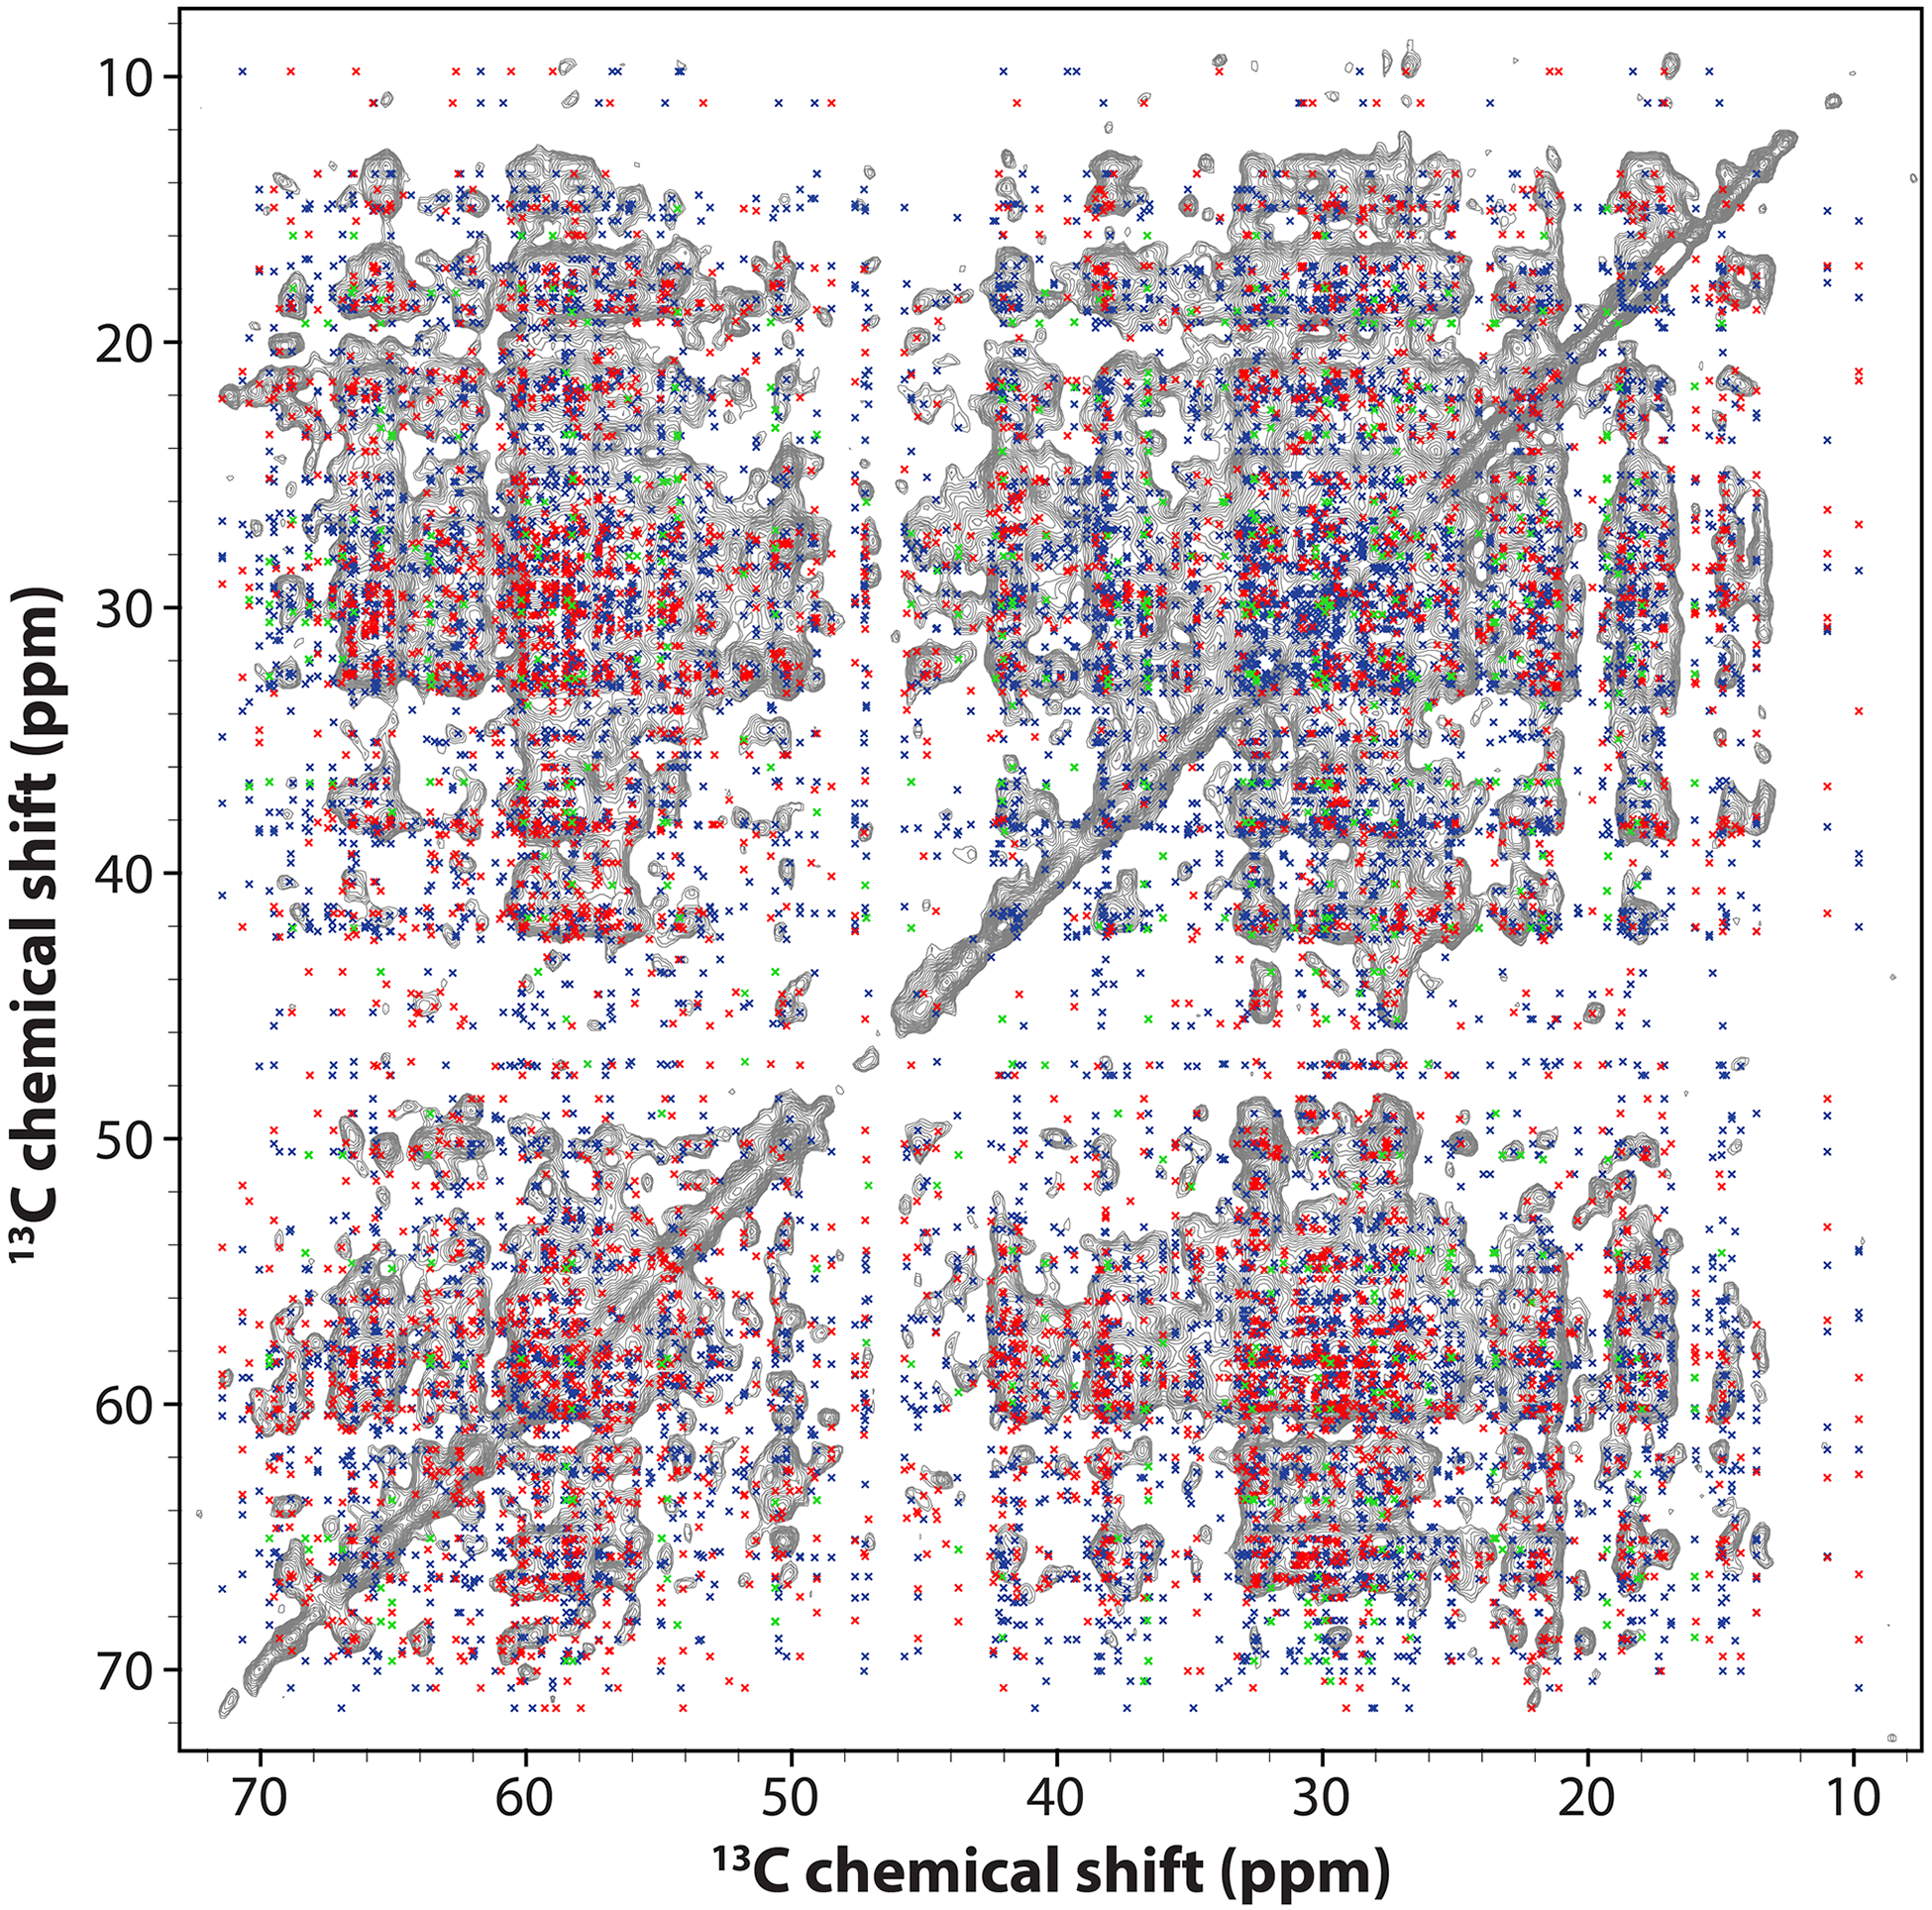
Tubular CA assemblies yield remarkably high-resolution MAS-NMR spectra24,25, which permitted large-scale resonance assignments and identification of distance restraints. Overall, we recorded 33 2D and 4 3D MAS-NMR experiments on 9 sets of samples (Supplementary Table 1). From these spectra, 8317 cross peaks were assigned (Table 1). Selected strips, extracted from 3D NCACX and NCOCX spectra, together with selected regions from 2D CORD spectra are provided in Fig. 1a,b. 13C and 15N chemical shifts were assigned for 224 residues, using 2D- and 3D homonuclear and heteronuclear correlation spectra in conjunction with previously reported assignments for HXB2 capsid tubes24. For 183 residues, complete backbone assignments were achieved. For 106 residues, backbone and side chains were fully assigned and for 223 residues, side chains were partially assigned. We could not assign chemical shifts for R167, K170, Q219, G225, K227, A228, and R229, because of either spectral overlap and/or missing resonances due to dynamic disorder. All assignments are summarized in Supplementary Fig. 1 and Table 2.
Table 1.
Summary of samples and the number of assigned peaks
| ID | Sample | Assigned peak type | No. assigned peaks* |
|---|---|---|---|
| I | U-13C,15N | Intraresidue | 3545 |
| Sequential | 606 | ||
| II | [1,6-13C]-Glucose, U-15N | Intraresidue | 1172 |
| Sequential | 243 | ||
| Medium range (1< |i-j| <5) | 166 | ||
| Long range (|i-j| ≥5) | 219 | ||
| Ambiguous | 205 | ||
| III | [2-13C]-Glucose, U-15N | Intraresidue | 628 |
| Sequential | 164 | ||
| Medium range (1< |i-j| <5) | 156 | ||
| Long range (|i-j| ≥5) | 129 | ||
| Ambiguous | 102 | ||
| IV | 13C,15N-His | Intraresidue | 80 |
| V | 13C,15N-Tyr | Intraresidue | 68 |
| VI | Mixed-13C,15N-Ala/13C,15N-Ile-1:1 | Intraresidue | 508 |
| Medium range (1< |i-j| <5) | 2 | ||
| Long range (|i-j| ≥5) | 2 | ||
| VII | Mixed-13C,15N-Ala/13C,15N-Val-1:1 | Intraresidue | 322 |
| VIII | Diluted-N.A./U-13C,15N-6:1 | For intermolecular contacts validation | |
| IX | Mixed-13C/15N-1:1 | For intermolecular contacts validation | |
| Total Assigned Peaks | 8317 | ||
Cross peaks present in different experiments are counted only once.
Figure 1 |. MAS NMR spectra and structure of the hexameric unit in CA tubular assemblies.
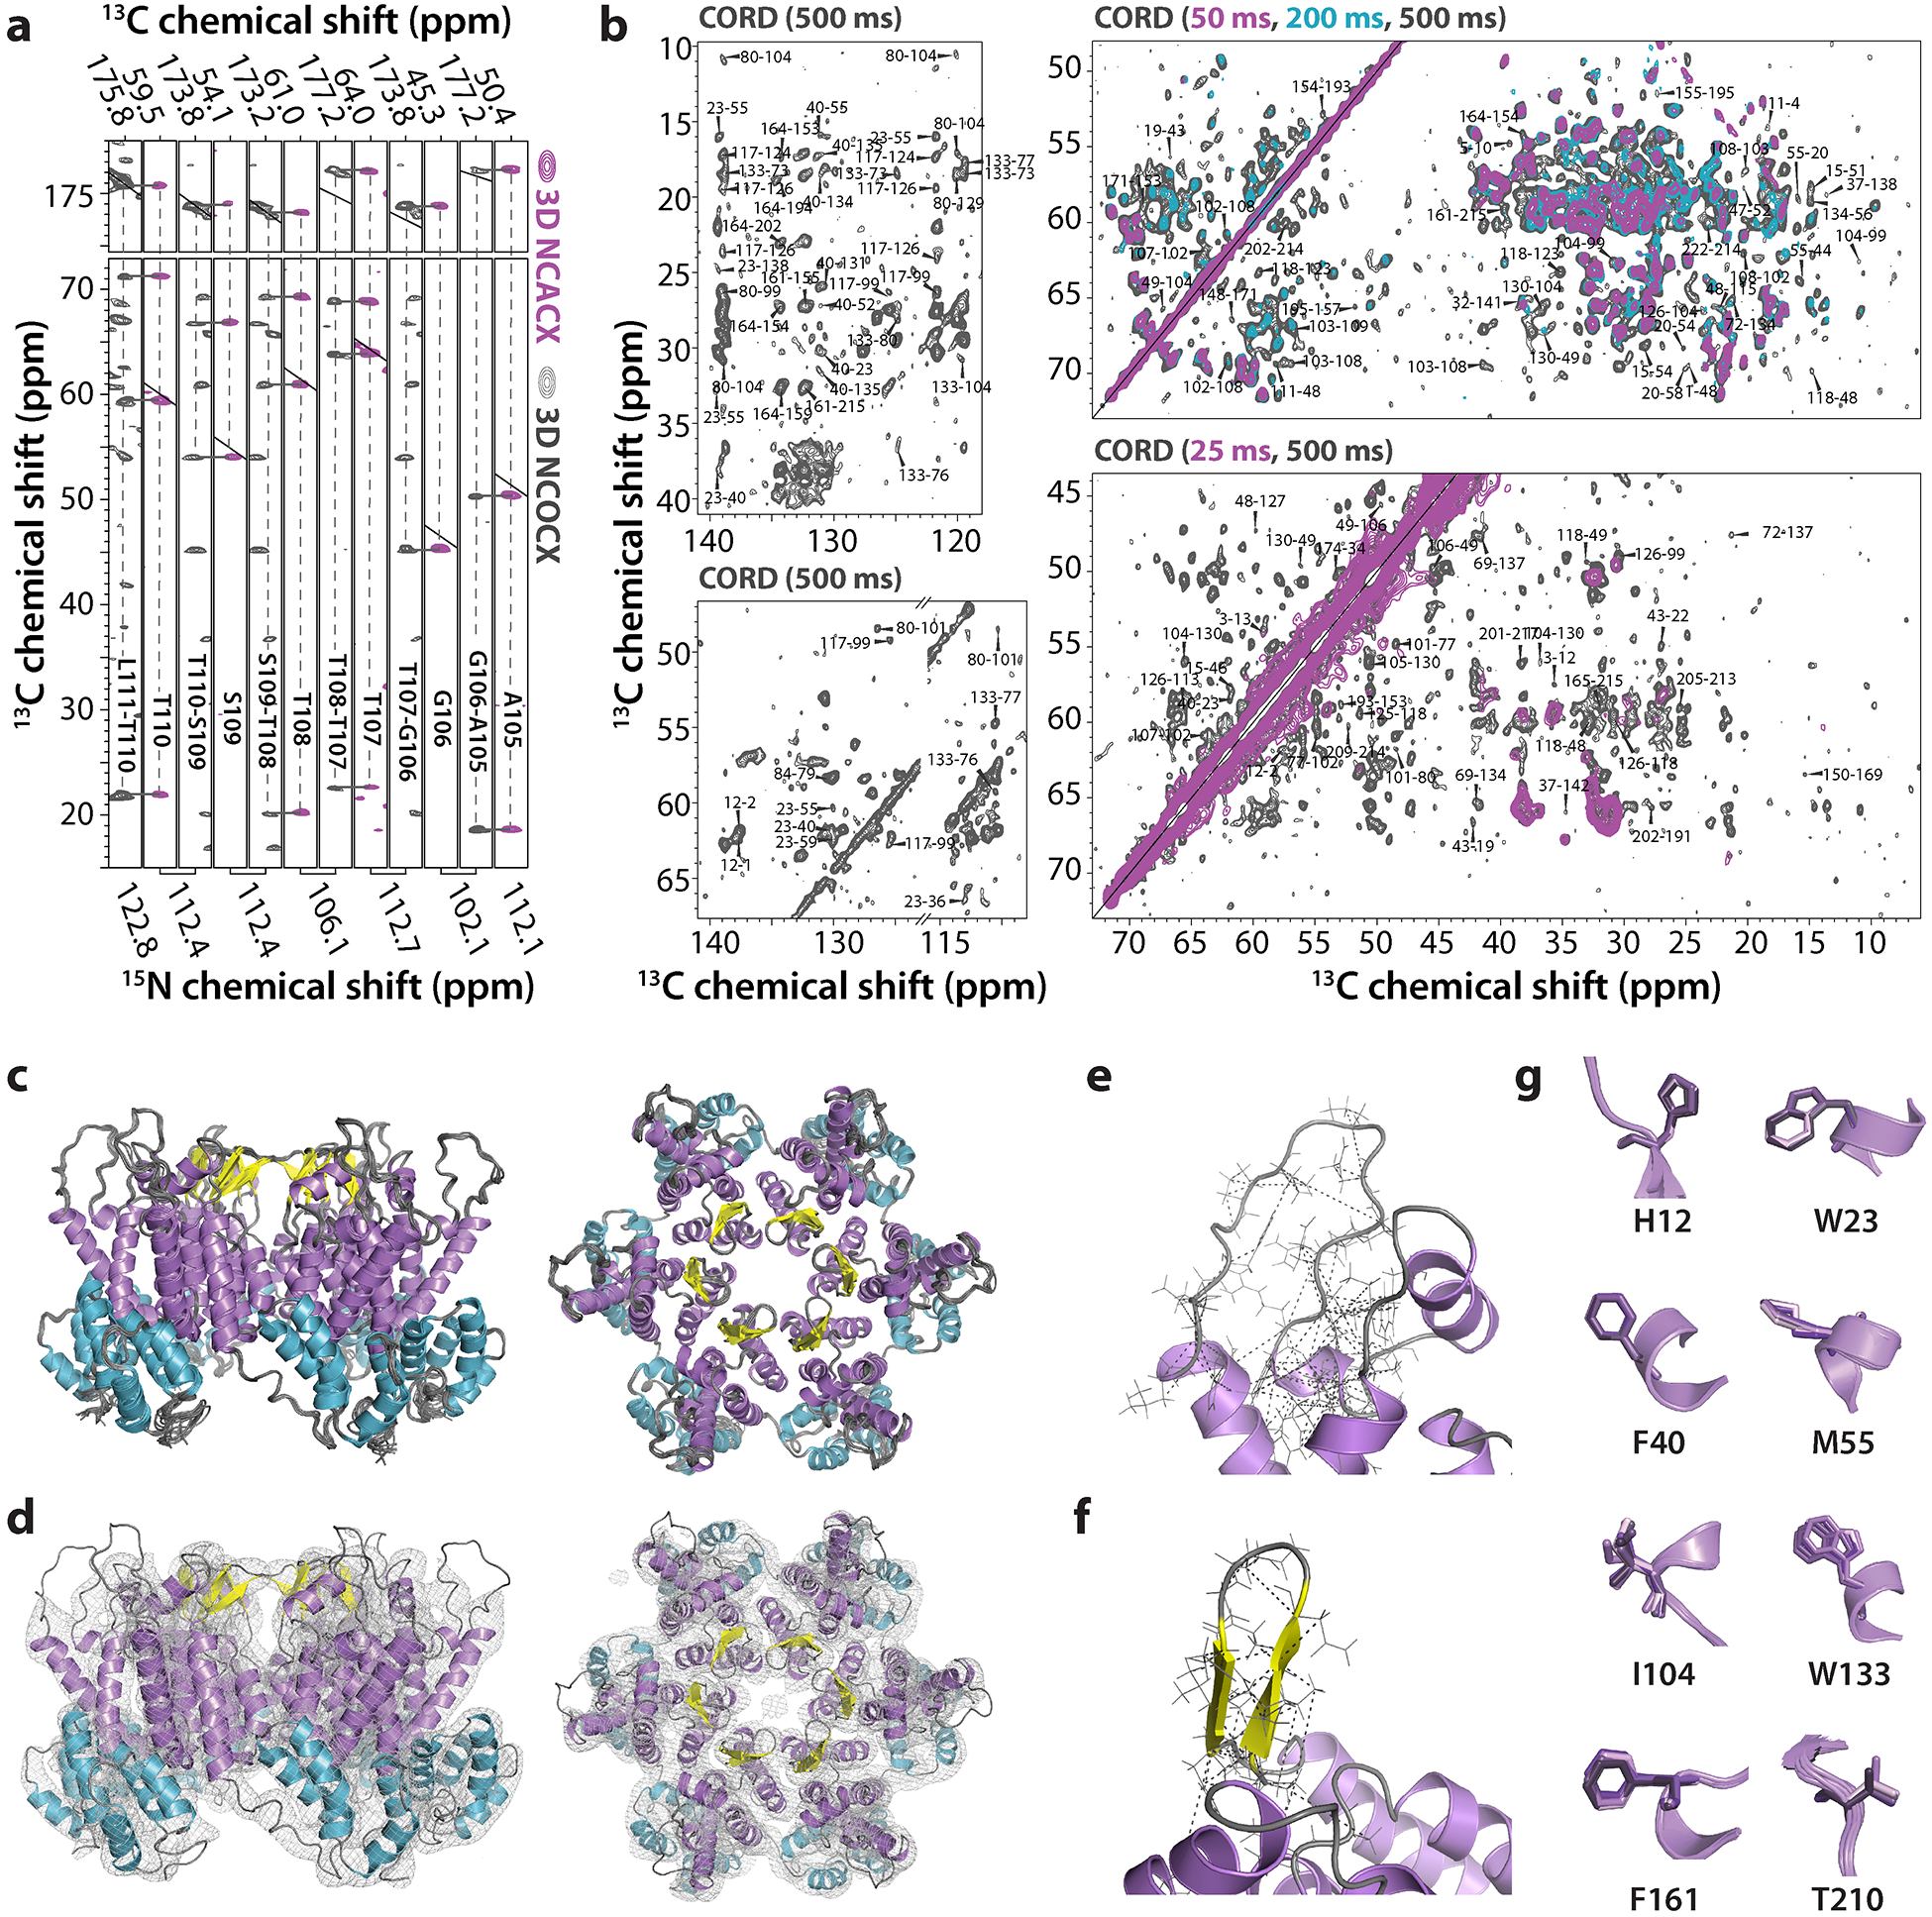
a, Representative strips extracted from 3D NCACX (magenta) and NCOCX (dark gray) spectra of U-13C,15N-enriched CA tubular assemblies, illustrating sequential assignments for residues 105–110. b, Superposition of selected regions of 2D CORD spectra of [1,6-13C-glucose,U-15N]-CA (top panels) and [2-13C-glucose,U-15N]-CA (lower panels) samples for different mixing times: 25 ms and 50 ms, magenta, 200 ms, teal and 500 ms, gray. Unambiguous correlations are labeled by amino acid number in the sequence. c, Side and top views of the final ensemble of the ten lowest energy structures of the CA hexamer unit in the tubular CA assembly. d, Side and top views of the superposition of the lowest-energy structure of the NMR-derived CA hexamer unit and the 8 Å resolution cryo-EM density map. e-f, Details of the MAS NMR-derived distance restraint network for the CypA loop and the β-hairpin, respectively. g, Selected side chain conformations in the final ten-conformer ensemble.
13C-13C distance restraints were derived from CORD spectra of [1,6-13C-glucose,U-15N]-CA and [2-13C-glucose,U-15N]-CA tubular assemblies, acquired with mixing times of 25, 50, 200, and 500 ms. As illustrated in Fig. 1b, the cross peaks are well-resolved and correspond to aromatic side chain-to-methyl, aromatic side chain-to-Cα, non-aromatic side chain-to-Cα and Cα-to-Cα contacts, associated with distances equal to or less than 7 Å. In total, 1311 non-redundant distances were extracted, 1126 of which are unambiguous. Of these, 414 are interresidue and medium-range (1<|i-j|<5) and long-range (|i-j|≥5) distances. A summary of all restraints is provided in Table 2. A plot of inter-residue contacts and the structure of a single CA chain onto which all intra-chain distances are mapped are provided in Extended Data Fig.1.
Table 2.
Summary of NMR restraints and structure statistics
| Capsid protein (BRMB 30741, PDB 6WAP, PDB 6X63) | |||
|---|---|---|---|
| NMR distance and dihedral constraints | CA FL | CA NTD | CA CTD |
| Distance constraints | |||
| Total 13C-13C distance restraints | 1311 | 994 | 311 |
| Intraresidue | 491 | 374 | 114 |
| Inter-residue | 820 | 620 | 197 |
| Sequential (|i – j| = 1) | 221 | 161 | 58 |
| Medium range (2 ≤ |i – j| ≤ 4) | 204 | 166 | 38 |
| Long range (|i – j| ≥ 5) (sidechain-sidechain) | 210 (101) | 166 (85) | 43 (16) |
| Ambiguous | 185 | 127 | 58 |
| Restraints/residue | 5.7 | 6.9 | 3.7 |
| Percent completeness | 15% | 17% | 10% |
| Total dihedral-angle restraints | |||
| ϕ | 195 | 126 | 68 |
| ψ | 195 | 126 | 68 |
| Structure statisticsa | |||
| Violations (mean ± s.d.) | |||
| Distance constraints (Å) | 0.049 ± 0.002 Å | ||
| Dihedral-angle constraints (°) | 1.076 ± 0.101° | ||
| Max. distance-constraint violation (Å) | 0.773 Å | ||
| Max. dihedral-angle violation (°) | 12.364° | ||
| Deviations from idealized geometry | |||
| Bond lengths (Å) | 0.005 ± 0.000 Å | ||
| Bond angles (°) | 0.680 ± 0.006° | ||
| Impropers (°) | 0.575 ± 0.007° | ||
| Average pairwise r.m.s. deviation (Å) | |||
| Heavy | 1.2 ± 0.1 Å | ||
| Backbone | 0.5 ± 0.1 Å | ||
Pairwise r.m.s.d. was calculated among 10 refined structures.
Structure of a single CA chain
For the entire CA chain, the available distance restraints correspond to 5.7 restraints per residue (15% completeness), divided into 6.9 restraints per residue (17% completeness) for the NTD (residues 1–145) and 3.7 restraints per residue (10% completeness) for the CTD (residues 148–231). For this degree of restraint completeness, the accuracy of a structure should be within 1–3 Å backbone RMSD of the true structure, as evaluated by model calculations with synthetic distance restraints, supplemented by TALOS-derived torsion angle restraints27. The precision of the ensemble comprising the 10 lowest-energy structures for the single CA chain, as measured by pairwise atomic backbone RMSDs for the individual domains, is 2.2±0.4 Å (NTD) and 1.8±0.5 Å (CTD) (Supplementary Table 3).
Unfortunately, very few inter-domain NTD-CTD correlations were found in the MAS-NMR spectra, severely limiting the number of distances <7 Å available to determine the relative orientation of the two domains. As a result, it was impossible to accurately place the two domains relative to each other on the basis of the NMR-derived distances alone (Extended Data Fig. 2), consistent with the known CA architecture.
Structure of a CA hexamer unit
It has long been appreciated that NMR restraints are very powerful in defining the local structure of a polypeptide chain and that cryo-EM density provides envelope information about molecular entities. Therefore, as a first measure, we devised a five-step procedure to determine the structure of a hexameric CA unit, summarized in Extended Data Fig. 3. A superposition of 10 members of the final hexamer ensemble is shown in Fig. 1c. This ensemble is well defined with pairwise atomic RMSD of 0.5±0.1 Å and 1.2±0.1 Å for backbone and heavy atoms, respectively. (All structural statistics are provided in Table 2 and Supplementary Tables 3–5). An individual NMR-derived ensemble member, superimposed on the cryo-EM map is depicted in Fig. 1d. Notably, the hexamer unit does not possess strict six-fold symmetry (most clearly evident in the top view). This is consistent with the nature of the hexameric units in a tube, which cannot be flat, given the tube’s inherent curvature.
Remarkably, certain regions, such as loops for which density is poorly defined or missing in the cryo-EM map, are well delineated in the MAS-NMR structure. This pertains to the functionally important CypA-binding loop and the C-terminal tail. Resonances for all but four amino acids in the C-terminal tail (residues 225–229) are observed and their chemical shifts have been assigned (Supplementary Table 2, Supplementary Fig. 1). In the CORD spectra, multiple correlations between CypA-binding loop resonances are present, which translate into inter-atomic contacts defining the loop conformation (Fig. 1e, Supplementary Table 6). It may seem surprising that the conformation of the CypA-binding loop is well defined, given that the loop is very dynamic25. However, these nano- to microsecond timescale motions reside in a fortuitous regime on the NMR time scale, such that they give rise to averaged NH and CH dipolar tensors, but do not impede the observation of isotropic signals in MAS homo- and heteronuclear correlation spectra. Conversely, at cryogenic temperatures such motions result in conformational heterogeneity, with individual conformers freezing out upon cooling28. This static disorder is most likely responsible for the poorly defined electron density of loop residues in the cryo-EM map. Data-guided MD simulation of the CA tubes explains these experimental observations and provides further insights into CypA loop conformational dynamics, as discussed below.
In our structure, the β-hairpin is in an open conformation (Fig. 1c,d,f). Multiple inter-strand contacts within the β-hairpin, as well as contacts between the β-hairpin (P1, H12) and other NTD residues (A47, T48, D51, and L111) are observed in the structure, clearly defining its position (Fig. 1 and Supplementary Fig. 2). The conformations of side chains are well defined for 194 residues, and several are depicted in Fig. 1g and Supplementary Fig. 2.
Atomic-resolution structure of CA tubes
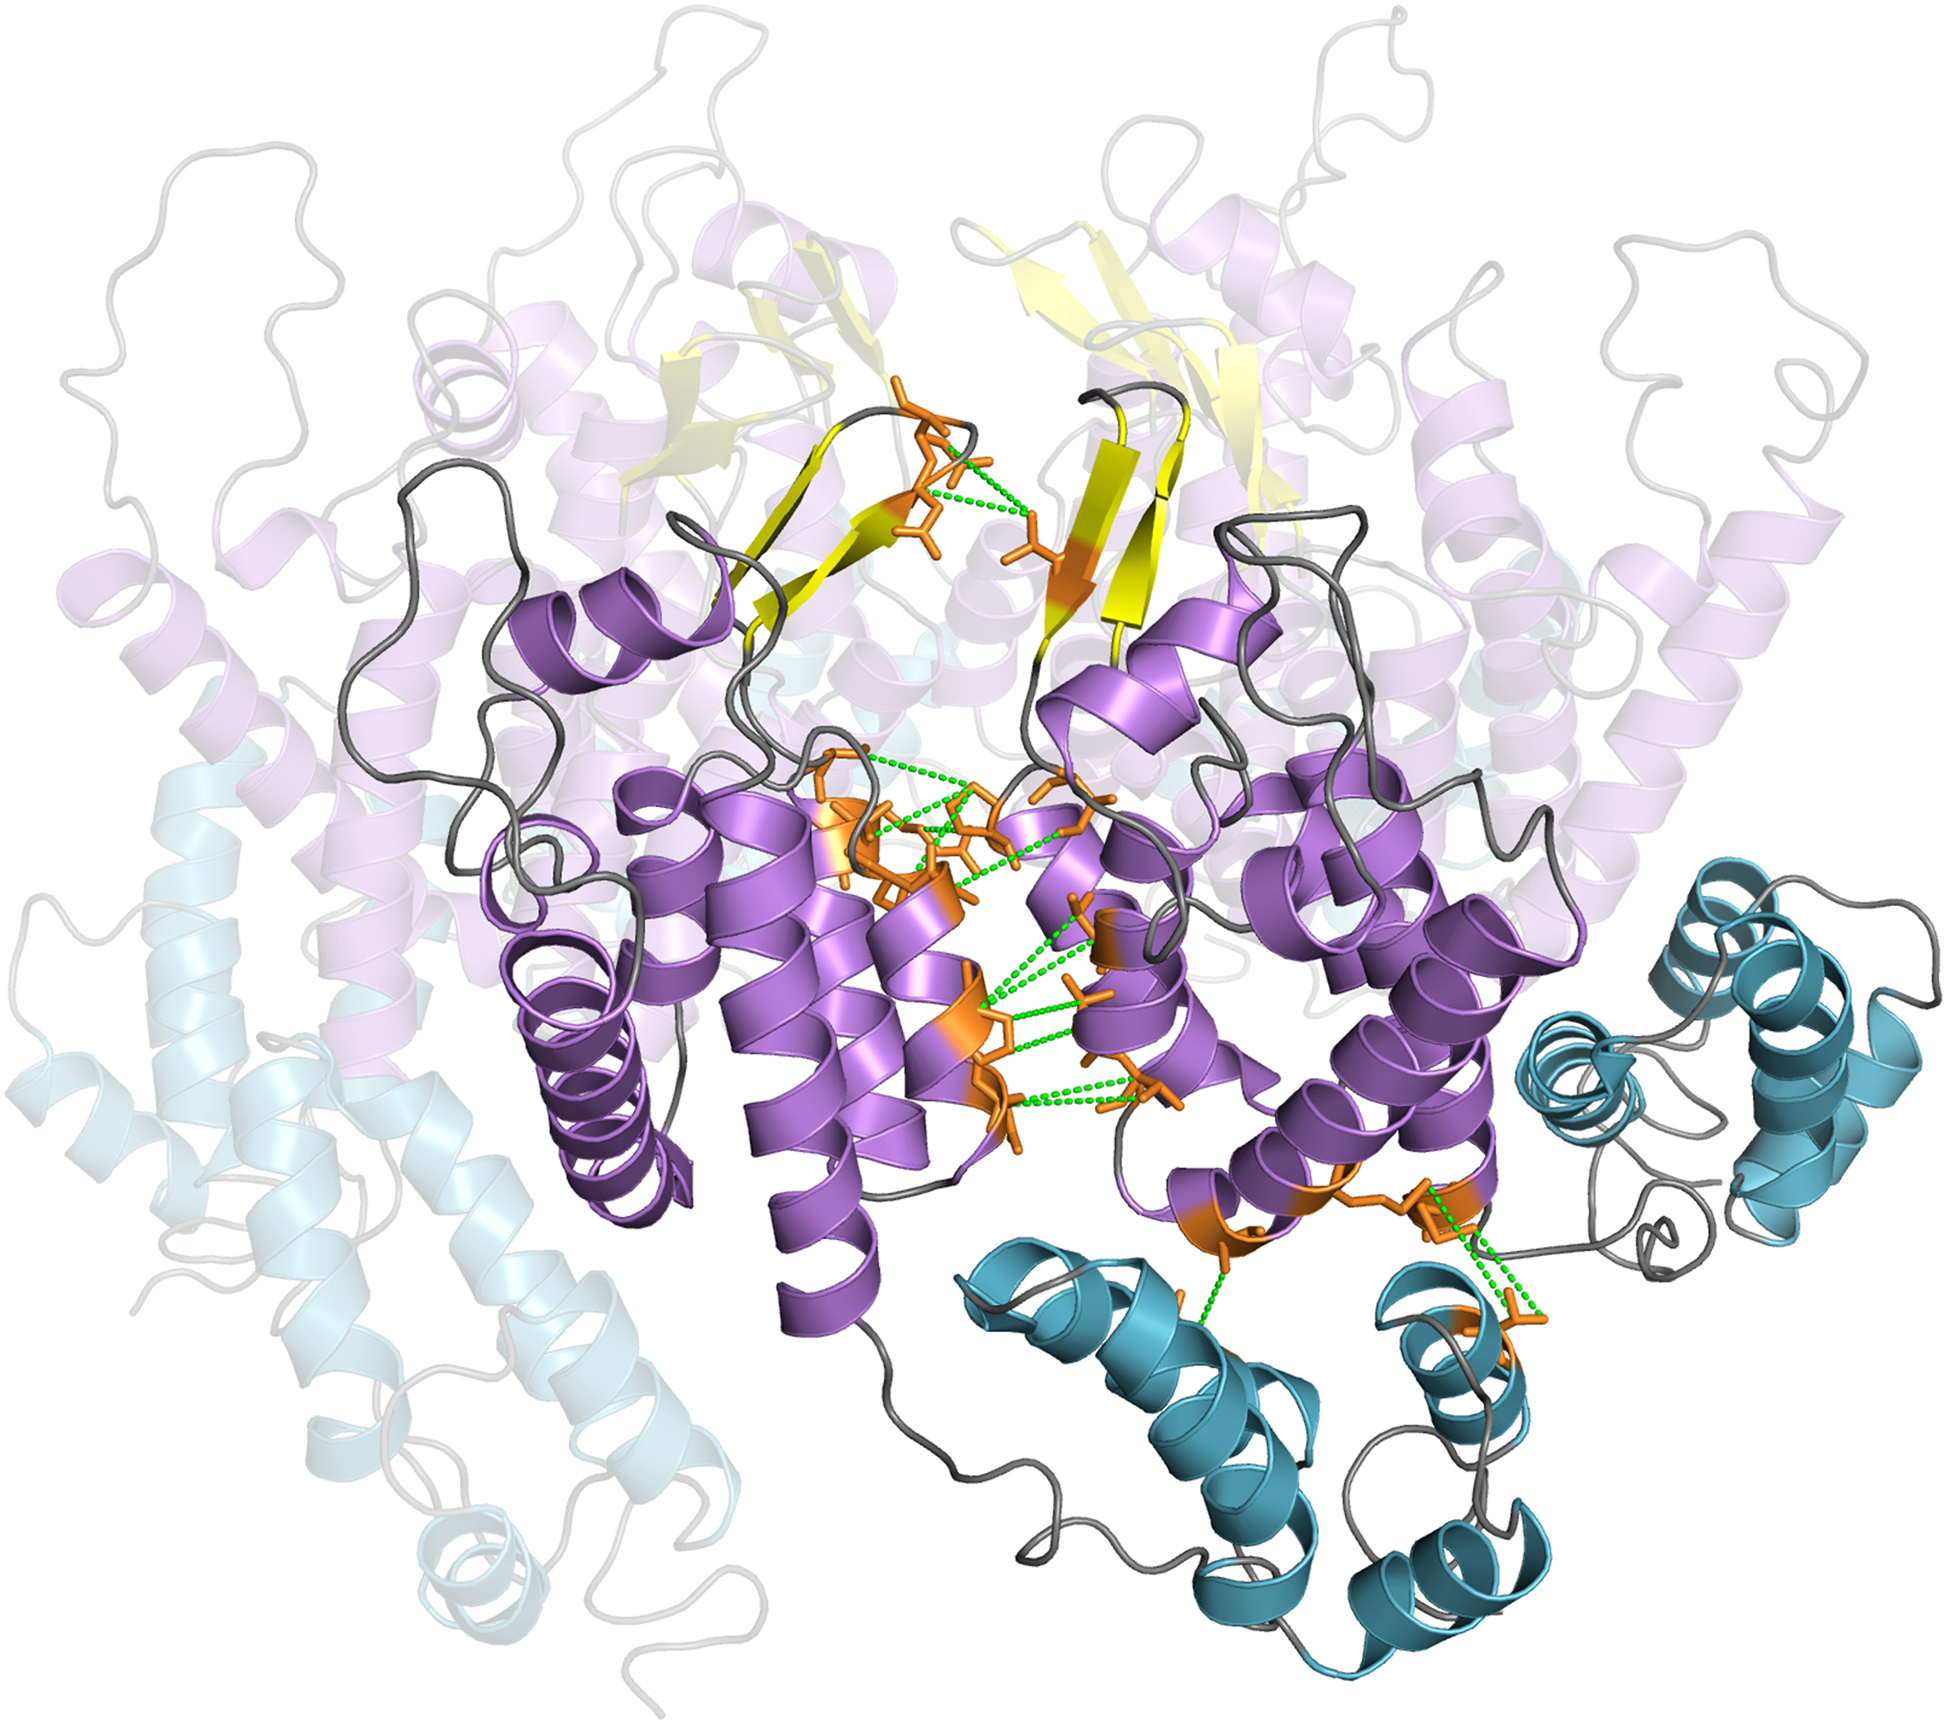
The atomic-resolution structure of CA tubes derived by NMR-guided molecular dynamics is shown in Fig. 2a and the dimer and trimer interfaces between the hexameric units in Fig. 2b. The dimer interface is primarily formed by residues in Helix 9. The side chains of residues L151, V181, W184, M185 and T188 engage in extensive hydrophobic interactions. Interestingly, the orientations of the W184 and M185 side chains vary across the tube, resulting in slightly different inter-residue packings at the dimer interfaces. This finding is consistent with conformational heterogeneity observed experimentally: multiple resonances or line broadening are associated with the W184 side chain resonances, while those of M185 are missing in MAS-NMR spectra. Using Silhouette clustering analysis, nine distinct dimer interface clusters are found (Extended Data Fig. 4a,g). In all, the indole ring of W184 is in a single rotameric state across the tube, with a χ1 angle of 190±21°. In the six most populated clusters (~86%), the indole rings of W184 residues from neighboring CA chains form direct hydrophobic contacts and in two low-populated clusters, W184 forms contacts with the M185 side chain. Water-mediated contacts involving S149, E175 and W184 side chains are also present at the dimer interface (Extended Data Fig. 5), similar to observations in the CA crystals22. Not surprisingly, in contrast to the CTD dimer in solution21, which starts at residue 144, in the assembled tubes residue Y145 is not part of the dimer interface, given its location in the complete linker region connecting NTD and CTD.
Figure 2 |. Structure of an HIV-1 CA tube generated by data-guided molecular dynamics.
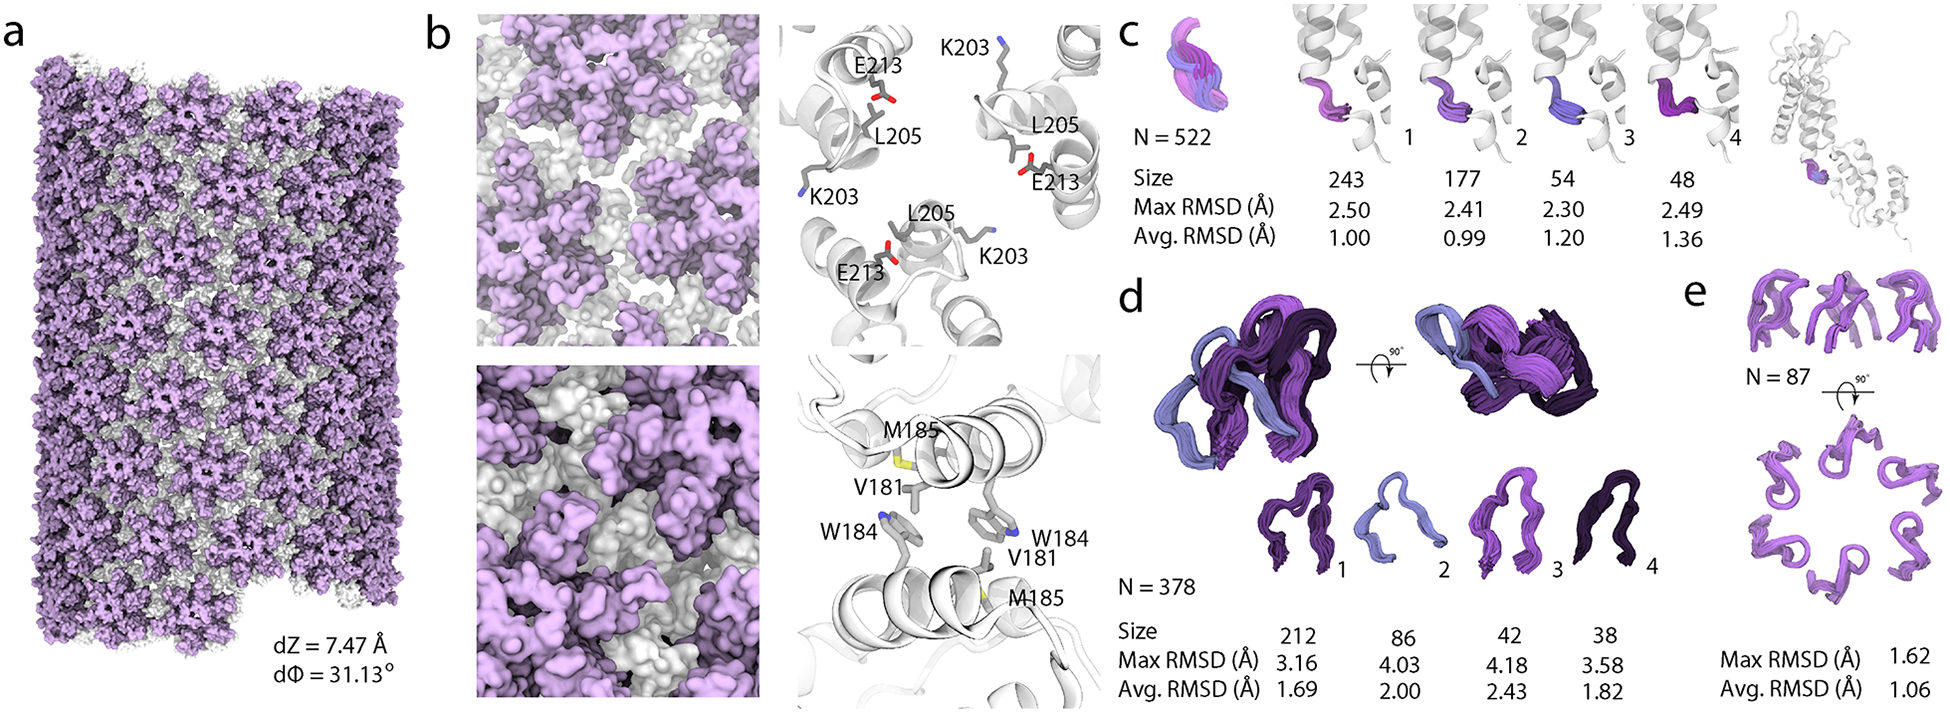
a, Molecular surface of a (−12,11) helical symmetry tube (helical parameters dZ = 7.47 Å and dϕ = 31.13°). The N- and C-terminal domains are colored purple and gray, respectively. b, Representative trimer and dimer interfaces, top and bottom, respectively, in surface (left) and ribbon (right) representation. K203, L205 and E213 side chains (trimer interface) and V181, W184 and M185 sidechains (dimer interface) are shown in ball-and-stick representations. (Additional information is provided in Extended Data Fig. 6). c, Four representative conformations of the flexible linker region, colored and grouped by structural cluster. d, Four representative conformations of the cyclophilin A (CypA) binding loop, colored and grouped by structural cluster. The size of each cluster and the RMSD within each cluster (Å), are listed. e, Arrangement of the β-hairpins in the hexamers.
The trimer interface is comprised of helix 10 and 11 residues, with I201, L202, A204, L205, M214, A217, and V221 forming the hydrophobic core, supplemented by polar interactions between residues K203 and E213. Two equally populated clusters are found for the trimer interface, one involving the three A, D, and F polypeptide chains and the other- the B, C, and E chains (Extended Data Fig. 4b,h). While the ADF and BCE trimers are distinct and not related by symmetry, the distributions of Cα–Cα distances for L205 in these trimers are all within the same range of 10.0±0.3 Å (Extended Data Fig. 6 and Supplementary Table 7). Similar distance distributions are observed in cryoET structures of intact viral capsids26, with minimum and maximum values of 9.6 Å and 10.7 Å, respectively. In contrast, the equivalent L205 Cα–Cα distances in the X-ray structures are 9.4 Å and 8.0 Å, for hydrated and dehydrated crystals, respectively, considerably shorter in the latter than in the assemblies.
The flexible linker region connecting NTD and CTD exhibits four distinct conformations (Fig. 2c). The populations of these clusters are 46.6% (243/522 members in the ensemble), 33.9% (177 members), 10.3% (54 members), and 9.2% (48 members). This conformational heterogeneity is consistent with the linker being dynamic on the millisecond timescale29 and possessing poorly defined electron density.
The current structure also yields unique information about the CypA binding loop conformations. Four distinct CypA loop clusters are found, with populations of 56% (212/378 members in the ensemble), 23% (86 members), 11% (42 members) and 10% (38 members) (Fig. 2d and Extended Data Fig. 4c,i). This finding is supported by an extensive body of experimental MAS NMR and DNP-enhanced MAS NMR results from our laboratory25,28,30. At temperatures above freezing, the residues of the CypA loop in the tubes undergo extensive motions on nano- to microsecond time scales, sampling a large conformational space. These motions were also observed in the CA-NTD in solution31. Such dynamics result in conformational averaging of nuclear spin interactions, i.e., reduced dipolar and chemical shift anisotropies as well as motionally averaged isotropic chemical shifts. At cryogenic temperatures, the associated motions are largely quenched and the individual conformers are “frozen out”. The experimental backbone NH and CH dipolar and NH chemical shift anisotropy tensors, as well as Cα, C’, and NH isotropic chemical shifts of CypA loop residues in CA tubes, measured at 277 K and 110 K, are in remarkable quantitative agreement with these NMR parameters calculated from the MD trajectories and cannot be explained by a single static structure25,28,30. Thus, the conformational space sampled by CypA loop is reflected in the four conformational clusters discussed above.
The β-hairpin region is well defined in the structure. In the overall ensemble of 87 β-hairpins, the backbone pairwise RMSD is 1.06±0.26 Å. Within each hexamer of the tube, the hairpins are arranged in an open conformation, in contrast to their less open conformation observed in the crystal22. Nine different β-hairpin clusters are present, although all are very similar (Extended Data Fig. 4d,e,j,k). Therefore, it is safe to conclude that the β-hairpins form a predominant single conformation throughout the entire tube (Fig. 2e). The ability of the β-hairpin to adopt different arrangements, as evidenced by comparing crystals of flat hexamers vs. tubes in which the hexagonal lattice is curved, is a manifestation of the structural plasticity, exploited by the virus for fine-tuning capsid assembly and stability, depending on the cellular environments.
Not surprisingly, numerous structural details in the integrated MAS-NMR/cryo-EM structure of tubular CA assembly are different from the X-ray crystal structure of CA, which comprises flat hexamers22 (A superposition of the two structures is shown in Fig. 3a). First, the strict six-fold symmetry in the crystalline CA hexamer is absent in the pseudo-hexamer unit of tubular assemblies, as evident from the cryo-EM density and corroborated by the NMR data. The presence of static conformational disorder reflected in the NMR spectra is clear from the comparison of line widths for Cα and C’ signals of the CA tubular assemblies with those of crystalline proteins studied in our laboratory, such as OAA32. In the OAA crystals, the J-decoupled 13C line widths are 17–25 Hz. In the CA tubular assemblies under investigation, these line widths are much broader, ca. 50–80 Hz. Furthermore, for many individual peaks, the line shapes are non-Gaussian with features clearly reflecting contributions from different conformers, as shown in Supplementary Fig. 4. The absence of strict six-fold symmetry is an essential structural feature in curved shapes made from hexagonal lattices, such as CA tubes formed by in vitro assembly and conical capsids in intact HIV virions.
Figure 3 |. Difference between the MAS NMR and X-ray structures of the hexameric unit in CA tubular assemblies.

a, Superposition of a representative MAS NMR/MD structure from the tubular assembly (PDB 6WAP, this work) and the X-ray crystal structure (PDB 4XFX) of the hexameric unit (top) and the single chain (bottom), illustrating the curved (NMR) and flat nature of this unit. b, Comparison of R18 pore conformations in the X-ray crystal structure (PDB 4XFX, top) and the most representative hexamer unit in the tubular assembly (bottom, using structural clustering). c-e, Superposition of MAS-NMR/MD and the X-ray crystal structures (PDB 4XFX), illustrating differences of side chain conformations. c, K25 conformations within in the pore. d, Alternative R143-E175 or R143-Q176 intra-chain contacts in the different structures. f, Orientation of the C198 and C218 side chains, highlighting the slightly different environment around the reduced cysteines in the MAS NMR structure.
Other notable conformational differences are also seen here: a more open NTD center pore is present, due to different β-hairpin orientations in the MAS-NMR/cryo-EM structure, compared to the X-ray structure (Fig. 3a). R18, a residue at the top of the pore, which in the crystal structure points into the center of the hexamer, exhibits varying conformations, which are not related by symmetry (Fig. 3b). Interestingly, R18 was recently reported to bind to the capsid assembly modulator, inositol phosphate33. In addition, K25, another pore residue that resides lower down in the pore adopts different conformations in the crystal and MAS-NMR/cryo-EM structure (Fig. 3c).
Additional residues exhibiting conformational heterogeneity include R143, which forms a contact with E175, rather than with Q176, as seen in the hydrated crystals of CA22 (Fig. 3d). Interestingly, the R143-E175 interaction was observed in the dehydrated crystals of CA22, illustrating that the R143 side chain can engage in different contacts, depending on the solvent and specific molecular environment. We hypothesize that this structural diversity may play a role in fine tuning capsid stability and/or shape in the context of the intact virion and host cell.
We also note that in our MAS-NMR/cryo-EM structure the two Cys residues, C198 and C218 are in the reduced form. This is unequivocally evident from their 13Cα and 13Cβ chemical shifts. In contrast, in all X-ray structures the cysteines are oxidized and form a disulfide bridge (Fig. 3e). An oxidized form was also observed in another MAS-NMR study, therefore resulting in a somewhat different model for the assembled capsid34. Whether the oxidized state is due to exposure to oxygen during sample preparation and/or crystallization and whether oxidation of sulfhydryl groups plays a role in virus maturation and/or capsid assembly cannot be ascertained at present. It would, however, not come as a surprise, if the sulfhydryl/disulfide conformational change may be associated with capsid’s plasticity. Indeed, these cysteine residues are located in helices 10 and 11, pivotal helices that reside at the trimer interface in the assembled capsid. Therefore, any intra-molecular fixation of the helical orientation, such as via a disulfide bond, could alter the inter-molecular helix 10/helix11 interaction at the trimer interface.
DISCUSSION
While cryo-EM technology has enabled remarkable progress towards near-atomic resolution of large systems, the HIV-1 capsid still remains a challenging target. MAS NMR spectroscopy, while exquisitely sensitive to the atomic details of local structure and dynamics, does not yield information on length scales greater than several nanometers. Therefore, integration of results obtained by both experimental techniques is a powerful approach to overcome single method-inherent limitations. As illustrated here, determination of the atomic-resolution structure of a single CA chain, based on MAS-NMR restraints combined with a low-resolution cryo-EM map for defining the overall shape of a hexameric unit, provided the means for computationally deriving an integrated all-atom structure of the hexamer building block as well as the in-vitro-assembled tube. An even more effective result can be obtained when combined with large-scale all-atom data-guided MD simulations.
The atomic-resolution structure of assembled HIV-1 CA tubes reported here represents an advance, both methodologically and in terms of the detailed structural features of the assembled capsid. Remarkably, the structure reveals that, while some functionally important regions, such as the NTD β-hairpin, adopt a predominant single conformation, others, such as the NTD-CTD linker region, the CypA-binding loop, and a large number of individual side chains exhibit distinct conformational variability. This structural diversity underlies the unprecedented structural plasticity of the capsid, exploited in HIV-1 function.
METHODS
Materials
Common chemicals were purchased from Sigma Aldrich or Fisher Scientific and were used without further purification. 15NH4Cl (15N, 99%), U-13C6 D-glucose (U-13C6, 99%), D-glucose (1-13C, 99%; 6-13C, 97%+), and D-glucose (2-13C, 99%) were purchased from Cambridge Laboratories, Inc. Competent Rosetta 2 (DE3) E. coli cells were purchased from Novagen. Chromatography columns were purchased from GE Healthcare. The 400 mesh, formval/carbon-coated copper grids were purchased from Electron Microscopy Sciences.
Sample Preparation
CA proteins were expressed in E. coli Rosetta 2 (DE3) cells, transformed with a pET21 expression vector containing a codon optimized gene sequence (NL4–3 and HXB2 strains) with and without various isotopic labeling, as reported previously25,35, with modifications. Natural abundance CA was expressed in LB medium. U-13C,15N-CA, U-13C-CA, U-15N-CA, [1,6-13C-glucose,U-15N]-CA and [2-13C-glucose,U-15N]-CA proteins were expressed in modified M9 medium, containing 13C-labeled glucose (2 g/L U-13C6-glucose or 4 g/L U-12C6-glucose or 2 g/L 1,6-13C-glucose or 2 g/L 2-13C-glucose) and NH4Cl (2 g/L 15NH4Cl or 2 g/L 14NH4Cl) as carbon and nitrogen sources respectively. Cells were grown to 1.0–1.2 OD, induced with 0.8 mM IPTG for protein expression at 23 °C for 16 h. Cells were harvested by centrifugation at 4000 g for 25 min at 4 °C, resuspended in a 25 mM sodium phosphate buffer (pH 7.0), and lysed by sonication. Cell debris was removed by centrifugation at 27,000 g for 1 h at 4 °C. The pH of the supernatant was adjusted to 5.8 with acetic acid, and the conductivity was reduced to below 2.5 ms/cm with de-ionized water. Following another centrifugation at 27,000 g for 1 h at 4 °C, the clarified supernatant was loaded onto a cation exchange column (HiTrap SP HP, 5 mL) and protein was eluted with a 0–1 M NaCl gradient in buffer containing 25 mM sodium phosphate (pH 5.8), 1 mM DTT, 0.02% NaN3. Concentrated protein fractions were further purified using a size-exclusion column (HiLoad 26/600 Superdex 75), equilibrated with a buffer containing 25 mM sodium phosphate (pH 5.5), 1 mM DTT, 0.02% NaN3.
Tubular assemblies of CA protein were prepared as described previously with a few minor modifications25,35. CA proteins were concentrated to 20–30 mg/mL in 25 mM phosphate buffer (pH 5.5), containing 1 mM DTT and 0.02% NaN3. For the isotopically diluted sample, U-13C,15N labeled CA was mixed with natural abundance CA at a molar ratio of 1:6. For each sample, 4.8 M NaCl solution in 50 mM Tris buffer (pH 8.0) was added to the concentrated protein solution at 1:1 volume ratio to yield a final salt concentration of 2.4 M, followed by incubation at 37 °C for one hour25,35. The pH of the resulting solution was 6.0, prior to the assembly reaction.
The assemblies were centrifuged at 10,000 g and packed into Bruker thin-wall 3.2 mm rotors. Amounts of hydrated protein assemblies in the rotors were ~40–45 mg.
Transmission Electron Microscopy (TEM)
The morphology of CA assemblies was characterized by transmission electron microscopy (TEM). Samples were stained with 5% uranyl acetate, deposited onto 400 mesh, Formvar/Carbon film coated copper grids, and dried for 40 min. TEM images were acquired on a Zeiss Libra 120 transmission electron microscope at 120 kV.
MAS NMR Spectroscopy
MAS NMR experiments on tubular assemblies of U-13C,15N-CA, [1,6-13C-glucose,U-15N]-CA, [2-13C-glucose,U-15N]-CA, and 1:1 U-13C/U-15N mixed labeled CA were performed on a Bruker 20.0 T narrow bore AVIII spectrometer outfitted with a 3.2 mm E-Free HCN probe. The Larmor frequencies of 1H, 13C, and 15N were 850.4, 213.8 and 86.2 MHz, respectively. The 90° pulse lengths were 2.73–2.96 μs (1H), 3.20–3.45 μs (13C), and 3.50–3.75 μs (15N). The cross-polarization (CP) contact time (τCP) was 0.7–0.8 ms (1H-13C) and 1.0–1.3 ms (1H-15N); a linear 90–110% amplitude ramp of was applied on 1H; the center of the ramp was Hartmann-Hahn matched to the first spinning sideband. The 2D 13C-13C CORD36 spectra mixing times were 50, 200, and 500 ms. Band-selective 15N-13Cα SPECIFIC-CP was used for U-13C,15N-CA tubes; τCP=4.6 ms. SPINAL-6437 1H decoupling (ωRF=80–96 kHz) was applied during t1 and t2 periods.
MAS NMR spectra were also collected on a Bruker 11.7 T wide bore AVIII spectrometer, outfitted with a 3.2 mm EFree HCN probe. Larmor frequencies of 1H, 13C, and 15N were 500.1, 125.8 and 50.7 MHz, respectively. The 90° pulse lengths were 2.75–2.87 μs (1H) and 3.20–3.30 μs (13C). For 1H-13C CP, τCP=0.65–1.20 ms; a linear 90–110% amplitude ramp was applied on 1H; the center of the ramp was Hartmann-Hahn matched to the first spinning sideband. The 2D 13C-13C CORD36 spectra mixing times were 25 ms and 500 ms. SPINAL-6437 1H decoupling (ωRF=94 kHz) was applied during t1 and t2 periods.
MAS NMR spectra of isotopically diluted CA, U-13C,15N-CA, and [1,6-13C-glucose,U-15N]-CA assemblies were recorded with a 3.2 mm HCN EFree probe on a 14.1 T Magnex/Bruker AVIII spectrometer. The Larmor frequencies were 599.8 MHz (1H), 150.8 MHz (13C) and 60.8 MHz (5N) MHz. The typical 90° pulse lengths were 2.69–2.75 μs (1H) and 3.50–3.62 μs (13C). For 1H-13C CP, τCP=0.64–0.94 ms; a linear amplitude ramp of 90–110% was applied on 1H; the center of the ramp was Hartmann-Hahn matched to the first spinning sideband. The 2D 13C-13C CORD36 spectra mixing time was 500 ms. SPINAL-6438 1H decoupling (ωRF=89 kHz) was applied during t1 and t2 periods.
The MAS frequency was 14.000±0.005 kHz for all experiments. The final temperature in all NMR experiments was maintained at 4.0±0.1 °C. 13C and 15N chemical shifts were referenced with respect to the external standards adamantane and ammonium chloride, respectively.
All data were processed with NMRpipe39. For 2D and 3D spectra, 30°, 60°, or 90° shifted sine bell apodization followed by a Lorentzian-to-Gaussian transformation was applied in both dimensions. Forward linear prediction to twice the number of the original data points was applied in the indirect dimension, followed by zero filling to twice the total number of points. The processed spectra were analyzed in Sparky40 and CCPN41.
All assignments have been deposited in BMRB under accession code 30741.
Distance Restraints: Assignment of Intra- and Inter-Residue Correlations
Distance restraints were derived from 2D 13C-13C CORD spectra. The sample and experimental conditions are summarized in Supplementary Table 1. Assignments of inter-residue correlations were obtained using a semi-automated protocol. First, cross peaks were manually picked in Sparky. The generated peak lists, containing peak position information, were used as input in a home-written C++ script, which generated possible assignments, based on chemical shifts and isotopic labeling. A tolerance level of 0.3 ppm (larger than the typical line widths of 0.1–0.25 ppm) was set for both, 13C and 15N frequencies, to allow for multiple possibilities in the overlapping regions of the spectra. This procedure produces a large number of ambiguous assignments. To eliminate improbable assignments and reduce the ambiguity, the following procedure was implemented: (i) If a correlation could be either intra-residue or inter-residue, it was deemed to be intra-residue; (ii) If the correlation was in a non-overlapping region of the spectra, the tolerance level was decreased to ±0.1 ppm; (iii) Any assignments of long-range correlations that were incompatible with the known architecture of the single chain CA were excluded. The isotopically diluted sample of the tubular assemblies of U-13C,15N-CA/n.a.-CA (mixed in a 1:6 ratio) was used to aid in the assignment of intermolecular correlations.
Structure Calculation of Hexameric CA Unit
Single chain energy minimization.
Experimental correlations from assigned cross-peaks in the CORD spectra were used to generate unambiguous and ambiguous Xplor distance restraints. Ambiguous restraints exceeding 5-fold ambiguity were not considered. The bounds of the distance restraints were set to 1.5–6.5 Å (4.0 ± 2.5 Å) and 2.0–7.2 Å (4.6 ± 2.6 Å) for intra- and inter- residue restraints respectively, consistent with our previous study8.
Structure calculations were performed in Xplor-NIH version 2.5142–44. Standard terms for bond lengths, bond angles, and improper angles were used to enforce proper covalent geometry. A statistical torsion-angle potential45 and the gyration volume term were employed46; separate gyration volume terms were applied to the NTD (residues 1–145) and CTD (residues 148–231), excluding the flexible linker. A hydrogen-bond database term, HBPot, was used to improve hydrogen-bond geometries47. Backbone dihedral restraints in the form of φ/ψ angles were predicted using TALOS-N48 from the experimental solid-state 13C and 15N chemical shifts.
Folding calculations for the full-length single-chain CA were seeded from primary sequence extended strands. 3000 structures were calculated using molecular dynamics simulated annealing in torsion angle space with two successive annealing schedules and a final gradient minimization in Cartesian space, using 13118 unique, non-redundant C-C and N-C distance restraints and 386 TALOS-N-derived torsion angle restraints per CA chain. The structure calculation began with a 3500 K constant-temperature molecular dynamics run for the shorter of 800 ps or 8000 steps with the time step size allowed to float to maintain constant energy, within a tolerance. The initial velocities were randomized about a Maxwell distribution using a starting temperature of 3500 K. Following this initial dynamics calculation, a simulated annealing calculation was performed, where the temperature was reduced to 100 K in steps of 25 K. At each temperature, dynamics was run for the shorter of 0.4 ps or 200 steps. Force constants for distance restraints were ramped from 10 to 50 kcal/mol•Å2. The dihedral angle restraints were disabled during for high temperature dynamics at 3500 K and but enabled during simulated annealing with a force constant of 200 kcal/mol•rad2. The gyration volume force constant was geometrically scaled from 0.002 to 1. After simulated annealing the structures were minimized using a Powell energy minimization scheme.
Subsequently, the 300 lowest energy structures were selected and the coordinates of the NTD and CTD were refined in separate calculations. In the separate calculations, 3000 structures, each, were refined. Simulated annealing at 3000 K was performed for 10 ps or 5000 steps, whichever was completed first. The starting time step was 1 fs and was self-adjusted in subsequent steps to ensure conservation of energy. The initial velocities were randomized about a Maxwell distribution using the starting temperature of 3000 K. The temperature was subsequently reduced to 25 K in steps of 12.5 K. At each temperature the initial default time step was 1 fs, and a 0.2 ps dynamics run was performed. Force constants for distance restraints were ramped from 2 to 30 kcal/mol•Å2. The dihedral restraint force constants were set to 10 kcal/mol•rad2 for high temperature dynamics at 3000 K and 200 kcal/mol•rad2 during cooling. The gyration volume force constant was scaled from 0.002 to 1. The annealed structures were minimized using a Powell energy minimization scheme. The 50 lowest energy structures from each run were selected for the next step.
Docking into cryoEM density.
The cryo-EM density map of EMD-8595 (PDB 5UPW)49 was post-processed for docking. The density was downsampled to 8 Å resolution using the “phenix.auto_sharpen” routine in PHENIX 1.1450. Separate rigid-body docking runs were performed to dock the NTD and CTD into the map. An in-house UCSF Chimera51 script was used for automated batch docking of the 50 lowest energy structures generated in each of the runs. For batch docking, a global search with 5000 random different orientations and translations was carried out. Importantly, 6-fold symmetry was not imposed. Fourteen structures of the NTD and CTD were selected on the basis of the highest cross-correlation scores and visual inspection.
Hexamer structure refinement.
A final refinement calculation was performed in Xplor-NIH, using NMR distance restraints, NMR-derived dihedral restraints, and the 8 Å cryo-EM density map of the hexamer unit. Separate calculations were performed for the NTD and CTD in the hexamer. Calculations were seeded from the bundle of 14 NTD or CTD starting structures, and 100 structures for each were generated by torsion angle dynamics with an annealing schedule and a final gradient minimization in Cartesian space.
Two identical runs of simulated annealing starting at 250 K were performed for 10 ps, with a time step of 1 fs. The initial velocities were randomized to achieve a Maxwell distribution at a starting temperature of 250 K.The temperature was subsequently reduced to 25 K in steps of 25 K. At each temperature, dynamics was run for 0.4 ps with an initial time step of 1 fs.
The cryo-EM potential52 was restricted to N, C, CA, O, and CB atoms to preserve the sidechain orientations defined by NMR distance and dihedral restraints. Approximate non-crystallographic symmetry was imposed using Xplor-NIH’s PosDiffPot term, allowing the subunits of the hexamer to differ by up to 1 Å; force constants for distance restraints were ramped from 2 to 30 kcal/mol•Å2. The dihedral restraint force constants were set to 10 kcal/mol•rad2 for high temperature dynamics at 3000 K and 200 kcal/mol•rad2 during cooling. The EM density map was used to generate a cross-correlation probability distribution potential, and the force constants of the cross-correlation probability distribution potential, initiated from the cryo-EM density map, was set to 50 kcal/mol during high temperature dynamics and cooling. The gyration volume potential was turned off to avoid conflicts with the cryoEM density map. The annealed structures were minimized using a Powell energy minimization scheme.
After separate refinement of the NTD and CTD hexamer units, the 10 lowest energy structures from each bundle were combined into a 10-member ensemble containing both NTD and CTD hexamer units. The PSF of the hexamer was generated by loading the sequence file of the single CA chain of the hexamer. The PSF was expanded to 6 chains using the Xplor-NIH function psfGen.duplicateSegment. For each structure, the starting coordinates of the NTD and CTD regions were set from the input files, while the linker region connecting the NTD and CTD was built by the protocol.addUnknownAtoms routine. Three iterations of the hexamer refinement calculation were performed. After each iteration, the 10 lowest-energy structures were selected and used as input for the next iteration. The final MAS NMR bundle comprised the 10 lowest-energy structures from the final refinement calculation.
Data-Guided Molecular Dynamics Structure Determination of CA Tubes
The data-guided HIV-1 CA tube was simulated at constant temperature of 310 K and pressure of 1 atm, with 2 fs time-steps, using the NAMD molecular dynamics engine53 and the CHARMM36m protein force field54. Distance and dihedral angle restraints, derived from experimental NMR data, were generated with the TALOS-N software48 and incorporated into the extraBonds module in NAMD. The complete HIV-1 CA tube system (87 hexamer units), including solvent and ions, comprised 13,988,553 atoms and was simulated for a total of 100 ns, Extended Data Fig. 7.
System Preparation.
The initial model of the CA tube was constructed from the lowest-energy member of an ensemble of CA hexamers generated with Xplor-NIH42–44. After rigid-body docking of the selected hexamer into the cryoEM density EMBD 558255, the CA tube construct was generated by applying a (−12,11) helical symmetry transformation to the coordinates of the hexamer. Protonation states were assigned using the propKa software56,57 at pH 7.0. Next, the net charge of the CA tube was calculated as −1044e, and 1044 Sodium counter ions were placed according to iterative calculations of the coulombic potential, using the cionize tool in VMD58, with a specified grid spacing of 2.0 Å.
Solvation of the protein by water and counter ions was performed in parallel using a VMD-Tcl script. First, the necessary dimensions of the water box were determined by computing the dimensions of the CA tube with an additional 5.0 Å along each Cartesian axis. Next, this 440×440×750 Å space was divided into 588 individual subspaces, or segments, within which water molecules were placed concurrently, using the solvate tool in VMD. Finally, the coordinates of the CA tube construct, counter ions and water molecules were merged with psfgen59 and the model saved in the binary .js file format60, the latter being necessary to overcome indexing limitations of the PDB format60. To resolve clashes, a VMD-Tcl script was used to identify water molecules within 2.4 Å of the protein to pass the relevant indices to psfgen for deletion.
Addition of bulk Na+ and Cl− ions to a final salt concentration of 2.4 M was carried out via a VMD-Tcl script which transformed water molecules into Na+ and Cl− atoms. This was achieved by calculating the number of water molecules in the system, and the number of NaCl pairs necessary for the desired salt concentration: each addition of NaCl necessitated removal of two water molecules and for each step NaCl molarity was calculated. The total number of water-to-ion transformations needed distributed among the 588 individual components of the segmented water box, to allow for parallel processing as described previously17. Within each water box segment, water molecules for replacement were selected at random. The center of mass of each water molecule was calculated, stored in an array, passed to psfgen and replaced by an ion. The final system, parametrized with the CHARMM36m protein parameter set, was saved as a binary .js file. It totaled 13,988,553 atoms with a final net charge of +0.0014e. The such prepared system was subjected to steepest descent gradient minimization using NAMD. With all protein atoms fixed, the water box was minimized for 50,000 cycles. This was followed by minimization of side chain and solvent atoms for an additional 50,000 cycles, concluding with a final gradient value of 0.109. Prior to heating of the system, harmonic restraints force constants of 5.0 kcal/mol•A2 were applied to all protein backbone atoms. The system was then gradually thermally equilibrated to 310 K, increasing the temperature by 10 K every 40 ps. Thereafter, backbone restraints were gradually released, reducing the force constant by 0.1 kcal/mol•A2 every 40 ps. For backbone atoms in helical regions, the force constant was reduced to 1.5 kcal/mol•A2, while all other protein atoms had their harmonic restraints removed completely.
Positional restraints and integration of experimental data.
During thermalization of the CA tube system, each hexamer was fixed about its center of mass to prevent changes to tube morphology. This was accomplished using the colvars module61 within NAMD, relating alpha carbons in helical regions of each hexamer to a dummy atom, defined as the center of mass of the respective hexamer. Experimental distance and TALOS-N48-derived dihedral angle restraints were applied as harmonic potentials using the extraBonds module in NAMD. To match fluctuations of distances and angles observed experimentally, force constants were selected according to with dZ the desired width of the potential, kT the product of the Boltzmann constant and temperature (0.62 kcal/mol at 310 K) and K the force constant (kcal/mol•Å2). This resulted in a force constant of 0.1 kcal/mol•A2 for distance restraints and 0.6 kcal/mol•A2 for dihedral angle restraints.
Molecular dynamics simulations.
Molecular dynamics simulations were performed on the Oak Ridge National Laboratory’s (ORNL) Summit supercomputer, using the NAMD molecular dynamics engine53 and the CHARMM36m protein force field54. For non-bonded interactions, atom pairs within one, two or three bonds of each other were excluded. A cutoff of 12.0 Å was employed, using a switching distance of 10.0 Å to smooth the interaction potential beyond the cutoff distance. The maximum distance per pair was 14.0 Å. Full electrostatics were taken into account, using the Particle Mesh Ewald (PME) method62,63 with a grid spacing of 2.0 Å and 8th order interpolation. Short-range non-bonded interactions were evaluated every 2.0 fs, and full electrostatics every 4.0 fs. Electrostatic forces were split between short- and long-range potentials using a quintic polynomial splitting function64. Pressure was maintained with the Nose-Hoover Langevin barostat, using a target pressure of 1.01325 bar and target temperature of 310 K; the specified oscillation period was 40 ps with a decay period of 20 ps. Temperature was maintained at 310 K using stochastic velocity rescaling65,66 and a rescale period of 200 fs. A time step of 2.0 fs/step was used throughout the simulation, and all bonds to hydrogen were constrained with the RATTLE and SHAKE algorithms for solvent and solute, respectively67,68.
Structure Analysis and Visualization.
RMSD values were calculated using routines in the Xplor-NIH (version 2.51)42–44. The visualization of structural ensembles/models and restraint networks were batch rendered in PyMOL69 using in-house shell/bash scripts. Secondary structure elements were classified according to TALOS-N.
All analyses of the CA tube were performed with VMD58, employing scripted procedures within its Tcl interface, using the ORNL’s Summit and Rhea supercomputers. Graphical depictions of the CA tube were rendered using the Tachyon multiprocessor ray tracing software70 within VMD, both on the ORNL’s Rhea supercomputer and an in-house GPU workstation. Conformational clusters were identified using Silhouette analysis71.
Structure Validation
To assess the consistency between the structure and the spectral parameters of the pseudo-hexameric CA unit, we generated synthetic correlation frequencies for CORD spectra from the predicted intra- and intermolecular carbon-carbon contacts ≤ 7 Å in the CA assemblies. Excellent agreement between the experimental and the synthetic frequencies is observed for [1,6-13C-glucose/U-15N]-CA spectra (Extended Data Fig. 8). Similar results were obtained for CORD spectra of U-13C,15N-CA tubular assemblies and these spectra were not used for structure calculation (Extended Data Fig. 9). Based on the synthetic spectra we unambiguously assigned a considerable number of additional cross peaks in the CORD spectra, which correspond to both intra- and intermolecular correlations that could not be assigned de novo, see Extended Data Fig. 10 and Supplementary Table 8. In addition, analysis of the distance violations in the final integrated MAS, cryo-EM and molecular dynamics structure with respect to the experimental NMR restraints (Supplementary Fig. 3) also demonstrates excellent agreement between experimentally derived distances those predicted from the structure.
Further information on experimental design is available in the Nature Research Reporting Summary linked to this article.
Data Availability
The coordinates of the atomic structures have been deposited in the Protein Data Bank under accession codes PDB 6WAP for the single CA chain and PDB 6X63 for the CA tube. MAS NMR chemical shifts, dihedral constraints, and distance constraints have been deposited in the Biological Magnetic Resonance Data Bank under accession code 30741.
Extended Data
Extended Data Fig. 1. Summary of MAS-derived NMR distances.

a, Inter-residue contact plot. b, Intra-chain distances (gray dotted lines), mapped onto the ribbon diagram structure of a single CA chain. NTD helices are colored purple, the β-hairpin yellow, loops gray, and the CTD helices cyan.
Extended Data Fig. 2. Initial MAS NMR structure of full-length CA protein.

Ensemble of 10 lowest-energy structures for the single-chain. Best-fit superpositions for the NTD (a) and CTD (b), respectively, are shown. The color coding is identical to that in Figures S2 and S3.
Extended Data Fig. 3. Protocol for the structure determination of a CA hexamer using MAS NMR and cryo-EM data.

Ensembles of the 10 lowest-energy structures at each step are depicted in ribbon representation, with NTD helices colored purple, the β-hairpin yellow, loops gray, and CTD helices cyan.
Extended Data Fig. 4. Structural clusters of HIV-1 CA tube.

a–f. Plots of k-medoids clusters4 for different structural units in the final tube structure by Silhouette analysis5. g–l. Conformations from clustering analyses and the number of members within each cluster. g. Representative structures (medoids) of dimer interface clusters. h. Alignment of the two trimer interface medoids yielded by clustering. i. CypA loops grouped and colored by conformational cluster. j. Two structural clusters yielded by analysis of monomeric β-hairpins. k. Nine clusters yielded by analysis of hexameric β-hairpins. l. Flexible linkers grouped into four conformational clusters.
Extended Data Fig. 5. Water occupancy in the MD simulation of the HIV-1 CA tube.

a. Water occupancy map, averaged over 80 ns of the trajectory. For each frame in the trajectory, a binary mask is used to indicate the presence of water at every point in space. The average of these masks for a trajectory is the water occupancy map, and each point in the latter describes the fractional occupancy of water at a specific location. 3-D visualizations, isosurfaces, are generated according to the value at each point in the occupancy map and are shown at varying occupancy cutoffs. b. Histogram of dimer interfaces involved in water-mediated contacts, the latter determined by proximity of S149, E175 and W184 sidechain atoms within 4.0 Å of the water occupancy map at the specified occupancy cutoff values. c. Illustration of a dimer interface with the sidechains of S149, E175 and W184 in stick representation and an isosurface of the water occupancy map (red; > 0.70 fractional occupancy).
Extended Data Fig. 6. Analysis of trimer interfaces in the HIV-1 CA tube.

a. A hexamer of hexamers, highlighting the two trimer interfaces present: one involving chains A, D and F (blue) and the other between chains B, C and E (orange), shown from two perspectives. b. Histogram of the shortest L205 Cα–Cα distance at each trimer interface in the CA tube, for the orange and blue interfaces. The histogram is drawn as a frequency polygon, where vertices represent the center of each bin along the x-axis. c. Best-fit superposition of the two medoids from clustering analysis of the trimer interface (blue, red) and the cryo electron tomography (cryo-ET)6 structure (accession codes: EMDB 3475, PDB ID 5MD7).
Extended Data Fig. 7. Molecular dynamics simulation setup for the HIV-1 CA tube.
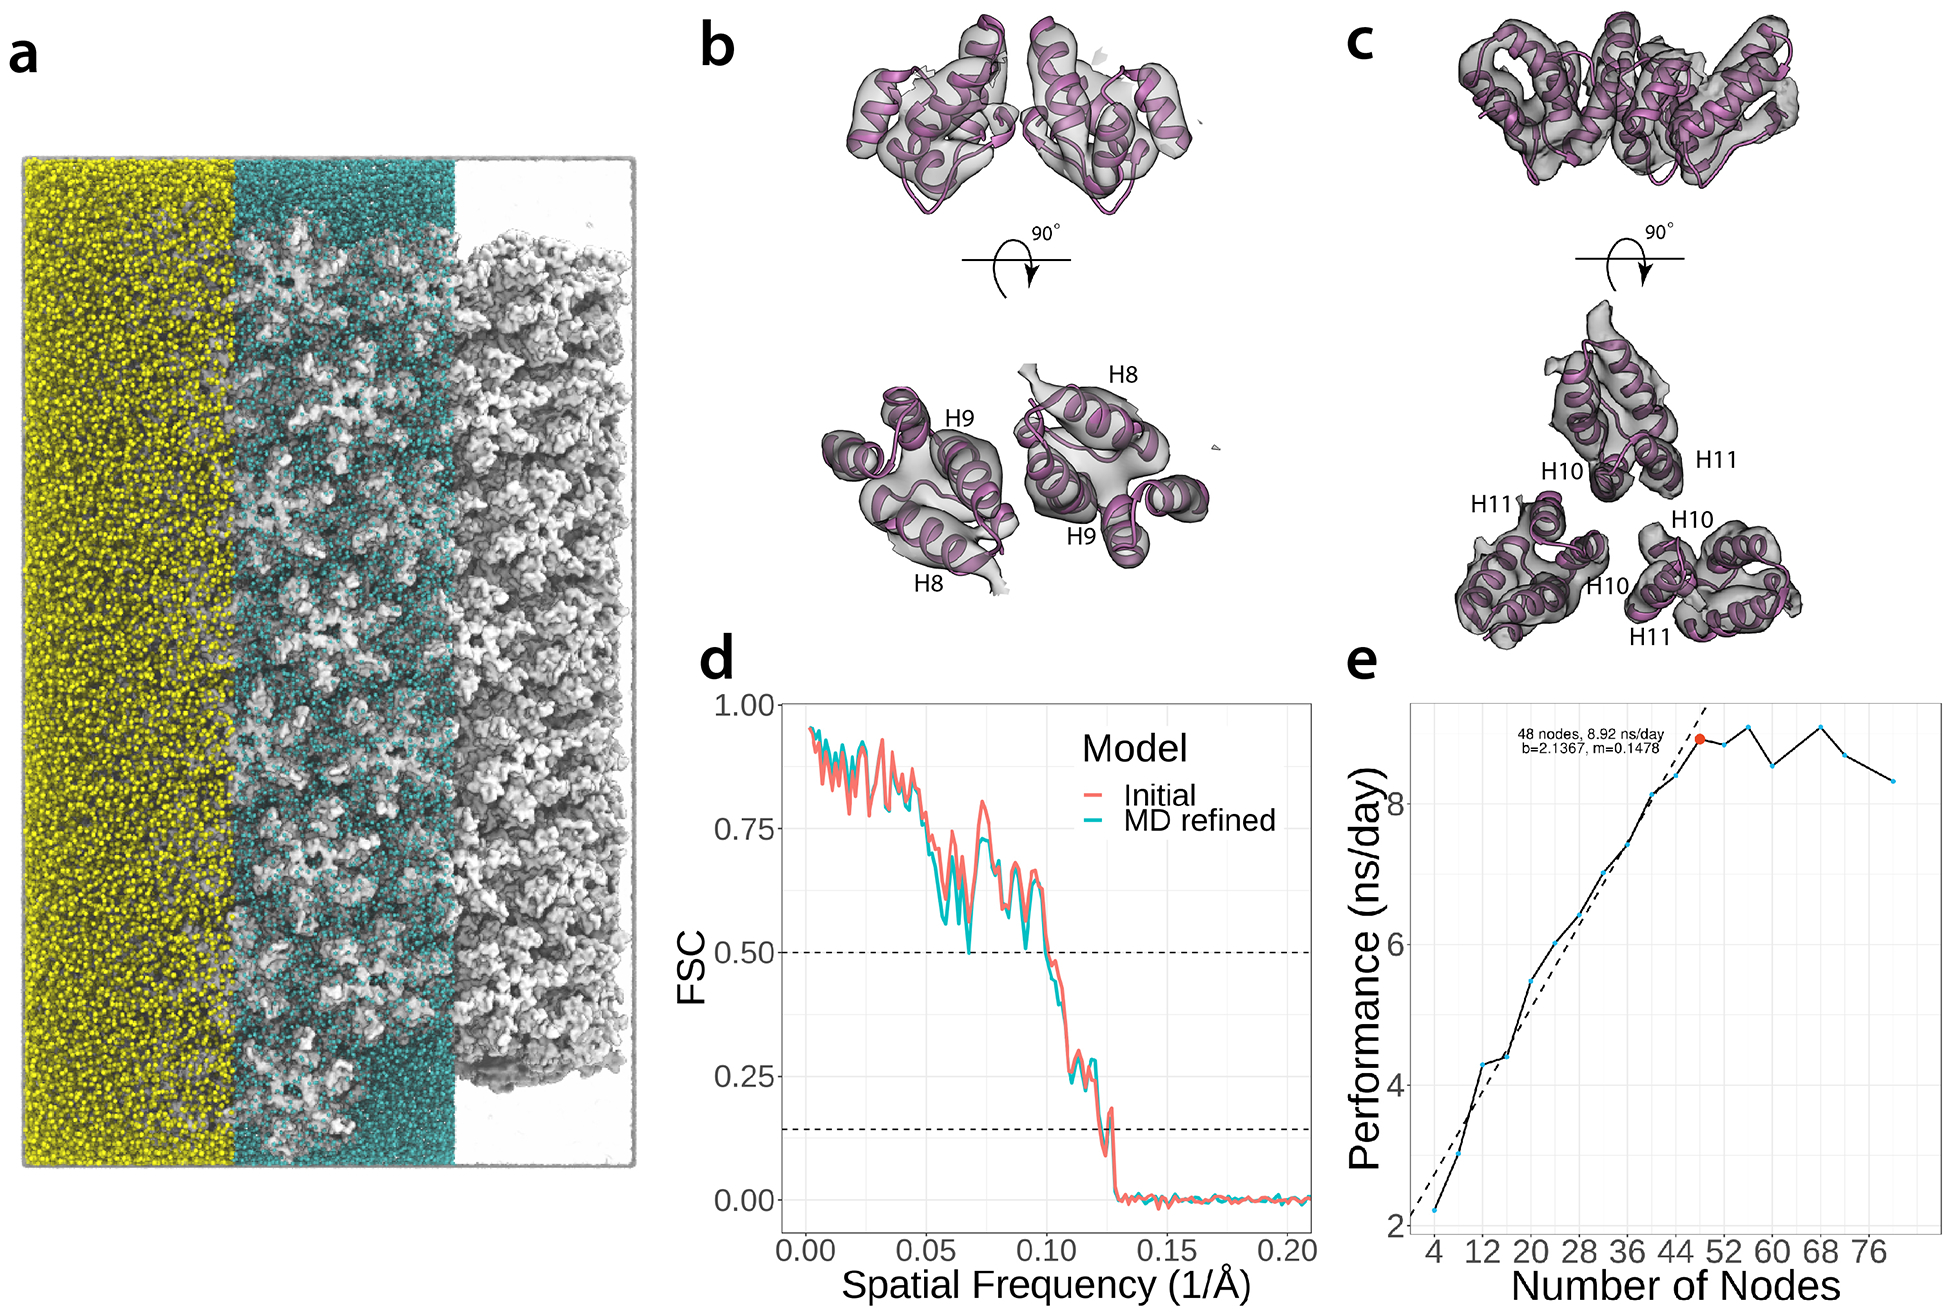
a. The 13.9-million atom system comprises water molecules (transparent), Na+ and Cl− ions (yellow and blue, respectively), and protein (white). View of the dimer (b) and trimer (c) interface docked into the 8.6 Å cryo-EM envelope3 (accession code EMD-5582). d. Fourier Shell Correlation (FSC) between the 8.6 Å CA tube density and simulated 8.6 Å densities of the CA tube before (blue) and after (red) data-guided MD refinement. The dashed lines in the plot correspond to FSC=0.50 and FSC=0.143, for resolutions of 10.0 Å and 8.3 Å, respectively. e. Scaling analysis of the MD simulations of the current system on the Oak Ridge National Laboratory’s Summit supercomputer.
Extended Data Fig. 8. Superposition of synthetic peak positions, back calculated from the MAS NMR structure of a hexamer unit and the CORD spectrum of [1,6-13C]-glucose,U-15N-CA tubular assemblies.
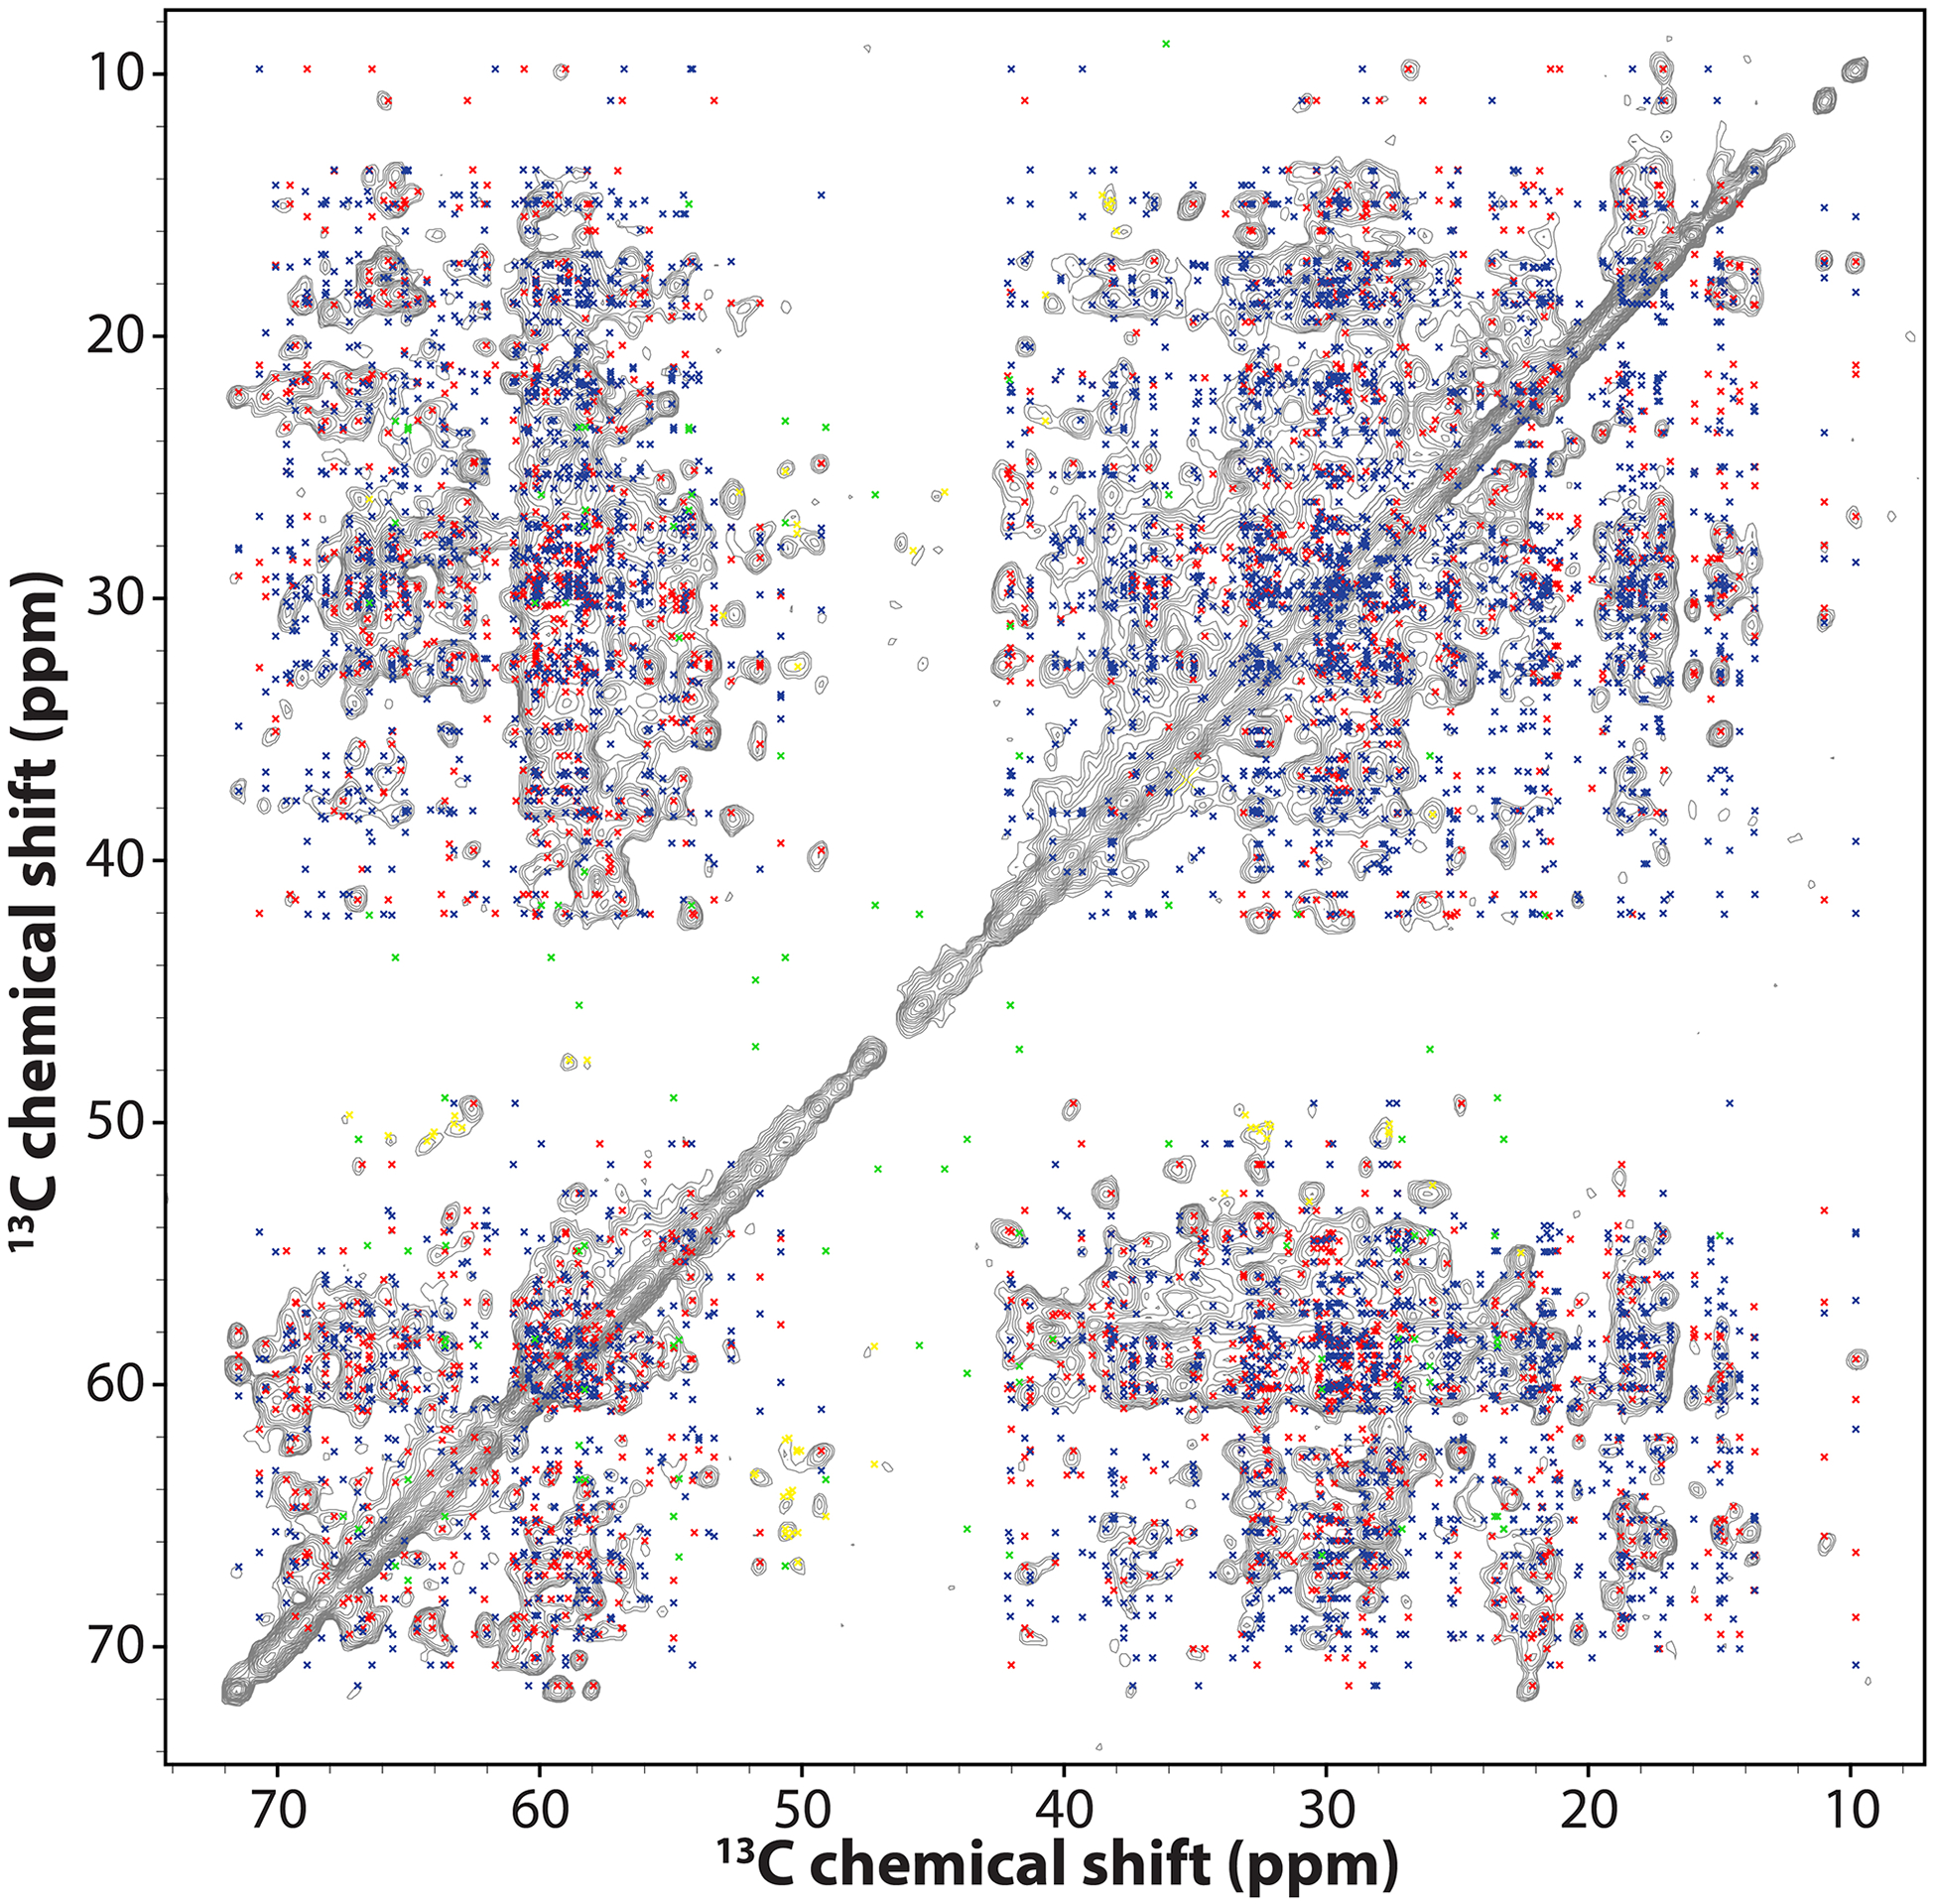
The spectrum was collected at 14.1 T, with a MAS frequency of 14 kHz, and a CORD mixing time of 500 ms. Cross peak positions were calculated for the lowest-energy structure of the hexameric unit, using the experimental 13C chemical shifts, and all intrachain and interchain 13C-13C contacts, corresponding to distances up to 7 Å. Peak positions corresponding to intrachain contacts are colored red and blue for distances up to 5 Å and those between 5 Å and 7 Å, respectively. Peak positions corresponding to interchain contacts are colored in green. Peak positions due to isotope scrambling are colored yellow.
Extended Data Fig. 9. Superposition of synthetic peak positions, back calculated from the MAS NMR structure of a hexamer unit, and the CORD spectrum of U-13C,15N-CA tubular assemblies.
The spectrum was collected at 14.1 T, a MAS frequency of 14 kHz, and a CORD mixing time of 500 ms. Cross peak positions were calculated for the lowest-energy structure of the hexameric unit, using the experimental 13C chemical shifts, and all intrachain and interchain 13C-13C contacts corresponding to distances up to 7 Å. Peak positions corresponding to intrachain contacts are colored red and blue for distances up to 5 Å and those between 5 Å and 7 Å, respectively. Peak positions corresponding to interchain contacts are colored in green.
Extended Data Fig. 10. Interchain contacts (up to 7 Å) identified in the CORD spectra extracted from simulated cross peak positions.
Interchain correlations are mapped on two neighboring CA chains in the lowest energy structure of the hexameric unit. Intermolecular correlations are shown as green dashed lines and the associated residues are depicted in orange stick representation.
Supplementary Material
ACKNOWLEDGMENTS
This work was supported by the National Institutes of Health (NIH Grant P50AI1504817). We acknowledge the support of the National Science Foundation (NSF Grant CHE0959496) for the acquisition of the 850 MHz NMR spectrometer and of the National Institutes of Health (NIH Grant P30GM110758) for the support of core instrumentation infrastructure at the University of Delaware; and of the National Institutes of Health (NIH Grant S10OD012213) for the acquisition of the 750 MHz NMR spectrometer at the University of Pittsburgh. This work was partially supported by the Intramural Research Program of the Center for Information Technology at the National Institutes of Health. This research used resources from the Oak Ridge Leadership Computing Facility (OLCF) at Oak Ridge National Laboratory, which is supported by the Office of Science of the Department of Energy under Contract DE-AC05-00OR22725. We acknowledge a Director’s Discretionary award on the Summit supercomputer from the OLCF.
Footnotes
COMPETING INTERESTS
The authors declare no competing interests.
REFERENCES
- 1.Ganser BK, Li S, Klishko VY, Finch JT & Sundquist WI Assembly and analysis of conical models for the HIV-1 core. Science 283, 80–83, doi: 10.1126/Science.283.5398.80 (1999). [DOI] [PubMed] [Google Scholar]
- 2.Briggs JA et al. The stoichiometry of Gag protein in HIV-1. Nat. Struct. Mol. Biol 11, 672–675, doi: 10.1038/nsmb785 (2004). [DOI] [PubMed] [Google Scholar]
- 3.Pornillos O, Ganser-Pornillos BK & Yeager M Atomic-level modelling of the HIV capsid. Nature 469, 424–428, doi: 10.1038/nature09640 (2011). [DOI] [PMC free article] [PubMed] [Google Scholar]
- 4.Zhao GP et al. Mature HIV-1 capsid structure by cryo-electron microscopy and all-atom molecular dynamics. Nature 497, 643–646, doi: 10.1038/Nature12162 (2013). [DOI] [PMC free article] [PubMed] [Google Scholar]
- 5.Campbell EM & Hope TJ HIV-1 capsid: the multifaceted key player in HIV-1 infection. Nat. Rev. Microbiol 13, 471–483, doi: 10.1038/nrmicro3503 (2015). [DOI] [PMC free article] [PubMed] [Google Scholar]
- 6.Ambrose Z & Aiken C HIV-1 uncoating: connection to nuclear entry and regulation by host proteins. Virology 454–455, 371–379, doi: 10.1016/j.virol.2014.02.004 (2014). [DOI] [PMC free article] [PubMed] [Google Scholar]
- 7.Luban J, Bossolt KL, Franke EK, Kalpana GV & Goff SP Human immunodeficiency virus type 1 Gag protein binds to cyclophilins A and B. Cell 73, 1067–1078, doi: 10.1016/0092-8674(93)90637-6 (1993). [DOI] [PubMed] [Google Scholar]
- 8.Goujon C et al. Human MX2 is an interferon-induced post-entry inhibitor of HIV-1 infection. Nature 502, 559–562, doi: 10.1038/nature12542 (2013). [DOI] [PMC free article] [PubMed] [Google Scholar]
- 9.Liu Z et al. The interferon-inducible MxB protein inhibits HIV-1 infection. Cell Host Microbe 14, 398–410, doi: 10.1016/j.chom.2013.08.015 (2013). [DOI] [PubMed] [Google Scholar]
- 10.Stremlau M et al. The cytoplasmic body component TRIM5 alpha restricts HIV-1 infection in Old World monkeys. Nature 427, 848–853, doi: 10.1038/Nature02343 (2004). [DOI] [PubMed] [Google Scholar]
- 11.Lukic Z, Dharan A, Fricke T, Diaz-Griffero F & Campbell EM HIV-1 uncoating is facilitated by dynein and kinesin 1. J Virol 88, 13613–13625, doi: 10.1128/jvi.02219-14 (2014). [DOI] [PMC free article] [PubMed] [Google Scholar]
- 12.Malikov V et al. HIV-1 capsids bind and exploit the kinesin-1 adaptor FEZ1 for inward movement to the nucleus. Nat. Commun 6, 6660, doi: 10.1038/ncomms7660 (2015). [DOI] [PMC free article] [PubMed] [Google Scholar]
- 13.Brass AL et al. Identification of host proteins required for HIV infection through a functional genomic screen. Science 319, 921–926, doi: 10.1126/science.1152725 (2008). [DOI] [PubMed] [Google Scholar]
- 14.Konig R et al. Global analysis of host-pathogen interactions that regulate early-stage HIV-1 replication. Cell 135, 49–60, doi: 10.1016/j.cell.2008.07.032 (2008). [DOI] [PMC free article] [PubMed] [Google Scholar]
- 15.Ocwieja KE et al. HIV integration targeting: a pathway involving Transportin-3 and the nuclear pore protein RanBP2. PLoS Pathog 7, e1001313, doi: 10.1371/journal.ppat.1001313 (2011). [DOI] [PMC free article] [PubMed] [Google Scholar]
- 16.Rasaiyaah J et al. HIV-1 evades innate immune recognition through specific cofactor recruitment. Nature 503, 402–405, doi: 10.1038/nature12769 (2013). [DOI] [PMC free article] [PubMed] [Google Scholar]
- 17.Perilla JR & Gronenborn AM Molecular architecture of the retroviral capsid. Trends Biochem. Sci 41, 410–420, doi: 10.1016/j.tibs.2016.02.009 (2016). [DOI] [PMC free article] [PubMed] [Google Scholar]
- 18.Ganser-Pornillos BK, Cheng A & Yeager M Structure of full-length HIV-1 CA: a model for the mature capsid lattice. Cell 131, 70–79, doi: 10.1016/j.cell.2007.08.018 (2007). [DOI] [PubMed] [Google Scholar]
- 19.López CS et al. Determinants of the HIV-1 core assembly pathway. Virology 417, 137–146, doi: 10.1016/j.virol.2011.05.011 (2011). [DOI] [PMC free article] [PubMed] [Google Scholar]
- 20.Gamble TR et al. Crystal structure of human cyclophilin A bound to the amino-terminal domain of HIV-1 capsid. Cell 87, 1285–1294 (1996). [DOI] [PubMed] [Google Scholar]
- 21.Byeon IJL et al. Structural convergence between Cryo-EM and NMR reveals intersubunit interactions critical for HIV-1 capsid function. Cell 139, 780–790, doi: 10.1016/j.cell.2009.10.010 (2009). [DOI] [PMC free article] [PubMed] [Google Scholar]
- 22.Gres AT et al. X-ray crystal structures of native HIV-1 capsid protein reveal conformational variability. Science 349, 99–103, doi: 10.1126/science.aaa5936 (2015). [DOI] [PMC free article] [PubMed] [Google Scholar]
- 23.Jacques DA et al. HIV-1 uses dynamic capsid pores to import nucleotides and fuel encapsidated DNA synthesis. Nature 536, 349–353, doi: 10.1038/nature19098 (2016). [DOI] [PMC free article] [PubMed] [Google Scholar]
- 24.Han Y et al. Magic angle spinning NMR reveals sequence-dependent structural plasticity, dynamics, and the spacer peptide 1 conformation in HIV-1 capsid protein assemblies. J. Am. Chem. Soc 135, 17793–17803, doi: 10.1021/Ja406907h (2013). [DOI] [PMC free article] [PubMed] [Google Scholar]
- 25.Lu M et al. Dynamic allostery governs cyclophilin A-HIV capsid interplay. Proc. Natl. Acad. Sci. U. S. A 112, 14617–14622, doi: 10.1073/pnas.1516920112 (2015). [DOI] [PMC free article] [PubMed] [Google Scholar]
- 26.Mattei S, Glass B, Hagen WJ, Krausslich HG & Briggs JA The structure and flexibility of conical HIV-1 capsids determined within intact virions. Science 354, 1434–1437, doi: 10.1126/science.aah4972 (2016). [DOI] [PubMed] [Google Scholar]
- 27.Russell RW et al. Accuracy and precision of protein structures determined by magic angle spinning NMR spectroscopy: for some ‘with a little help from a friend’. J. Biomol. NMR 73, 333–346, doi: 10.1007/s10858-019-00233-9 (2019). [DOI] [PMC free article] [PubMed] [Google Scholar]
- 28.Gupta R et al. Dynamic nuclear polarization magic-angle spinning nuclear magnetic resonance combined with molecular dynamics simulations permits detection of order and disorder in viral assemblies. J. Phys. Chem. B 123, 5048–5058, doi: 10.1021/acs.jpcb.9b02293 (2019). [DOI] [PMC free article] [PubMed] [Google Scholar]
- 29.Byeon IJL et al. Motions on the millisecond time scale and multiple conformations of HIV-1 capsid protein: implications for structural polymorphism of CA assemblies. J. Am. Chem. Soc 134, 6455–6466, doi: 10.1021/Ja300937v (2012). [DOI] [PMC free article] [PubMed] [Google Scholar]
- 30.Zhang H et al. HIV-1 capsid function is regulated by dynamics: quantitative atomic-resolution insights by integrating magic-angle-spinning NMR, QM/MM, and MD. J Am Chem Soc 138, 14066–14075, doi: 10.1021/jacs.6b08744 (2016). [DOI] [PMC free article] [PubMed] [Google Scholar]
- 31.Campos-Olivas R & Summers MF Backbone dynamics of the N-terminal domain of the HIV-1 capsid protein and comparison with the G94D mutant conferring cyclosporin resistance/dependence. Biochemistry 38, 10262–10271, doi: 10.1021/bi990991x (1999). [DOI] [PubMed] [Google Scholar]
- 32.Fritz M et al. Determination of accurate backbone chemical shift tensors in microcrystalline proteins by integrating MAS NMR and QM/MM. Phys Chem Chem Phys 20, 9543–9553, doi: 10.1039/c8cp00647d (2018). [DOI] [PMC free article] [PubMed] [Google Scholar]
- 33.Dick RA et al. Inositol phosphates are assembly co-factors for HIV-1. Nature 560, 509–512, doi: 10.1038/s41586-018-0396-4 (2018). [DOI] [PMC free article] [PubMed] [Google Scholar]
- 34.Bayro MJ & Tycko R Structure of the dimerization interface in the mature HIV-1 capsid protein lattice from solid state NMR of tubular assemblies. J. Am. Chem. Soc 138, 8538–8546, doi: 10.1021/jacs.6b03983 (2016). [DOI] [PMC free article] [PubMed] [Google Scholar]
- 35.Han Y et al. Solid-state NMR studies of HIV-1 capsid protein assemblies. J. Am. Chem. Soc 132, 1976–1987, doi: 10.1021/Ja908687k (2010). [DOI] [PMC free article] [PubMed] [Google Scholar]
- 36.Hou GJ, Yan S, Trebosc J, Amoureux JP & Polenova T Broadband homonuclear correlation spectroscopy driven by combined R2(n)(v) sequences under fast magic angle spinning for NMR structural analysis of organic and biological solids. J. Magn. Reson 232, 18–30, doi: 10.1016/j.jmr.2013.04.009 (2013). [DOI] [PMC free article] [PubMed] [Google Scholar]
- 37.Brauniger T, Wormald P & Hodgkinson P Improved proton decoupling in NMR spectroscopy of crystalline solids using the SPINAL-64 sequence. Monatsh. Chem 133, 1549–1554, doi: 10.1007/s00706-002-0501-z (2002). [DOI] [Google Scholar]
- 38.Fung BM, Khitrin AK & Ermolaev K An improved broadband decoupling sequence for liquid crystals and solids. J. Magn. Reson 142, 97–101, doi: 10.1006/jmre.1999.1896 (2000). [DOI] [PubMed] [Google Scholar]
- 39.Delaglio F et al. NMRPipe: a multidimensional spectral processing system based on UNIX pipes. J. Biomol. NMR 6, 277–293 (1995). [DOI] [PubMed] [Google Scholar]
- 40.Goddard TD & Kneller DG SPARKY 3. University of California, San Francisco: (2004). [Google Scholar]
- 41.Stevens TJ et al. A software framework for analysing solid-state MAS NMR data. J. Biomol. NMR 51, 437–447, doi: 10.1007/s10858-011-9569-2 (2011). [DOI] [PMC free article] [PubMed] [Google Scholar]
- 42.Schwieters CD, Kuszewski JJ, Tjandra N & Clore GM The Xplor-NIH NMR molecular structure determination package. J. Magn. Reson 160, 65–73 (2003). [DOI] [PubMed] [Google Scholar]
- 43.Schwieters CD, Kuszewski JJ & Clore GM Using Xplor-NIH for NMR molecular structure determination. Prog. Nucl. Magn. Reson. Spectrosc 48, 47–62, doi: 10.1016/j.pnmrs.2005.10.001 (2006). [DOI] [Google Scholar]
- 44.Schwieters CD, Bermejo GA & Clore GM Xplor-NIH for molecular structure determination from NMR and other data sources. Protein Sci. 27, 26–40, doi: 10.1002/pro.3248 (2018). [DOI] [PMC free article] [PubMed] [Google Scholar]
- 45.Bermejo GA, Clore GM & Schwieters CD Smooth statistical torsion angle potential derived from a large conformational database via adaptive kernel density estimation improves the quality of NMR protein structures. Protein Sci. 21, 1824–1836, doi: 10.1002/pro.2163 (2012). [DOI] [PMC free article] [PubMed] [Google Scholar]
- 46.Schwieters CD & Clore GM A pseudopotential for improving the packing of ellipsoidal protein structures determined from NMR data. J. Phys. Chem. B 112, 6070–6073, doi: 10.1021/jp076244o (2008). [DOI] [PubMed] [Google Scholar]
- 47.Schwieters CD, Bermejo GA & Clore GM A three-dimensional potential of mean force to improve backbone and sidechain hydrogen bond geometry in Xplor-NIH protein structure determination. Protein Sci. 29, 100–110, doi: 10.1002/pro.3745 (2020). [DOI] [PMC free article] [PubMed] [Google Scholar]
- 48.Shen Y & Bax A Protein structural information derived from NMR chemical shift with the neural network program TALOS-N. Methods Mol. Biol 1260, 17–32 (2015). [DOI] [PMC free article] [PubMed] [Google Scholar]
- 49.Perilla JR et al. CryoEM Structure Refinement by Integrating NMR Chemical Shifts with Molecular Dynamics Simulations. J. Phys. Chem. B 121, 3853–3863, doi: 10.1021/acs.jpcb.6b13105 (2017). [DOI] [PMC free article] [PubMed] [Google Scholar]
- 50.Adams PD et al. PHENIX: a comprehensive Python-based system for macromolecular structure solution. Acta. Crystallogr. D 66, 213–221, doi: 10.1107/S0907444909052925 (2010). [DOI] [PMC free article] [PubMed] [Google Scholar]
- 51.Pettersen EF et al. UCSF chimera - A visualization system for exploratory research and analysis. J. Comput. Chem 25, 1605–1612, doi: 10.1002/jcc.20084 (2004). [DOI] [PubMed] [Google Scholar]
- 52.Gong Z, Schwieters CD & Tang C Conjoined Use of EM and NMR in RNA Structure Refinement. Plos One 10, doi:ARTN e0120445 doi: 10.1371/journal.pone.0120445 (2015). [DOI] [PMC free article] [PubMed] [Google Scholar]
- 53.Phillips JC et al. Scalable molecular dynamics with NAMD. J. Comput. Chem 26, 1781–1802 (2005). [DOI] [PMC free article] [PubMed] [Google Scholar]
- 54.Huang J et al. CHARMM36m: an improved force field for folded and intrinsically disordered proteins. Nat. Methods 14, 71 (2017). [DOI] [PMC free article] [PubMed] [Google Scholar]
- 55.Zhao G et al. Mature HIV-1 capsid structure by cryo-electron microscopy and all-atom molecular dynamics. Nature 497, 643–646, doi: 10.1038/nature12162 (2013). [DOI] [PMC free article] [PubMed] [Google Scholar]
- 56.Olsson MHM, Søndergaard CR, Rostkowski M & Jensen JH PROPKA3: Consistent treatment of internal and surface residues in empirical pKa predictions. J. Chem. Theory Comput 7, 525–537, doi: 10.1021/ct100578z (2011). [DOI] [PubMed] [Google Scholar]
- 57.Søndergaard CR, Olsson MHM, Rostkowski M & Jensen JH Improved Treatment of Ligands and Coupling Effects in Empirical Calculation and Rationalization of pKa Values. J. Chem. Theory Comput 7, 2284–2295, doi: 10.1021/ct200133y (2011). [DOI] [PubMed] [Google Scholar]
- 58.Humphrey W, Dalke A & Schulten K VMD: visual molecular dynamics. J. Mol. Graph 14, 33–38 (1996). [DOI] [PubMed] [Google Scholar]
- 59.Gullingsrud J, Saam J & Phillips J psfgen User’s Guide Theoretical and Computational Biophysics Group, University of Illinois and Beckman Institute, Urbana: 61801 (2006). [Google Scholar]
- 60.Mei C et al. in SC’11: Proceedings of 2011 International Conference for High Performance Computing, Networking, Storage and Analysis. 1–11 (IEEE; ). [Google Scholar]
- 61.Fiorin G, Klein ML & Hénin J Using collective variables to drive molecular dynamics simulations. Mol. Phys 111, 3345–3362 (2013). [Google Scholar]
- 62.Darden T, York D & Pedersen L Particle mesh Ewald: An N⋅ log (N) method for Ewald sums in large systems. J. Chem. Phys 98, 10089–10092 (1993). [Google Scholar]
- 63.Essmann U et al. A smooth particle mesh Ewald method. J. Chem. Phys 103, 8577–8593 (1995). [Google Scholar]
- 64.Skeel RD & Biesiadecki JJ Symplectic integration with variable stepsize. Ann. Numer. Math 1, 191–198 (1994). [Google Scholar]
- 65.Bussi G, Donadio D & Parrinello M Canonical sampling through velocity rescaling. J. Chem. Phys 126, 014101 (2007). [DOI] [PubMed] [Google Scholar]
- 66.Bussi G, Zykova-Timan T & Parrinello M Isothermal-isobaric molecular dynamics using stochastic velocity rescaling. J. Chem. Phys 130, 074101 (2009). [DOI] [PubMed] [Google Scholar]
- 67.Andersen HC Rattle: A “velocity” version of the shake algorithm for molecular dynamics calculations. J. Comput. Phys 52, 24–34 (1983). [Google Scholar]
- 68.Kräutler V, Van Gunsteren WF & Hünenberger PH A fast SHAKE algorithm to solve distance constraint equations for small molecules in molecular dynamics simulations. J. Comput. Chem 22, 501–508 (2001). [Google Scholar]
- 69.The PyMOL Molecular Graphics System Version 2.0 (Schrödinger, LLC; ). [Google Scholar]
- 70.Stone JE An efficient library for parallel ray tracing and animation Masters thesis, University of Missouri--Rolla, (1998). [Google Scholar]
- 71.Rousseeuw PJ Silhouettes: a graphical aid to the interpretation and validation of cluster analysis. J. Comput. Appl. Math 20, 53–65 (1987). [Google Scholar]
Associated Data
This section collects any data citations, data availability statements, or supplementary materials included in this article.
Supplementary Materials
Data Availability Statement
The coordinates of the atomic structures have been deposited in the Protein Data Bank under accession codes PDB 6WAP for the single CA chain and PDB 6X63 for the CA tube. MAS NMR chemical shifts, dihedral constraints, and distance constraints have been deposited in the Biological Magnetic Resonance Data Bank under accession code 30741.