Abstract
Background
The Chinese Isoetes L. are distributed in a stairway pattern: diploids in the high altitude and polyploids in the low altitude. The allopolyploid I. sinensis and its diploid parents I. yunguiensis and I. taiwanensis is an ideal system with which to investigate the relationships between polyploid speciation and the ecological niches preferences.
Results
There were two major clades in the nuclear phylogenetic tree, all of the populations of polyploid were simultaneously located in both clades. The chloroplast phylogenetic tree included two clades with different populations of the polyploid clustered with the diploids separately: I. yunguiensis with partial populations of the I. sinensis and I. taiwanensis with the rest populations of the I. sinensis. The crow node of the I. sinensis allopolyploid system was 4.43 Ma (95% HPD: 2.77–6.97 Ma). The divergence time between I. sinensis and I. taiwanensis was estimated to 0.65 Ma (95% HPD: 0.26–1.91 Ma). The narrower niche breadth in I.sinensis than those of its diploid progenitors and less niche overlap in the pairwise comparisons between the polyploid and its progenitors.
Conclusions
Our results elucidate that I. yunguinensis and I. taiwanensis contribute to the speciation of I. sinensis, the diploid parents are the female parents of different populations. The change of altitude might have played an important role in allopolyploid speciation and the pattern of distribution of I. sinensis. Additionally, niche novelty of the allopolyploid population of I. sinensis has been detected, in accordance with the hypothesis that niche shift between the polyploids and its diploid progenitors is important for the establishment and persistence of the polyploids.
Keywords: Allopolyploid, Altitude, Chinese Isoetes, Distribute pattern, Niche breadth, Niche novelty
Background
Polyploidy, or whole-genome duplication (WGD), is widespread in plants, fungi and animals [1–3]. Allopolyploidy and autopolyploidy are the two ways to duplicate chromosomal materials: the former one originates from a hybridization of two species with associated genome duplication while the latter one results from genome duplication within one species [4–6]. WGD is one of the most important forces for vascular plant evolution [7]. Nearly 25% of vascular plants are recent polyploids [7], and more than 15% of angiosperm species and 30% of ferns are estimated to be polyploids through speciation [8]. Additionally, an ancient WGD event occurring in flowering plants is hypothesized to have catalysed key innovations that led to the success and diversification of major clades of angiosperms [9]. Polyploidy has extensive genetic, physiological, morphological, and ecological ramifications [10]. The increasing genome size and genomic content which potentially provides strong tolerance to environmental stresses and increases the possibility to colonize new habitats [11–13]. Therefore, the distribution of polyploids is assumed to be more likely in high altitude regions and the ecological niches of polyploids should be both distinct and broader than those of their diploid progenitors [14, 15].
Isoetes L. is an ancient heterosporous Lycopsids with worldwide distribution and there are approximately 150–350 extant species [16]. The origin of Isoetes can be dated back to the Devonian Period and this genus is one of the representatives of early diverging plants [17, 18]. Six Isoetes species are reported in China: I. hypsophila [19], I. shangrilaensis [20], I. yunguiensis [21], I. taiwanensis [22], I. sinensis [23] and I. orientalis [24]. However, the distribution of Isoetes in China doesn’t adhere to the hypothesis that the distribution of polyploids is assumed to be more likely in high altitude regions. They are distributed in a stairway pattern: parts of diploids in the high elevation: I. hypsophila and I. shangrilaensis in the Qinghai-Tibet Plateau (QTP), the first step, and I. yunguiensis in the Yunnan-Guizhou Plateau (YGP), the second step; polyploids and one diploid in the low elevation: the polyploids I. sinensis and I. orientalis in the middle and lower reaches of the Yangtze River, and the diploid I. taiwanensis in the Taiwan and Kinmen Islands, the third step.
The morphological evidence, intermediate megaspore texture of I. sinensis between those of I. yunguiensis and I. taiwanensis, suggests that these two diploid Isoetes are the parents of I. sinensis [25–27]. In addition, Taylor’s research supported this hypothesis because two different clones of the second intron of a LEAFY homolog were detected from I. sinensis: one of them similar to the I.taiwanensis sequence while the other similar to the I. yunguiensis sequence [25]. The allopolyploid I. sinensis and its diploid parents (I. yunguiensis and I. taiwanensis) is an ideal system with which to investigate the relationships between polyploid speciation and changes in ecological preferences. Therefore, we would like to examine whether this distribution pattern corresponds to any niche shift among the polyploid and its progenitors, which can provide evidence toward the reason for the establishment and persistence of the polyploid. In this research, we quantified and compared the ecological niche shifts using ecological niche models in geographic space [28, 29] and using multivariate statistics in environmental space [30, 31].
The change of altitude might have played an important role in allopolyploid speciation and the pattern of distribution of the genus Isoetes of China [32]. By calculating the divergence time among species, we can associate the distinct pattern of distribution with tectonic. Larsen [33] and Kim [34] used several chloroplast locus and nrITS to estimate the divergence time of the Isoetes in worldwide. However, there is a discrepancy in the divergence time of two diploid species I. yunguiensis and I. taiwanensis. Larsen suggested that the divergence time in East Asian Isoetes was 5 Ma [33], while the divergence time between yunguiensis and I. taiwanensis was 11.1 Ma in the Kim’s research [34]. Several molecular marker can only provide limited genetic information and therefore may have conflicts in different research. In order to verify whether the distribution pattern is related to the tectonic of China, thirteen chloroplast genome of Isoetes is used to calculate the divergence among the allopolyploid I. sinensis and its diploid parents I. yunguiensis and I. taiwanensis.
Although previous researches proved that the allopolyploidization of I. sinensis, the maternal donor of I. sinensis still not clearly explained. The chloroplast phylogenetic tree can provide the information for the maternal origin of allopolyploid populations of I. sinensis [25, 35]. Kim used one chloroplast DNA trnS-psbC spacer regions to infer that I. yunguiensis was likely the maternal genome donor in the allopolyploidization process of I. sinensis [35]. We think that only one chloroplast spacer regions and one individual cannot fully explain the maternal origin of I. sinensis. In the present research, we enlarged the sample size to population level and used four plastid genetic markers (ycf66, atpB-rbcL, petL-psbE and trnS-trnG) to speculate the maternal origin of I. sinensis. Meanwhile, we used the second intron of LEAFY to verify the hybridization of I. sinensis in the population level. Additionally, another polyploid I. orientalis has never been included in previous analysis. In the present study, we also clarify the origins of I. orientalis by examining both nuclear and plastic sequences.
To investigate the relationship between species distribution patterns and the tectonic of China, we estimated the divergence time among the I. sinensis allopolyploid system. We also discuss the maternal origin and hybridization of I. sinensis in population level. In this study, we used the environmental factor at the China scale (temperature, precipitation) to define and compare the realized climatic niches of the diploid (I. yunguiensis and I. taiwanensis) and the tetraploid (I. sinensis).
Results
Nuclear DNA
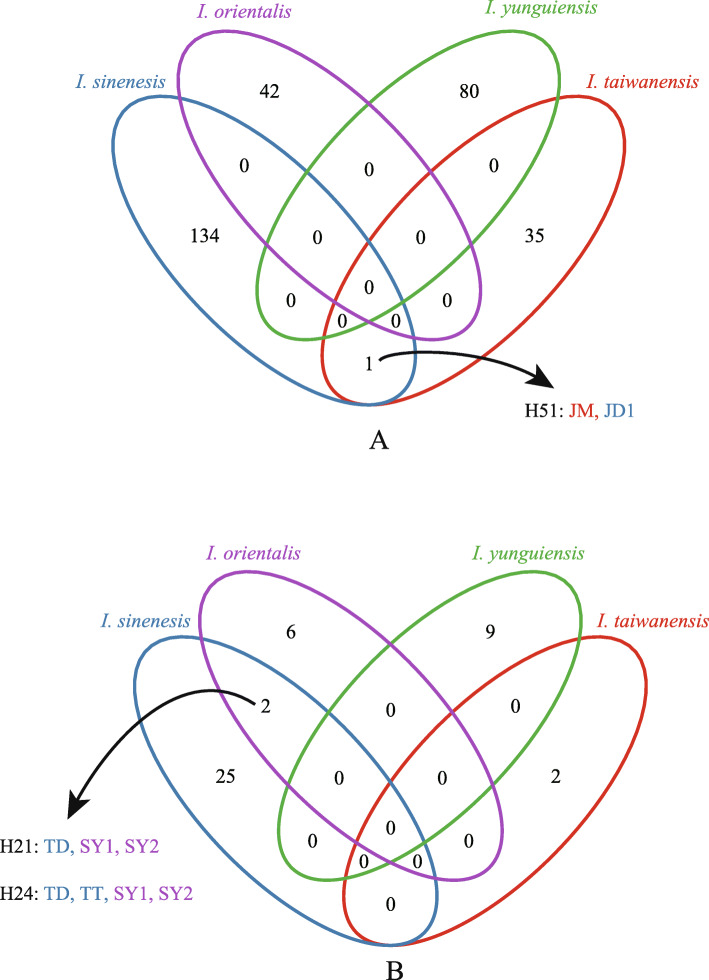
The length of the aligned LEAFY sequence was 1017 bp. Two hundred ninety-two haplotypes were identified from 380 LEAFY sequences. Most shared haplotypes were detected within species, such as H2 and H108 in I. yunguiensis, H72 in I. taiwanensis, H92 in I. sinensis and H133 in I. orientalis (Table S3). And one shared haplotype (H51) was found between JD1 and JM from two different species, I. sinensis and I. taiwanensis (Fig. 2a, Table S3).
Fig. 2.
a: The Venn diagram of the haplotypes of nuclear DNA data; b: The venn diagram of the haplotypes of chloroplast DNA data
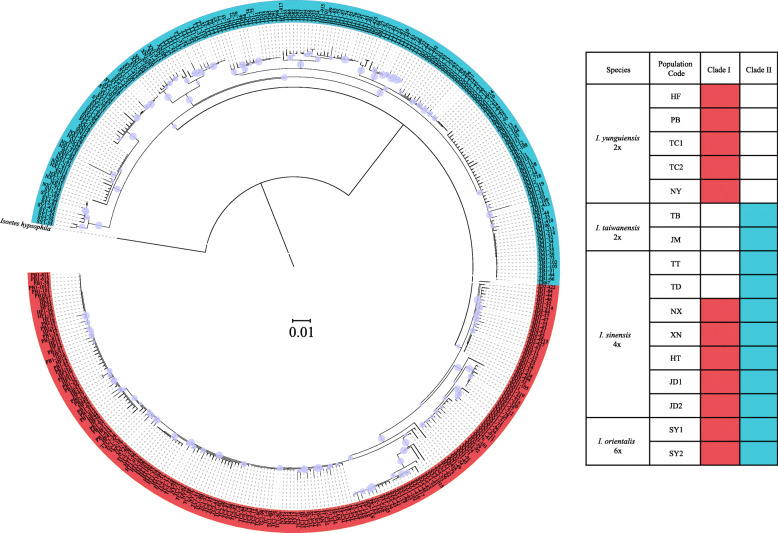
There were two major clades in the nuclear phylogenetic tree (Fig. 3). The diploids were exclusively found in either of these clades: I. yunguiensis in Clade I and I. taiwanensis in Clade II. Most populations of I. sinensis were simultaneously located in both clades, for example, JD (JD1 and JD2), XN, NX, and HT. Two populations from I. sinensis, TD and TT were only found in Clade II. And all population of I. orientalis were also located in both clades.
Fig. 3.
Phylogenetic tree of Chinese Isoetes complex based on the second intron of LEAFY homologue. The circles on each node represent the strong supports (higher than 0.75). Two clades are denoted by different color bars. The table indicates where the clones of each population are distributed in the phylogenetic tree
Multiple maternal lineages of Isoetes
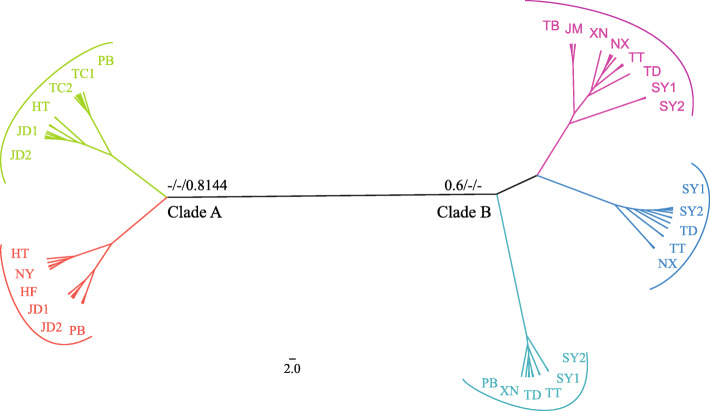
The lengths of the aligned sequences of ycf66, atpB-rbcL, petL-psbE and trnS-trnG were 493, 813, 1428 and 836 bp respectively and the concatenated sequences were 3570 bp. Two major clades were inferred in the plastid phylogenetic tree. Clade A was composed of all the populations from I. yunguiensis and the polyploid populations of HT and JD. Clade B consisted of all the populations from I. taiwanensis, and the polyploidy populations of XN, TT, NX, TD, and SY (Fig. 4). And two shared haplotypes were found from different species, I. sinensis and I. orientalis, H21 for populations TD and SY, H24 for populations TD, TT, and SY (Fig. 2b).
Fig. 4.
Phylogenic tree of the Chinese Isoetes complex based on the four plastid DNA regions including ycf66, atpB-rbcL, petL-psbE and trnS-trnG (the posterior probability of Bayesian Inference of Mrbayes/the bootstrap values of Maximum Parsimony analysis/ Posterior possibility of Bayesian Inference from Beast are showed on each clades). Five subclades are denoted by different color bars and the population codes are labeled in each subclade
Analysis of divergence times
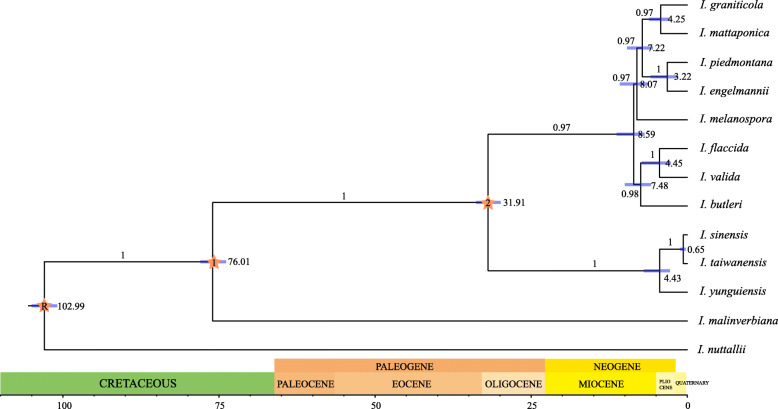
The BEAST dating analysis estimated the crow node of the I. sinensis allopolyploid system was 4.43 Ma (95% HPD: 2.77–6.97 Ma) falling into later Miocene to early Pliocene (Fig. 5). The divergence time between I. sinensis and I. taiwanensis was estimated to 0.65 Ma (95% HPD: 0.26–1.91 Ma) around the Pleistocene of Quaternary (Fig. 5).
Fig. 5.
Chronogram showing divergence times estimated in BEAST based on chloroplast genome data. Blue bars represent 95% high posterior density for the estimated mean dates. Node labeled R, 1 and 2 is the calibration point (for more details, see Materials and Methods)
Niche variation and quantification in geographical space
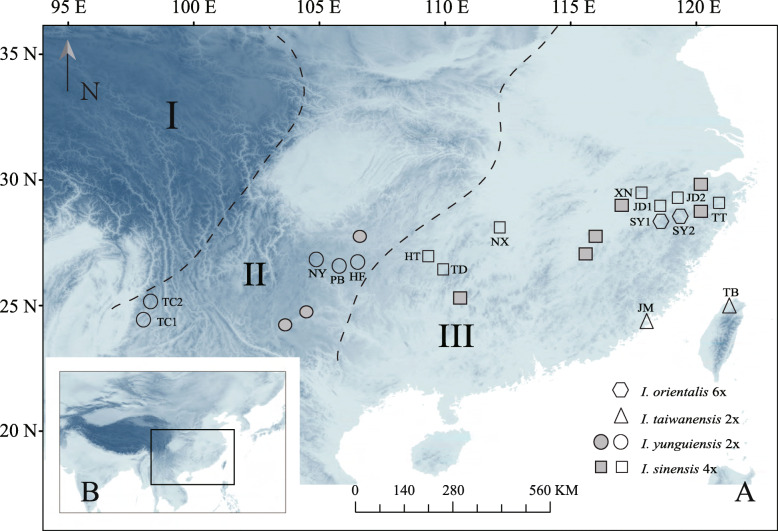
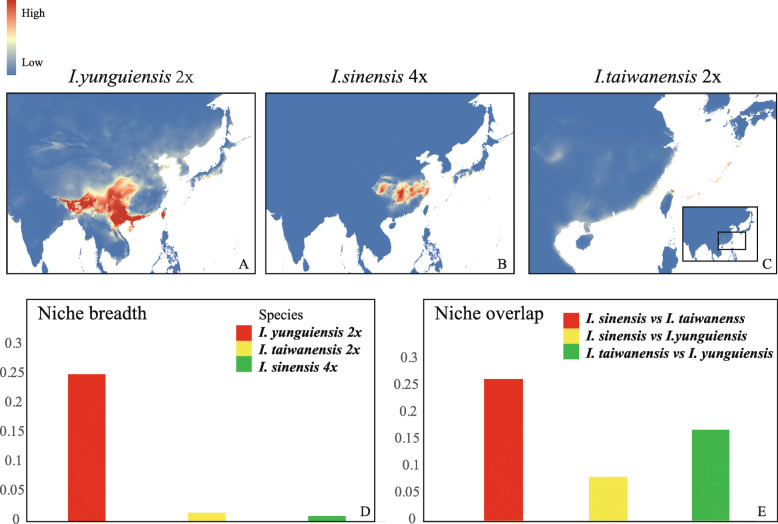
The ENMs for I. sinensis and its diploid progenitors showed good performances based on their high AUC values (greater than 0.9 for all models). The predicted current distributions of these species were consistent with their present distributions (Fig. 1 and Fig. 6a, b, c). The niche breadths for I. yunguiensis, I. taiwanensis and I. sinensis were 0.25, 0.014 and 0.008 respectively (Fig. 6d). The Schoener’s D index between I. sinensis and I. yunguiensis was 0.08, 0.26 between I. sinensis and I. taiwanensis, and 0.17 between I. yunguiensis and I. taiwanensis (Fig. 6e).
Fig. 1.
The map was download from WorldClim 1.4 (www.worldclim.org), and it is licensed under a Creative Commons Attribution-ShareAlike 4.0 International License (http://creativecommons.org/licenses/by-sa/4.0/). Geographical distributions of the sampled populations of Chinese Isoetes complex: hexagons, triangles, circles and squares are used to represent I. orientalis, I. taiwanensis, I. yunguiensis and I. sinensis respectively. The populations colored as grey are extinct. The dotted lines delimit the three distinct elevation stairs (elevation decreases from left to right) in China
Fig. 6.
a-c: The projected distributions for the allopolyploid (I. sinensis) and the diploid parents (I. taiwanensis and I. yunguiensis) under the current climate conditions. The color of the area indicates the occurrence probability (red means high probability while blue means low probability). d: The niche breadth of the allopolyploid (I. sinensis) and the diploid parents (I. taiwanensis and I. yunguiensis). e: The niche overlap between each species
Niche variation and quantification in ecological space
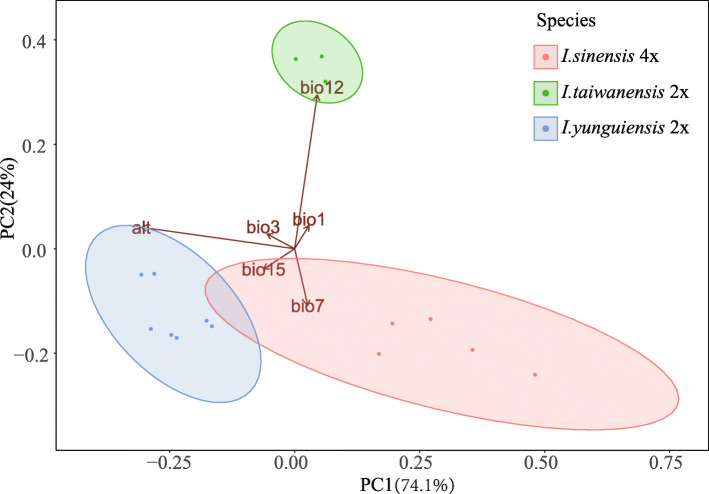
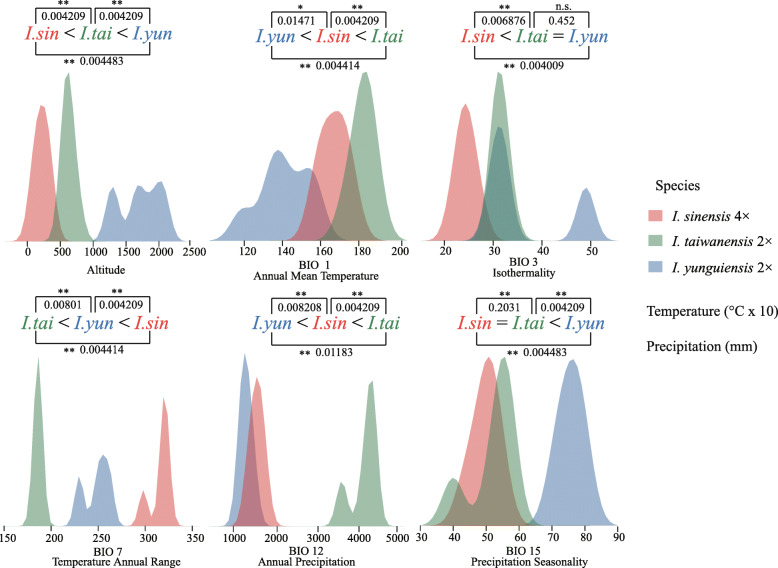
The first two principal components (PCs) identified by PCA collectively explained 98.1% of the total variation among the three species (PC1 = 74.1%, PC2 = 24%) and clearly separated these species (Fig. 7). Altitude was strongly associated with PC1 and separated I. yunguiensis from the others along. Annual precipitation showed a high correlation with PC2 and separated I. taiwanensis from the others along. The values of the six retained Bioclim layers of I. yunguiensis, I. taiwanensis and I. sinensis were significantly different (P ≤ 0.05) from each other in four out of the six individual environmental variables (Table 1). The ecology of the polyploid species I. sinensis were characterized by the highest values for temperature annual range (BIO7) and the lowest values for altitude, with intermediate values for annual mean temperature (BIO1) and annual precipitation (Fig. 8). The ecology of the diploid species I. taiwanensis were characterized by the highest values for annual mean temperature, annual precipitation and the lowest values for temperature annual range (Fig. 8). Conversely, the ecology of the diploid species I. yunguiensis showed the lowest values for annual mean temperature and annual precipitation but the highest values for altitude (Fig. 8).
Fig. 7.
Principal component analysis for environmental variables of the allopolyploid (I. sinensis) and the diploid parents (I. taiwanensis and I. yunguiensis). The percentage variations explain by each principal component are indicated in parenthesis
Table 1.
The results of the nonparametric Kruskal test for species pairwise comparison in each climate variable. The asterisk indicates a significant difference between the two species in the respective variable (see also Fig. 7)
| climatic variable | I.sinensis vs I.yunguiensis | I.sinensis vs I.taiwanensis | I.taiwanensis vs I.yunguiensis |
|---|---|---|---|
| alt | 0.004483(**) | 0.004209(**) | 0.004209(**) |
| bio1 | 0.004414(**) | 0.01471(*) | 0.004209(**) |
| bio3 | 0.004009(**) | 0.006876(**) | 0.452(n.s.) |
| bio7 | 0.004414(**) | 0.00801(**) | 0.004209(**) |
| bio12 | 0.01183(*) | 0.008208(**) | 0.004209(**) |
| bio15 | 0.004483(**) | 0.2031(n.s.) | 0.004209(**) |
** P ≤ 0.01
* P ≤ 0.05
n.s. P > 0.05
Fig. 8.
Kernel density plots of the six environmental variables for the Isoetes allopolyploid system in China. Differentiation among species and the results of the nonparametric Kruskal-test are indicated in each plot. The equal sign indicates the lack of significant differences (p ≥ 0.05), while the significant differences are indicated by either higher or lower sign (p < 0.05)
Discussion
Hybridization and polyploidization complicate the speciation of the Chinese Isoetes
Our results verified that most populations of I. sinensis originate from the allopolyploidization between I. yunguiensis and I. taiwanensis. Interestingly, all the clones from the populations TT and TD of I. sinensis are exclusively placed in Clade II (Fig. 2), which hints the individuals from these populations might be homozygote. These two populations are in distant geographic locations (Fig. 1) and in different subclades in the nuclear tree (Fig. 3). It would be worthwhile to perform more comparisons between them and other allopolyploid populations in the perspectives of morphology, ecology and so on.
On the other hand, the chloroplast phylogenetic tree can provide the information for the maternal origin of allopolyploid populations of I. sinensis [25, 35]. Kim inferred the diploid I. yunguiensis as the maternal progenitor of I. sinensis [35]. However, our chloroplast phylogeny confirmed I. yunguiensis is the maternal progenitor solely for HT and JD populations whereas the rest populations (TT, TD, XN and NX) showed I. taiwanensis as their maternal progenitor (Fig. 4). The main finding here is that I. sinensis originated multiple times from reciprocal maternal progenitors, whereas it has previously been suggested a single maternal origin. We originally assumed that the exclusive hybridization pattern might adapt the allopolyploids to the specific environments. Nevertheless, we do not detect any ecological niche differences in ecological space between the populations with the different maternal contributors (Fig. S1, Table S6). Thus, this exclusive hybridization pattern possibly results from the founder effect, although further investigations is needed to validate this hypothesis.
In addition, I. orientalis (hexaploid) was found by Liu et al. in China, Songyang County of Zhejiang Province in 2006 [24]. But the speciation of I. orientalis has never been explored. In this study, we discuss the hybridization and polyploidization of I. orientalis in the first time. In the nuclear tree, the clones from each I. orientalis individuals separated in both two major clades means that both Yungui and Taiwan ancestral lineages may be involved in the speciation of this species (Fig. 3). Additionally, two shared chloroplast haplotypes are detected between the homozygote populations of I. sinensis and I. orientalis (Fig. 2b) and these populations also clustered with I. orientalis in the same clade of the chloroplast tree (Fig. 4). We hypothesize that I. orientalis is possibly formed by the hybridization between the I. yunguinensis (paternal donor) and the homozygote (the populations of TT and TD) from I. sinensis (maternal donor). Similar scenarios are observed in other hexaploids Isoetes, Isoetes japonica and Isoetes coreana. I. coreana originates from the diploid I. taiwanensis and the tetraploid Isoetes hallasanensis, while I. japonica comes from I. taiwanensis and I. sinensis [35].
I. sinensis allopolyploid system distribute pattern and the uplifted of land
Previous study hypothesized that the polyploidy speciations of Isoetes in East Asia might originate and develop from Holocene (Quaternary) and occurring only in low altitude regions [32]. But this hypothesis did not based on the divergence time among these species. The age estimate for the node I. sinensis allopolyploid system is 4.43 ma, when the I. yunguiensis lineage is distinct to the I. taiwanensis lineage (I. taiwanensis and I. sinensis, Fig. 5). The chloroplast genome sample of I. sinensis was acquired from Fuzhou City (119°23′89.30″E, 26°08′76.41″N), Fujian Province of China [36]. We assume that I. taiwanensis is the maternal progenitor for this population of I. sinensis. And the divergence time of this lineage is 0.65 Ma (Fig. 5).
Hybrid speciation is a form of speciation where hybridization between two different species, hence the species splits between two parents is the first step of hybrid. Therefore, the allopolyploidization of I. sinensis might happen during 4.43 Ma (Pliocene) to 0.65 Ma (Pleistocene). The YGP has consistently responded to each period of the Qinghai–Tibetan Plateau’s uplifting, which reached its present elevation some 3.4 Ma, during the Pliocene [37]. The allopolyploidy speciations of I. sinensis may originate and develop from Pliocene to Pleistocene, after the uplifting of the YGP. Our results consist with part of the hypothesis: the allopolyploidization of I. sinensis only occurred in low altitude regions but earlier than Holocene (Quaternary). Dispersal of Isoetes spores is often accomplished via floating leaves [38], which is impossible from low to the high elevation. Therefore, polyploids with better adaptability are only found in the low altitude region. Our results conclude that the change of altitude might have played an important role in allopolyploid speciation and the pattern of distribution of the Chinese Isoetes.
Niche variation and quantification in geographical and ecological space
Polyploids, characterized by increased genome size and genomic content, are expected to have higher ecological tolerances and broader ecological niche breadth than their diploid progenitors [12, 13]. However, the difference of the niche breadth between the polyploids and diploids can vary in different situations. For instance, there is no significant difference of niche breadth within Claytonia perfoliata species complex [39], broader niche breadth in Clarkia polyploids [40], and narrower niche breadth in Primula polyploids [15]. The highest niche breadth in our Isoetes allopolyploid system is the breadth of I. yunguinensis, 0.25 while the breadths of I. sinensis and I. taiwanensis are much narrower and similar, 0.014 and 0.008 respectively (Fig. 6d). Instead of I. sinensis, I. yunguinensis fits in with the expectation for polyploids that inhabit to harsher environments (higher altitude regions) and possess broader niche breadth. This might be related to the older age and better adaptation of I. yunguiensis before the origin of the polyploids, which is consistent with the similar situation in Primula. Primula farinosa can spread and adapt to various environments before the origin of the polyploid species because of its older age and higher levels of genetic morpholisms [15]. It will be worthwhile to explore the underlying genetic mechanisms for such ecological consequences.
In the terms of niche overlap, I. sinensis had Schoener’s D similarity indexes < 0.3 in both pairwise comparisons with its progenitors, which accords with the standards for niche novelty, one pattern of niche shift in Marchant’s research [10]. The PCA in ecological space also clearly separates these three species (Fig. 7). Additionally, the PCA indicates that altitude is one of the primary factors separating the species. This result coincides with the geographical pattern, in which I. yunguiensis is distributed at a higher altitude than the other two species (Table 2) [41]. Previous research on Polystichum saximontanum obtained the similar conclusion that altitude could have played a significant role in niche shift of the polyploid from its progenitors [10]. Niche differences between allopolyploid and the progenitors are also observed from the kernel density plot (Fig. 8; Table 1). In general, our results agree with the existence of niche shift between the polyploids and its diploid progenitors in our Isoetes allopolyploid system. Niche novelty is the approach I. sinensis took when it established and persisted, and altitude plays a crucial role in this niche shift.
Table 2.
Ploidy, population code, number of samples for plastid DNA (NS) and number of clones for nuclear DNA (NC) and locations (including geographical coordinates and altitudes) of the Chiese Isoetes complex and one outgroup species (I. hypsophila)
| Species | Ploidy | Population code | NS | NC | Location | Geographical Coordinates | Altitude/m | |
|---|---|---|---|---|---|---|---|---|
| Outgroup | I. yunguiensis | 2 | HF | 4 | 20 | Hongfenghu, Guizho, China | N 26° 29′; E 106° 58′ | 1231 |
| 2 | PB | 5 | 25 | Pingba, Guizhou, China | N 26° 25′; E 106° 17′ | 1280 | ||
| 2 | TC1 | 5 | 25 | Tengchong, Guizhou, China | N 24° 52′; E 098° 34′ | 1769 | ||
| 2 | TC2 | 5 | 25 | N 25° 00′; E 098° 34′ | 2063 | |||
| 2 | NY | 2 | 10 | Nayong, Guizhou, China | N 22° 44′; E 105° 23′ | 1672 | ||
| I. taiwanensis | 2 | TB | 5 | 25 | Taibei, Taiwan, China | N 25° 10′; E 121° 33′ | 880 | |
| 2 | JM | 3 | 25 | Kinmen, Taiwan, China | N 24° 27′; E 118° 23′ | 94 | ||
| I. sinensis | 4 | HT | 10 | 25 | Huitong, Hunan, China | N 26° 45′; E 109° 37’ | 284 | |
| 4 | TD | 10 | 25 | Tongdao, Hunan, China | N 26° 20′; E 109° 51′ | 494 | ||
| 4 | NX | 10 | 25 | Ningxiang, Hunan, China | N 28° 11′; E 112° 17’ | 84 | ||
| 4 | XN | 10 | 25 | Xiuning, Anhui, China | N 29° 42′; E 118° 09′ | 360 | ||
| 4 | TT | 10 | 25 | Tiantai, Zhejiang, China | N 29° 15′; E 121° 05’ | 942 | ||
| 4 | JD1 | 10 | 25 | Jiande, Zhejiang, China | N 29° 28′; E 119° 14′ | 134 | ||
| 4 | JD2 | 10 | 25 | N 29° 28′; E 119° 15′ | 134 | |||
| I. orientalis | 6 | SY1 | 10 | 25 | Songyang, Zhejiang, China | N 28° 47′; E 119° 12’ | 235 | |
| 6 | SY2 | 10 | 25 | N 28° 46′; E 119° 12’ | 183 | |||
| I. hypsophila | 2 | BY | 1 | 1 | Baiyu,Sichuang, China | N 30° 58′; E 099° 37′ | 3980 |
Conclusions
Our results elucidate that I. yunguinensis and I. taiwanensis contribute to the speciation of I. sinensis, while some of them (homozygote) originate from the I. taiwanensis. Besides, our chloroplast phylogeny confirmed I. yunguiensis is the maternal progenitor solely for HT and JD populations whereas the rest populations (TT, TD, XN and NX) showed I. taiwanensis as their maternal progenitor. The interesting and complex hybrid patterns have been detected at the population level. The change of altitude might have played an important role in allopolyploid speciation and the pattern of distribution of I. sinensis. The speciation of I. orientalis has been first explored in this research. We hypothesize that I. orientalis is formed by the hybridization between I. yunguiensis as paternal progenitor and the homozygote (the populations of TT and TD) from I. sinensis as maternal progenitor. The change of altitude might have played an important role in allopolyploid speciation and the pattern of distribution of the Chinese Isoetes. Additionally, niche novelty of I. sinensis has been detected which is in accordance with the hypothesis that niche shift between the polyploids and its diploid progenitors is important for the establishment and persistence of the polyploids. Meanwhile, the narrower niche breadth has been found in the polyploid than its diploid progenitors.
Methods
Population sampling
One twenty-one individuals from 16 populations were used (including one outgroup). Five to ten plants were sampled in each population (Fig. 1; Table 2). The ploidy level of the plants has been determined by chromosome counts or spore size measurements [26, 27, 32].
DNA extraction, PCR amplification and sequencing
Total genomic DNA was extracted from 0.5 g silica-dried leaf tissue for each sample through a modified cetyltrimethylammonium bromide (CTAB) procedure [42]. The second intron of LEAFY (LEAFY) was amplified using the primers 30F and 1190R [25]. After preliminary screening, introns of ycf66, the intergenic regions of atpB-rbcL [43], petL-psbE [44] and trnS-trnG [45], were chosen as plastid genetic markers. The primers for ycf66 and petL-psbE were designed according to the complete chloroplast genome of Isoetes flaccida [46]. The PCR products of LEAFY were purified by an agarose gel DNA extraction kit (BioTeke, China), and then cloned into a pMD19-T vector system (TaKaRa Biotechnology (Dalian) Co., Ltd., China). Five positive clones of LEAFY from each accession were selected. All the PCR products and were sequenced in both directions (except for ycf66, which was sequenced in one direction because of the short length) on an ABI 3730 DNA Sequencer using BigDye Terminator version 3.1 (Applied Biosystems). The one-directional sequences (ycf66) were checked using the software Chromas 1.62 (Technelysium Pty, Australia) and the two complementary sequences were assembled using ContigExpress 6.0.620.0 (InforMax, Inc., USA). All the nuclear and plastid sequences were uploaded to GenBank (the National Center for Biotechnology Information, http://www.ncbi.nlm.nih.gov). The serial numbers of these sequences are detailed in Additional file 1: Table S1 and S2.
Phylogenetic analyses of nuclear and plastid marker
DnaSP version 5.0.0 was used to identify the haplotypes in the nuclear sequences [47]. Maximum likelihood (ML) was used to construct the nuclear phylogenetic tree. ML trees were constructed by FastTree 2.1.10 using GTR + CAT model and other default settings [48].
The incongruence length difference (ILD) test, was performed in PAUP* 4.0 for the plastid DNA sequences (ycf66, atpB-rbcL, petL-psbE and trnS-trnG) using 100 homogeneity replicates with heuristic searches under parsimony analysis [49, 50]. The result of the ILD test indicated that there was no incongruence among the plastid DNA marker (P > 0.05). Accordingly, sequences of the four plastid DNA regions were concatenated into one sequence for subsequent analysis. DnaSP version 5.0.0 was used to identify the haplotypes in the plastid sequences [47].
Maximum parsimony (MP) and Bayesian inference (BI) were used to construct the chloroplast phylogenetic tree. The best-fit models HKY + G was chosen for the plastid DNA data, based on the Akaike information criterion (AIC) standards in MrModeltest [51]. MP analysis was performed using the program PAUP* 4.0 [50]. A heuristic searches strategy was employed; 500 replicates with random taxon-addition sequences in combination with tree-bisection-reconnection branch swapping; the option MULPARS functional was kept but not STEEPEST DESCENT. Node support was estimated with 1000 bootstrap values [52]. BI analysis was conducted using the program MrBayes 3.1 [53]. Bayesian Markov chain Monte Carlo (MCMC) inference was used in two independent replicates of four simultaneous chains, with a starting random tree, for 1000,000 MCMC generations, and tree sampled every 1000 generations; first 25% of the 1000,000 generations discarded as a burn-in. The posterior probability was calculated from the consensus of the remaining trees. Moreover, BEAST v 1.8.0 was used to further attest the relationship of plastid sequences with the same nucleotide substitution model (HKY + G) [54]. Two MCMC chains run for 8,000,000 generations with sampling every 1000 generations. Tracer v1.6 (http://beast.bio.ed.ac.uk/Tracer) was used to check whether the values of the parameter effective sample size (ESS) were greater than 200, which ensures a good mixing of MCMC chains. Trees were summarized and annotated using TreeAnnotator v1.8.0, after discarding by the first 25% generations.
Analysis of divergence times
The chloroplast genome data of Isoetes was downloaded from GenBank and the detail accession number was present in Table 3. Sequences were aligned by the program MATTT [55] with the “auto” strategy. The ML chloroplast genome phylogenetic tree was estimated by IQ-TREE [56]. The divergence time of different lineages was estimated by a Bayesian approach implemented in BEAST v 1.8.4 [57]. The tree estimated by IQ-TREE was used as starting tree. The BEAUti interface was used to generate input files for BEAST, in which a GTR + I + G model for the combined dataset was applied with a Yule speciation tree prior and an uncorrelated lognormal molecular clock model. Three calibrated nodes were refer to TimeTree web resource (http://www.timetree.org/) and Larsen’s result [32]. Set a normal distribution on the age of the root, the treeModel.rootHeight parameter and choose normal. Parameterize the normal distribution so that the mean and initial value are equal to 103 and the stdev (standard deviation) is equal to 10. Node 1and 2 was also used the normal distribution with an offset of 76 and 32 respectively, the stdev is both equal to 10. The BEAST trees were sampled every 1000 generations and ran for 10,000,000 generations. Tracer v1.5 (http://beast.bio.ed.ac.uk/Tracer) was used to check whether the values of the parameter effective sample size (ESS) were greater than 200. The final annotation was completed by using TreeAnnotator v1.8.0 after discarding the first 10% generations.
Table 3.
Chloroplast genome download information
| Species | Accession number |
|---|---|
| I. butleri | NC_038071.1 |
| I. engelmannii | NC_038080.1 |
| I. flaccida | NC_014675.1 |
| I. graniticola | NC_039821.1 |
| I. malinverbiana | NC_040924.1 |
| I. mattaponica | NC_039703.1 |
| I. melanospora | NC_038072.1 |
| I. nuttallii | NC_038073.1 |
| I. piedmontana | NC_040925.1 |
| I. sinensis | MN172503.1 |
| I. taiwanensis | MF149843.1 |
| I. valida | NC_038074.1 |
| I. yunguiensis | NC_041146.1 |
Niche variation and quantification in geographical space
We defined the allopolyploid population of I. sinensis and its diploid progenitors, I. yunguiensis and I. taiwanensis, as an allopolyploid system. To predict the suitable distributions of all the Isoetes in this allopolyploid system under the current climate conditions, eighteen occurrence records were used: five records of I. sinensis, seven records of I. yunguiensis and six records of I. taiwanensis (Table S5). Most of these occurrence records were gathered from georeferenced specimens [41], while four records of I. taiwanensis collected from GBIF (https://www.gbif.org/) and Plants of Taiwan (http://tai2.ntu.edu.tw/index.php). We used all 19 environmental layers and altitude information from the WorldClim 1.4 dataset (http://www.worldclim.org/) with the spatial resolution of 2.5 arc-minutes for training and projecting ENM models, and it is licensed under a Creative Commons Attribution-ShareAlike 4.0 International License (http://creativecommons.org/licenses/by-sa/4.0/) [58]. To avoid possible confounding effects of correlated variables and overfitting of niche models, correlation coefficients were calculated using the ‘correlation and summary stats’ tool of SDMtoolbox in ArcMap [10, 59]. Six Bioclim layers (altitude, annual mean temperature, isothermality, temperature annual range, annual precipitation, and precipitation seasonality) were retained based on their correlation values below |0.75|. ENM models were constructed for each species through 10 replicates in MaxEnt 3.3.3 k with 75% of the occurrence records to calibrate the model and 25% to test it [60]. The area under the ‘receiver operating characteristic curve’ (AUC) was used to assess the performance of each model [61]. The average predicted models for each species were employed to calculate the niche breadth and the pairwise niche overlap in geological space by ENMTools1.3 [41, 62]. The Schoener’s D similarity index is the measurement of the niche overlap, with the index ranging from 0 (no niche overlap) to 1 (identical niches) [63].
Niche variation and quantification in ecological space
The values of the six retained Bioclim layers for each occurrence record were extracted by the ‘Point sampling tool’ plugin in QGIS v2.18.13 (http://qgis.org) and used as inputs to quantify the niche overlap and divergence within the three Isoetes in our allopolyploid system through a principal component analysis (PCA). The nonparametric Kruskal–Wallis test was used to compare species for each environmental factor and kernel density plots were used to visualize these differences [64]. All statistical analyses and plots were conducted in R [65].
Supplementary information
Additional file 1: Table S1. The serial numbers of plastid DNA sequences in this study. Table S2. The serial numbers of nuclear DNA sequences in this study. Table S3. Haplotypes information of nuclear DNA data. Table S4. Haplotypes information of cpDNA data. Table S5. Location records used for ecological niche modeling. Table S6. Results of the nonparametric Kruskal test applied for the populations whose maternal contributor are different in the allopolyploid populations of I.sinensis.
Additional file 2: Figure S1. Kernel density plots of the six environmental variables for the populations whose maternal contributor are different in the allopolyploid of I. sinensis. I. sinensis (tai) indicates the maternal contributor of the population is I. taiwanensis and I. sinensis (yun) means the maternal contributor of the population is I. yunguiensis. Differentiation between different populations and the results of the nonparametric Kruskal-test are indicated in each plot. The equal sign indicates the lack of significant differences (p ≥ 0.05), while the significant differences are indicated by either higher or lower sign (p < 0.05).
Acknowledgments
The numerical calculations in this paper have been completed on the supercomputing system in the Supercomputing Center of Wuhan University. We are grateful that Prof. Chunneng Wang from National Taiwan University provides the materials of I. taiwanensis. We appreciate Daniel Brunton for his detailed and valuable comments on the manuscript. We thank our colleagues Qian Yuan, Tianfeng Lv, Xiaoyu Song, Fei Hao, Chunlin Fu, Fengqing Tian, Mingfang Du and Min Yang for the assistance with the field collections and experiments.
Abbreviations
- ENM
Ecological niche models
- MP
Maximum parsimony
- BI
Bayesian inference
- AIC
Akaike information criterion
- ESS
Effective sample size
- AUC
The area under the ‘receiver operating characteristic curve’
- PCA
Principal component analysis
Authors’ contributions
XKD performed part analysis, made figures, uploaded the sequences into NCBI and made a contribution to writing the manuscript. XL1 analyzed part results and made a major contribution to writing the manuscript. YQH was responsible for most experiments. XL2 conceived the study and revised the manuscript. All authors read and approved the final manuscript.
Funding
This work was supported by the National Natural Science Foundation of China (30870168 & 31170203). The funding body had no role in the design of the study and collection, analysis, and interpretation of data and in the writing of the manuscript.
Availability of data and materials
All data generated or analyzed during this study are included in this published article.
Ethics approval and consent to participate
Not applicable.
Consent for publication
Not applicable.
Competing interests
The authors declare that they have no competing interests.
Footnotes
Publisher’s Note
Springer Nature remains neutral with regard to jurisdictional claims in published maps and institutional affiliations.
Contributor Information
Xiaokang Dai, Email: daixiaokang@whu.edu.cn.
Xiang Li, Email: hoscolee@whu.edu.cn.
Yuqian Huang, Email: 2013202040011@whu.edu.cn.
Xing Liu, Email: xingliu@whu.edu.cn.
Supplementary information
Supplementary information accompanies this paper at 10.1186/s12862-020-01687-4.
References
- 1.Levin DA. The role of chromosomal change in plant evolution. New York: Oxford University Press; 2002.
- 2.Ramsey J, Schemske DW. Neopolyploidy in flowering plants. Annu Rev Ecol Syst. 2002;33(1):589–639. [Google Scholar]
- 3.Van de Peer Y, Maere S, Meyer A. The evolutionary significance of ancient genome duplications. Nat Rev Genet. 2009;10(10):725–732. doi: 10.1038/nrg2600. [DOI] [PubMed] [Google Scholar]
- 4.Stebbins GL. Chromosomal evolution in higher plants. London: Edward Arnold; 1971. [Google Scholar]
- 5.Lewis WH. Polyploidy in angiosperms: dicotyledons. New York: Springer Press; 1980. pp. 241–268. [DOI] [PubMed] [Google Scholar]
- 6.Grant V. Plant speciation. New York: Columbia University Press; 1981. [Google Scholar]
- 7.Li Z, Baniaga AE, Sessa EB, et al. Early genome duplications in conifers and other seed plants. Sci Adv. 2015;1(10):e1501084. doi: 10.1126/sciadv.1501084. [DOI] [PMC free article] [PubMed] [Google Scholar]
- 8.Wood TE, Takebayashi N, Barker MS, et al. The frequency of polyploid speciation in vascular plants. P Natl Acad Sci USA. 2009;106(33):13875–13879. doi: 10.1073/pnas.0811575106. [DOI] [PMC free article] [PubMed] [Google Scholar]
- 9.Soltis PS, Soltis DE. Ancient WGD events as drivers of key innovations in angiosperms. Curr Opin Plant Biol. 2016;30:159–165. doi: 10.1016/j.pbi.2016.03.015. [DOI] [PubMed] [Google Scholar]
- 10.Marchant DB, Soltis DE, Soltis PS. Patterns of abiotic niche shifts in allopolyploids relative to their progenitors. New Phytol. 2016;212(3):708–718. doi: 10.1111/nph.14069. [DOI] [PubMed] [Google Scholar]
- 11.Levin DA. Polyploidy and novelty in flowering plants. Am Nat. 1983;122(1):1–25. [Google Scholar]
- 12.Otto SP, Whitton J. Polyploid incidence and evolution. Annu Rev Genet. 2000;34(1):401–437. doi: 10.1146/annurev.genet.34.1.401. [DOI] [PubMed] [Google Scholar]
- 13.Brochmann C, Brysting AK, Alsos I, et al. Polyploidy in arctic plants. Biol J Linn Soc. 2004;82(4):521–536. [Google Scholar]
- 14.Stebbins GL. Variation and evolution in plants. New York: Columbia University Press; 1950. [Google Scholar]
- 15.Theodoridis S, Randin C, Broennimann O, et al. Divergent and narrower climatic niches characterize polyploid species of European primroses in Primula sect Aleuritia. J Biogeogr. 2013;40(7):1278–1289. [Google Scholar]
- 16.Pigg KB. 1992. Evolution of Isoetalean Lycopsids. Ann Mo Bot Gard. 1992;79:589–612. [Google Scholar]
- 17.Taylor WC, Hickey RJ. Habitat, evolution, and speciation in Isoetes. Ann Mo Bot Gard. 1992;79:613–622. [Google Scholar]
- 18.Hickey RJ, Taylor WC, Luebke NT. The species concept in Pteridophyta with special reference to Isoetes. Am Fern J. 1989;79:78–89. [Google Scholar]
- 19.Handel-Mazzetti H. Isoetes hypsophila Hand.-Mazz. Akademie der Wissenschaften in Wien. 1923. p. 95. [Google Scholar]
- 20.Li X, Huang YQ, Dai X, et al. Isoetes shangrilaensis, a new species of Isoetes from Hengduan mountain region of Shangri-la, Yunnan. Phytotaxa. 2019;397(1):65–73. [Google Scholar]
- 21.Wang QF, Liu X, Taylor WC, et al. Isoetes yunguiensis (Isoetaceae), a new basic diploid quillwort from China. Novon. 2002;12:587–591. [Google Scholar]
- 22.De Vol CE. Isoetes found on Taiwan. Taiwania. 1972;7:1–7. [Google Scholar]
- 23.Palmer TC. A Chinese Isoetes. Am Fern J. 1927;17(4):111–113. [Google Scholar]
- 24.Liu H, Wang QF, Taylor WC. Isoetes orientalis (Isoetaceae), a new Hexaploid quillwort from China. Novon. 2005;15:164–167. [Google Scholar]
- 25.Taylor WC, Lekschas AR, Wang QF, et al. Phylogenetic relationships of Isoetes (Isoetaceae) in China as revealed by nucleotide sequences of the nuclear ribosomal ITS region and the second intron of a LEAFY homolog. Am Fern J. 2004;94(4):196–205. [Google Scholar]
- 26.Liu X, Wang Y, Wang QF, et al. Chromosome numbers of the Chinese Isoetes and their taxonomical significance. Acat Phytotaxon Sin. 2002;40(4):351–361. [Google Scholar]
- 27.Liu X, Liu H, Wang QF. Spore morphology of Isoetes (Isoetaceae) from China. J Syst Evol. 2008:479–89.
- 28.Warren DL, Glor RE, Turelli M. Environmental niche equivalency versus conservatism: quantitative approaches to niche evolution. Evolution. 2008;62:2868–2883. doi: 10.1111/j.1558-5646.2008.00482.x. [DOI] [PubMed] [Google Scholar]
- 29.Peterson AT, Soberón J, Pearson RG, et al. Ecological Niches and Geographic Distributions. Princeton: Princeton University Press; 2011.
- 30.Thuiller W, Lavorel S, Araujo MB. Niche properties and geographical extent as predictors of species sensitivityto climate change. Glob Ecol Biogeogr. 2005;14:347–357. [Google Scholar]
- 31.Broennimann O, Fitzpatrick MC, Pearman PB, et al. Measuring ecological niche overlap from occurrence and spatial environmental data. Glob Ecol Biogeogr. 2012;21(4):481–497. [Google Scholar]
- 32.Liu X, Gituru WR, Wang QF. Distribution of basic diploid and polyploid species of Isoetes in East Asia. J Biogeogr. 2004;31(8):1239–1250. [Google Scholar]
- 33.Larsén E, Rydin C. Disentangling the phylogeny of Isoetes (Isoetales), using nuclear and plastid data. Int J Plant Sci. 2016;177(2):157–174. [Google Scholar]
- 34.Kim C, Choi HK. Biogeography of North Pacific Isoëtes (Isoëtaceae) inferred from nuclear and chloroplast DNA sequence data. J Plant Biol. 2016;59(4):386–396. [Google Scholar]
- 35.Kim C, Shin H, Chang YT, et al. Speciation pathway of Isoetes (Isoetaceae) in East Asia inferred from molecular phylogenetic relationships. Am J Bot. 2010;97(6):958–969. doi: 10.3732/ajb.0900162. [DOI] [PubMed] [Google Scholar]
- 36.Xie YC, Cheng HS, Chen Y, et al. Complete chloroplast genome of Isoetes sinensis, an endemic fern in China. Mitochondrial DNA Part B. 2019;4(2):3276–3277. doi: 10.1080/23802359.2019.1666687. [DOI] [PMC free article] [PubMed] [Google Scholar]
- 37.Wu X, Luo J, Huang S, et al. Molecular phylogeography and evolutionary history of Poropuntius huangchuchieni (Cyprinidae) in Southwest China. PLoS One. 2013;8(11):e79975. doi: 10.1371/journal.pone.0079975. [DOI] [PMC free article] [PubMed] [Google Scholar]
- 38.Small RL, Hickey RJ. Systematics of the northern Andean Isoetes karstenii complex. Am Fern J. 2001;91:41–69. [Google Scholar]
- 39.McIntyre PJ. Polyploidy associated with altered and broader ecological niches in the Claytonia perfoliata (Portulacaceae) species complex. Am J Bot. 2012;99(4):655–662. doi: 10.3732/ajb.1100466. [DOI] [PubMed] [Google Scholar]
- 40.Lowry E, Lester SE. The biogeography of plant reproduction: potential determinants of species’ range sizes. J Biogeogr. 2006;33(11):1975–1982. [Google Scholar]
- 41.Liu X, Wang JY, Wang QF. Current status and conservation strategies for Isoetes in China: a case study for the conservation of threatened aquatic plants. Oryx. 2005;39(3):335–338. [Google Scholar]
- 42.Doyle JJ. A rapid DNA isolation procedure for small quantities of fresh leaf tissue. Phytochem Bull. 1987;19:11–15. [Google Scholar]
- 43.Hoot SB, Douglas AW. Phylogeny of the Proteaceae based on atpB and atpB-rbcL intergenic spacer region sequences. Aust Syst Bot. 1998;11(4):301–320. [Google Scholar]
- 44.Shaw J, Lickey EB, Schilling EE, et al. Comparison of whole chloroplast genome sequences to choose noncoding regions for phylogenetic studies in angiosperms: the tortoise and the hare III. Am J Bot. 2007;94(3):275–288. doi: 10.3732/ajb.94.3.275. [DOI] [PubMed] [Google Scholar]
- 45.Shinozaki K, Ohme M, Tanaka M, et al. The complete nucleotide sequence of the tobacco chloroplast genome: its gene organization and expression. EMBO J. 1986;5(9):2043. doi: 10.1002/j.1460-2075.1986.tb04464.x. [DOI] [PMC free article] [PubMed] [Google Scholar]
- 46.Karol KG, Arumuganathan K, Boore JL, et al. Complete plastome sequences of Equisetum arvense and Isoetes flaccida: implications for phylogeny and plastid genome evolution of early land plant lineages. BMC Evol Biol. 2010;10(1):1–16. doi: 10.1186/1471-2148-10-321. [DOI] [PMC free article] [PubMed] [Google Scholar]
- 47.Librado P, Rozas J. DnaSP v5: a software for comprehensive analysis of DNA polymorphism data. Bioinformatics. 2009;25(11):1451–1452. doi: 10.1093/bioinformatics/btp187. [DOI] [PubMed] [Google Scholar]
- 48.Price MN, Dehal PS, Arkin AP. FastTree 2–approximately maximum-likelihood trees for large alignments. PLoS One. 2010;5(3):e9490. doi: 10.1371/journal.pone.0009490. [DOI] [PMC free article] [PubMed] [Google Scholar]
- 49.Farris JS, Källersjö M, Kluge AG, et al. Testing significance of incongruence. Cladistics. 1994;10(3):315–319. [Google Scholar]
- 50.Swofford DL. PAUP*. Phylogenetic analysis using parsimony (*and other methods). Version 4. Sunderland: Sinauer Associates; 2002. [Google Scholar]
- 51.Posada D, Crandall KA. MODELTEST: testing the model of DNA substitution. Bioinformatics. 1998;14(9):817–818. doi: 10.1093/bioinformatics/14.9.817. [DOI] [PubMed] [Google Scholar]
- 52.Felsenstein J. Parsimony in systematics: biological and statistical issues. Annu Rev Ecol Syst. 1983;14(1):313–333. [Google Scholar]
- 53.Ronquist F, Huelsenbeck JP. MrBayes 3: Bayesian phylogenetic inference under mixed models. Bioinformatics. 2003;19(12):1572–1574. doi: 10.1093/bioinformatics/btg180. [DOI] [PubMed] [Google Scholar]
- 54.Drummond AJ, Suchard MA, Xie D, et al. Bayesian phylogenetics with BEAUti and the BEAST 1.7. Mol Biol Evol. 2012;29(8):1969–1973. doi: 10.1093/molbev/mss075. [DOI] [PMC free article] [PubMed] [Google Scholar]
- 55.Katoh K, Kuma K, Toh H, et al. MAFFT version 5: improvement in accuracy of multiple sequence alignment. Nucleic Acids Res. 2005;33(2):511–518. doi: 10.1093/nar/gki198. [DOI] [PMC free article] [PubMed] [Google Scholar]
- 56.Nguyen LT, Schmidt HA, Von Haeseler A, et al. IQ-TREE: a fast and effective stochastic algorithm for estimating maximum-likelihood phylogenies. Mol Biol Evol. 2015;32(1):268–274. doi: 10.1093/molbev/msu300. [DOI] [PMC free article] [PubMed] [Google Scholar]
- 57.Drummond AJ, Rambaut A. BEAST: Bayesian evolutionary analysis by sampling trees. BMC Evol Biol. 2007;7(1):1–8. doi: 10.1186/1471-2148-7-214. [DOI] [PMC free article] [PubMed] [Google Scholar]
- 58.Hijmans RJ, Cameron SE, Parra JL, et al. Very high resolution interpolated climate surfaces for global land areas. Int J Climatol. 2005;25(15):1965–1978. [Google Scholar]
- 59.Brown JL. SDMtoolbox: a python-based GIS toolkit for landscape genetic, biogeographic and species distribution model analyses. Methods Ecol Evol. 2014;5(7):694–700. doi: 10.7717/peerj.4095. [DOI] [PMC free article] [PubMed] [Google Scholar]
- 60.Phillips SJ, Anderson RP, Schapire RE. Maximum entropy modeling of species geographic distributions. Ecol Model. 2006;190(3–4):231–259. [Google Scholar]
- 61.Hanley JA, McNeil BJ. The meaning and use of the area under a receiver operating characteristic (ROC) curve. Radiology. 1982;143(1):29–36. doi: 10.1148/radiology.143.1.7063747. [DOI] [PubMed] [Google Scholar]
- 62.Warren DL, Glor RE, Turelli M. ENMTools: a toolbox for comparative studies of environmental niche models. Ecography. 2010;33(3):607–611. [Google Scholar]
- 63.Schoener T. The Anolis lizards of Bimini: resource partitioning in a system fauna. Ecology. 1968;49(4):704–726. [Google Scholar]
- 64.Breslow N. A generalized Kruskal-Wallis test for comparing K samples subject to unequal patterns of censorship. Biometrika. 1970;57(3):579–594. [Google Scholar]
- 65.Team RC. R: a language and environment for statistical computing. 2015. [Google Scholar]
Associated Data
This section collects any data citations, data availability statements, or supplementary materials included in this article.
Supplementary Materials
Additional file 1: Table S1. The serial numbers of plastid DNA sequences in this study. Table S2. The serial numbers of nuclear DNA sequences in this study. Table S3. Haplotypes information of nuclear DNA data. Table S4. Haplotypes information of cpDNA data. Table S5. Location records used for ecological niche modeling. Table S6. Results of the nonparametric Kruskal test applied for the populations whose maternal contributor are different in the allopolyploid populations of I.sinensis.
Additional file 2: Figure S1. Kernel density plots of the six environmental variables for the populations whose maternal contributor are different in the allopolyploid of I. sinensis. I. sinensis (tai) indicates the maternal contributor of the population is I. taiwanensis and I. sinensis (yun) means the maternal contributor of the population is I. yunguiensis. Differentiation between different populations and the results of the nonparametric Kruskal-test are indicated in each plot. The equal sign indicates the lack of significant differences (p ≥ 0.05), while the significant differences are indicated by either higher or lower sign (p < 0.05).
Data Availability Statement
All data generated or analyzed during this study are included in this published article.


