

Abstract
Cell growth depends upon formation of cell-matrix adhesions, but mechanisms detailing the transmission of signals from adhesions to control proliferation are still lacking. Here, we find that the scaffold protein talin undergoes force-induced cleavage in early adhesions to produce the talin rod fragment that is needed for cell cycle progression. Expression of noncleavable talin blocks cell growth, adhesion maturation, proper mechanosensing, and the related property of EGF activation of motility. Further, the expression of talin rod in the presence of noncleavable full-length talin rescues cell growth and other functions. The cleavage of talin is found in early adhesions where there is also rapid turnover of talin that depends upon calpain and TRPM4 activity as well as the generation of force on talin. Thus, we suggest that an important function of talin is its control over cell cycle progression through its cleavage in early adhesions.
Keywords: Adhesions, talin cleavage, rigidity sensing, mechanosensing, cell growth
Graphical Abstract

Cells receive critical mechanical signals from integrinmediated cell-matrix adhesions that control many cellular processes in wound healing, development, and cancer.1–3 One of the most important cellular functions affected by such signals is cell growth, evidenced by the inability of nontransformed cells to proliferate on soft surfaces that do not support strong adhesions (soft-agar assays). Transmission and processing of mechanical signals rely upon the dynamic regulation of the adhesions, which is tightly coordinated with activation of intracellular signaling cascades. However, we do not understand the molecular mechanisms of mechanical signals that are generated by the adhesions to control growth.
Studies of the spreading of fibroblasts on fibronectin (FN)-coated surfaces have revealed many aspects of adhesion dynamics, including a role for talin in activation of integrins, which is an essential step for cell-substrate attachment.4,5 Talin is one of the earliest molecules to arrive at nascent adhesion sites6–8 and is involved in mechanosensing through the adhesions.9 Talin is also a substrate for calpain mediated cleavage and calpain activity is important during the dissolution of mature matrix adhesions.10,11 Upon calpain inhibition, cells have a greater density of larger adhesions. Furthermore, talin cleavage generates talin head and rod fragments that affect independent downstream cellular functions. Talin rod, for example, activates cell proliferation and cell cycle progression in the absence of full-length talin.12 However, whether talin cleavage plays a role in transmitting mechanical signals during mechanosensing through early adhesions is unknown.
Here, we show that talin cleavage is a key cellular mechanism regulating proper adhesion formation, in the absence of which cells show inhibited growth and cell motility is not stimulated by EGF. Some of these effects could be rescued by the expression of free talin rod fragment, emphasizing the importance of talin cleavage in cell cycle progression. We also show that forces applied at the cell edge during mechanosensing of the matrix induce talin cleavage. Interestingly, noncleavable talin also alters talin turnover kinetics in early adhesions and causes integrin clustering to a much higher density than the talin head, rod, or full length molecule. Noncleavable talin alters mechanosensing forces and normal behavior is restored by the expression of talin rod fragment but not talin head, emphasizing the specific role of the rod fragment even in the presence of the full-length molecule. This supports the idea that force-induced talin cleavage during mechanosensing is necessary for proper adhesion formation and the cleavage products are critical components of cellular functions.
Since control over proper adhesion formation affected cell proliferation13,14 and talin cleavage was needed for normal adhesion behavior, we expressed a noncleavable form of talin1 (NC-talin, L432G)10 in talin1−/− cells and tested if NC-talin had an effect on cell proliferation (see Methods). In a mixed population of talin1−/− cells with and without either WT-talin-GFP or NC-talin-GFP expression, the talin1−/− cells grew faster than those with either talin1 form; however, over the course of 10 days, the WT-talin-GFP expressing cells grew whereas the NC-talin-GFP cells decreased in number (Figure 1a).
Figure 1.

Calpain-mediated talin cleavage affects cell growth and rigidity sensing. (a) Cell growth curves showing transfected cells per unit area for individual experiments for WT- or NC-talin cells cultured on glass in the presence of serum. (b) Cell edge kymograph of a single WT- or NC- talin expressing cell. The dashed line indicates EGF addition. (c) Talin1−/− cells expressing WT- or NC-talin were allowed to spread for 25 min on FN-coated substrates: glass, 24kPa gel, or 0.2 kPa gel. (d) Average area of spreading cells as detailed in panel c. (e) Percentage of cells spreading as detailed in panel. n > 30 for panels d and e. The experiment was repeated four times.
To determine if talin cleavage effected other cell behaviors, we added epidermal growth factor (EGF) to stimulate spread cells, a treatment that was previously shown to activate cell edge movement and adhesion formation.15,16 After spreading WT- and NC-talin cells on FN-coated glass for 6 h, they were stimulated with 100 ng/mL EGF. Whereas WT-talin cells displayed increased protrusion-retraction cycles of the cell edge upon EGF addition, the edges of NC-talin cells remained largely inactive and kept collapsing after minor fluctuations (kymograph of cell edge over ~10 min in Figure 1b). After EGF addition, there was a roughly 50% increase in whole cell area for WT-talin cells but NC-talin cells were unaffected (Supplementary Figure 1a,b). This indicated that talin cleavage was required for motility activation by EGF. In a recent study, we showed that EGF stimulation of cell motility was rigidity dependent and cells reacted much less to EGF on softer substrates.17 Therefore, we hypothesized that NC-talin cells were underestimating substrate rigidity because of a faulty adhesion development mechanism.
We next tested if talin cleavage had a role in the early adhesion formation and rigidity sensing. Previous studies showed that early integrin adhesions played a significant role in sensing matrix rigidity,18–21 evident in effects on the level of cell spreading. Therefore, we tested early cell spreading on FN-coated surfaces of different rigidities. When plated on FN-coated glass (an extremely stiff surface) for 30 min, NC-talin cells spread to a similar area as WT-talin cells (Figure 1c,d), although they had larger adhesions, as reported earlier.11 A more pronounced difference between WT- and NC-talin cells appeared when they were plated on FN-coated polydimethylsiloxane (PDMS) gels or pillars with an effective substrate rigidity of 24 kPa (see Methods). Whereas WT-talin cells spread to ~1500 μm2 area after 30 min, NC-talin cells spread to a ~ 2-fold lower area (Figure 1c,d, Supplementary Figure 1c,d). Notably, over 80% of NC-talin cells failed to form an active edge (Supplementary Figure 1e) and did not spread beyond their initial attachments to the 24 kPa substrate (Figure 1d); however, they typically remained adherent to the substrate and could not be easily removed by, for example, shaking of the substrate. In the other extreme scenario, WT-talin cells plated on ultrasoft surfaces (0.2 kPa) did not spread and were not distinguishable from the NC-talin cells after 30 min of spreading (Figure 1c–e). Similar results were obtained when we repeated the spreading experiments after talin2 knockdown in talin1−/− cells (Supplementary Figure 2a–d), indicating that talin2 did not have a role in these phenomena. Thus, NC-talin was not able to support proper cell spreading on intermediate rigidity surfaces and cells behaved as if they were on much softer substrates.
Talin has another calpain cleavage site near its C-terminus that was significantly less susceptible to cleavage.11 To test for a possible role of this other site, we expressed a double mutant of talin, where both calpain cleavage sites were rendered noncleavable (L432G, E2492G) in talin1−/− cells, and performed the same cell spreading experiments. The results were not distinguishable from those observed with L432G (Supplementary Figure 2e,f). Further, cells expressing talin with a single mutation of the second cleavage site (E2492G) showed normal cellular area (data not shown) on all substrates. This indicated that calpain cleavage at L432 was critical for accurate rigidity sensing with little or no contribution from the E2492 cleavage site. Therefore, we used the L432G talin mutant for all subsequent experiments.
Earlier studies linked calpain-mediated proteolysis of talin to turnover of mature focal adhesions10,11 but it was not known whether talin cleavage occurred during formation of adhesions. Although our results indicated that cleavage occurred during adhesion formation, we wanted to quantify the process. To observe talin cleavage at early adhesion sites, we expressed GFP-talin1-mCherry or GFP-NC-talin1-mCherry in talin1−/− cells. Because the calpain cleavage site was in the linker between talin head and rod (Figure 2a), we postulated that a difference in the number of GFP and mCherry fluorophores would validate talin cleavage at early adhesion sites near the cell edge. In the past, we found that cells formed early adhesions at their edges on individual pillar tops and exerted cytoskeletal forces on the pillars.19–21 With time, those early adhesions grew and formed longer mature adhesions (Supplementary Figure 3a). This discrete adhesion development, on separate pillars, was ideal for counting adhesion molecules, potentially under force. To establish the role of talin cleavage in early adhesions, we counted the relative numbers of GFP and mCherry molecules at each pillar top under a spreading cell edge where new adhesions formed. To that end, we plated the cells on 24 kPa PDMS pillars coated with FN and allowed them to spread for 20 min before fixing them with formaldehyde. After focusing on the pillar tops under a cell edge with characteristic spreading morphology (Figure 2b), we continuously recorded the fluorescence intensities of the GFP and mCherry fluorophores over time with high intensity illumination until they were completely bleached. Near the end of the bleaching process, we identified single fluorophore bleaching events for both GFP and mCherry as single steps in the fluorescence intensity curves (Figure 2c). Using many such steps, we established the average fluorescence intensity levels for single fluorophores of GFP and mCherry (see Supplementary Figure 3b,c). The single fluorophore (1X) and double fluorophore peaks (2X) were clearly visible in the histogram. Once the intensity step size for a single fluorophore was established, we determined the original number of GFP and mCherry molecules at adhesion sites (Box 1, Figure 2b) and calculated their ratio. Whereas the mCherry/GFP ratio of NC-talin was close to 1 (0.90 ± 0.05, n = 43, 6 cells), it was 0.57 ± 0.03 for WT-talin (n = 54, 8 cells) (Figure 2d). Similar data was observed when the same experiment was performed in talin1−/− cells after talin2 knock-down (Supplementary Figure 3d). When we spread WT-talin cells in the presence of a calpain inhibitor (ALLN), the ratio near the cell edge increased to similar values as in the NC-talin case (0.83 ± 0.05, n = 58, 8 cells). Addition of the same inhibitor to NC-talin expressing cells had no significant effect (Figure 2d). Further, since calpain activity was dependent on Ca2+ and given that the TRPM4 channel localized to the leading edges of fibroblasts,22 we tested if the TRPM4 inhibitor (9-phenanthrol) had an effect. In the presence of the inhibitor, the mCherry/GFP ratio was also close to 1 (Supplementary Figure 3e). To further validate the effect of these inhibitors we looked at the mechanosensing activity as in Figure 1c in cells expressing neither talin 1 or talin 2. Indeed the cell spreading was also altered, as was adhesion formation, basically recapitulating the cell behavior with NC-talin (Supplementary Figure 2c,d). Taken together, these results confirmed that fluorophore counting could be used as a measure of talin cleavage at early adhesion sites and that cleavage was blocked by inhibiting calpain.
Figure 2.

Molecule counting of double-tagged talin reveals its cleavage. (a) Talin schematic showing talin head, talin rod, the position of GFP, mCherry fluorophores, and site of mutation (L432G) in the linker region which renders talin 1 noncleavable by calpain. Not to scale. (b) Cells expressing the double-tagged talin molecule. Boxes 1 and 2 are the ones used for analysis of intensity in panels c, d, or e. (c) Bleaching curve for Box 1 in panel b, for the GFP channel. Zoom-in shows single steps in intensity during bleaching, which account for single GFP molecules. Similar steps (with different step size) were found for mCherry. These steps were used for counting the number of GFP and mCherry molecules at the cell edge in unbleached regions by dividing the initial intensity by the average intensity of the bleaching steps. (d) Plot of the ratio of the number of GFP and mCherry molecules at the cell edge. Ratio was also plotted when cells were spread in the presence of Calpain inhibitor (ALLN). This ratio is a measure of talin rod: talin head. (e) Distribution of talin rod: talin head ratio at different distances from cell edge. Pillar 1 is closest to cell edge and pillar 4 closest to nucleus (Box 2 in b).
The cleavage of talin at early adhesion sites along with the significant rigidity-dependent effects in the presence of NC-talin (Figure 1, Supplementary Figure 2c,d) indicated that talin cleavage was critical for the process of rigidity sensing. Our previous studies showed that rigidity sensing occurred in a region ~2−3 μm from the cell edge but not further back from the edge.19–21 We therefore analyzed the mCherry/GFP ratio of WT-talin as a function of distance from the cell edge (Box 2, Figure 2b). This analysis showed that the mCherry/GFP ratio was nearly 1 on pillars closer to the nucleus, but decreased when approaching the cell edge (Figure 2e). This indicated a correlation between cellular forces at early adhesion sites and talin proteolysis.
To further test the idea that talin cleavage was linked to cellular forces, we seeded cells expressing GFP-talin1-mCherry on FN coated 24 kPa pillars, and performed live cell imaging in three channels (green, red, and brightfield) as shown in Figure 3a (zoom-in from Supplementary Figure 4a). To determine the dynamic fluorophore counts of talin GFP-head and mCherry-rod (Figure 3b), we converted the mCherry and GFP intensity into the number of molecules using the factor from the counting experiments (Figure 2), since the imaging conditions were identical. Brightfield images enabled the simultaneous measurement of the displacement of pillars (Figure 3c). Initially, there was a roughly linear increase in the intensity of talin head (GFP) and talin rod (mCherry) (from time = 0 until the gray band in Figure 3b). In parallel, the displacement of the same pillars increased steadily (Figure 3c, Supplementary Figure 4b). With WT-talin, the mCherry/GFP ratio showed an initial drop, followed by fluctuations at about 0.6 (Figure 3d). When the pillar displacement peaked and began to relax, the ratio started to increase and approached a value of 1 at times over 200 s (corresponding to a distance of 4–7 μm from the edge). This indicated that talin cleavage at early adhesions was a transient event, which might explain why it was not previously detected in single-time point biochemical experiments and highlighted the importance of dynamic tracking. When we analyzed GFP-NC-talin-mCherry during the same phase of cell spreading, the talin rod-to-head ratio was relatively constant at a value close to 1 (Figure 3d). Thus, the talin cleavage was limited to the very early adhesions under force; and after the peak in traction force, cleavage decreased.
Figure 3.
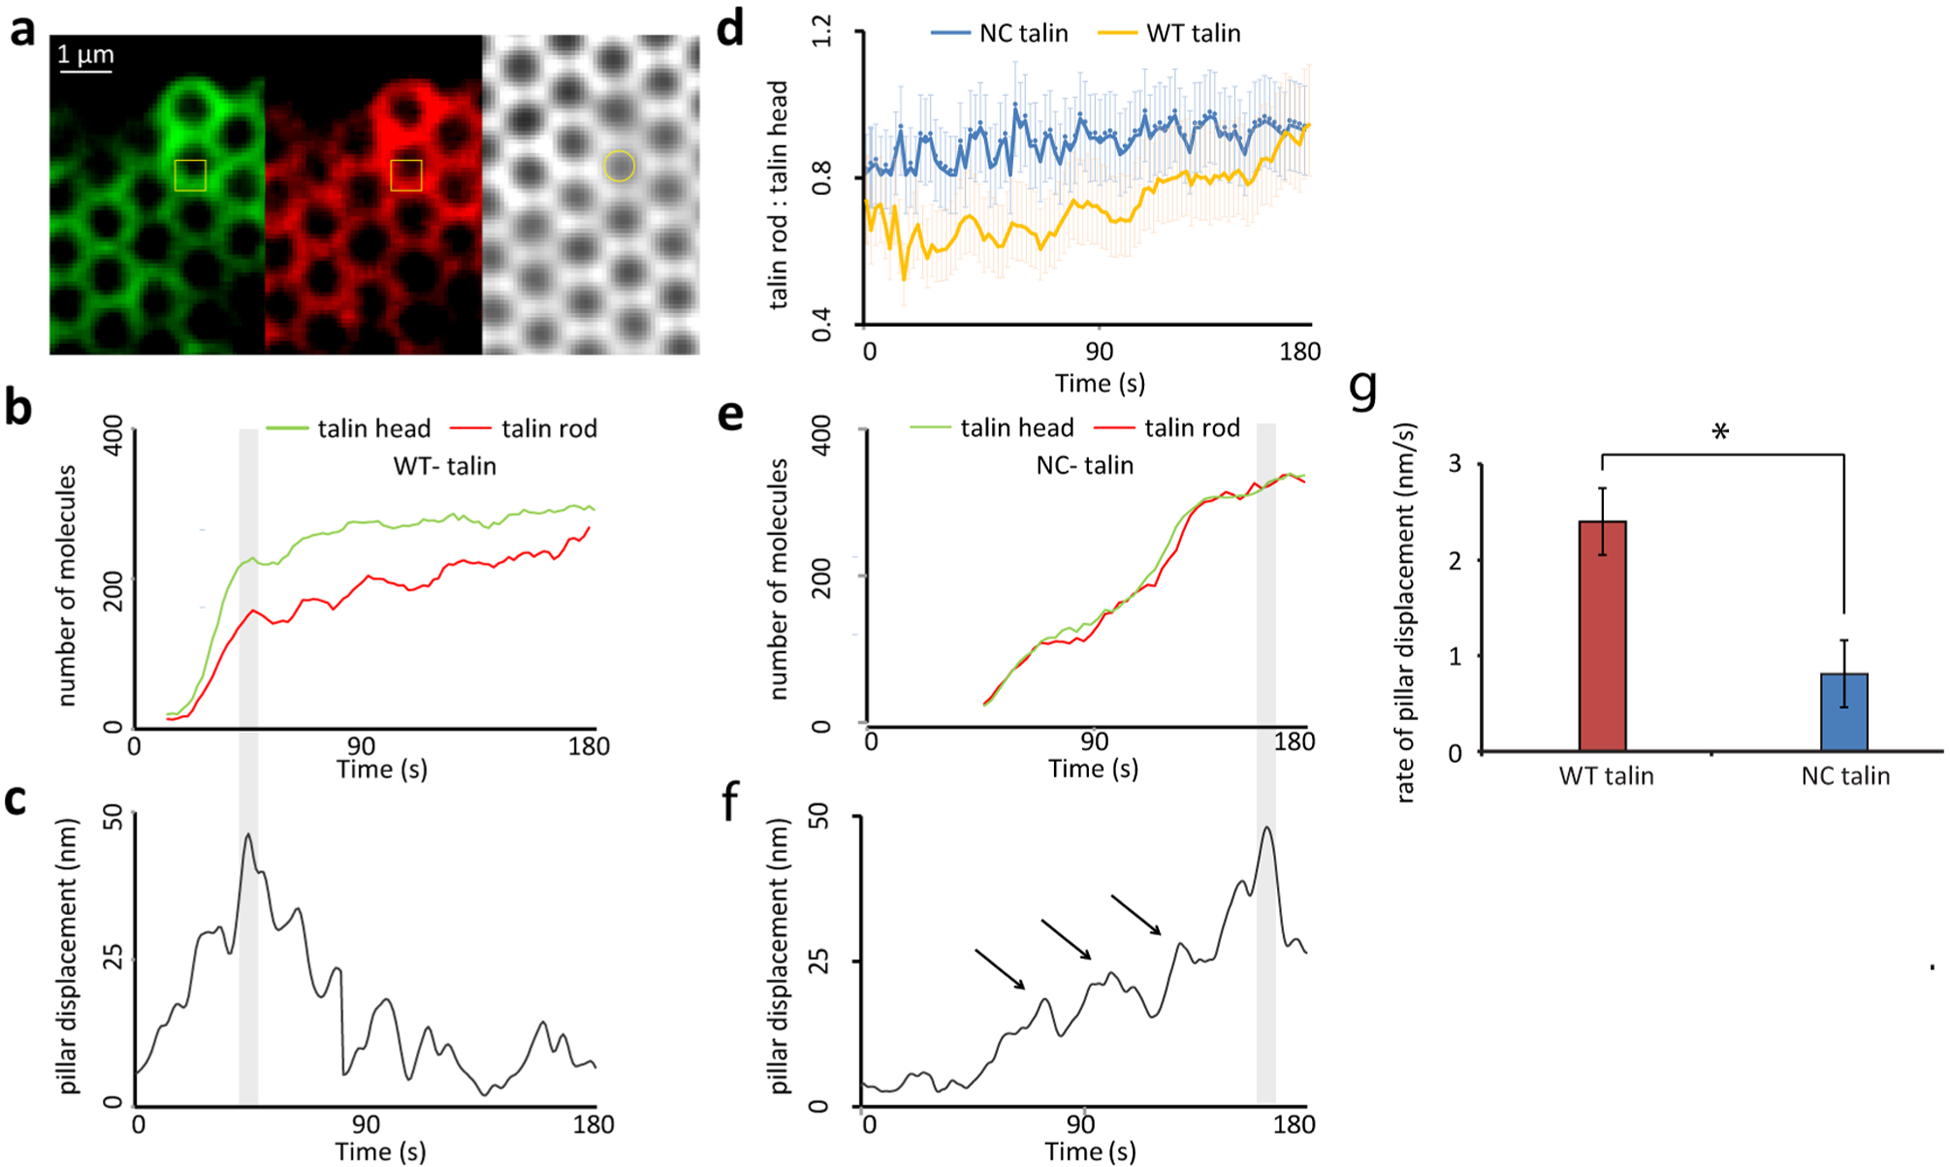
Talin cleavage is a rapid, force-dependent process and substrate deformation cannot be sustained in the absence of it. (a) Experimental setup for live cell imaging of cells expressing double tagged WT- or NC-talin along with simultaneous pillar displacement tracking. The magnitude of pillar displacement is directly related to traction force. One adhesion site corresponding to a single pillar is marked in yellow box. The tracked pillar is marked by a yellow circle. (b) Observed intensity was converted to number of molecules using conversion factors determined in Figure 2 and plotted for both talin head and talin rod for a cell expressing WT-talin(c) simultaneous pillar displacement for the same pillar in panel b is plotted. (d) Ratio of talin rod to head as a function of time (t = 0 is first contact of membrane with pillar top) for WT- and NC-talin. (e) Number of talin head and rod molecules for a single adhesion site as in the yellow box in panel a for a cell expressing NC-talin. (f) Simultaneous pillar displacement for the same pillar as in panel e. Arrows indicate breaks in pillar displacement. (g) Rate of pillar displacement for WT or NC-talin cells. n > 40 (pillars) in 12 cells.
To understand the change in the rate of recruitment of talin head and rod we fitted a linear curve through the respective molecule recruitment curves (Figure 3b,e) for the two phases of pillar displacement (before maximal pillar displacement and after maximal pillar displacement, before and after the gray bands in Figure 3c,f). For WT-talin cells, the net rate of recruitment of talin head and rod were significantly different in both phases. While cells were increasing force on the pillars, talin head had a higher recruitment rate than the rod (Supplementary Figure 4c). However, once the pillar reached maximal displacement and started to relax, the rate of recruitment of talin rod became higher than that of the head (Supplementary Figure 4d). This change in relative rates of recruitment of talin head and rod was possible if after maximal substrate force, cleavage stopped and heads continued to dissociate while full-length molecules were recruited.
In the case of NC-talin there was no difference in the recruitment rate of talin head or rod (Supplementary Figure 4c,d). Interestingly, the rate of recruitment of molecules was low and similar to that of WT-talin cells after maximal pillar displacement (Supplementary Figure 4c,d). This further supports the hypothesis that rapid talin cleavage occurred in the first phase of cell force development and that the rate of cleavage dropped dramatically once the cells pulled the substrate to maximum displacement.
Notably, for NC-talin not only was the overall rate of recruitment of talin molecules slower than WT-talin but also the overall rate of pillar movement (to reach the maximal displacement) was significantly lower than that with WT-talin (Figure 3e–g, Supplementary Figure 4c,d). This was due to frequent releases of the pillars during their displacements (arrows in Figure 3f), which could have resulted from the breakage of integrin-talin-actin linkages.6,20 This strongly indicated that talin cleavage was essential for proper adhesion development.
In order to confirm these results on continuous surfaces, we seeded talin1−/− cells expressing either WT or NC-talin (both double tagged) on FN-coated glass and recorded early cell spreading (first 20 min). Live total internal reflection fluorescence (TIRF) microscopy with identical imaging conditions was used to capture new adhesion formation in both green (talin head) and red (talin rod) channels (Supplementary Figure 5a). Since the imaging conditions were the same, we could normalize the intensity of red channel in WT-talin cells using intensity proportions from NC-talin cell adhesions (see Methods). We used initial intensities (i.e., before bleaching occurred) from older (>1 μm) adhesions to calculate this normalization factor. In this way, for any adhesion (example ROI in Supplementary Figure 5a) we were able to map the relative normalized intensity for both talin head and rod (Supplementary Figure 5b for the ROI). Now the ratio of these normalized intensities was a measure of the relative number molecules in the adhesion. When we calculated the talin rod-to-head ratio in adhesions on glass, the ratio increased from ~0.5 at their distal side (closer to the cell edge) to ~1 at their proximal side (closer to the nucleus) (Supplementary Figure 5c), similar to the behavior we observed on pillars (Figure 2e). Next, we followed new adhesions over time in both green and red channels and looked at the ratio of talin rod-to-head over the growth of the adhesion. For adhesions with WT-talin cells the ratio increased from ~0.5 to 1 in the first ~250 s (Supplementary Figure 5d). However, for NC-talin cells this ratio fluctuated around 1 (Supplementary Figure 5e). These two results together confirmed the talin cleavage proportions observed on pillars in Figure 3d. Since we used the initial intensity (prior to live cell imaging) of red and green channel to normalize the talin rod intensity the ratio was free to fluctuate over time but still stayed close to 1. This validated the experimental and analytical setup.
Furthermore, when we added either ALLN or TRPM4 inhibitor to cells expressing WT talin the observed ratio remained around 1 (Supplementary Figure 5f,g). All these results strongly confirmed the observation of talin cleavage during early adhesion development and the role of calpain and TRPM4 in the process.
In recent studies, we showed that early adhesions involved clusters of about 50 activated integrins in 100 nm circles that formed in a talin-dependent manner.23 On glass, most of these clusters dissociated after about 2 min but about 20% persisted and formed adhesions. Since we and previous studies found that adhesions formed with NC-talin were larger than WT talin, we wondered whether these clusters of integrins were altered. In order to understand how NC-talin affected these initial steps of adhesion formation, we looked at integrin clustering using super-resolution microscopy (PALM) on supported lipid bilayers (SLB) of biotin-RGD (the ligand for integrins) that was freely diffusing (Figure 4a). The density of clusters (number of clusters per unit area) increased 2-fold with NC-talin versus WT-talin (Figure 4b) with a marginal increase in cluster diameter (Figure 4c) fitting well with the idea of more frequent adhesion formation. Similarly, the integrin cluster density was higher than that of talin head, or talin rod fragment.23 Further, the number of integrins in each cluster also increased by approximately 50% (Figure 4d), indicating that talin cleavage was involved in regulating both the number of clusters and integrin packing in each cluster. Thus, NC-talin was activating and clustering integrins more than the other talin forms.
Figure 4.

Talin cleavage regulates the number of integrins at adhesion sites. (a) GFP tagged constructs of WT-talin or NC-talin were expressed in talin1−/− MEFs and cells were spread on SLBs for 15 min and imaged using PALM. The imaged entity is Avidin Dylite 650-RGD23. The bar indicates increasing density of RGD molecules within the cluster measured by PALM. White line marks the cell boundary and the rectangular region is the zoom-in region in the right panel. (b–d) Box plots show comparative distributions of number of molecules per cluster, full width half maximum (fwhm) of the clusters, and the number of clusters per μm2 of the cell area with the horizontal lines representing the medians and the whiskers representing SDs. (WT-talin, 7746 clusters from 11 cells; NC-talin, 8614 clusters from 9 cells). In the case of NC-talin, the number of molecules increased from an average of 50 to 74.5, and the density of clusters increased from 2.7 to 5.3 per μm2 (***p < 0.001). However, the cluster size (fwhm) only increased marginally from 107 to 118 nm. (e) Ratio of adhesion area to total cell area for WT- or NC-talin cells during early spreading on glass. Cells were seeded on FN coated glass and then imaged every few seconds through TIRF microscopy. n > 5 for each case in panel e.
Since the clusters disassembled faster on glass, there was potentially a role for force in causing early adhesion disassembly that could have been inhibited by NC-talin. To test this we seeded cells expressing WT-talin and NC-talin on FN coated glass and looked at adhesion area per total cell area (Figure 4e) during early cell spreading. For WT-talin cells, as cells spread, this ratio decreased whereas for NC-talin cells it increased or stayed constant, indicating that more adhesions persisted with NC-talin and adhesion turnover was significantly decreased. This strongly indicated that NC-talin inhibited force-dependent early adhesion disassembly. We hypothesized that force affected talin cleavage and played a role in regulating adhesion formation.
Previous studies showed that regulation of integrin adhesions was an extremely dynamic process involving intricate interplay of forces and adhesion molecules.24,25 In binding studies, the talin head bound to integrins almost six times more strongly than full length talin.26 Therefore, we tested whether talin cleavage affected the kinetics of talin molecules in nascent adhesions. Using fluorescence recovery after photobleaching (FRAP) of both GFP and mCherry on pillar adhesions, we measured the recovery rate for both head and rod. In particular, cells expressing GFP-talin-mCherry (wild-type or mutant) were seeded on 24 kPa rigidity pillars. After 15 min, a line of pillars perpendicular to the cell edge was bleached as soon as the cell membrane touched the outermost pillar (pillar 1 in yellow box). This was done to capture the earliest events of adhesion formation as the cell continued to spread (Figure 5a). Fluorescence recovery for both GFP and mCherry was similar in the initial phase, indicating that talin was uncleaved when it bound to the adhesions (Supplementary Figure 6a). It should be noted that this FRAP experiment was done on spreading cells where the bleached area was certainly not in steady state, which made the recovery curves appear nonideal. This however did not affect the inference about talin dynamics. Fitting the recovery curves with a single exponential gave recovery half times of 13 ± 3 and 14 ± 3 s for GFP and mCherry, respectively (Supplementary Figure 6b), indicating that WT-talin was recruited to bleached sites and cleavage occurred after recruitment. For pillars 4–7 μm from the edge, the half times of recovery increased to 26 ± 3 and 27 ± 4 s for GFP and mCherry, respectively (Figure 5b), indicating much slower talin dynamics as the adhesions matured (further confirmation of this came from FRAP measurements on large adhesions in cells that were spread for more than 2 h on glass where the recovery half time was 76 ± 9 s; Figure 5b). On the other hand, with GFP-NC-talin-mCherry, the half-times for recovery were about 26 ± 3 and 25 ± 3 s irrespective of the distance from the leading edge (Figure 5b, Supplementary Figure 6b). These results supported the idea that talin cleavage altered talin dynamics in adhesions in a force dependent manner. This was confirmed when inhibition of actomyosin force by the ROCK inhibitor Y-27632 (20 μM) resulted in a significant increase in recovery half-time of WT-talin at the outer pillars (Figure 5b, Supplementary Figure 6b), similar to the case of NC-talin. Talin cleavage was indeed reduced upon inhibition of traction force by Y-27632 addition since the mCherry/GFP ratio for pillars at the cell edge was nearly 1 (Figure 5c; similar results were obtained in the presence of blebbistatin, Supplementary Figure 6c). All of the evidence indicated that talin cleavage during the formation of adhesions was catalyzed by force and cleavage dramatically increased talin dynamics in early adhesions.
Figure 5.

Talin cleavage regulates nascent adhesion dynamics at force centers. (a) Cells expressing double tagged WT- or NC-talin were allowed to spread on pillar arrays for 15 min and then imaged. As soon as the cell membrane touched the outermost pillar (for example, pillar 1 in yellow box) a line perpendicular to the cell edge was bleached (yellow box). The recovery plots are for talin head (GFP) at single pillars in the bleached area (pillar 2 and pillar 4). (b) Average t1/2 for such recovery curves with WT- or NC-talin with or without the presence of Y-27632. n > 8 cells for each case. t1/2 for mature adhesions as measured in cells spreading on glass for >2 h is also shown. (c) WT-talin rod-to-head ratio at the cell edge in the absence or presence of the ROCK inhibitor, Y-27632 in an experiment similar to that in Figure 3.
To confirm our findings on flat substrates we spread cells expressing WT or NC talin in talin1−/− cells on FN coated glass and performed FRAP on early adhesions. We bleached adhesions at different distances from the cell edge (Supplementary Figure 6d) and observed the fluorescence recovery (Supplementary Figure 6e). Indeed, the recovery on adhesions closer to the edge was faster than adhesions more inward (Supplementary Figure 6f). With both NC talin or Y-27632 this difference in recovery time was highly reduced (Supplementary Figure 6f).
Since talin cleavage generated talin head and rod fragments that had downstream signaling functions independent of full length talin, we wondered if the fragments could rescue normal cell functions in NC-talin cells. Talin head affected focal adhesion turnover27 and talin rod stimulated cell cycle progression.12 To test their effects, we expressed mCherry-tagged talin head or talin rod fragments in GFP-NC-talin cells and allowed them to spread on FN coated pillars (24 kPa rigidity) while imaging them. As shown in Figure 6a, both talin rod and head fragments localized to early adhesion sites and to mature adhesions. An early indication that rod fragments could restore normal functions came from measurements of the rate of traction force generation that was normally quite slow for NC-talin cells (Figure 3f,g). Interestingly, expression of talin rod fragment enabled NC-talin cells to deform the substrate much faster, as shown by the increased pillar displacement rate (Figure 6b); but still less than the rate with WT-talin cells. On the other hand, talin head had no significant effect on the rate of traction force development by NC-talin cells (Figure 6b). Since the rod caused partial rescue of contractile activity, we tested if talin rod expression could restore normal cell spreading in NC-talin cells. Indeed, at 30 min, both the percentage of spreading cells and the cell spread area on 24 kPa pillars was partially restored and was significantly higher than for NC-talin cells (Figure 6c,d). Again, talin head failed to have any such effect. To test if the talin rod fragment affected integrin density in early adhesions, we performed an experiment on SLBs similar to that shown in Figure 4, using cells coexpressing talin rod and NC-talin. Indeed, with talin rod, both the integrin density and number of integrin clusters were restored to that of normal WT talin cells (Figure 6e,f). These results strongly indicated that both the talin rod fragment and intact talin were important for normal cell adhesion development.
Figure 6.
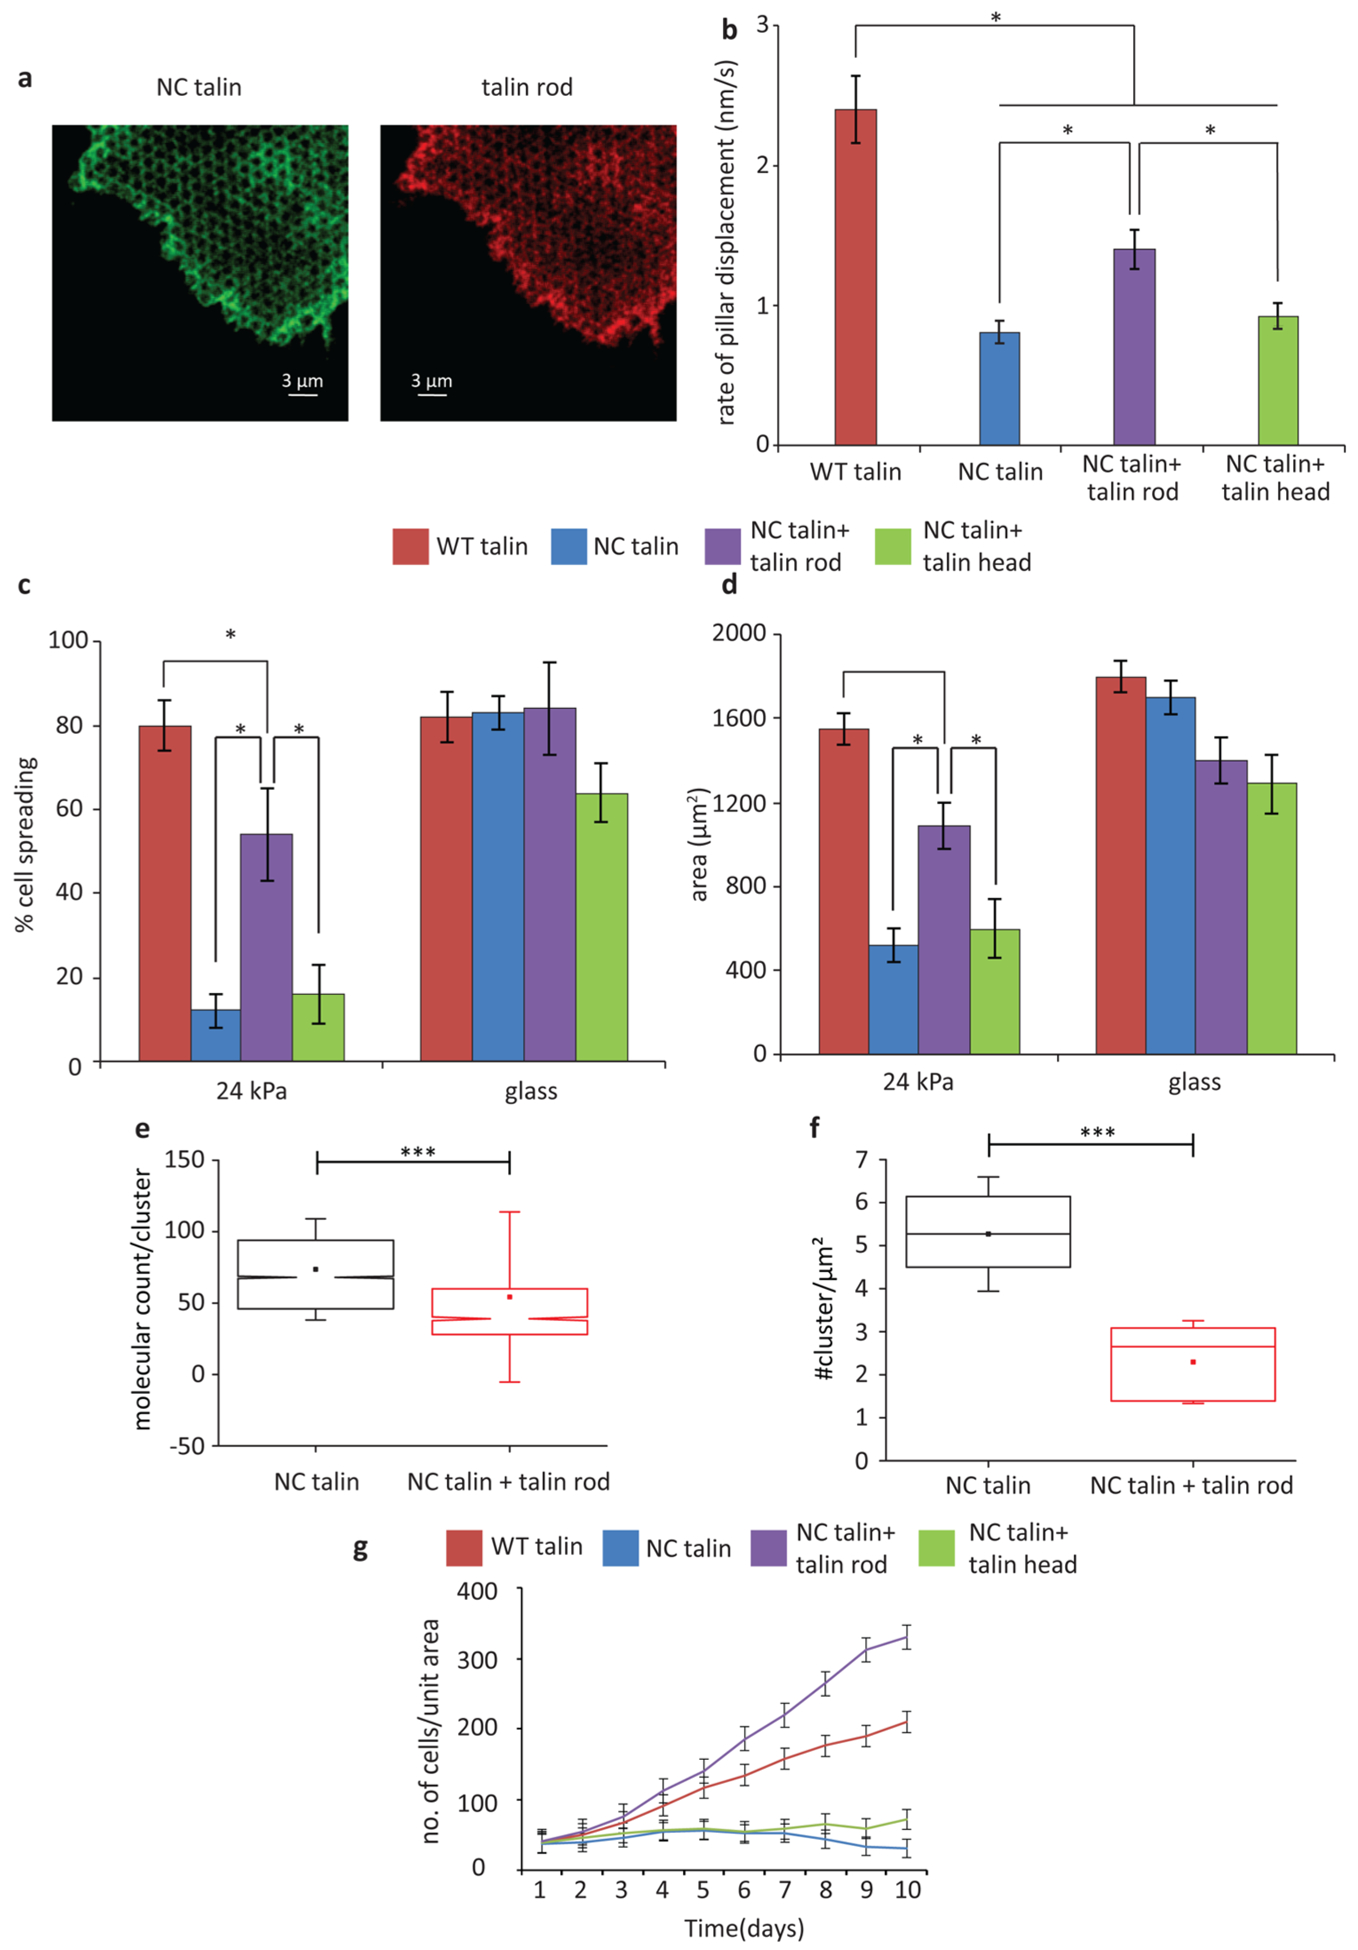
Talin rod, but not talin head, can partially rescue cell spreading. (a) Cells expressing GFP-NC-talin and mCherry talin rod on 24 kPa pillar array. (b) Average rate of pillar displacement for cells expressing WT-talin, NC-talin, NC-talin and talin rod, NC-talin and talin head. (c) Percentage of spreading cells at 25 min on 24 kPa pillars. (d) Average whole cell area for cells detailed in panel c. (e) Box plots showing comparative distribution of number of molecules per cluster for NC-talin cells and NC-talin cells with talin rod. (f) Box plots showing comparative distribution of number of clusters per μm2 for NC-talin cells and NC-talin cells with talin rod. The horizontal lines represent the medians and the whiskers representing SDs (***p < 0.001) with 2438 clusters from 6 cells. (g) Cell growth curves showing number of transfected cells per unit area for WT-cells, NC-talin cells, NC-talin cells with talin rod, and NC-talin cells with talin head.
As a further test of the effect of talin rod expression, we measured the growth rate of NC-talin cells after rod expression. Surprisingly, with the talin rod, the growth rate of NC-talin cells was equal to that of the WT-talin cells but still less than the talin1−/− cells (Figure 6g,h). In contrast, with the talin head, the growth rate of NC-talin cells was unaltered and their numbers decreased over time (Figure 6g,h). Thus, we suggest that the talin rod fragment was needed even in the presence of uncleaved talin for growth, adhesion development and rigidity sensing.
These studies document a number of abnormal behaviors of NC-talin cells. They (1) are inhibited for growth and EGF activation (Figure 1), (2) have incorrectly formed integrin clusters (Figure 4), and (3) fail to spread on intermediate rigidity substrates (Figure 1). After cleavage, the talin rod releases from the adhesions more rapidly than talin head, which enables documentation of the sites where cleavage occurs (Figure 2, Figure 3). Since cleavage is blocked by myosin inhibition and occurs as traction forces are increasing, it appears that it is catalyzed by force in early adhesions. However, in mature adhesions, there is no evidence of cleavage. Although both the head and rod fragments could have functional roles, only the expression of the rod fragment in NC-talin cells partially rescues normal force generation, cell spreading, integrin density, and completely rescues cell growth (Figure 6). Thus, we suggest that the cleavage of talin to generate the rod fragment is critical for normal cell behavior.
The inability of the NC-talin cells to grow is reminiscent of the findings with epithelial cells that did not grow without talin.26 In the epithelial cells, the expression of the talin rod alone restored growth through a mechanism that involved the activation of FAK. Since the talin1−/− cells have talin2, they grow well but the expression of the NC-talin blocks proliferation potentially by displacing talin2 from adhesion sites. The talin rod fragment is binding to adhesion sites in the presence of NC-talin and there is no evidence of concentration of the fragment in other regions of the cell, including the nucleus (Figure 6). Thus, it appears that the effect of talin rod is through an effect that it has on adhesion maturation. Because the rod fragment is less abundant at the adhesions than the head fragment, the role that it has there may be catalytic or it may be taking away inhibitory components from the adhesion. Much more research is needed to understand the surprising effect of the rod fragment in the presence of the NC-talin rod.
Rigidity sensing requires the proper assembly of the contractile units that occur primarily at early adhesion sites followed by proper contraction of those sites.20,28 NC-talin cells appear to underestimate their substrate rigidity since a higher rigidity threshold is needed for NC-talin cell spreading. This indicates that the rigidity sensing process is compromised. In line with this, overall contraction of the pillars is much slower (Figure 3g), and the pattern of contractions indicates that there is slippage of pillar contacts during the contractions (arrows in Figure 3f) which could be due to faulty reinforcement of talinactin bonds6,25 under force. This indicates that the cleavage is needed for proper assembly of adhesive links from matrix to actin and for actin to support the force generation. As in the case of rod fragment stimulation of growth, the rod fragment increases the rate of force generation on adhesions. Once again, this could be due to the displacement of an inhibitory component or the recruitment of molecules that can only bind to the rod in the absence of the head.
Talin’s rapid turnover in early adhesions is surprising as it indicates that the adhesions are producing significant amounts of talin cleavage products. Although the heads are preferentially retained at the adhesions as indicated by higher GFP fluorescence levels, and consistent with in vitro binding studies,26 the heads are also turning over rapidly on the order of 10 s, especially at higher force locations (Figure 5b). This is in line with the observation that adhesion proteins’ kinetics depend on the forces that are produced in the adhesions, and are variable across different positions in the adhesions (Supplementary Figure 5c).29 Both the rapid turnover and cleavage are dependent upon force and calpain activity, indicating that talin cleavage is the cause of the rapid turnover. In the absence of talin cleavage the turnover rate of talin is indeed slower than that when talin is cleaved (Figure 5b). But even in the absence of talin cleavage, the turnover rate of talin in early adhesions is much more rapid than in later steady state adhesions (~25 vs ~75 s), which indicates that factors other than talin cleavage contribute to the lower stability of early adhesions. Nevertheless, the rapid dynamics of talin as a result of its cleavage in early adhesions appears to be needed for adhesion maturation and for cell growth.
There is a question of how activation of calpain occurs and two different activation mechanisms have been reported for calpain 2, either calcium entry or tyrosine phosphorylation.30–32 Members of the transient receptor potential (TRP) family of channels have been previously shown to activate calpain by regulating calcium ion influx.33,34 TRPM4 channel is a mechanosensitive ion channel localized at adhesions22 and in our experiments its inhibition reduces talin cleavage (Supplementary Figure 2d). Therefore, there appears to be a role for calcium entry in calpain activation followed by talin cleavage. Measurements of the level of calcium in migrating cells show that there are no spikes in the level of calcium.35 However, several TRP family channels (TRPV4, TRPC1, TRPM4) are activated by forces applied to integrins in focal adhesions.22,33,36,37 Low levels of calcium could enter locally and activate calpain, which could explain previous studies that show inhibition of motility upon inhibition of calcium channels.38,39 It is reasonable to suggest that the TRP channels are able to locally release calcium at early adhesions as part of the maturation process.
Studies in the past have shown that talin head domain activates integrins more than full length WT-talin,26,40 but whether this activation is due to talin head or absence of talin rod is unclear. Since integrin clustering depends upon integrin activation, it is surprising that NC-talin causes larger clusters to form than does the head, rod23 or wild type talin (Figure 4). Integrin density can alter cellular perception of substrate rigidity and affect several critical processes.41,42 However, free talin rod can restore normal density of integrins and cellular growth even in the presence of NC-talin (Figure 6e,f,g,h). Thus, the size of the integrin clusters depends upon the presence of talin rod fragment from talin cleavage. Furthermore, talin rod restores cell spreading and substrate deformation to a large extent on 24 kPa substrates in NC-talin cells (Figure 6b,c,d). All of the evidence points to a significant role for the talin rod in adhesion maturation that is needed for a variety of functions leading to cell growth.
These results reveal an unexpected role of talin cleavage in regulating early adhesions that impact cellular mechanosensing, force generation and proliferation. Future studies could help elucidate the exact pathway(s) by which this cleavage is able to make both short- and long-term changes in cell behavior. Based on these results we suggest that talin cleavage and talin-mediated integrin activation might be two mechanisms that counter each other to tightly regulate integrin density at adhesion sites. Disruption of talin cleavage can thus lead to the observed altered mechanosensing by changing integrin density. This altered integrin density in clusters can affect binding of adhesion partners like vinculin and α-actinin by altering talin stretching under force.25,43 Indeed, the generation of force in the presence of NC-talin was much slower. Further, these results generally indicate that there is an additional step in the formation of focal adhesions44 that requires the calpain-dependent cleavage of talin to release the talin rod.
Supplementary Material
ACKNOWLEDGMENTS
We are grateful to all the members of Sheetz lab for all the help provided. Especially Harshit Saxena for his help on the data representation and figures in the paper. This work was funded by National Institutes of Health (NIH) grant “Analysis of 120 nm local contractions linked to rigidity sensing” (1 R01 GM100282-01), National Institutes of Health (NIH) grant “Tropomyosin and tyrosine kinases in mechanics of cancer” (5 R01 GM113022-02). H.W. was supported by a Marie Curie International Outgoing Fellowship within the Seventh European Commission Framework Programme (PIOF-GA-2012332045). M.P.S was partially supported by the Mechanobiology Institute, National University of Singapore. R.C.’s work is supported by intramural funds from Mechanobiology Institute, National University of Singapore and Singapore National Research Foundation’s CRP Grant (NRF2012NRF-CRP001084). Haguy Wolfenson is a David and Inez Myers Career Advancement Chair in Life Sciences fellow.
Footnotes
The authors declare no competing financial interest.
Supporting Information
The Supporting Information is available free of charge on the ACS Publications website at DOI: 10.1021/acs.nano-lett.7b02476.
Methods, statistics, and supplementary figures (PDF)
REFERENCES
- (1).Rozario T; DeSimone DW Dev. Biol 2010, 341 (1), 126–140. [DOI] [PMC free article] [PubMed] [Google Scholar]
- (2).Schultz GS; Davidson JM; Kirsner RS; Bornstein P; Herman IM Wound Repair Regen. Off. Publ. Wound Heal. Soc. Eur. Tissue Repair Soc 2011, 19 (2), 134–148. [DOI] [PMC free article] [PubMed] [Google Scholar]
- (3).Desgrosellier JS; Cheresh DA Nat. Rev. Cancer 2010, 10 (1), 9–22. [DOI] [PMC free article] [PubMed] [Google Scholar]
- (4).Zhang X; Jiang G; Cai Y; Monkley SJ; Critchley DR; Sheetz MP Nat. Cell Biol 2008, 10 (9), 1062–1068. [DOI] [PMC free article] [PubMed] [Google Scholar]
- (5).Ellis SJ; Lostchuck E; Goult BT; Bouaouina M; Fairchild MJ; López-Ceballos P; Calderwood DA; Tanentzapf G PLoS Genet. 2014, 10 (11), e1004756. [DOI] [PMC free article] [PubMed] [Google Scholar]
- (6).Jiang G; Giannone G; Critchley DR; Fukumoto E; Sheetz MP Nature 2003, 424 (6946), 334–337. [DOI] [PubMed] [Google Scholar]
- (7).Zaidel-Bar R; Ballestrem C; Kam Z; Geiger BJ Cell Sci. 2003, 116 (22), 4605–4613. [DOI] [PubMed] [Google Scholar]
- (8).Bachir AI; Zareno J; Moissoglu K; Plow EF; Gratton E; Horwitz AR Curr. Biol 2014, 24 (16), 1845–1853. [DOI] [PMC free article] [PubMed] [Google Scholar]
- (9).Yan J; Yao M; Goult BT; Sheetz MP Cell. Mol. Bioeng 2015, 8 (1), 151–159. [DOI] [PMC free article] [PubMed] [Google Scholar]
- (10).Franco SJ; Rodgers MA; Perrin BJ; Han J; Bennin DA; Critchley DR; Huttenlocher A Nat. Cell Biol 2004, 6 (10), 977–983. [DOI] [PubMed] [Google Scholar]
- (11).Bate N; Gingras AR; Bachir A; Horwitz R; Ye F; Patel B; Goult BT; Critchley DR PLoS One 2012, 7 (4), e34461. [DOI] [PMC free article] [PubMed] [Google Scholar]
- (12).Wang P; Ballestrem C; Streuli CH J. Cell Biol 2011, 195 (3), 499–513. [DOI] [PMC free article] [PubMed] [Google Scholar]
- (13).Wang HB; Dembo M; Wang YL Am. J. Physiol Cell Physiol 2000, 279 (5), C1345–50. [DOI] [PubMed] [Google Scholar]
- (14).Vogel V; Sheetz MP Curr. Opin. Cell Biol 2009, 21 (1), 38–46. [DOI] [PMC free article] [PubMed] [Google Scholar]
- (15).Eberwein P; Laird D; Schulz S; Reinhard T; Steinberg T; Tomakidi P Biochim. Biophys. Acta, Mol. Cell Res 2015, 1853 (10), 2183–2198. [DOI] [PubMed] [Google Scholar]
- (16).Schneider IC; Hays CK; Waterman CM Mol. Biol. Cell 2009, 20 (13), 3155–3167. [DOI] [PMC free article] [PubMed] [Google Scholar]
- (17).Saxena M; Liu S; Yang B; Hajal C; Changede R; Hu J; Wolfenson H; Hone J; Sheetz MP Nat. Mater 2017, DOI: 10.1038/nmat4893. [DOI] [PMC free article] [PubMed] [Google Scholar]
- (18).Giannone G; Dubin-Thaler BJ; Dobereiner HG; Kieffer N; Bresnick AR; Sheetz MP Cell 2004, 116 (3), 431–443. [DOI] [PubMed] [Google Scholar]
- (19).Ghassemi S; Meacci G; Liu S; Gondarenko AA; Mathur A; Roca-Cusachs P; Sheetz MP; Hone J Proc. Natl. Acad. Sci. U. S. A 2012, 109 (14), 5328–5333. [DOI] [PMC free article] [PubMed] [Google Scholar]
- (20).Wolfenson H; Meacci G; Liu S; Stachowiak MR; Iskratsch T; Ghassemi S; Roca-Cusachs P; O’Shaughnessy B; Hone J; Sheetz MP Nat. Cell Biol 2015, 18 (1), 33–42. [DOI] [PMC free article] [PubMed] [Google Scholar]
- (21).Meacci G; Wolfenson H; Liu S; Stachowiak MR; Iskratsch T; Mathur A; Ghassemi S; Gauthier N; Tabdanov E; Lohner J; Gondarenko A; Chander AC; Roca-Cusachs P; O’Shaughnessy B; Hone J; Sheetz MP Mol. Biol. Cell 2016, 27, 3471. [DOI] [PMC free article] [PubMed] [Google Scholar]
- (22).Cáceres M; Ortiz L; Recabarren T; Romero A; Colombo A; Leiva-Salcedo E; Varela D; Rivas J; Silva I; Morales D; Campusano C; Almarza O; Simon F; Toledo H; Park K-S; Trimmer JS; Cerda O PLoS One 2015, 10 (6), e0130540. [DOI] [PMC free article] [PubMed] [Google Scholar]
- (23).Changede R; Xu X; Margadant F; Sheetz MP Dev. Cell 2015, 35 (5), 614–621. [DOI] [PubMed] [Google Scholar]
- (24).Galbraith CG; Yamada KM; Sheetz MP J. Cell Biol 2002, 159 (4), 695–705. [DOI] [PMC free article] [PubMed] [Google Scholar]
- (25).Wolfenson H; Bershadsky A; Henis YI; Geiger BJ Cell Sci. 2011, 124, 1425–1432. [DOI] [PMC free article] [PubMed] [Google Scholar]
- (26).Yan B; Calderwood DA; Yaspan B; Ginsberg MH J. Biol. Chem 2001, 276 (30), 28164–28170. [DOI] [PubMed] [Google Scholar]
- (27).Huang C; Rajfur Z; Yousefi N; Chen Z; Jacobson K; Ginsberg MH Nat. Cell Biol 2009, 11 (5), 624–630. [DOI] [PMC free article] [PubMed] [Google Scholar]
- (28).Yang B; Lieu ZZ; Wolfenson H; Hameed FM; Bershadsky AD; Sheetz MP Nano Lett. 2016, 16 (9), 5951–5961. [DOI] [PMC free article] [PubMed] [Google Scholar]
- (29).Wolfenson H; Lubelski A; Regev T; Klafter J; Henis YI; Geiger B PLoS One 2009, 4 (1), e4304. [DOI] [PMC free article] [PubMed] [Google Scholar]
- (30).Khorchid A; Ikura M Nat. Struct. Biol 2002, 9 (4), 239–241. [DOI] [PubMed] [Google Scholar]
- (31).Franco SJ; Huttenlocher AJ Cell Sci. 2005, 118 (17), 3829–3838. [DOI] [PubMed] [Google Scholar]
- (32).Louis M; Zanou N; Van Schoor M; Gailly PJ Cell Sci. 2008, 121 (23), 3951–3959. [DOI] [PubMed] [Google Scholar]
- (33).Kerstein PC; Jacques-Fricke BT; Rengifo J; Mogen BJ; Williams JC; Gottlieb PA; Sachs F; Gomez TM J. Neurosci 2013, 33 (1), 273–285. [DOI] [PMC free article] [PubMed] [Google Scholar]
- (34).Su LT; Agapito MA; Li M; Simonson WT; Huttenlocher A; Habas R; Yue L; Runnels LW J. Biol. Chem 2006, 281 (16), 11260–11270. [DOI] [PMC free article] [PubMed] [Google Scholar]
- (35).Tsai F-C; Seki A; Yang HW; Hayer A; Carrasco S; Malmersjö S; Meyer T Nat. Cell Biol 2014, 16 (2), 133–144. [DOI] [PMC free article] [PubMed] [Google Scholar]
- (36).Matthews BD; Thodeti CK; Tytell JD; Mammoto A; Overby DR; Ingber DE Integr. Biol. Quant. Biosci. Nano Macro 2010, 2 (9), 435–442. [DOI] [PMC free article] [PubMed] [Google Scholar]
- (37).Yang Y; Gonzales AL; Sanders L; Earley S FASEB J. 2012, 26 (1 Supplement), 685.35–685.35. [Google Scholar]
- (38).Fiorio Pla A; Ong HL; Cheng KT; Brossa A; Bussolati B; Lockwich T; Paria B; Munaron L; Ambudkar IS Oncogene 2012, 31 (2), 200–212. [DOI] [PMC free article] [PubMed] [Google Scholar]
- (39).Barbet G; Demion M; Moura IC; Serafini N; Léger T;Vrtovsnik F; Monteiro RC; Guinamard R; Kinet J-P; Launay P Nat. Immunol 2008, 9 (10), 1148–1156. [DOI] [PMC free article] [PubMed] [Google Scholar]
- (40).Cluzel C; Saltel F; Lussi J; Paulhe F; Imhof BA; Wehrle-Haller BJ Cell Biol. 2005, 171 (2), 383–392. [DOI] [PMC free article] [PubMed] [Google Scholar]
- (41).Cavalcanti-Adam EA; Micoulet A; Blummel J; Auernheimer J; Kessler H; Spatz JP Eur. J. Cell Biol 2006, 85 (3–4), 219–224. [DOI] [PubMed] [Google Scholar]
- (42).Cavalcanti-Adam EA; Volberg T; Micoulet A; Kessler H; Geiger B; Spatz JP Biophys. J 2007, 92 (8), 2964–2974. [DOI] [PMC free article] [PubMed] [Google Scholar]
- (43).del Rio A; Perez-Jimenez R; Liu R; Roca-Cusachs P; Fernandez JM; Sheetz MP Science 2009, 323 (5914), 638–641. [DOI] [PMC free article] [PubMed] [Google Scholar]
- (44).Iskratsch T; Wolfenson H; Sheetz MP Nat. Rev. Mol. Cell Biol 2014, 15 (12), 825–833. [DOI] [PMC free article] [PubMed] [Google Scholar]
Associated Data
This section collects any data citations, data availability statements, or supplementary materials included in this article.