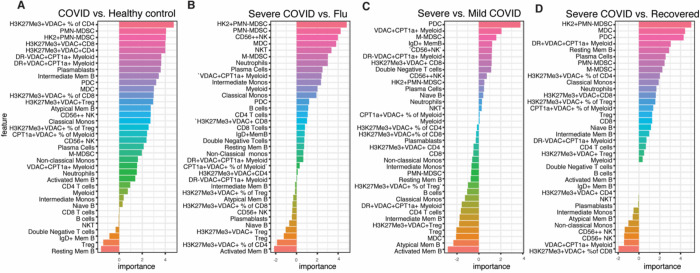
Figure 7: Presence of immune cells with distinct metabolic profiles predicts disease severity.
A-D. Feature importance of distinguishing COVID-A patients and healthy controls, COVID-A patients and Flu patients, severe COVID-A patients and COVID-R patients, or severe COVID-A patients and mild COVID-A patients as indicated. Each feature is depicted as a frequency of total live cells, unless otherwise indicated in the case of proportion of cell subset with a specific metabolic phenotype.

