

Abstract
Background
The Skeletal Oncology Research Group (SORG) machine learning algorithm for predicting survival in patients with chondrosarcoma was developed using data from the Surveillance, Epidemiology, and End Results (SEER) registry. This algorithm was externally validated on a dataset of patients from the United States in an earlier study, where it demonstrated generally good performance but overestimated 5-year survival. In addition, this algorithm has not yet been validated in patients outside the United States; doing so would be important because external validation is necessary as algorithm performance may be misleading when applied in different populations.
Questions/purposes
Does the SORG algorithm retain validity in patients who underwent surgery for primary chondrosarcoma outside the United States, specifically in Italy?
Methods
A total of 737 patients were treated for chondrosarcoma between January 2000 and October 2014 at the Italian tertiary care center which was used for international validation. We excluded patients whose first surgical procedure was performed elsewhere (n = 25), patients who underwent nonsurgical treatment (n = 27), patients with a chondrosarcoma of the soft tissue or skull (n = 60), and patients with peripheral, periosteal, or mesenchymal chondrosarcoma (n = 161). Thus, 464 patients were ultimately included in this external validation study, as the earlier performed SEER study was used as the training set. Therefore, this study—unlike most of this type—does not have a training and validation set. Although the earlier study overestimated 5-year survival, we did not modify the algorithm in this report, as this is the first international validation and the prior performance in the single-institution validation study from the United States may have been driven by a small sample or non-generalizable patterns related to its single-center setting. Variables needed for the SORG algorithm were manually collected from electronic medical records. These included sex, age, histologic subtype, tumor grade, tumor size, tumor extension, and tumor location. By inputting these variables into the algorithm, we calculated the predicted probabilities of survival for each patient. The performance of the SORG algorithm was assessed in this study through discrimination (the ability of a model to distinguish between a binary outcome), calibration (the agreement of observed and predicted outcomes), overall performance (the accuracy of predictions), and decision curve analysis (establishment on the ability of a model to make a decision better than without using the model). For discrimination, the c-statistic (commonly known as the area under the receiver operating characteristic curve for binary classification) was calculated; this ranged from 0.5 (no better than chance) to 1.0 (excellent discrimination). The agreement between predicted and observed outcomes was visualized with a calibration plot, and the calibration slope and intercept were calculated. Perfect calibration results in a slope of 1 and an intercept of 0. For overall performance, the Brier score and the null-model Brier score were calculated. The Brier score ranges from 0 (perfect prediction) to 1 (poorest prediction). Appropriate interpretation of the Brier score requires comparison with the null-model Brier score. The null-model Brier score is the score for an algorithm that predicts a probability equal to the population prevalence of the outcome for every patient. A decision curve analysis was performed to compare the potential net benefit of the algorithm versus other means of decision support, such as treating all or none of the patients. There were several differences between this study and the earlier SEER study, and such differences are important because they help us to determine the performance of the algorithm in a group different from the initial study population. In this study from Italy, 5-year survival was different from the earlier SEER study (71% [319 of 450 patients] versus 76% [1131 of 1487 patients]; p = 0.03). There were more patients with dedifferentiated chondrosarcoma than in the earlier SEER study (25% [118 of 464 patients] versus 8.5% [131 of 1544 patients]; p < 0.001). In addition, in this study patients were older, tumor size was larger, and there were higher proportions of high-grade tumors than the earlier SEER study (age: 56 years [interquartile range {IQR} 42 to 67] versus 52 years [IQR 40 to 64]; p = 0.007; tumor size: 80 mm [IQR 50 to 120] versus 70 mm [IQR 42 to 105]; p < 0.001; tumor grade: 22% [104 of 464 had Grade 1], 42% [196 of 464 had Grade 2], and 35% [164 of 464 had Grade 3] versus 41% [592 of 1456 had Grade 1], 40% [588 of 1456 had Grade 2], and 19% [276 of 1456 had Grade 3]; p ≤ 0.001).
Results
Validation of the SORG algorithm in a primarily Italian population achieved a c-statistic of 0.86 (95% confidence interval 0.82 to 0.89), suggesting good-to-excellent discrimination. The calibration plot showed good agreement between the predicted probability and observed survival in the probability thresholds of 0.8 to 1.0. With predicted survival probabilities lower than 0.8, however, the SORG algorithm underestimated the observed proportion of patients with 5-year survival, reflected in the overall calibration intercept of 0.82 (95% CI 0.67 to 0.98) and calibration slope of 0.68 (95% CI 0.42 to 0.95). The Brier score for 5-year survival was 0.15, compared with a null-model Brier of 0.21. The algorithm showed a favorable decision curve analysis in the validation cohort.
Conclusions
The SORG algorithm to predict 5-year survival for patients with chondrosarcoma held good discriminative ability and overall performance on international external validation; however, it underestimated 5-year survival for patients with predicted probabilities from 0 to 0.8 because the calibration plot was not perfectly aligned for the observed outcomes, which resulted in a maximum underestimation of 20%. The differences may reflect the baseline differences noted between the two study populations. The overall performance of the algorithm supports the utility of the algorithm and validation presented here. The freely available digital application for the algorithm is available here: https://sorg-apps.shinyapps.io/extremitymetssurvival/.
Level of Evidence
Level III, prognostic study.
Introduction
Estimating survival for patients with chondrosarcoma, the second most-common primary bone tumor [6, 16], can help patient counseling and shared decision-making. The Skeletal Oncology Research Group (SORG) algorithm was developed using national registry data to predict 5-year survival for patients surgically treated for chondrosarcoma. The variables required for the algorithm are sex, age, histologic subtype, tumor grade, tumor size, tumor extension, and tumor location [25]. The SORG algorithm was subsequently externally validated on patients from Massachusetts General Hospital and Brigham and Women’s Hospital. On external validation, the algorithm had good discrimination (the ability of a model to distinguish between a binary outcome, with a c-statistic of 0.87) and overall performance (the accuracy of predictions, with a Brier score of 0.152 relative to a null-model Brier score of 0.237, which indicates that the algorithm performed better on those patients than if the algorithm ignored all covariates) [2]. However the algorithm overestimated 5-year survival, with a calibration slope of 0.97 and calibration intercept of -0.58 [2], meaning that the algorithm may have predicted a better 5-year survival probability for some patients than was observed, with a maximal overestimation of 20%. The overall overestimation was likely caused by a difference in many of the tumor characteristics between the validation cohort and the derivation cohort in the Surveillance, Epidemiology, and End Results (SEER) database, as the validation cohort consisted of patients with larger tumor sizes, higher tumor grades, a more severe extent of disease, a larger numbers of tumors in the axial skeleton, and a higher proportion of patients with dedifferentiated chondrosarcoma [2].
Despite previous validation in an external population [2], the generalizability of the SORG algorithm to international populations remains to be determined. Repeated external validation is necessary because algorithm performance may be misleading when applied in a different populations, with different ethnicities, and different treatment approaches [11]. Since the institution where this study was performed is a tertiary care referral hospital that treats a large number of sarcoma patients not just from all over Italy but also from across Europe, this setting seemed appropriate for a validation study of this sort.
We therefore asked: Does the SORG algorithm retain validity in patients who underwent surgery for primary chondrosarcoma outside the United States, specifically in Italy?
Patients and Methods
Study Design and Setting
Our institutional review board approved this retrospective study. The Transparent Reporting of a Multivariable Prediction Model for Individual Prognosis or Diagnosis (TRIPOD) guidelines were followed for this external validation study [5].
The SORG algorithm to predict 5-year survival in patients with chondrosarcoma was developed by Thio et al. [25] and included the data of 1544 patients from the SEER program database, which contains the data of approximately 30% of patients with cancer in the United States. This algorithm was subsequently externally validated by the creators of the algorithm in an external population of patients, also from the United States [2]. This freely available model is currently available at https://sorg-apps.shinyapps.io/chondrosarcoma.
Although the earlier study overestimated 5-year survival, we did not modify the algorithm in this report because this is the first international validation and the prior performance in the single-institution validation study from the United States may have been driven by a small sample or nongeneralizable patterns related to its single-center setting [2].
Metrics previously used to measure algorithm performance on internal and external validation (discrimination, calibration, and overall performance) [2, 25] were applied in this study for validation. For discrimination, the c-statistic (commonly known as the area under the receiver operating characteristic curve [AUC] for binary classification), which ranges from 0.5 (no better than chance) to 1.0 (excellent discrimination), was calculated [22]. Calibration was visualized in a calibration plot, and the calibration slope and intercept were calculated. Perfect calibration results in a slope of 1 and an intercept of 0 [22, 23, 29]. When the calibration intercept is lower than 0, the predicted probabilities of the outcome are overestimated, whereas a positive intercept indicates underestimation of the algorithm [29]. For overall performance, the Brier score and the null-model Brier score were calculated and compared. The Brier score can be calculated by taking the average mean squared difference between the predictions of the model and the observed outcomes; it ranges from 0 (perfect prediction) to 1 (poorest prediction) [3]. Appropriate interpretation of the Brier score requires a comparison with the null-model Brier score. The null-model Brier score is the score for an algorithm that predicts a probability equal to the population prevalence of the outcome for every patient.
Participants
Medical records of patients treated between January 2000 and December 2014 at a tertiary referral center in Italy were reviewed. A total of 737 medical records were manually reviewed to establish whether the inclusion criteria were met. Survival status was determined by medical visit record sheets, death registry records, and patient follow-up calls for a minority of patients. We excluded patients whose first surgical procedure was performed elsewhere (n = 25), patients who were not treated with surgery (n = 27), patients with a chondrosarcoma of the soft tissue or skull (n = 60), and patients with peripheral, periosteal, or mesenchymal chondrosarcoma (n = 161).
Demographics, Description of Study Population
In total, 464 patients treated with surgery for extracranial chondrosarcoma of the bone with a minimum of 5 years of follow-up, unless they died earlier, were included in this study. We sought to follow all patients until 10 years after surgery, but 14 patients were lost to follow up, and for these patients, the results were imputed. In this study, 46% (213 patients) were female, and there was no difference between this study and the earlier SEER study [25] in sex and tumor location (Table 1). In this study, the patients had a higher median age at the date of surgery than those in the earlier SEER study [25] (56 years [interquartile range {IQR} 42 to 67] versus 52 years [IQR 40 to 64]; p = 0.007).
Table 1.
Baseline characteristics of patients from the SEER and international external validation dataset
| Variable | SEER cohorta (n = 1544) | International validation cohort (n = 464) | p value |
| Sex, % (n) | 0.596 | ||
| Female | 47 (731) | 46 (213) | |
| Male | 53 (813) | 54 (251) | |
| Age in years, median (IQR) | 52 (40-64) | 56 (42-67) | 0.007 |
| Histologic subtype, % (n) | < 0.001 | ||
| Conventional chondrosarcoma | 92 (1413) | 75 (346) | |
| Dedifferentiated chondrosarcoma | 8.5 (131) | 25 (118) | |
| Size, mm, median (IQR)b | 70 (42-105) | 80 (50-120) | < 0.001 |
| Grade, % (n)b | < 0.001 | ||
| I (well-differentiated) | 41 (592) | 22 (104) | |
| II (moderately differentiated) | 40 (588) | 42 (196) | |
| III (poorly differentiated) | 19 (276) | 35 (164) | |
| Tumor extension, % (n)b | < 0.001 | ||
| Localized | 57 (851) | 42 (183) | |
| Extraosseous extension | 37 (557) | 47 (208) | |
| Distant metastasis | 6 (95) | 12 (54) | |
| Location, % (n) | 0.058 | ||
| Extremities | 59 (915) | 63 (292) | |
| Rib, sternum, clavicle | 19 (289) | 13 (62) | |
| Pelvis | 17 (264) | 18 (84) | |
| Spine and sacrum | 5 (76) | 5.6 (26) | |
| Five-year survival, % (n)b | 76 (1131) | 71 (319) | 0.030 |
| Conventional chondrosarcomab | 81 (1104) | 82 (275) | 0.814 |
| Dedifferentiated chondrosarcomab | 21 (27) | 37 (44) | 0.003 |
From Thio et al. [25].
In the SEER development set, values for tumor size were available for 78% of the patients (1201 of 1544), tumor grade for 94% (1456 of 1544 patients), tumor extension for 97% (1503 of 1544 patients); and survival rates for 96% (1357 of 1413 patients) with conventional chondrosarcoma, and for 99% (130 of 131 patients) with dedifferentiated chondrosarcoma. In the international external validation set, values for tumor size were available for 94% (434 of 464) of the patients, tumor extension for 96% (445 of 464 patients); and survival rates for 97% (335 of 346 patients) with conventional chondrosarcoma, and 97% (115 of 118 patients) with dedifferentiated chondrosarcoma.
We note that there were several differences between this Italian study group and the earlier SEER cohort, and such differences are important because they help us to determine the performance of the algorithm in a group that is quite different from the initial study population. In the group from Italy, there were more patients with a diagnosis of dedifferentiated chondrosarcoma compared with those in the earlier SEER study [25] (25% [118 of 464 patients] versus 8% [131 of 1544 patients]; p < 0.001). Additionally, tumor size was larger in this study than in the earlier SEER study [25] (80 mm [IQR 50 to 120 mm] versus 70 mm [IQR 42 to 105 mm]; p < 0.001). This study had a smaller proportion of patients with Grade 1 (well-differentiated) tumors and a larger proportion of patients with Grade 3 (poorly differentiated) tumors compared with the earlier SEER study [25] (22% [104 of 464] had Grade 1, 42% [196 of 464] had Grade 2, and 35% [164 of 464] had Grade 3 versus 41% [592 of 1456] had Grade 1, 40% [588 of 1456] had Grade 2, and 19% [276 of 1456] had Grade 3; p ≤ 0.001). Furthermore, fewer patients in this study had localized disease than did those in the earlier SEER study [25] (41% [183 of 445] had localized disease, 47% [208 of 445] had extraosseous extension, 12% [54 of 445] had distant metastases versus 57% [851 of 1503] had localized disease, 37% [557 of 1503] had extraosseous extension, and 6% [95 of 1503] had distant metastases; p < 0.001).
Overall, fewer patients had 5-year survival in this study compared with the earlier SEER study [25] (71% [319 of 450] versus 76% [1131 of 1487]; p = 0.03). Patients in this study with dedifferentiated chondrosarcoma had a greater 5-year survival than did those in the earlier SEER study [25] (38% [44 of 115] versus 21% [27 of 130]; p = 0.003). No difference in 5-year survival was seen between this study and the earlier SEER study [25] among patients with conventional chondrosarcoma (82% [275 of 335] versus 81% [1104 of 1357]; p = 0.814).
Variables, Outcome Measures, Data Sources, and Bias
The outcome of interest was 5-year survival after the date of surgery. Explanatory variables required for the SORG algorithm were manually collected by one author (ES), which were sex (male or female), age (years at the time of surgery), histologic subtype (conventional chondrosarcoma or dedifferentiated chondrosarcoma), tumor grade (well, moderately, or poorly differentiated), tumor size (mm), tumor extension (localized, extraosseous extension, or distant metastasis), and location (extremities; spine and sacrum; pelvic bones; and rib, sternum, and clavicle).
Statistical Analysis, Study Size
We reported categorical variables as frequencies and percentages and continuous variables as medians and IQR. We performed the Fisher’s exact test and Mann-Whitney U test to assess differences in baseline characteristics between this study and the earlier SEER study [25]. We used imputation with the nonparametric missForest method [20] for the patients who were lost to follow-up (3% [14 of 464 patients) and for the small number of patients with missing data (6% [30 of 464 patients] had missing information on tumor size, 4% [19 of 464 patients] had missing information on tumor extension, and 3% [14 of 464 patients] had missing survival data). The primary validation analysis of this study was performed on the imputed data (n = 464), additionally a supportive complete case analysis (n = 423) was performed as the missing data could not safely be considered missing completely at random.
We calculated the predicted probabilities of 5-year survival for every patient in this study with the use of the SORG algorithm. As with the earlier SEER study [25] and the earlier external validation performed in the United States [2], we computed the c-statistic, calibration slope, calibration intercept, Brier score, and null-model Brier score. Additionally, we performed a decision curve analysis to show the net benefit of the algorithm compared with the threshold probability in a plot. The “none” line shows the expected net benefit when no changes are made to the intervention and the “all” line shows the expected net benefit when interventional changes are made for all patients. The decision curve analysis does not distinguish between different interventional changes; these changes could have been an alteration in the frequency of diagnostic workup, but also the addition of a pharmaceutical agent [31, 32].
Data analysis and model validation were performed with Microsoft Excel and Microsoft Azure (Redmond, WA, USA), the Anaconda Distribution (Continuum Analytics, Austin, TX, USA), R version 3.5.1 (The R Foundation, Vienna, Austria), RStudio (Version 1.0.153, Boston, MA, USA), Python Version 3.6 (Python Software Foundation, Wilmington, DE, USA), and StataCorp 2015 (Stata Statistical Software: Release 15.1; StataCorp LP, College Station, TX, USA).
Results
The SORG machine learning algorithm proved to have good discriminative ability, overall performance, and accuracy on external validation in this population of patients from Italy; however, calibration showed it underestimated 5-year survival. On external validation, the algorithm had a c-statistic of 0.86 (95% CI 0.82 to 0.89) (Fig. 1), suggesting good-to-excellent discrimination. There was excellent prediction of 5-year survival, from a predicted probability of 0.8 to predicted probability of 1.0 (Fig. 2). With predicted probabilities lower than 0.8, however, the SORG algorithm underestimated the observed proportion of patients with 5-year survival. The overall calibration intercept of 0.82 (95% CI 0.67 to 0.98) and overall calibration slope of 0.68 (95% CI 0.42 to 0.95) reflect this finding. The Brier score for 5-year survival was 0.15 compared with a null-model Brier of 0.21. Among these patients, the discrimination (see Fig. 1; Supplemental Digital Content 1, http://links.lww.com/CORR/A343) and calibration (see Fig. 2; Supplemental Digital Content 2, http://links.lww.com/CORR/A344) results were confirmed by the findings of the complete analysis (n = 423). The decision curve analysis in the validation cohort showed that the algorithm resulted in a larger net benefit than changing treatment for “all” or “none” patients (Fig. 3).
Fig. 1.

This figure shows the receiver operating characteristic curve for 5-year survival for the performance of the SORG algorithm in the international external validation cohort (n = 464).
Fig. 2.

This figure shows the calibration plot for 5-year survival for the performance of the SORG algorithm in the international external validation cohort (n = 464).
Fig. 3.
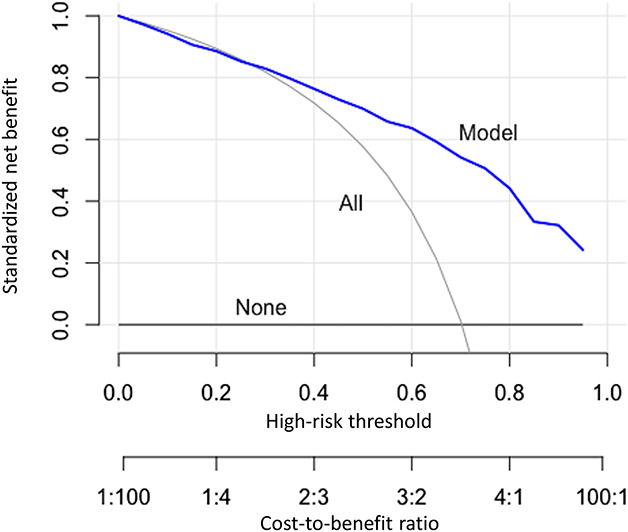
This figure shows the decision curve analysis for 5-year survival for the performance of the SORG algorithm in the international external validation cohort (n = 464).
The c-statistics were calculated separately for subpopulations of categorical tumor characteristics, and all subpopulations retained good accuracy. The c-statistics for conventional and dedifferentiated chondrosarcoma were 0.84 (95% CI 0.79 to 0.88) and 0.75 (95% CI 0.65 to 0.83), respectively. For tumor grade, the c-statistics for well-differentiated, moderately differentiated, and poorly differentiated tumors were 0.97 (95% CI 0.86 to 0.99), 0.74 (95% CI 0.65 to 0.82), and 0.74 (95% CI 0.66 to 0.81), respectively. The c-statistics for extremities; rib, sternum, and clavicle; pelvis; and spine were 0.86 (95% CI 0.81 to 0.90), 0.92 (95% CI 0.79 to 0.97), 0.83 (95% CI 0.71 to 0.91), and 0.90 (95% CI 0.70 to 0.97), respectively. These results reflect the outcomes of previous validation studies (Table 2).
Table 2.
Performance of the SORG Chondrosarcoma ML survival algorithm among the development, national external validation, and international external validation studies
| Performance measure | Development study | United States external validation (95% CI) | Italian external validation (95% CI) |
| C-statistic | 0.87 | 0.87 (0.80 to 0.91) | 0.86 (0.82 to 0.89) |
| Calibration slope | 1.03 | 0.97 (0.68 to 1.3) | 0.82 (0.67 to 0.98) |
| Calibration intercept | 0.001 | -0.58 (-0.20 to -0.97) | 0.68 (0.42 to 0.95) |
| Brier score | 0.12 | 0.15 | 0.15 |
| Null-model Brier score | 0.18 | 0.24 | 0.21 |
Discussion
Recently, many machine learning prediction algorithms have been developed in orthopaedic surgery [10, 12–15, 24]. The SORG algorithm was developed to predict 5-year survival for patients with chondrosarcoma using the SEER database [25], and the algorithm was externally validated on an independent population of patients from the United States [2]. However, this algorithm has not been studied in an international, non-American population. Repeated external validation of prognostication algorithms on different populations following the TRIPOD guidelines [5] is important because these algorithms could show inadequate performance across different populations [1, 11, 18]. The patients in this study were treated at an international center of reference for sarcoma that treats patients from all over Italy and other European countries, which made this a valuable sample for external validation. We found that the SORG algorithm demonstrated good discrimination and overall performance in this population of patients from one center in Italy; however, unlike the earlier study in a North American population (which overestimated survival [2]), the algorithm underestimated survival for patients in the current study, with predicted probabilities from 0 to 0.8, as the calibration plot was not perfectly aligned for the observed outcomes, which resulted in a maximum underestimation of 20%.
Limitations
This study has several limitations. First, this study was performed retrospectively, and prospective validation needs to be performed. However, primarily because of the rarity of primary bone tumors such as chondrosarcomas [17], retrospective studies are often more feasible in musculoskeletal oncology [11]. Multi-institutional international collaborations are needed to obtain sufficiently large samples for prospective studies. However, the single institution of this study treats patients from the entire European continent, and so the population that was cared for in this report may have been more diverse than the study design itself might suggest. Furthermore, both the group of patients who survived and the group of patients who did not survive consisted of more than 100 patients deemed as the minimum for external validation by Vergouwe et al. [30]. Second, the grading system used for the SORG algorithm does not reflect the actual classification system in which chondrosarcomas are classified as either conventional chondrosarcoma Grades 1 through 3 or dedifferentiated chondrosarcoma, which are all high-grade tumors. However, the algorithm retained good performance on subgroup analysis for only conventional or dedifferentiated chondrosarcoma. Improving algorithms to adhere to these classification rules should be a future goal of musculoskeletal research groups. Third, patients in this study had greater disease severity than patients in the earlier SEER study [25], in terms of tumor histology, size, grade, and extension. This likely reflects a selection bias because these patients were referred to our tertiary care center because of these challenging tumor characteristics. Nevertheless, although the characteristics of the patients in this study are different from those of the earlier SEER study, the algorithm retains good performance on discrimination, and overall performance, which emphasizes that the SORG algorithm can be used in different populations. Fourth, this international external validation was performed on a dataset of patients treated in Europe. Therefore, external validation of the SORG algorithm on non-American and non-European populations remains to be determined. Further, patients treated in more austere settings in hospitals with limited resources should be included in future validation or recalibration studies. Fifth, because the preferred therapy for chondrosarcoma remains surgical intervention, the SORG algorithm was developed for patients who were surgically treated; thus, the findings are not applicable to patients who received nonoperative treatment only.
Calibration Incongruities in Validating the SORG Algorithm
As the TRIPOD guidelines for prediction state, model calibration and decision curve analysis are important for an adequate interpretation of validation studies [5, 22]. This study showed a good decision curve analysis but underestimated survival on validation, so the algorithm predicted a worse 5-year survival probability for patients with predicted probabilities between 0 and 0.8 than actually observed, which resulted in an underestimation of 20% at the most. The moderately good calibration of the SORG algorithm on this external validation may be explained by several reasons. The baseline characteristics differed between the validation cohort and the SEER cohort on various variables, namely, age, histologic subtype, tumor size, tumor grade, and tumor extent [25]. Additionally, the 5-year survival in this study for patients with dedifferentiated chondrosarcoma was higher than in the earlier SEER study [25], even though there were no differences in baseline characteristics among the patients with dedifferentiated chondrosarcoma. The reason for the higher survival among patients with dedifferentiated tumors is most likely due to sarcoma referral center treatment bias: in this Italian sarcoma referral center, patients with localized dedifferentiated chondrosarcoma are treated by surgery combined with neoadjuvant and/or adjuvant chemotherapy, similar to high-grade osteosarcoma, irrespective of age [7, 8]. This approach became more prevalent through the years accompanied by a still-improving survival over time [9, 19]. In 2007, the 5-year survival for patients with localized dedifferentiated chondrosarcoma treated with chemotherapy was 33% [9]. Another factor is that although the validation cohort consisted of more patients (n = 464) than the first external validation of the SORG algorithm (n = 326) [2], the sample size is still relatively small. Calibration plots could be interpreted inaccurately when patient cohorts are smaller [21]. Even though the above-mentioned suggested minimum of 100 events in each group by Vergouwe et al. [30] was met, the suggested minimum of 200 events for each outcome group by van Calster et al. [28] for the reliable evaluation of calibration plots has not been achieved for deceased patients in this study. Because 119 of the 464 included patients died within 5 years after surgery, the required total sample size would be 780 patients to establish adequate calibration plotting. Again, it would be extremely difficult to reliably evaluate calibration plots without prospective multi-institutional collaborations. Future steps to further improve and validate such algorithms for orthopaedic oncology patients ideally should include prospective data collection of demographic, disease, and treatment parameters, as already has been performed in different fields of medicine and oncological research [4, 26, 27]. With such collaborations, it may be possible to update algorithms automatically, and adjust them for incongruities, such as the ones for calibration discussed in this study.
Conclusions
The results of the international external validation of the SORG algorithm to predict 5-year survival for patients with chondrosarcoma demonstrate that the algorithm retains good discriminative ability, overall performance, and decision curve analysis. However, the algorithm underestimated 5-year survival for patients, with predicted probabilities from 0 to 0.8, as the calibration plot was not perfectly aligned for the observed outcomes, which resulted in a maximum underestimation of 20%. This moderately good calibration can likely be explained by the higher proportion of patients with 5-year survival among patients with dedifferentiated chondrosarcoma in the validation cohort. The overall performance of the algorithm, with the Brier score below the null-model Brier score and the decision curve analysis showing positive net benefit at all predicted probabilities, supports the utility of the algorithm and validation presented here. The algorithm has been incorporated in a freely available online application at: https://sorg-apps.shinyapps.io/extremitymetssurvival/. Physicians and their patients may use this application, considering the above-mentioned limitations, to improve decision making and guide patients in their expectations and treatment processes.
Supplementary Material
Footnotes
Each author certifies that neither he or she, nor any member of his or her immediate family, has funding or commercial associations (consultancies, stock ownership, equity interest, patent/licensing arrangements, etc.) that might pose a conflict of interest in connection with the submitted article.
All ICMJE Conflict of Interest Forms for authors and Clinical Orthopaedics and Related Research® editors and board members are on file with the publication and can be viewed on request.
Each author certifies that his or her institution approved the human protocol for this investigation and that all investigations were conducted in conformity with ethical principles of research.
This work was performed at Massachusetts General Hospital, Boston, MA, USA and IRCCS Istituto Ortopedico Rizzoli, Bologna, Italy.
References
- 1.Altman DG, Royston P. What do we mean by validating a prognostic model? Stat Med. 2000;19:453–473. [DOI] [PubMed] [Google Scholar]
- 2.Bongers MER, Thio QCBS, Karhade A V, Stor ML, Raskin KA, Lozano Calderon SA, DeLaney TF, Ferrone ML, Schwab JH. Does the SORG algorithm predict 5-year survival in patients with chondrosarcoma? An external validation. Clin Orthop Relat Res. 2019;477:2296–2303. [DOI] [PMC free article] [PubMed] [Google Scholar]
- 3.Brier GW. Verification of forecasts expressed in terms of probability. Mon Weather Rev. 1950;78:1–3. [Google Scholar]
- 4.Cameron MJ, Tran DTT, Abboud J, Newton EK, Rashidian H, Dupuis J-Y. Prospective external validation of three preoperative risk scores for prediction of new onset atrial fibrillation after cardiac surgery. Anesth Analg. 2018;126:33–38. [DOI] [PubMed] [Google Scholar]
- 5.Collins GS, Reitsma JB, Altman DG, Moons KGM. Transparent reporting of a multivariable prediction model for individual prognosis or diagnosis (TRIPOD): the TRIPOD Statement. BMC Med. 2015;13:1. [DOI] [PMC free article] [PubMed] [Google Scholar]
- 6.Dorfman HD, Czerniak B. Bone cancers. Cancer. 1995;75:203–210. [DOI] [PubMed] [Google Scholar]
- 7.Ferrari S, Bielack SS, Smeland S, Longhi A, Egerer G, Sundby Hall K, Donati D, Kevric M, Brosjö O, Comandone A, Werner M, Monge O, Palmerini E, Berdel WE, Bjerkehagen B, Paioli A, Lorenzen S, Eriksson M, Gambarotti M, Tunn P-U, Jebsen NL, Cesari M, von Kalle T, Ferraresi V, Schwarz R, Bertulli R, Kasparek A-K, Grignani G, Krasniqi F, Sorg B, Hecker-Nolting S, Picci P, Reichardt P. EURO-B.O.S.S.: A European study on chemotherapy in bone-sarcoma patients aged over 40: Outcome in primary high-grade osteosarcoma. Tumori. 2018;104:30–36. [DOI] [PubMed] [Google Scholar]
- 8.Ferrari S, Smeland S, Bielack S, Comandone A, Dileo P, Picci P, Sundby Hall K, Eriksson M, Honegger H, Reichardt P. A European treatment protocol for bone sarcoma in patients older than 40 years. J Clin Oncol. 2009;27:10516. [Google Scholar]
- 9.Grimer RJ, Gosheger G, Taminiau A, Biau D, Matejovsky Z, Kollender Y, San-Julian M, Gherlinzoni F, Ferrari C. Dedifferentiated chondrosarcoma: prognostic factors and outcome from a European group. Eur J Cancer. 2007;43:2060–5. [DOI] [PubMed] [Google Scholar]
- 10.Harris AHS, Kuo AC, Weng Y, Trickey AW, Bowe T, Giori NJ. Can Machine Learning Methods Produce Accurate and Easy-to-use Prediction Models of 30-day Complications and Mortality After Knee or Hip Arthroplasty? Clin Orthop Relat Res. 2019;477:452–460. [DOI] [PMC free article] [PubMed] [Google Scholar]
- 11.Healey JH. CORR Insights®: Can machine-learning techniques be used for 5-year survival prediction of patients with chondrosarcoma? Clin Orthop Relat Res. 2018;476:2049–2051. [DOI] [PMC free article] [PubMed] [Google Scholar]
- 12.Karhade A V, Ogink PT, Thio QCBS, Cha TD, Gormley WB, Hershman SH, Smith TR, Mao J, Schoenfeld AJ, Bono CM, Schwab JH. Development of machine learning algorithms for prediction of prolonged opioid prescription after surgery for lumbar disc herniation. Spine J. 2019;19:1764–1771. [DOI] [PubMed] [Google Scholar]
- 13.Karhade A V, Thio QCBS, Ogink PT, Bono CM, Ferrone ML, Oh KS, Saylor PJ, Schoenfeld AJ, Shin JH, Harris MB, Schwab JH. Predicting 90-day and 1-year mortality in spinal metastatic disease: Development and internal validation. Neurosurgery. 2019;85:E671–E681. [DOI] [PubMed] [Google Scholar]
- 14.Karhade A V, Thio Q, Ogink P, Kim J, Lozano-calderon S, Raskin K, Schwab JH. Development of machine learning algorithms for prediction of 5-year spinal chordoma survival.. World Neurosurg. 2019;119:e842–e847. [DOI] [PubMed] [Google Scholar]
- 15.Karhade A V, Thio QCBS, Ogink PT, Shah AA, Bono CM, Oh KS, Saylor PJ, Schoenfeld AJ, Shin JH, Harris MB, Schwab JH. Development of machine learning algorithms for prediction of 30-day mortality after surgery for spinal metastasis. Neurosurgery. 2019;85:E83–E91. [DOI] [PubMed] [Google Scholar]
- 16.Nazeri E, Gouran Savadkoohi M, Majidzadeh -A K, Esmaeili R. Chondrosarcoma: An overview of clinical behavior, molecular mechanisms mediated drug resistance and potential therapeutic targets. Crit Rev Oncol Hematol. 2018;131:102–109. [DOI] [PubMed] [Google Scholar]
- 17.Praag van VM, Rueten-Budde AJ, Ho V, Dijkstra PDS, van der Geest IC, Bramer JA, Schaap GR, Jutte PC, Schreuder HB, Ploegmakers JJW, Fiocco M, van de Sande MAJ. Incidence, outcomes and prognostic factors during 25 years of treatment of chondrosarcomas. Surg Oncol. 2018;27:402–408. [DOI] [PubMed] [Google Scholar]
- 18.Shah ND, Steyerberg EW, Kent DM. Big data and predictive analytics: Recalibrating expectations. JAMA. 2018;320:27–28. [DOI] [PubMed] [Google Scholar]
- 19.Staals EL, Bacchini P, Bertoni F. Dedifferentiated central chondrosarcoma. Cancer. 2006;106:2682–91. [DOI] [PubMed] [Google Scholar]
- 20.Stekhoven DJ, Bühlmann P. MissForest--non-parametric missing value imputation for mixed-type data. Bioinformatics. 2012;28:112–118. [DOI] [PubMed] [Google Scholar]
- 21.Steyerberg EW, Harrell FE. Prediction models need appropriate internal, internal-external, and external validation. J Clin Epidemiol. 2016;69:245–247. [DOI] [PMC free article] [PubMed] [Google Scholar]
- 22.Steyerberg EW, Vergouwe Y. Towards better clinical prediction models: Seven steps for development and an ABCD for validation. Eur Heart J. 2014;35:1925–1931. [DOI] [PMC free article] [PubMed] [Google Scholar]
- 23.Steyerberg EW, Vickers AJ, Cook NR, Gerds T, Gonen M, Obuchowski N, Pencina MJ, Kattan MW. Assessing the performance of prediction models: A framework for traditional and novel measures. Epidemiology. 2010;21:128–138. [DOI] [PMC free article] [PubMed] [Google Scholar]
- 24.Thio QCBS, Karhade A V, BJJ Bindels, Ogink PT, Bramer JAM, Ferrone ML, Calderón SL, Raskin KA, Schwab JH. Development and internal validation of machine learning algorithms for preoperative survival prediction of extremity metastatic disease. Clin Orthop Relat Res. 2020;478:322–333. [DOI] [PMC free article] [PubMed] [Google Scholar]
- 25.Thio QCBS, Karhade A V, Ogink PT, Raskin KA, De Amorim Bernstein K, Lozano Calderon SA, Schwab JH. Can machine-learning techniques be used for 5-year survival prediction of patients with chondrosarcoma? Clin Orthop Relat Res. 2018;476:2040–2048. [DOI] [PMC free article] [PubMed] [Google Scholar]
- 26.Tosco L, De Coster G, Roumeguère T, Everaerts W, Quackels T, Dekuyper P, Van Cleynenbreugel B, Van Damme N, Van Eycken E, Ameye F, Joniau S, Be RALP the Belgian RALP consortium. Development and external validation of nomograms to predict adverse pathological characteristics after robotic prostatectomy: Results of a prospective, multi-institutional, nationwide series. Eur Urol Oncol. 2018;1:338–345. [DOI] [PubMed] [Google Scholar]
- 27.Trubiano JA, Vogrin S, Chua KYL, Bourke J, Yun J, Douglas A, Stone CA, Yu R, Groenendijk L, Holmes NE, Phillips EJ. Development and validation of a penicillin allergy clinical decision rule. JAMA Intern Med. 2020. [DOI] [PMC free article] [PubMed] [Google Scholar]
- 28.van Calster B, Nieboer D, Vergouwe Y, De Cock B, Pencina MJ, Steyerberg EW. A calibration hierarchy for risk models was defined: from utopia to empirical data. J Clin Epidemiol. 2016;74:167–176. [DOI] [PubMed] [Google Scholar]
- 29.van Calster B, Vickers AJ. Calibration of risk prediction models: impact on decision-analytic performance. Med Decis Making. 2015;35:162–9. [DOI] [PubMed] [Google Scholar]
- 30.Vergouwe Y, Steyerberg EW, Eijkemans MJC, Habbema JDF. Substantial effective sample sizes were required for external validation studies of predictive logistic regression models. J Clin Epidemiol. 2005;58:475–483. [DOI] [PubMed] [Google Scholar]
- 31.Vickers AJ, van Calster B, Steyerberg EW. A simple, step-by-step guide to interpreting decision curve analysis. Diagnostic Progn Res. 2019;3:18. [DOI] [PMC free article] [PubMed] [Google Scholar]
- 32.Vickers AJ, Elkin EB. Decision curve analysis: a novel method for evaluating prediction models. Med Decis Making. 2006;26:565–574. [DOI] [PMC free article] [PubMed] [Google Scholar]
Associated Data
This section collects any data citations, data availability statements, or supplementary materials included in this article.