

Abstract
The SARS-CoV-2 spike (S) protein variant D614G supplanted the ancestral virus worldwide, reaching near fixation in a matter of months. Here we show that D614G was more infectious than the ancestral form on human lung cells, colon cells, and on cells rendered permissive by ectopic expression of human ACE2 or of ACE2 orthologs from various mammals, including Chinese rufous horseshoe bat and Malayan pangolin. D614G did not alter S protein synthesis, processing, or incorporation into SARS-CoV-2 particles, but D614G affinity for ACE2 was reduced due to a faster dissociation rate. Assessment of the S protein trimer by cryo-electron microscopy showed that D614G disrupts an interprotomer contact and that the conformation is shifted toward an ACE2 binding-competent state, which is modeled to be on pathway for virion membrane fusion with target cells. Consistent with this more open conformation, neutralization potency of antibodies targeting the S protein receptor-binding domain was not attenuated.
Keywords: SARS-CoV-2, COVID-19, coronavirus, Spike protein, ACE2, pandemic, cryo-electron microscopy, neutralizing antibody, infectivity
Graphical Abstract
Structural and molecular insights into the SARS-CoV-2 spike protein variant D614G reveal the basis of its increased infectivity
Introduction
Next-generation sequencing permits real-time detection of genetic variants that appear in pathogens during disease outbreaks. Tracking viral variants now constitutes a requisite component of the epidemiologist’s toolkit, one that can pinpoint the origin of a zoonotic virus and the trajectory it takes from one susceptible host to another (Hadfield et al., 2018; Shu and McCauley, 2017). Lagging behind sequence-based modeling of virus phylogenies and transmission chains is the ability to understand the effect of viral variants on the efficiency of transmission between hosts or on the clinical severity of infection. Most sequence variants that arise during virus replication are either detrimental to the fitness of the virus or without consequence. Even so, such variants can increase in frequency over the course of an outbreak by chance (Grubaugh et al., 2020). More rarely, though, increasing frequency of a variant can reflect competitive advantage due to higher intrinsic replication capacity, with increased viral load and transmissibility.
In December 2019, an outbreak of unexplained fatal pneumonia became apparent in Wuhan City, Hubei Province, China. By early January 2020, SARS-CoV-2 was identified as the virus causing the disease (Huang et al., 2020; Lu et al., 2020; Wu et al., 2020a, 2020b; Zhou et al., 2020b; Zhu et al., 2020). After SARS-CoV (Drosten et al., 2003; Ksiazek et al., 2003) and MERS-CoV (Zaki et al., 2012), SARS-CoV-2 is the third human coronavirus this century known to cause pneumonia with a significant case-fatality rate (Coronaviridae Study Group of the International Committee on Taxonomy of Viruses, 2020). Hundreds of coronaviruses have been identified in bats, including at least 50 SARS-like Sarbecoviruses (Lu et al., 2020; Zhou et al., 2020a). The virus closest in sequence to SARS-CoV-2 observed to date was isolated from a bat (Zhou et al., 2020b), although the most proximal animal reservoir for SARS-CoV-2 remains unknown (Andersen et al., 2020; Lam et al., 2020). Sarbecoviruses, the viral subgenus containing SARS-CoV and SARS-CoV-2, undergo frequent recombination, but SARS-CoV-2 is not a recombinant of any Sarbecoviruses detected to date. Its receptor-binding motif, important for human ACE2 receptor-binding specificity, appears to be an ancestral trait shared with multiple bat viruses (Boni et al., 2020).
Among RNA viruses, coronaviruses are remarkable for having the largest known genomes (Saberi et al., 2018) and for encoding a 3′-to-5′-exoribonuclease that permits high-fidelity replication by the viral RNA-dependent RNA polymerase (Denison et al., 2011; Smith et al., 2014). By preventing otherwise lethal mutagenesis (Smith et al., 2013), the coronavirus exonuclease is thought necessary for the coronavirus genome size to extend beyond the theoretical limit imposed by error rates of viral RNA polymerases (Holmes, 2003). Although the rate of sequence variation among SARS-CoV-2 isolates is modest, over the course of the pandemic the virus has had opportunity to generate numerous sequence variants, many of which have been identified among the thousands of SARS-CoV-2 genomes sequenced to date (https://www.gisaid.org/) (Hadfield et al., 2018). Here, we investigate potential functional and structural consequences of one of these variants, the Spike protein variant D614G, which has been associated with increased viral load in people with COVID-19 (Korber et al., 2020; McNamara et al., 2020; Volz et al., 2020; Wagner et al., 2020).
Results
The SARS-CoV-2 D614G S Protein Variant Supplanted the Ancestral Virus in Humans
Over the course of the SARS-CoV-2 pandemic, 12,379 single-nucleotide polymorphisms (SNPs) have been identified in genomic data (GISAID download on June 25, 2020). 6,077 of the SNPs were seen only once in the dataset, and only four SNPs rose to high frequency. These four SNPs include C241U in the 5′UTR, a silent mutation C3037U, C14408U encoding the RNA-dependent RNA polymerase variant P323L, and A23403G encoding the spike protein variant D614G. A23403G was first reported at the end of January 2020 in virus genomes from China and Germany. Given how few SARS-CoV-2 genomes have been sequenced from early in the outbreak, the geographic origin of A23403G cannot be determined. The frequency of A23403G has increased steadily over time and is now present in approximately 74% of all published sequences (Figure 1 A). Sequences available over recent weeks, though, indicate that A23403G has nearly reached fixation globally (Figures 1A and 1B).
Figure 1.

The Frequency of the SARS-CoV-2 S Protein D614G Variant over the Course of the Pandemic Has Increased Nearly to Fixation
(A) The global frequency of the S protein D614G variant over time in the GISAID SARS-CoV-2 database as of June 25, 2020. The filled blue plot represents a seven-day rolling average of the fraction of sequences bearing the D614G variant for each collection date. Dates without published sequences are linearly interpolated. The overlaid black line shows the cumulative frequency of D614G in sequences collected up to and including each date.
(B) The frequency of the D614G variant over time (blue) in sequences collected from six continental regions, using the same dataset as in (A), plotted as a seven-day rolling average. The frequency of the last date with data is carried forward where recent dates lack data to indicate the most recent calculated frequency (light blue). Red bars show the number of sequences that were used to provide the denominator for calculating the frequency for each date.
The SARS-CoV-2 D614G S Protein Variant Increases Infectivity of Pseudotyped Lentiviruses in Cell Culture
The ability of the D614G S protein variant to target virions for infection of ACE2-positive cells was assessed by using single-cycle lentiviral vector pseudotypes in tissue culture. Mammalian expression plasmids were engineered to encode the ancestral S protein D614 or the D614G variant. Each S protein expression plasmid was separately transfected into HEK293 cells with plasmids encoding HIV-1 structural proteins and enzymes. Separate plasmids were transfected that encode RNAs with HIV-1 cis-acting signals for packaging and replication and either GFP or luciferase (Luc) reporter cassettes. For each condition tested, multiple virus stocks were produced, and each stock was tested in triplicate after vector particle normalization by using reverse-transcriptase activity. Forty-eight hours after challenge with the vectors, the transduction efficiency of each virion preparation was assessed by measuring the percent of GFP-positive cells using flow cytometry or by quantitating target cell-associated luciferase activity.
When Calu-3 human lung epithelial cells were used as targets, challenge with virus bearing D614G resulted in 6-fold more GFP-positive cells, or 5-fold more bulk luciferase activity, than did particles bearing D614 S protein (Figure 2 A). When Caco-2 human colon epithelial cells were used as target cells, 4-fold higher infectivity was observed with D614G (Figure 2A). Additionally, when HEK293 cells or SupT1 cells had been rendered infectable by stable expression of exogenous ACE2 and TMPRSS2, D614G was 9-fold more infectious than was D614 (Figure 2A).
Figure 2.

SARS-CoV-2 D614G S Protein Variant Enhances Infectivity of Pseudotyped Lentiviruses in Cell Culture
(A) Lentiviral virions bearing either GFP or Luciferase transgenes, and pseudotyped with either SARS-CoV-2 D614 or D614G S proteins, were produced by transfection of HEK293 cells and used to transduce human Calu3 lung cells, Caco2 colon cells, and either HEK293 or SupT1 cells stably expressing ACE2 and TMPRSS2. Relative infectivity of D614G versus D614, with D614 set at one, was determined based on flow cytometry for percent GFP positivity or on bulk luciferase activity. Each point represents the mean ± SD for transduction with lentiviral stocks derived from independent transfections, each value of which is the mean of three technical replicates. P values are the ratio paired t test (two-tailed).
(B) Lentiviral virions bearing a luciferase transgene, pseudotyped with either SARS-CoV-2 D614 or D614G S proteins, were produced by transfection of HEK293 cells and used to transduce human HEK293 cells transiently transfected with plasmids encoding the indicated ACE2 orthologs. Relative infectivity of D614G versus D614, with D614 set at one, was determined based on bulk luciferase activity. Each point represents the mean ± SD after transduction by using lentiviral stock derived from an independent transfection, each of which is the mean of three technical replicates. P values are ratio paired t test (two-tailed).
D614G Increases Infectivity on Target Cells Bearing ACE2 Orthologs from Multiple Species
The likely zoonotic origin of SARS-CoV-2 raises the question of whether D614G was selected during the pandemic as a result of human-to-human transmission. To determine whether the increased infectivity of D614G is specific for certain ACE2 orthologs, HEK293 cells were transfected separately with plasmids encoding ACE2 orthologs from human (Homo sapiens), Chinese rufous horseshoe bat (Rhinolophus sinicus), Malayan pangolin (Manis javanica), cat (Felis catus), and dog (Canis lupis). Each ACE2 transfectant was then challenged with luciferase reporter viruses bearing SARS-CoV-2 Spike protein, either D614 or D614G. Relative increase in infectivity due to D614G was comparable in cells expressing all of these ACE2 orthologs (Figure 2B), demonstrating that increased infectivity due to D614G is not specific for human ACE2.
D614G Does Not Alter S Protein Synthesis, Processing, and Incorporation into SARS-CoV-2 Particles
The effect of D614G on S protein synthesis, processing, and incorporation into virion particles produced by SARS-CoV-2 structural proteins was assessed next (Figure 3 A). HEK293T cells were transfected with plasmids expressing each of the four SARS-CoV-2 virion-associated structural proteins (Figure 3A). Western blots were then performed on the cell lysate and on proteins from the pellet after ultracentrifugation of the transfection cell supernatant. The minimal requirement for virion assembly by other coronaviruses is the membrane protein (M) and the envelope protein (E) (for mouse hepatitis virus [Bos et al., 1996; Vennema et al., 1996]) or the M and nucleocapsid protein (N) (for SARS-CoV [Huang et al., 2004]). In the case of SARS-CoV-2, M protein production was sufficient to release particles from transfected cells, although particle release by M was increased by co-production of N (Figure 3B). The S proteins D614 and D614G were produced to comparable levels, processed to S1 and S2 with comparable efficiency, and incorporated into SARS-CoV-2 virus-like particles at similar levels (Figure 3B). These results suggest that increased infectivity due to D614G is primarily manifested after virion assembly, during entry into target cells.
Figure 3.

Synthesis, Processing, and Incorporation of S Protein Variants into SARS-CoV-2 Virus-like Particles
(A) Schematic showing how SARS-CoV-2 structural proteins were produced in HEK293T cells and virus-like particles were enriched from the supernatant by ultracentrifugation.
(B) HEK293T cells were transfected with plasmids encoding the proteins indicated at the top. Total protein in cell lysates and in ultracentrifuge pellets from cell culture supernatant was normalized by Bradford assay, and then western blots were performed with the primary antibodies indicated on the left of the blots. Anti-Raptor antibody was used as a loading control for the cell lysate. Uncleaved S proteins, as well as the S1 and S2 cleavage products, are indicated on the right. Results here are representative of three independent rounds of transfection, ultracentrifugation, and westerns.
D614G Decreases the Affinity for ACE2 by Increasing the Rate of Dissociation
Although D614G is located outside of the receptor-binding domain, this non-conservative amino acid change might alter ACE2-binding properties via allosteric effects. Surface plasmon resonance (SPR) was used to determine whether the kinetics of SARS-CoV-2 S protein binding to human ACE2 is changed by D614G. Human ACE2 was immobilized, and the binding of soluble, trimeric SARS-CoV-2 S protein, either D614 or D614G, was detected. At 25°C, the rate of association with ACE2 was little different between D614G and D614, but D614G dissociated from ACE2 at a rate 4-fold faster than D614, resulting in a 5.7-fold reduction in binding affinity (Figure 4 ). At 37°C, the association rate between D614G and ACE2 was slower than that between D614 and ACE2, and the dissociation rate of D614G was faster, again resulting in 5-fold reduction in binding affinity (Figure 4). Consistent with this increased affinity, the 25-nM dilution of D614 S protein was too high to be measured at 37°C (Figure 4C). These data demonstrate that the increased infectivity of D614G is not explained by greater ACE2 binding strength.
Figure 4.

SARS-CoV-2 D614G S Protein Variant Binds ACE2 Weaker than the Ancestral Protein
(A–D) SPR measurement of D614-ACE2 binding ([A] and [C]) and D614G-ACE2 binding ([B] and [D]) at 25°C ([A] and [B]) or 37°C ([C] and [D]).
(E) Summary of kinetic parameters measured in (A)–(D). D614G binds ACE2 5-fold weaker than D614 at both temperatures tested.
D614G and the Ancestral S Protein Are Equally Sensitive to Neutralization by Monoclonal Antibodies Targeting the Receptor-Binding Domain
The global spread and enhanced infectivity of the SARS-CoV-2 D614G variant raises the question of whether this structural change would compromise the effectiveness of antiviral therapies targeting the S protein, especially if they were designed to target D614. To determine if this is the case, the neutralization potency of four monoclonal antibodies that target the SARS-CoV-2 Spike protein receptor-binding domain was assessed. These fully human monoclonal antibodies (Hansen et al., 2020) are currently under evaluation in clinical trials as therapeutics for COVID-19 (NCT04425629, NCT04426695). Each of these monoclonal antibodies, whether tested individually or in various combinations, demonstrated similar neutralization potency against D614G as they did against D614 (Figure 5 ).
Figure 5.

Neutralization Potency of Monoclonal Antibodies Targeting the SARS-CoV-2 S Protein Receptor-Binding Domain Is Not Attenuated by D614G
(A and B) Vero cells were challenged with pVSV-SARS-CoV-2-S-mNeon pseudoparticles encoding either D614 (A) or D614G (B) S protein variants in the presence of serial dilutions of the indicated human monoclonal antibodies targeting the SARS-CoV-2 S protein receptor-binding domain or IgG1 isotype control. mNeon protein fluorescence was measured 24 h post-infection as a readout for virus infectivity. Data are graphed as percent neutralization relative to virus only infection control. Data represent the mean ± SD of three technical replicates.
(C) Neutralization potency (IC50) of individual monoclonals and of combinations of monoclonals, against the SARS-CoV-2 D614G and D614G S protein variants, as indicated.
D614G Changes the Conformation of the S1 Domain in the SARS-CoV-2 S Protein
Because the increased infectivity of D614G was not explained by increased affinity for ACE2 (Figure 4), cryo-electron microscopy (cryo-EM) was used to illuminate potential structural features that distinguish D614G from D614 (Table 1 ). Structural studies of the SARS-CoV-2 trimeric S protein ectodomain demonstrate that the receptor-binding domain (RBD) of each protomer can independently adopt either a closed or an open conformation, giving rise to asymmetric trimers (Walls et al., 2020; Wrapp et al., 2020). The open conformation is required for ACE2 binding because the ACE2 binding site is partially shielded in the closed conformation (Shang et al., 2020; Yan et al., 2020), and the open conformation is believed to be on pathway for S protein-mediated fusion of the virion membrane with the target cell membrane (Tortorici and Veesler, 2019). Both S protein variants, D614 and D614G, were expressed in mammalian cells as soluble trimers. When enriched from culture media, and eluted from a size-exclusion column, single peaks were observed for each variant protein at ∼500 kD, the predicted mass of the homotrimer (Figure S1 A). Enrichment of the protein complexes, and integrity of the full-length protomers, was additionally confirmed by SDS-PAGE (Figure S1B).
Table 1.
Summary of Cryo-EM Data Collection, Three-Dimensional Reconstruction, and Model Refinement
| SARS-Covid19 Spike (D614G) | |
|---|---|
| Imaging Parameters and Three-Dimensional Reconstruction | |
| Cryo-EM grids | UltrAuFoil R1.2/1.3 |
| Calibrated magnification | 155,000 |
| Acceleration voltage [kV] | 300 |
| Pixel size [Å] | 0.52 |
| Total dose [e−/Å2] | 37 |
| Exposure time [s] | 1.81 |
| Defocus range [μm] | −0.6 ∼−1.8 |
| Particles in final 3D reconstruction | 266,356 |
| Resolution (“Gold-standard” at FSC 0.143) [Å] | 3.7 |
| Model Refinement | |
| Resolution in phenix.real_space_refine [Å] | 4.0 |
| No. of atoms: protein | 18,294 |
| Ligands/ions | N/A |
| rmsds: bond lengths [Å] | 0.004 |
| rmsds: bond angles [°] | 0.808 |
| MolProbity score | 4.49 |
| Rotamer outliers [%] | 0.00 |
| Ramachandran angles: favored [%] | 93.88 |
| Ramachandran angles: allowed [%] | 6.12 |
| Ramachandran angles: outliers [%] | 0.00 |
| PDB | 6XS6 |
| EMDB | EMD-22301 |
Figure S1.

Structural Determination of Spike D614G, Related to Figure 6
(A) Size exclusion column elution profiles of D614G (blue line) and D614 (red line).
(B) Coomassie-stained SDS-PAGE of the peaks collected in (A) shows equivalent, full-length monomeric S proteins at around 180 kD.
(C) A still frame from a raw micrograph movie. Individual particles can be clearly visualized.
(D) 2D-clustering of trimeric D614G particles. Dagger denotes a top-view. Asterisk denotes a side-view.
(E) Fourier shell correlation diagram for D614G (unmasked).
(F) Half map Fourier shell correlation diagram (unmasked).
(G) Model to map Fourier shell correlation diagram.
(H) Local resolution of the ensemble map for Spike D614G.
Well-defined particles of S protein trimers were evident by cryo-EM (Figure S1C), and reference-free, two-dimensional clustering revealed structural details from different orientations (Figure S1D). Three-dimensional clustering and refinement generated the final density map for D614G (Figure 6 A, EMDB: EMD-22301), which showed a similar overall architecture to the published map of D614 (Figure 6B). Unmasked Fourier shell correlation (FSC) analysis indicated that the D614G map had a mean resolution of 3.7 Å (gold-standard criteria, Figure S1E; half-map FSC, Figure S1F) which is sufficient to reveal fine differences from D614.
Figure 6.

Structural Determination of Spike D614G
(A) D614G envelope from the three-dimensional reconstruction. EMDB: EMD-22301.
(B) Published D614 envelope (EMD-21452). Arrows point to the density corresponding to the receptor-binding domains, which is missing in the corresponding positions in (A).
(C) Domain arrangement of the SARS-CoV-2 S protein.
(D) Atomic model for D614G without the receptor-binding domain. PDB: 6XS6.
(E and F) Comparison of the D614G S1 subunit with the closed conformation (E) and open conformation (F) of the D614 S1 subunit. Arrows indicate the relative movement of the S1 subunit of D614G.
(G) Position of amino acid 614 on the S protein.
(H and I) Substitution of Asp614 with glycine changes hydrogen bonding around residue 614. In the case of D614 (H), an inter-protomer hydrogen bond is detected. For D614G (I), the Asp614-Thr859 hydrogen bond is eliminated, and interaction with intradomain Ala647 is strengthened.
See also Figures S1 and S2.
The SARS-CoV-2 S protein consists of S1 and S2 subunits, with multiple domains within S1 (Figure 6C). Comparing the map of D614G with that of D614, the N-terminal domain (NTD), the intermediary domain (INT), and the C-terminal domain (CTD) of the S1 subunit were clearly identified (Figure 6A and 6B). However, the density corresponding to the RBD, which was well resolved in D614 (arrows, Figure 6B), was scattered in the D614G map (Figure 6A), suggesting that its RBD is flexible and adopts multiple conformations (see section below).
Based on the resolved ensemble cryo-EM density map (Figure 6A) and the primary sequence (Figure 6C), an atomic model of D614G without the RBD was built (Figure 6D; PDB: 6XS6) and validated (Figure S1G, model-to-map FSC; Figure S1H, local resolution). In the structural model, the S2 subunit of D614G overlapped well with the published structures for D614 (root-mean-square deviation [RMSD] = 0.77 Å). In contrast, there was significant deviation within the S1 subunit (RMSD = 4.5 Å; Figures 6E and 6F). When the S1 subunit of D614G was superimposed on the closed conformation of D614, the S1-NTD and S1-INT shifted away from each other by 6 Å and 4 Å, respectively (Figures 6E, S2 B, and S2C), revealing a wider space between these two domains. When the S1 subunit of D614G was superimposed on D614 in the open conformation, the S1-NTD was shifted outward by 3 Å, whereas the S1-INT overlapped well with that of D614 (Figure 6F).
Figure S2.

Structural Determination of Spike D614G, Related to Figure 6
(A) Representative density map detail of an alpha helix region.
(B) Representative density map detail of a loop region.
(C) Representative density map detail of a beta strand region. Note: the relative positioning between (B) and (C) is the same as in the real structural model. No cryo-EM density is observed in between the loop where Gly614 resides and the beta strand where Thr859 resides.
D614 localizes to the interface between two protomers where its side chain forms hydrogen bonds with the T859 side chain in the adjacent protomer (Figure 6G). The effect of D614G on this interaction could be assessed since local resolution in the map generated here reached 3.2 Å. The atomic model showed that D614G has two consequences. First, D614G disrupts the inter-protomer hydrogen bond with Thr859 (Figures 6H and 6I), weakening the stability of the trimer. In effect, D614 acts as a “latch” that secures two protomers together, and D614G loosens this latch (Figures 6H and 6I). Second, intra-protomer distance between the backbone amine of residue 614 and the backbone carboxyl group of residue 647 is shortened from 3.4 Å to 2.7 Å, presumably stabilizing the CTD.
D614G Shifts the Probability that SARS-CoV-2 S Protein Trimers Occupy Open Conformations
To better assess the conformation of the RBD, the flexible region of S1 was subjected to masked three-dimensional classification and refinement, with the aim of resolving the conformational heterogeneity in that region. Two distinct classes arose from this analysis of the dataset. 58% of the protomers adopted an open conformation in which the RBD is positioned to interact with ACE2, and 42% were in the closed conformation in which the RBD is buried (Figures 7A and 7B). This ratio of the two conformations contrasted dramatically with assessment of D614 structural data (Walls et al., 2020), in which only 18% of the RBDs were in the open conformation and 82% in the closed conformation. The closed conformation of D614G overlapped well with the closed conformation of D614, whereas the open conformation of D614G showed significant deviation of all S1 domains away from the S2 subunit when compared with the open conformation of D614 (Figure 7C).
Figure 7.

D614G Populates More Open Conformations Than Does the Ancestral S Protein
(A) Cryo-EM density maps of the two conformations of D614G protomer. The first is a closed conformation with a buried RBD. The second is an open conformation with the RBD standing up.
(B) Atomic models for the closed (left) and open (right) conformations for the two D614G protomers shown in (A).
(C) Comparison of the two D614G protomer S1 subunit conformations with the corresponding conformations of the D614 protomer S1 subunit.
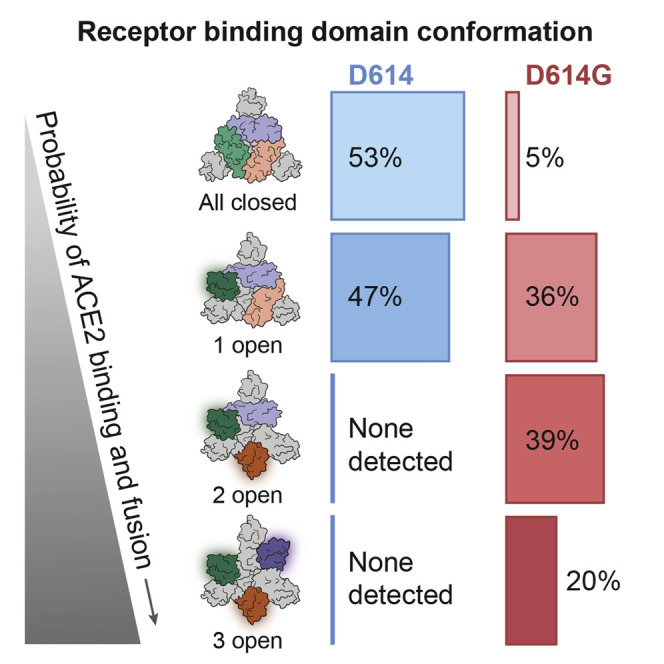
(D) The D614G S protein trimer adopts four conformations. In addition to the all-closed and one open conformation detected with the D614 S protein trimer, the D614G S protein trimer adopts two-open and three-open conformations.
Further classification of D614G homotrimers to determine the distribution of RBD conformations revealed four categories (Figure 7D). 5% of the particles had all three protomers in the closed conformation. 36% had one open protomer. 39% had two open protomers. 20% of the particles had all three protomers in the open conformation (Figure 7D). Analysis of D614 (Walls et al., 2020) showed that 46% of particles were in the all-closed conformation, and 54% in the one open conformation. These data further emphasize the contrast between D614G conformational space and that of D614.
Discussion
The SARS-CoV-2 S protein variant D614G is one of only four SNPs, out of the more than 12,000 reported in GISAID, that has risen to high frequency (Figure 1). This suggests that D614G confers a replication advantage to SARS-CoV-2, such that it increases the likelihood of human-to-human transmission. Data in which the presence of D614G correlates with increased rates of transmission through human populations would support this hypothesis. Several groups suggest that such an association exists (Furuyama et al., 2020; Korber et al., 2020; Volz et al., 2020), although adequately powered datasets, appropriately controlled for age and other variables, have eluded investigators. Future prospective comparisons of D614G transmission to that of D614 seem unlikely given that D614G has gone to near fixation worldwide (Figure 1). However, the SARS-CoV-2 genomes that have been sequenced are only a narrow snapshot of the pandemic and additional sequencing of archived samples might pinpoint the origin of D614G or better resolve the variant’s trajectory.
Indirect evidence that D614G is more infectious was provided here by experiments with pseudotyped viruses showing that D614G transduces 3- to 9-fold more efficiently than does the ancestral S protein (Figure 2A). This effect was seen with a range of cellular targets, including lung and colon epithelial cells. Efforts are underway to compare the replication efficiency of D614G with that of D614 in the context of the nearly 30,000-nucleotide SARS-CoV-2 genome. Such reverse genetic experiments, though, are technically difficult and potentially confounded by acquisition of unnatural, tissue-culture-adapted mutations during genome rescue and expansion in transformed cell lines, as has occurred during similar assessments of Ebola virus variants (Marzi et al., 2018; Ruedas et al., 2017; Wang et al., 2017). Consistent with the increased ability of D614G to infect cells in tissue culture, several studies suggest that D614G is associated with increased viral load in people with COVID-19 (Korber et al., 2020; McNamara et al., 2020; Volz et al., 2020; Wagner et al., 2020), although these studies quantitated SARS-CoV-2 RNA and did not measure infectious virus.
If SARS-CoV-2 Spike D614G is an adaptive variant that was selected for increased human-to-human transmission after spillover from an animal reservoir, one might expect that increased infectivity would only be evident on cells bearing ACE2 orthologs similar to that in humans. In contrast to the primate-specific increase in infectivity that was reported for the major clade-forming Ebola virus glycoprotein variant from the 2013–2016 West African outbreak (Diehl et al., 2016; Urbanowicz et al., 2016), the increased infectivity of D614G was equally evident on cells bearing ACE2 orthologs from a range of mammalian species (Figure 2B). The fact that D614G was more infectious on cells expressing ACE2 orthologs from Chinese rufous horseshoe bat and Malayan pangolin raises the question of why D614G does not dominate the sequences of closely related Sarbecoviruses that circulate in these species. Among these viruses, only SARS-CoV-2 possesses a polybasic furin cleavage site at the S1-S2 junction in the S protein, which is required for SARS-CoV-2 to infect human lung cells but not other cell types (Hoffmann et al., 2020). Interestingly, when non-lung cells are challenged, disruption of the furin-cleavage site increases SARS-CoV-2 infectivity to the same extent as does D614G (Zhang et al., 2020). These observations suggest not only that D614G increases infectivity in the presence of the furin cleavage site but also that D614G offers no selective advantage when transmission is possible in the absence of the furin site, as appears to be the case in bats and pangolins. Another possible explanation for why D614G dominated the SARS-CoV-2 pandemic, but has not been detected in bats, is that unlike bats, humans are immunologically naive to Sarbecoviruses. Interestingly, HIV-1 variants with increased infectivity in tissue culture have been isolated from the central nervous system, a compartment with reduced immune pressure (Peters et al., 2004; Quitadamo et al., 2018; Schnell et al., 2011).
Insight into the mechanism by which D614G increases infectivity was gleaned from cryo-EM studies of the SARS-CoV-2 S protein trimer. D614G exhibited striking conformational changes (Figures 6E, 6F, 7C, and 7D), all of which could be attributable to disruption of the interprotomer latch between D614 in S1 and T859 in S2 (Figures 6H and 6I). Weakening of the interprotomer contacts results in increased distance between the protomers and a dramatic flip in the ratio of open to closed S protein particles, from 82% closed and 18% open for D614 to 42% closed and 58% open for D614G. When S protein trimers were examined more closely, in addition to the all-closed conformation and the one open conformation previously reported for D614 (Walls et al., 2020), a significant fraction of D614G trimers populated a two-open conformation (39%) and an all-open state (20%). Previous structural studies of SARS-CoV and MERS-CoV S proteins identified similar conformations, with only MERS-CoV S protein exhibiting an all-open state like that reported here (Gui et al., 2017; Pallesen et al., 2017; Walls et al., 2019; Yuan et al., 2017). When the SARS-CoV-2 S protein RBD is in its closed conformation, the binding site for ACE2 is physically blocked (Shang et al., 2020; Yan et al., 2020). Models of coronavirus S-mediated membrane fusion describe ACE2 binding to all three RBD domains in the open conformation as destabilizing the pre-fusion S trimer, leading to dissociation of S1 from S2 and promoting transition to the post-fusion conformation (Pallesen et al., 2017; Walls et al., 2019). According to these models, the well-populated all-open conformation of D614G (Figure 7D) would reflect an intermediate that is on-pathway to S-mediated membrane fusion.
Despite the increased infectivity of D614G in tissue culture, and the increased viral load in infected people, increased COVID-19 disease severity has not been detected in association with D614G infection (Korber et al., 2020; McNamara et al., 2020; Volz et al., 2020; Wagner et al., 2020). Perhaps there are fitness tradeoffs for D614G in vivo due to the more open conformation of its RBD (Figure 7), which potentially renders D614G more immunogenic. In keeping with the fact that the location of D614G within the S protein is remote from the receptor-binding domain, that D614G affinity for ACE2 is less than that of D614 (Figure 4), and that the relatively better-concealed D614 receptor-binding domain is likely to be advantageous for immune evasion, the D614G and D614 variants are equally sensitive to neutralization by human monoclonal antibodies targeting the S protein RBD (Figure 5).
Limitations of Study
Although the analysis of SARS-CoV-2 sequence variants presented here is based on viral RNA obtained from tens of thousands of people infected with the virus from around the world, the available samples are highly skewed in terms of geographic origin, and they reflect only a fraction of a percent of all circulating SARS-CoV-2. Additional sequencing of archived samples, or of viruses currently circulating, could shed further light on the pandemic trajectory of D614G. The current high frequency of D614G throughout the world suggests that this variant transmits person to person more efficiently than do viruses bearing D614, but demographically matched cohorts that might be used for comparing transmission likelihood of D614 versus D614G have been difficult to assemble. Another complication of any epidemiologic study of human transmission is that D614G is generally accompanied by three other sequence variants. Nonetheless, the pseudotype experiments presented here show a pronounced increase in infectivity with D614G in isolation, and the structural studies are consistent with conformational changes expected for a more infectious S protein variant. Ultimately, the pseudotype results presented here need confirmation in the context of full-length recombinant SARS-CoV-2 and extension to transmission studies using an animal model. Finally, the structural determination of D614G performed here was with a widely used soluble version of the S protein that differs from the native protein in three aspects. First, the original furin cleavage site was removed. Second, a di-proline motif was introduced to stabilize the S protein. Third, the original transmembrane domain was substituted by a synthetic trimerization helix. Examination of the effect of D614G on native S protein will require electron cryotomography to directly visualize the S protein on virion-like particles.
STAR★Methods
Key Resources Table
| REAGENT or RESOURCE | SOURCE | IDENTIFIER |
|---|---|---|
| Antibodies | ||
| Rabbit polyclonal anti-SARS-CoV-2 M protein | ThermoFisher | PA1-41160; RRID: AB_1087198 |
| Rabbit polyclonal anti-SARS-CoV-2 E protein | Antibodies-online.com | ABIN1031551 |
| Rabbit polyclonal anti-SARS-CoV-2 N protein | Rockland Immunochemicals | 200-401-A50; RRID: AB_828403 |
| Rabbit monoclonal anti-SARS-CoV-2 S protein (S1-specific) | GeneTex | GTX635656 |
| Rabbit monoclonal anti-SARS-CoV-2 S protein (S1-specific) | GeneTex | GTX635672 |
| Mouse/human monoclonal anti-SARS-CoV-2 S protein (S2-specific) | Sino Biological | 40590-D001; RRID: AB_2857932 |
| Rabbit polyclonal anti-Raptor | EMD Millipore | 09-217; RRID: AB_612103 |
| Goat anti-rabbit antibody 800CW | Li-Cor | 925-32211; RRID: AB_2651127 |
| Goat anti-mouse 680RD | Li-Cor | 925-68070; RRID: AB_2651128 |
| Goat anti-rabbit, HRP-linked antibody | Cell Signaling Technology | 7074; RRID: AB_2099233 |
| Goat anti-mouse, HRP-linked antibody | Cell Signaling Technology | 7076; RRID: AB_330924 |
| Human monoclonal antibody targeting the receptor binding domain of the SARS-CoV-2 S protein | A. Baum et al., Science10.1126/science.abd0831 (2020)J. Hansen et al., Science10.1126/science.abd0827 (2020) | REGN10987 |
| Human monoclonal antibody targeting the receptor binding domain of the SARS-CoV-2 S protein | A. Baum et al., Science10.1126/science.abd0831 (2020)J. Hansen et al., Science10.1126/science.abd0827 (2020) | REGN10989 |
| Human monoclonal antibody targeting the receptor binding domain of the SARS-CoV-2 S protein | A. Baum et al., Science10.1126/science.abd0831 (2020)J. Hansen et al., Science10.1126/science.abd0827 (2020) | REGN10933 |
| Human monoclonal antibody targeting the receptor binding domain of the SARS-CoV-2 S protein | A. Baum et al., Science10.1126/science.abd0831 (2020)J. Hansen et al., Science10.1126/science.abd0827 (2020) | REGN10934 |
| Mouse monoclonal, anti-human Fc antibody | A. Baum et al., Science10.1126/science.abd0831 (2020)J. Hansen et al., Science10.1126/science.abd0827 (2020) | REGN2567 |
| Bacterial and Virus Strains | ||
| VSVΔG:mNeon/VSV-G virus | A. Baum et al., Science10.1126/science.abd0831 (2020)J. Hansen et al., Science10.1126/science.abd0827 (2020) | N/A |
| Chemicals, Peptides, and Recombinant Proteins | ||
| hsACE2.hFc | A. Baum et al., Science10.1126/science.abd0831 (2020)J. Hansen et al., Science10.1126/science.abd0827 (2020) | N/A |
| blasticidin | InvivoGen | ant-bl-1 |
| puromycin | InvivoGen | ant-pr-1 |
| gentamicin | Life Technologies | 15750078 |
| Ni-NTA resin | EMD Millipore | 30230 |
| Superose 6 gel-filtration column | GE Healthcare | 29091596 |
| PEI | Polysciences, Inc. | 23966-1 |
| TransIT LT1 transfection reagent | Mirus Bio | MIR 2304 |
| Lipofectamine LTX | Life Technologies | 15338100 |
| Cytofix | BD Biosciences | 554655 |
| SMM-293 TII serum-free media | SinoBiological | M293TI |
| Critical Commercial Assays | ||
| Mycoplasma detection kit | Lonza | LT07-318 |
| Steady-Glo Luciferase Assay System | Promega | E2550 |
| Bradford Protein Assay | Bio-Rad | 5000001 |
| Deposited Data | ||
| PDB | 6xs6 | N/A |
| EMDB | EMD-22301 | N/A |
| Experimental Models: Cell Lines | ||
| Human: HEK293 cells | ATCC | CRL-1573; RRID: CVCL_0045 |
| Human: HEK293T cells | ATCC | CRL-3216; RRID: CVCL_0063 |
| Human: HEK293T/17 cells | ATCC | CRL-11268; RRID: CVCL_1926 |
| Human: FreeStyle 293-F cells | ThermoFisher | R79007 |
| Human: Calu-3 cells | ATCC | HTB-55; RRID: CVCL_0609 |
| Human: Caco-2 cells | ATCC | HTB-37; RRID: CVCL_0025 |
| Human: SUPT1 [VB] cells | ATCC | CRL-1942; RRID: CVCL_1714 |
| Cercophithecus aethiops: Vero cells | ATCC | CCL-81; RRID: CVCL_0059 |
| Recombinant DNA | ||
| pcDNA3.1 SARS-CoV-2 S D614 | This publication | Addgene #158074 |
| pcDNA3.1 SARS-CoV-2 S D614G | This publication | Addgene #158075 |
| pcDNA3.1 SARS-CoV-2 S D614-trunc | This publication | Addgene #158076 |
| pcDNA3.1 SARS-CoV-2 S D614G-trunc | This publication | Addgene #158077 |
| pcDNA3.1 SARS-CoV-2 M | This publication | Addgene #158078 |
| pcDNA3.1 SARS-CoV-2 N | This publication | Addgene #158079 |
| pcDNA3.1 SARS-CoV-2 E | This publication | Addgene #158080 |
| pscALPSpuro | Addgene | Cat# 128504 |
| pscALPSpuro-HsACE2 (human) | This publication NP_001358344.1 | Addgene #158081 |
| pscALPSpuro-RsACE2 (Chinese rufous horseshoe bat) | This publication ACT66275 |
Addgene #159665 |
| pscALPSpuro-FcACE2 (Cat) | This publication XP_023104564.1 |
Addgene #158082 |
| pscALPSpuro-ClACE2 (Dog) | This publication NP_001158732.1 |
Addgene #158083 |
| pscALPSpuro-MjACE2 (Pangolin) | This publication XP_017505752 |
Addgene #158084 |
| pscALPSblasti-GFP | Addgene | Cat# 115804 |
| pCSDest TMPRSS2 | Addgene | Cat# 53887 |
| pscALPSblasti-TMPRSS2 Blasti | This publication | Addgene #158088 |
| HIV-1 pNL4-3 Δenv Δvpr luciferase reporter vector (pNL4-3.Luc.R-E-) | NIH AIDS Reagent Program, Division of AIDS, NIAID, NIH: from Dr. Nathaniel Landau | ARP Cat #3418 |
| pUC57mini NL4-3 Δenv eGFP | NIH AIDS Reagent Program, Division of AIDS, NIAID, NIH: this publication | ARP Cat #13906 |
| psPAX2 | Addgene | Cat #12260 |
| pMD2.G | Addgene | Cat# 12259 |
| pCAGGS-ACE2-his | This publication | Addgene #158089 |
| Software and Algorithms | ||
| FlowJo | FlowJo LLC; BD | N/A |
| Prism 8.4.3 | GraphPad | N/A |
| T200 Evaluation software v 3.1 | Biacore | N/A |
| Scrubber 2.0 | BioLogic Software | N/A |
| Coot | https://www2.mrc-lmb.cam.ac.uk/personal/pemsley/coot/ | Version 0.9 |
| PHENIX | https://www.phenix-online.org/ | Version 1.18.2 |
| MolProbity | http://molprobity.biochem.duke.edu/ | Version 4.5.1 |
| MAFFT v7.464 | Katoh and Standley, 2013 | https://mafft.cbrc.jp/alignment/software/ |
| Biopython v1.76 | Cock et al., 2009 | https://biopython.org/ |
| Matplotlib v3.2.2 | Hunter, 2007 | https://matplotlib.org/ |
| SnpEff v4.5covid19 | Cingolani et al., 2012 | http://snpeff.sourceforge.net/ |
| bcftools v1.9 | Li et al., 2009 | http://samtools.github.io/bcftools/bcftools.html |
| snp-sites v2.5.1 | Page et al., 2016 | https://sanger-pathogens.github.io/snp-sites/ |
| EPU 2 software for single particle analysis | Thermo Fisher Scientific | N/A |
| Other | ||
| Quantifoil Au grid | Quantifoil, Großlöbichau Germany | N/A |
| GloQube Plus Glow Discharge System | Quorumtech | N/A |
| Vitrobot Mark IV | Thermo Fisher Scientific | N/A |
| Krios Rx Cryo-transmission electron microscope with 300 kV fixed voltage | Thermo Fisher Scientific | N/A |
Resource Availability
Lead Contact
Further information and requests for resources and reagents should be directed to and will be fulfilled by the Lead Contact, Jeremy Luban (jeremy.luban@umassmed.edu).
Materials Availability
Plasmids: As itemized in the Key Resources Table with relevant repository code numbers, 15 plasmids were generated here using standard cloning methods. 14 of these plasmids have been deposited to Addgene (https://www.addgene.org/Jeremy_Luban/) and 1 plasmid has been deposited to the NIH AIDS Reagent Repository (https://www.aidsreagent.org; search under Jeremy Luban). Full plasmid sequences are available from the respective repositories. The remainder of the plasmids used here were previously described and are also listed with code numbers in the Key Resources Table.
Data and Code Availability
The script for analyzing and plotting D614G variant frequency is available via GitHub: https://github.com/broadinstitute/sc2-variation-scripts.
Coordinates for the CryoEM structures determined here have been deposited to PDB (6XS6) and EMDB (EMD-22301) databases.
Experimental Model and Subject Details
Cell culture
All cells used here were obtained from the American Type Culture Collection or ATCC (https://www.atcc.org). Cells were cultured in humidified incubators with 5% CO2 at 37°C, and monitored for mycoplasma contamination using the Mycoplasma Detection kit (Lonza LT07-318). HEK293 Homo sapiens, female, embryonic kidney cells (ATCC CRL-1573), and the HEK293T cells that were derived from them (CRL-3216 or CRL-11268), were cultured in DMEM supplemented with 10% heat-inactivated FBS, 1 mM sodium pyruvate, 20 mM GlutaMAX, 1 × MEM non-essential amino acids, and 25 mM HEPES, pH 7.2. Calu3 Homo sapiens, male, lung adenocarcinoma cells (ATCC HTB-55) were maintained in EMEM supplemented with 10% FBS. Caco2 Homo sapiens, male, colorectal adenocarcinoma cells (ATCC HTB-37) were maintained in EMEM supplemented with 20% FBS. SUP-T1 [VB] Homo sapiens, male, T cell lymphoblastic lymphoma cells (ATCC CRL-1942) were cultured in RPMI supplemented with 10% heat-inactivated FBS, 1mM sodium pyruvate, 20mM GlutaMAX, 1xMEM non-essential amino acids, and 25 mM HEPES, pH7.2. Vero Cercopithecus aethiops female kidney epithelial cells (ATCC CCL-81) were cultured in DMEM high glucose media containing 10% heat-inactivated fetal bovine serum, and 1X Penicillin/Streptomycin/L-Glutamine.
Virus production
24 h prior to transfection, 6 × 10⁵ HEK293 cells were plated per well in 6 well plates. All transfections used 2.49 μg plasmid DNA with 6.25 μL TransIT LT1 transfection reagent (Mirus, Madison, WI) in 250 μL Opti-MEM (GIBCO). Single-cycle HIV-1 vectors pseudotyped with SARS-CoV-2 Spike protein, either D614 or D614G, were produced by transfection of either HIV-1 pNL4-3 Δenv Δvpr luciferase reporter plasmid (pNL4-3.Luc.R-E-), or pUC57mini NL4-3 Δenv eGFP reporter plasmid, in combination with the indicated Spike expression plasmid, at a ratio of 4:1. ACE2 expression vectors were produced by transfecting cells with one of the pscALPSpuro-ACE2 plasmids, along with the HIV-1 gag-pol expression plasmid psPAX2, and the VSV glycoprotein expression plasmid pMD2.G (4:3:1 ratio of plasmids).. 16 h post-transfection, culture media was changed. Viral supernatant was harvested 48 h after media change, passed through a 0.45 μm filter, and stored at 4°C. TMPRSS2 expression transfer vector was produced similarly but with pscALPSblasti-TMPRSS2.
Method Details
Analysis of D614G frequency in the public database
The frequency of the SARS-CoV-2 D614G S protein variant in published genomic data was examined using the full Nextstrain-curated set of sequences available from GISAID as of 25 June 2020 (Hadfield et al., 2018; Shu and McCauley, 2017). Sequences were aligned to the ancestral reference sequence (NCBI GenBank accession NC_045512.2) using mafft v7.464 (Katoh and Standley, 2013) with the “–keeplength” and “–addfragments” parameters, which preserve the coordinate space of the reference sequence. To remove lower-quality sequences from the dataset, all sequences in the alignment were masked with ambiguous bases (‘N’) in the regions spanning the first 100bp and the last 50bp, as well as at error-prone sites located at the (1-indexed, NC_045512.2 coordinate space) positions 13402, 24389, 24390. Sequences shorter than 28kb or with > 2% ambiguous bases were removed from the alignment. The frequency of D614G was calculated in the resulting data by extracting the sequence region corresponding to the gene for the S protein, spanning 21563-25384bp. These sequences were processed using a script importing biopython (Cock et al., 2009) to remove any gaps introduced by the alignment process and translate the sequence to protein space. The identity of the variant at amino acid position 614 was tabulated for the full dataset and reported as frequency by date using the collection dates reported in the Nextstrain-curated metadata file available from GISAID (Hadfield et al., 2018; Shu and McCauley, 2017). The frequency was calculated as (# sequences with D614G)/(# sequences). Frequency within the six continental regions was calculated based on the “region” geographic classification associated with each sample in the metadata. Frequency values were linearly interpolated for dates surrounded by valid data. The frequency of the last date with data was carried forward where recent dates lack data. The resulting values were rendered as plots using matplotlib (Hunter, 2007). The script for analyzing and plotting D614G variant frequency is available via GitHub: https://github.com/broadinstitute/sc2-variation-scripts.
The diversity of SNPs and their functional effects based on the same GISAID sequences and MAFFT alignment used to plot the frequency of D614G over time, with the 5′ and 3′ ends not masked. In the alignment, ambiguous nucleotide codes (R,Y,W,S,M,K,H,B,V,D) were all masked with “N” values. SNPs were calculated from the alignment using the snp-sites tool (Page et al., 2016). The resulting VCF-format file was normalized using bcftools (Li et al., 2009) to include only SNPs. The VCF file with SNPs was annotated for functional effects using SnpEff (Cingolani et al., 2012).
Exogenous reverse transcriptase assay
5 μL transfection supernatant was mixed with 5 μL 0.25% Triton X-100, 50 mM KCl, 100 mM Tris-HCl pH 7.4, and 0.4 U/μL RiboLock RNase inhibitor, and then diluted 1:100 in 5 mM (NH4)2SO4, 20 mM KCl, and 20 mM Tris-HCl pH 8.3. 10 μL of this was then added to a single-step, RT-PCR assay with 35 nM MS2 RNA (IDT) as template, 500 nM of each primer (5′-TCCTGCTCAACTTCCTGTCGAG-3′ and 5′-CACAGGTCAAACCTCCTAGGAATG-3′), and 0.1 μL hot-start Taq DNA polymerase (Promega, Madison, WI) in 20 mM Tris-Cl pH 8.3, 5 mM (NH4)2SO4, 20 mM KCl, 5 mM MgCl2, 0.1 mg/mL BSA, 1/20,000 SYBR Green I (Invitrogen), and 200 μM dNTPs in total 20 μL reaction. The RT-PCR reaction was carried out in a Biorad CFX96 real-time PCR detection system with the following parameters: 42°C for 20 min, 95°C for 2 min, and 40 cycles [95°C for 5 s, 60°C for 5 s, 72°C for 15 s, and acquisition at 80°C for 5 s].
Generation of cell lines expressing ACE2 and TMPRSS2
2.5 × 10⁵ HEK293 cells were plated per well in a 12 well plate. The next day cells were transduced with 250 uL of supernatant containing TMPRSS2-encoding lentivirus for 16 h at 37°C, after which fresh media was added to cells. 48 h after transduction cells were replated and selected with blasticidin (InvivoGen, catalog #ant-bl-1) at 10 ug/mL. After selection, cells were transduced similarly with supernatant containing ACE2-encoding lentivirus and selected with 1 ug/mL of puromycin (InvivoGen, San Diego, CA, catalog #ant-pr-1).
1 × 10⁶ SupT1 cells were transduced with 400 uL of supernatant containing TMPRSS2-encoding virus followed by selection with 10 ug/mL blasticidin 48 h later. TMPRSS2 expressing SupT1 cells were then transduced with a second vector expressing ACE2, followed by puromycin selection at 1 ug/mL.
Virus Infectivity Assays
16 h prior to transduction, adherent cells were seeded in 96 well plates. HEK293 cells were plated at 5 × 10⁴ cells per well. Calu3 and Caco2 were plated at 3 × 10⁴ per well. Cells were incubated in virus-containing media for 16 h at 37°C when fresh medium was added to cells. 48 to 72 h after transduction cells were assessed for luciferase activity or for GFP by flow cytometry. For transfection of SupT1 cells, 1 × 10⁵ cells were plated in a U-bottom 96 well plate and spinfected at 30°C with 100 uL of virus-containing media for 2 h at 1,200 x g. Fresh media was added after spinfection and cells were incubated 48-72 h prior to analysis. Cells transduced with GFP virus were fixed with BD Cytofix (BD Biosciences, San Jose, CA, Cat number 554655) and analyzed using the Accuri C6system. Data was analyzed using FlowJo 10.5 (FlowJo, LLC, Ashland, OR). Cells transduced with luciferase expressing virus were assessed using Promega Steady-Glo system (Promega Madison, WI).
Neutralizations assays with human monoclonal antibodies targeting the SARS-CoV-2 S protein receptor binding domain
VSV-SARS-CoV-2-S pseudoparticle generation and neutralization assays were performed as previously described (Baum et al., 2020; Hansen et al., 2020). HEK293T cells were seeded overnight in DMEM high glucose media (Life Technologies) containing 10% heat-inactivated fetal bovine serum (Life Technologies), and Penicillin/- Streptomycin-L-Glutamine (Life Technologies). The following day, Spike expression plasmids were transfected with Lipofectamine LTX (Life Technologies) following the manufacturer’s protocol. At 24 h post transfection, the cells were washed with phosphate buffered saline (PBS) and infected at an MOI of 1 with the VSVΔG:mNeon/VSV-G virus diluted in 10 mL Opti-MEM (Life Technologies). The cells were incubated 1 h at 37°C with 5% CO2. Cells were washed three times with PBS to remove residual input virus and overlaid with DMEM high glucose media (Life Technologies) with 0.7% low IgG BSA (Sigma), sodium pyruvate (Life Technologies), and gentamicin (Life Technologies). After 24 h at 37°C with 5% CO2, the supernatant containing pseudoparticles was collected, centrifuged at 3,000 x g for 5 min to clarify, aliquoted, and frozen at −80°C.
For neutralization assays, Vero cells were seeded in 96-well plates 24 h prior to assay and grown to 85% confluence before challenge. Antibodies were diluted in DMEM high 3 glucose media containing 0.7% Low IgG BSA (Sigma), 1X Sodium Pyruvate, and 0.5% Gentamicin (this will be referred to as “Infection Media”) to 2X assay concentration and diluted 3-fold down in Infection Media, for an 11-point dilution curve in the assay beginning at 10 ug/mL (66.67 nM). pVSV-SARS-CoV-2-S pseudoparticles were diluted 1:1 in Infection Media for a fluorescent focus (ffu) count in the assay of ∼1000 ffu. Antibody dilutions were mixed 1:1 with pseudoparticles for 30 min at room temperature prior to addition onto Vero cells. Cells were incubated at 37°C, 5% CO2 for 24 h. Supernatant was removed from cells and replaced with 100 uL PBS, and fluorescent foci were quantitated using the SpectraMax i3 plate reader with MiniMax imaging cytometer.
Production of SARS-CoV-2 virus-like particles (VLPs)
HEK293T cells were cultured in DMEM supplemented with 10% heat-inactivated bovine serum, and transfected with pcDNA3.1 plasmids encoding the SARS-CoV-2 M, E, N, and S proteins, in different combinations, as indicated. 1 ug of each plasmid was used, with 5 ug of total plasmid in each transfection, normalized using empty vectors, in 400 ul Opti-MEM and 18 ul of PEI. The transfection mixture was incubated at room temperature for 15 min and dropped into a 50% confluent 10 cm plate of HEK293T cells. The media and cell lysate were collected after 60 h. 10 mL of supernatant was passed through a 0.45 um syringe filter, layered on top of a 20% sucrose cushion in PBS, and spun at 30,000 rpm in an SW41 rotor (111,000 x g, average) for two h. The pellet was washed once with ice cold PBS, resuspended in 150 ul of 2x SDS loading buffer (Morris formulation), and sonicated in an ice-water bath (Branson 2800) for 15 min. After removal of the supernatant, the transfected cells were lysed in 800 ul PBS with 1% Triton and protease inhibitor (Roche cOmplete EDTA-free tablets), and cleared of debris by spinning in a table-top centrifuge (Eppendorf 5424R) at top speed (20,000 x g, average) for 10 min.
Immunoblots of SARS-CoV-2 VLPs
Proteins in VLP and cell lysate samples were separated by SDS-PAGE, as follows: 20 ul of unboiled VLP and cell lysate samples on a 10%–20% Tris-Glycine gel to probe for the M protein; 2 ul of boiled cell lysate and 5 ul of boiled VLP samples on a 12% Tris-Glycine gel to probe for the N protein; 20 ul of boiled lysate and VLP samples on a 10% Tris-Glycine gel to probe for the S protein; 5 ul of boiled lysate on a 10% Tris-Glycine gel to probe for Raptor, as a loading control. Proteins were electro-transferred from the gels to PVDF membrane, which was blocked with 5% milk in Tris-Buffered Saline, pH 8.0, with 0.1% Tween-20, and detected with the indicated antibodies.
Surface plasmon resonance analysis
Binding kinetics and affinities for ACE2.Fc were assessed using surface plasmon resonance technology on a Biacore T200 instrument (GE Healthcare, Marlborough, MA) using a Series S CM5 sensor chip in filtered and degassed HBS-EP running buffer (10 mM HEPES, 150 mM NaCl, 3mM EDTA, 0.05% (v/v) polysorbate 20, pH 7.4). Capture sensor surfaces were prepared by covalently immobilizing with a mouse anti-human Fc mAb (REGN2567) on the chip surface using the standard amine coupling chemistry, reported previously (Johnsson et al., 1991). Following surface activation, the remaining active carboxyl groups on the CM5 chip surface were blocked by injecting 1 M ethanolamine, pH 8.0 for 7 min. A typical resonance unit (RU) signal of ∼12,000 RU was achieved after the immobilization procedure. At the end of each cycle, the anti-human Fc surface was regenerated using a 12 s injection of 20 mM phosphoric acid. Following the capture of the ACE2.Fc on the anti-human Fc mAb immobilized surface, 0.78 nM - 50 nM, two-fold serial dilutions, in duplicate, of soluble SARS-CoV-2 spike trimer protein, D614 or D614G, were injected for 3 min at a flow rate of 50 mL/min, with a 2 min dissociation phase in the running buffer. All specific SPR binding sensorgrams were double-reference subtracted as reported previously (Myszka, 1999) and the kinetic parameters were obtained by globally fitting the double-reference subtracted data to a 1:1 binding model with mass transport limitation using Biacore T200 Evaluation software v 3.1 (GE Healthcare). The dissociation rate constant (k d) was determined by fitting the change in the binding response during the dissociation phase and the association rate constant (k a) was determined by globally fitting analyte binding at different concentrations. The equilibrium dissociation constant (K D) was calculated from the ratio of the k d and k a. The dissociative half-life (t¾¾¾) in minutes was calculated as ln2/(k d ∗60). The steady state analysis was performed using Scrubber software and the K D value was determined.
Production and enrichment of soluble SARS-CoV-2 S Protein trimers
FreeStyle 293-F cells were cultured in SMM-293 TII serum-free media (SinoBiological) and maintained in a 37°C shaker with 8% CO2 and 80% humidity. 600 ug of plasmid encoding His-tagged SARS-CoV-2 S protein was transfected into 400 mL of 293 FreeStyle cells at 106 cells/mL, using 25 mL Opti-MEM and 1.8 mL PEI. 60 h later, the media was collected and applied to 3 mL of Ni-NTA resin (QIAGEN). The resin was collected and washed with PBS supplemented with 20 mM imidazole. Soluble S protein was eluted in PBS supplemented with 200 mM imidazole, and further enriched using a Superose 6 gel-filtration column (GE healthcare), in a buffer containing 25 mM NaHEPES (pH 7.4) and 150 mM NaCl. Yield was roughly 600 ug of soluble S protein homotrimer per liter of culture.
CryoEM sample preparation and data collection
3 μL of enriched D614G trimers, at 2.5 mg/mL, was deposited on an UltrAuFoil R1.2/1.3 300 mesh grid that had been glow discharged for 30 s in a GloQube Plus Glow Discharge System. Plunge freezing was performed with a Vitrobot Mark IV using a blot force 0 and 5 s blot time at 100% humidity and 4°C. Frozen grids were imaged with a Thermo Scientific KriosRx Cryo-Transmission Electron Microscope (Cryo-TEM) operated at a fixed 300 kV, and images were recorded with a Falcon 4 Direct Electron Detector. Movies were acquired using EPU 2 software. 10,264 micrographs were automatically collected with a defocus ranging between 0.6 and 1.8 μm, at a nominal magnification of 155,000x with a pixel size of 0.52Å. 7,653 micrographs were collected with a tilt-angle of 30° to overcome the preferred orientation. The dose rate was set at 20.3 electron/Å2/s and total exposure time was 1.81 s. With a dose fraction set at 62 frames, each movie series contained 62 frames and each frame received a dose of 0.6 electron/Å2.
CryoEM data processing
Movie frame alignment, estimation of microscope contrast-transfer function parameters, particle picking, 2D classification, and homogeneous refinement using the published structure EMD-21452 as initial model were carried out in cryoSPARC. Ensemble averaging of 266,356 particles resulted in a 3.7Å map with C3 symmetry imposed according to “gold standard” Fourier shell correlation of 0.143. Local resolution was estimated using cryoSPARC to extend from 3Å to 6 Å. Particle stacks with well-refined orientation parameters were imported in Relion3.1. Focused 3D classifications with a soft mask on the S1 subunit of the protomer were performed on the C3 symmetry expanded particles. Two monomer conformations, namely the closed state (a) and the open state (b) were identified after 3 rounds of classification. Four trimer classes were identified by 3D classification on the trimer particles: class_3a (13,555 particles), class_3b (51,600 particles), class_2a1b (96,029 particles), class_1a2b (105,118 particles). Homogeneous refinements were then performed on these 4 classes, with EMD-21452 as the initial model in Relion3.1. C3 symmetry was imposed on the refinement of particles from class_3a and class_3b; C1 symmetry was imposed on the refinement of particles from class_2a1b and class_1a2b. The final resolutions were class_1a2b with 4Å, class_2a1b with 3.9Å, class_3a with 4.2Å and class_3b with 3.9Å. The final map was deposited with the accession code EMD-22301.
Building and validation of structural models
Atomic models were prepared with Coot based on the resolved structure of D614 SARS-CoV-2 Spike (PDB: 6vxx and 6vsb). Real-space refinements were performed using PHENIX with secondary structure restraints. MolProbity was used to evaluate the geometries of the structural model. Corrected Fourier shell correlation curves were calculated using the refined atomic model and the cryo-EM density map. The coordinates were deposited with the accession code 6XS6. To validate the structural model, the following analysis was performed to validate the map resolution and prevent overfitting: (1) “Gold Standard” FSC curve (Figure S1E); (2) Docking previously resolved structures into the map and checking the appearance of expected structure elements; (3) Model-to-map (Figure S1G) and map-to-map FSC curves (Figure S1F). All the results validated the map and model.
Quantitation and Statistical Analysis
GraphPad Prism 8.4.3 was used to analyze the infectivity data using a ratio paired t test. In these experiments, all values shown are the mean with standard deviation, with the actual calculated two-tailed P value indicated on the figure.
Acknowledgments
We wish to thank Judith M. White; members of the Sabeti, Shen, and Luban labs; and the Thermo Fisher Scientific Workflow solutions team for invaluable discussions and technical assistance. This work was supported by NIH grants R37AI147868 and R01AI148784 to J.L., U19AI110818 to P.C.S., and 7DP2AI124384-02 to J.B.M., NCI K22CA241362 to K.S., a grant from the Evergrande COVID-19 Response Fund Award from the Massachusetts Consortium on Pathogen Readiness to J.L., a grant from the Worcester Foundation to K.S., a Sara Elizabeth O’Brien Fellowship Award/King Trust to L.Y., and a National Science Foundation Graduate Research Fellowship (Grant No. 1745303) to C.T.-T. A portion of this project has been funded in whole or in part with federal funds from the Department of Health and Human Services, Office of the Assistant Secretary for Preparedness and Response, Biomedical Advanced Research and Development Authority, under OT number: HHSO100201700020C.
Author Contributions
P.S., C.A.K., K.S., and J.L. conceived the experiments. C.T.-T., S.F.S., J.E.L., and P.C.S. analyzed the SARS-CoV-2 sequence data. L.Y., T.N., Y.W., W.E.D., A.D., C.A.K., K.S., and J.L. designed and cloned the expression plasmids. L.Y., C.C., A.D., K.E.P., and A.B. performed the virology experiments. L.Y., A.D., and K.S. performed the virus biochemistry. A.R. performed the SPR experiments. K.V., S.B.E., and K.S. purified the proteins. X.W., A.B., and N.D. collected and processed cryo-EM data. S.B.E. and K.S. built the structural model. L.Y., C.H.T.-T., S.F.S., C.A.K., A.B., A.R., J.B.M., K.S., and J.L. wrote and edited the manuscript with input from all authors.
Declaration of Interests
P.C.S. is a co-founder and shareholder of Sherlock Biosciences and a board member and shareholder of Danaher Corporation. J.E.L. consulted for Sherlock Biosciences. C.A.K., K.E.P., and A.B. are employed by Regeneron Pharmaceuticals and own stock options in the company. C.A.K. is an officer at Regeneron. X.W., A.B., and N.D. are employees of Thermo Fisher Scientific.
Published: September 15, 2020
References
- Andersen K.G., Rambaut A., Lipkin W.I., Holmes E.C., Garry R.F. The proximal origin of SARS-CoV-2. Nat. Med. 2020;26:450–452. doi: 10.1038/s41591-020-0820-9. [DOI] [PMC free article] [PubMed] [Google Scholar]
- Baum A., Fulton B.O., Wloga E., Copin R., Pascal K.E., Russo V., Giordano S., Lanza K., Negron N., Ni M. Antibody cocktail to SARS-CoV-2 spike protein prevents rapid mutational escape seen with individual antibodies. Science. 2020;369:1014–1018. doi: 10.1126/science.abd0831. [DOI] [PMC free article] [PubMed] [Google Scholar]
- Boni M.F., Lemey P., Jiang X., Lam T.T.-Y., Perry B.W., Castoe T.A., Rambaut A., Robertson D.L. Evolutionary origins of the SARS-CoV-2 sarbecovirus lineage responsible for the COVID-19 pandemic. Nat. Microbiol. 2020;2020:28. doi: 10.1038/s41564-020-0771-4. [DOI] [PubMed] [Google Scholar]
- Bos E.C., Luytjes W., van der Meulen H.V., Koerten H.K., Spaan W.J. The production of recombinant infectious DI-particles of a murine coronavirus in the absence of helper virus. Virology. 1996;218:52–60. doi: 10.1006/viro.1996.0165. [DOI] [PMC free article] [PubMed] [Google Scholar]
- Cingolani P., Platts A., Wang L., Coon M., Nguyen T., Wang L., Land S.J., Lu X., Ruden D.M. A program for annotating and predicting the effects of single nucleotide polymorphisms, SnpEff: SNPs in the genome of Drosophila melanogaster strain w1118; iso-2; iso-3. Fly (Austin) 2012;6:80–92. doi: 10.4161/fly.19695. [DOI] [PMC free article] [PubMed] [Google Scholar]
- Cock P.J.A., Antao T., Chang J.T., Chapman B.A., Cox C.J., Dalke A., Friedberg I., Hamelryck T., Kauff F., Wilczynski B., de Hoon M.J. Biopython: freely available Python tools for computational molecular biology and bioinformatics. Bioinformatics. 2009;25:1422–1423. doi: 10.1093/bioinformatics/btp163. [DOI] [PMC free article] [PubMed] [Google Scholar]
- Coronaviridae Study Group of the International Committee on Taxonomy of Viruses The species Severe acute respiratory syndrome-related coronavirus: classifying 2019-nCoV and naming it SARS-CoV-2. Nat. Microbiol. 2020;5:536–544. doi: 10.1038/s41564-020-0695-z. [DOI] [PMC free article] [PubMed] [Google Scholar]
- Denison M.R., Graham R.L., Donaldson E.F., Eckerle L.D., Baric R.S. Coronaviruses: an RNA proofreading machine regulates replication fidelity and diversity. RNA Biol. 2011;8:270–279. doi: 10.4161/rna.8.2.15013. [DOI] [PMC free article] [PubMed] [Google Scholar]
- Diehl W.E., Lin A.E., Grubaugh N.D., Carvalho L.M., Kim K., Kyawe P.P., McCauley S.M., Donnard E., Kucukural A., McDonel P. Ebola Virus Glycoprotein with Increased Infectivity Dominated the 2013-2016 Epidemic. Cell. 2016;167:1088–1098.e6. doi: 10.1016/j.cell.2016.10.014. [DOI] [PMC free article] [PubMed] [Google Scholar]
- Drosten C., Günther S., Preiser W., van der Werf S., Brodt H.-R., Becker S., Rabenau H., Panning M., Kolesnikova L., Fouchier R.A.M. Identification of a novel coronavirus in patients with severe acute respiratory syndrome. N. Engl. J. Med. 2003;348:1967–1976. doi: 10.1056/NEJMoa030747. [DOI] [PubMed] [Google Scholar]
- Furuyama T.N., Antoneli F., Isabel M.V., Briones M.R.S., Janini L.M.R. Temporal data series of COVID-19 epidemics in the USA, Asia and Europe suggests a selective sweep of SARS-CoV-2 Spike D614G variant. arXiv. 2020 2006.11609. [Google Scholar]
- Grubaugh N.D., Petrone M.E., Holmes E.C. We shouldn’t worry when a virus mutates during disease outbreaks. Nat. Microbiol. 2020;5:529–530. doi: 10.1038/s41564-020-0690-4. [DOI] [PMC free article] [PubMed] [Google Scholar]
- Gui M., Song W., Zhou H., Xu J., Chen S., Xiang Y., Wang X. Cryo-electron microscopy structures of the SARS-CoV spike glycoprotein reveal a prerequisite conformational state for receptor binding. Cell Res. 2017;27:119–129. doi: 10.1038/cr.2016.152. [DOI] [PMC free article] [PubMed] [Google Scholar]
- Hadfield J., Megill C., Bell S.M., Huddleston J., Potter B., Callender C., Sagulenko P., Bedford T., Neher R.A. Nextstrain: real-time tracking of pathogen evolution. Bioinformatics. 2018;34:4121–4123. doi: 10.1093/bioinformatics/bty407. [DOI] [PMC free article] [PubMed] [Google Scholar]
- Hansen J., Baum A., Pascal K.E., Russo V., Giordano S., Wloga E., Fulton B.O., Yan Y., Koon K., Patel K. Studies in humanized mice and convalescent humans yield a SARS-CoV-2 antibody cocktail. Science. 2020;369:1010–1014. doi: 10.1126/science.abd0827. [DOI] [PMC free article] [PubMed] [Google Scholar]
- Hoffmann M., Kleine-Weber H., Pöhlmann S. A Multibasic Cleavage Site in the Spike Protein of SARS-CoV-2 Is Essential for Infection of Human Lung Cells. Mol. Cell. 2020;78:779–784.e5. doi: 10.1016/j.molcel.2020.04.022. [DOI] [PMC free article] [PubMed] [Google Scholar]
- Holmes E.C. Error thresholds and the constraints to RNA virus evolution. Trends Microbiol. 2003;11:543–546. doi: 10.1016/j.tim.2003.10.006. [DOI] [PMC free article] [PubMed] [Google Scholar]
- Huang Y., Yang Z.-Y., Kong W.-P., Nabel G.J. Generation of synthetic severe acute respiratory syndrome coronavirus pseudoparticles: implications for assembly and vaccine production. J. Virol. 2004;78:12557–12565. doi: 10.1128/JVI.78.22.12557-12565.2004. [DOI] [PMC free article] [PubMed] [Google Scholar]
- Huang C., Wang Y., Li X., Ren L., Zhao J., Hu Y., Zhang L., Fan G., Xu J., Gu X. Clinical features of patients infected with 2019 novel coronavirus in Wuhan, China. Lancet. 2020;395:497–506. doi: 10.1016/S0140-6736(20)30183-5. [DOI] [PMC free article] [PubMed] [Google Scholar]
- Hunter J.D. Matplotlib: A 2D Graphics Environment. Comput. Sci. Eng. 2007;9:90–95. [Google Scholar]
- Johnsson B., Löfås S., Lindquist G. Immobilization of proteins to a carboxymethyldextran-modified gold surface for biospecific interaction analysis in surface plasmon resonance sensors. Anal. Biochem. 1991;198:268–277. doi: 10.1016/0003-2697(91)90424-r. [DOI] [PubMed] [Google Scholar]
- Katoh K., Standley D.M. MAFFT multiple sequence alignment software version 7: improvements in performance and usability. Mol. Biol. Evol. 2013;30:772–780. doi: 10.1093/molbev/mst010. [DOI] [PMC free article] [PubMed] [Google Scholar]
- Korber B., Fischer W.M., Gnanakaran S., Yoon H., Theiler J., Abfalterer W., Hengartner N., Giorgi E.E., Bhattacharya T., Foley B., Sheffield COVID-19 Genomics Group Tracking Changes in SARS-CoV-2 Spike: Evidence that D614G Increases Infectivity of the COVID-19 Virus. Cell. 2020;182:812–827.e19. doi: 10.1016/j.cell.2020.06.043. [DOI] [PMC free article] [PubMed] [Google Scholar]
- Ksiazek T.G., Erdman D., Goldsmith C.S., Zaki S.R., Peret T., Emery S., Tong S., Urbani C., Comer J.A., Lim W., SARS Working Group A novel coronavirus associated with severe acute respiratory syndrome. N. Engl. J. Med. 2003;348:1953–1966. doi: 10.1056/NEJMoa030781. [DOI] [PubMed] [Google Scholar]
- Lam T.T.-Y., Jia N., Zhang Y.-W., Shum M.H.-H., Jiang J.-F., Zhu H.-C., Tong Y.-G., Shi Y.-X., Ni X.-B., Liao Y.-S. Identifying SARS-CoV-2-related coronaviruses in Malayan pangolins. Nature. 2020;583:282–285. doi: 10.1038/s41586-020-2169-0. [DOI] [PubMed] [Google Scholar]
- Li H., Handsaker B., Wysoker A., Fennell T., Ruan J., Homer N., Marth G., Abecasis G., Durbin R., 1000 Genome Project Data Processing Subgroup The Sequence Alignment/Map format and SAMtools. Bioinformatics. 2009;25:2078–2079. doi: 10.1093/bioinformatics/btp352. [DOI] [PMC free article] [PubMed] [Google Scholar]
- Lu R., Zhao X., Li J., Niu P., Yang B., Wu H., Wang W., Song H., Huang B., Zhu N. Genomic characterisation and epidemiology of 2019 novel coronavirus: implications for virus origins and receptor binding. Lancet. 2020;395:565–574. doi: 10.1016/S0140-6736(20)30251-8. [DOI] [PMC free article] [PubMed] [Google Scholar]
- Marzi A., Chadinah S., Haddock E., Feldmann F., Arndt N., Martellaro C., Scott D.P., Hanley P.W., Nyenswah T.G., Sow S. Recently Identified Mutations in the Ebola Virus-Makona Genome Do Not Alter Pathogenicity in Animal Models. Cell Rep. 2018;23:1806–1816. doi: 10.1016/j.celrep.2018.04.027. [DOI] [PMC free article] [PubMed] [Google Scholar]
- McNamara R.P., Caro-Vegas C., Landis J.T., Moorad R., Pluta L.J., Eason A.B., Thompson C., Bailey A., Villamor F.C.S., Lange P.T. High-density amplicon sequencing identifies community spread and ongoing evolution of SARS-CoV-2 in the Southern United States. bioRxiv. 2020 doi: 10.1101/2020.06.19.161141. [DOI] [PMC free article] [PubMed] [Google Scholar]
- Myszka D.G. Improving biosensor analysis. J. Mol. Recognit. 1999;12:279–284. doi: 10.1002/(SICI)1099-1352(199909/10)12:5<279::AID-JMR473>3.0.CO;2-3. [DOI] [PubMed] [Google Scholar]
- Page A.J., Taylor B., Delaney A.J., Soares J., Seemann T., Keane J.A., Harris S.R. SNP-sites: rapid efficient extraction of SNPs from multi-FASTA alignments. Microb. Genom. 2016;2:e000056. doi: 10.1099/mgen.0.000056. [DOI] [PMC free article] [PubMed] [Google Scholar]
- Pallesen J., Wang N., Corbett K.S., Wrapp D., Kirchdoerfer R.N., Turner H.L., Cottrell C.A., Becker M.M., Wang L., Shi W. Immunogenicity and structures of a rationally designed prefusion MERS-CoV spike antigen. Proc. Natl. Acad. Sci. USA. 2017;114:E7348–E7357. doi: 10.1073/pnas.1707304114. [DOI] [PMC free article] [PubMed] [Google Scholar]
- Peters P.J., Bhattacharya J., Hibbitts S., Dittmar M.T., Simmons G., Bell J., Simmonds P., Clapham P.R. Biological analysis of human immunodeficiency virus type 1 R5 envelopes amplified from brain and lymph node tissues of AIDS patients with neuropathology reveals two distinct tropism phenotypes and identifies envelopes in the brain that confer an enhanced tropism and fusigenicity for macrophages. J. Virol. 2004;78:6915–6926. doi: 10.1128/JVI.78.13.6915-6926.2004. [DOI] [PMC free article] [PubMed] [Google Scholar]
- Quitadamo B., Peters P.J., Repik A., O’Connell O., Mou Z., Koch M., Somasundaran M., Brody R., Luzuriaga K., Wallace A. HIV-1 R5 macrophage-tropic envelope glycoprotein trimers bind CD4 with high affinity, while the CD4 binding site on non-macrophage-tropic, T-tropic R5 envelopes is occluded. J. Virol. 2018;92 doi: 10.1128/JVI.00841-17. e00841–e17. [DOI] [PMC free article] [PubMed] [Google Scholar]
- Ruedas J.B., Ladner J.T., Ettinger C.R., Gummuluru S., Palacios G., Connor J.H. Spontaneous Mutation at Amino Acid 544 of the Ebola Virus Glycoprotein Potentiates Virus Entry and Selection in Tissue Culture. J. Virol. 2017;91 doi: 10.1128/JVI.00392-17. e00392–e17. [DOI] [PMC free article] [PubMed] [Google Scholar]
- Saberi A., Gulyaeva A.A., Brubacher J.L., Newmark P.A., Gorbalenya A.E. A planarian nidovirus expands the limits of RNA genome size. PLoS Pathog. 2018;14:e1007314. doi: 10.1371/journal.ppat.1007314. [DOI] [PMC free article] [PubMed] [Google Scholar]
- Schnell G., Joseph S., Spudich S., Price R.W., Swanstrom R. HIV-1 replication in the central nervous system occurs in two distinct cell types. PLoS Pathog. 2011;7:e1002286. doi: 10.1371/journal.ppat.1002286. [DOI] [PMC free article] [PubMed] [Google Scholar]
- Shang J., Ye G., Shi K., Wan Y., Luo C., Aihara H., Geng Q., Auerbach A., Li F. Structural basis of receptor recognition by SARS-CoV-2. Nature. 2020;581:221–224. doi: 10.1038/s41586-020-2179-y. [DOI] [PMC free article] [PubMed] [Google Scholar]
- Shu Y., McCauley J. GISAID: Global initiative on sharing all influenza data - from vision to reality. Euro Surveill. 2017;22 doi: 10.2807/1560-7917.ES.2017.22.13.30494. ii–30494. [DOI] [PMC free article] [PubMed] [Google Scholar]
- Smith E.C., Blanc H., Surdel M.C., Vignuzzi M., Denison M.R. Coronaviruses lacking exoribonuclease activity are susceptible to lethal mutagenesis: evidence for proofreading and potential therapeutics. PLoS Pathog. 2013;9:e1003565. doi: 10.1371/journal.ppat.1003565. [DOI] [PMC free article] [PubMed] [Google Scholar]
- Smith E.C., Sexton N.R., Denison M.R. Thinking Outside the Triangle: Replication Fidelity of the Largest RNA Viruses. Annu. Rev. Virol. 2014;1:111–132. doi: 10.1146/annurev-virology-031413-085507. [DOI] [PubMed] [Google Scholar]
- Tortorici M.A., Veesler D. Structural insights into coronavirus entry. Adv. Virus Res. 2019;105:93–116. doi: 10.1016/bs.aivir.2019.08.002. [DOI] [PMC free article] [PubMed] [Google Scholar]
- Urbanowicz R.A., McClure C.P., Sakuntabhai A., Sall A.A., Kobinger G., Müller M.A., Holmes E.C., Rey F.A., Simon-Loriere E., Ball J.K. Human Adaptation of Ebola Virus during the West African Outbreak. Cell. 2016;167:1079–1087.e5. doi: 10.1016/j.cell.2016.10.013. [DOI] [PMC free article] [PubMed] [Google Scholar]
- Vennema H., Godeke G.J., Rossen J.W., Voorhout W.F., Horzinek M.C., Opstelten D.J., Rottier P.J. Nucleocapsid-independent assembly of coronavirus-like particles by co-expression of viral envelope protein genes. EMBO J. 1996;15:2020–2028. doi: 10.1002/j.1460-2075.1996.tb00553.x. [DOI] [PMC free article] [PubMed] [Google Scholar]
- Volz E.M., Hill V., McCrone J.T., Price A., Jorgensen D., O’Toole A., Southgate J.A., Johnson R., Jackson B., Nascimento F.F. Evaluating the effects of SARS-CoV-2 Spike mutation D614G on transmissibility and pathogenicity. medRxiv. 2020 doi: 10.1101/2020.07.31.20166082. [DOI] [PMC free article] [PubMed] [Google Scholar]
- Wagner C., Roychoudhury P., Hadfield J., Hodcroft E.B., Lee J., Moncla L.H., Müller N.F., Behrens C., Huang M.L., Mathias P. 2020. Comparing viral load and clinical outcomes in Washington State across D614G mutation in spike protein of SARS-CoV-2. Github.https://github.com/blab/ncov-wa-d614g [Google Scholar]
- Walls A.C., Xiong X., Park Y.-J., Tortorici M.A., Snijder J., Quispe J., Cameroni E., Gopal R., Dai M., Lanzavecchia A. Unexpected Receptor Functional Mimicry Elucidates Activation of Coronavirus Fusion. Cell. 2019;176:1026–1039.e15. doi: 10.1016/j.cell.2018.12.028. [DOI] [PMC free article] [PubMed] [Google Scholar]
- Walls A.C., Park Y.-J., Tortorici M.A., Wall A., McGuire A.T., Veesler D. Structure, Function, and Antigenicity of the SARS-CoV-2 Spike Glycoprotein. Cell. 2020;181:281–292.e6. doi: 10.1016/j.cell.2020.02.058. [DOI] [PMC free article] [PubMed] [Google Scholar]
- Wang M.K., Lim S.-Y., Lee S.M., Cunningham J.M. Biochemical Basis for Increased Activity of Ebola Glycoprotein in the 2013-16 Epidemic. Cell Host Microbe. 2017;21:367–375. doi: 10.1016/j.chom.2017.02.002. [DOI] [PMC free article] [PubMed] [Google Scholar]
- Wrapp D., Wang N., Corbett K.S., Goldsmith J.A., Hsieh C.-L., Abiona O., Graham B.S., McLellan J.S. Cryo-EM structure of the 2019-nCoV spike in the prefusion conformation. Science. 2020;367:1260–1263. doi: 10.1126/science.abb2507. [DOI] [PMC free article] [PubMed] [Google Scholar]
- Wu A., Peng Y., Huang B., Ding X., Wang X., Niu P., Meng J., Zhu Z., Zhang Z., Wang J. Genome Composition and Divergence of the Novel Coronavirus (2019-nCoV) Originating in China. Cell Host Microbe. 2020;27:325–328. doi: 10.1016/j.chom.2020.02.001. [DOI] [PMC free article] [PubMed] [Google Scholar]
- Wu F., Zhao S., Yu B., Chen Y.-M., Wang W., Song Z.-G., Hu Y., Tao Z.-W., Tian J.-H., Pei Y.-Y. A new coronavirus associated with human respiratory disease in China. Nature. 2020;579:265–269. doi: 10.1038/s41586-020-2008-3. [DOI] [PMC free article] [PubMed] [Google Scholar]
- Yan R., Zhang Y., Li Y., Xia L., Guo Y., Zhou Q. Structural basis for the recognition of SARS-CoV-2 by full-length human ACE2. Science. 2020;367:1444–1448. doi: 10.1126/science.abb2762. [DOI] [PMC free article] [PubMed] [Google Scholar]
- Yuan Y., Cao D., Zhang Y., Ma J., Qi J., Wang Q., Lu G., Wu Y., Yan J., Shi Y. Cryo-EM structures of MERS-CoV and SARS-CoV spike glycoproteins reveal the dynamic receptor binding domains. Nat. Commun. 2017;8:15092. doi: 10.1038/ncomms15092. [DOI] [PMC free article] [PubMed] [Google Scholar]
- Zaki A.M., van Boheemen S., Bestebroer T.M., Osterhaus A.D.M.E., Fouchier R.A.M. Isolation of a novel coronavirus from a man with pneumonia in Saudi Arabia. N. Engl. J. Med. 2012;367:1814–1820. doi: 10.1056/NEJMoa1211721. [DOI] [PubMed] [Google Scholar]
- Zhang L., Jackson C.B., Mou H., Ojha A., Rangarajan E.S., Izard T., Farzan M., Choe H. The D614G mutation in the SARS-CoV-2 spike protein reduces S1 shedding and increases infectivity. bioRxiv. 2020 doi: 10.1101/2020.06.12.148726. 2020.06.12.148726. [DOI] [Google Scholar]
- Zhou H., Chen X., Hu T., Li J., Song H., Liu Y., Wang P., Liu D., Yang J., Holmes E.C. A Novel Bat Coronavirus Closely Related to SARS-CoV-2 Contains Natural Insertions at the S1/S2 Cleavage Site of the Spike Protein. Curr. Biol. 2020;30:2196–2203.e3. doi: 10.1016/j.cub.2020.05.023. [DOI] [PMC free article] [PubMed] [Google Scholar]
- Zhou P., Yang X.-L., Wang X.-G., Hu B., Zhang L., Zhang W., Si H.-R., Zhu Y., Li B., Huang C.-L. A pneumonia outbreak associated with a new coronavirus of probable bat origin. Nature. 2020;579:270–273. doi: 10.1038/s41586-020-2012-7. [DOI] [PMC free article] [PubMed] [Google Scholar]
- Zhu N., Zhang D., Wang W., Li X., Yang B., Song J., Zhao X., Huang B., Shi W., Lu R., China Novel Coronavirus Investigating and Research Team A Novel Coronavirus from Patients with Pneumonia in China, 2019. N. Engl. J. Med. 2020;382:727–733. doi: 10.1056/NEJMoa2001017. [DOI] [PMC free article] [PubMed] [Google Scholar]
Associated Data
This section collects any data citations, data availability statements, or supplementary materials included in this article.
Data Availability Statement
The script for analyzing and plotting D614G variant frequency is available via GitHub: https://github.com/broadinstitute/sc2-variation-scripts.
Coordinates for the CryoEM structures determined here have been deposited to PDB (6XS6) and EMDB (EMD-22301) databases.