

Abstract
Patients with cancer may be at increased risk of severe coronavirus disease 2019 (COVID-19), but the role of viral load on this risk is unknown. We measured SARS-CoV-2 viral load using cycle threshold (CT) values from reverse-transcription polymerase chain reaction assays applied to nasopharyngeal swab specimens in 100 patients with cancer and 2,914 without cancer who were admitted to three New York City hospitals. Overall, the in-hospital mortality rate was 38.8% among patients with a high viral load, 24.1% among patients with a medium viral load, and 15.3% among patients with a low viral load (p < 0.001). Similar findings were observed in patients with cancer (high, 45.2% mortality; medium, 28.0%; low, 12.1%; p = 0.008). Patients with hematologic malignancies had higher median viral loads (CT = 25.0) than patients without cancer (CT = 29.2; p = 0.0039). SARS-CoV-2 viral load results may offer vital prognostic information for patients with and without cancer who are hospitalized with COVID-19.
Keywords: cancer, coronavirus disease 2019 (COVID-19), cycle threshold (CT), hematologic malignancy, mortality, severe acute respiratory syndrome coronavirus 2 (SARS-CoV-2), solid tumor, viral load
Graphical Abstract
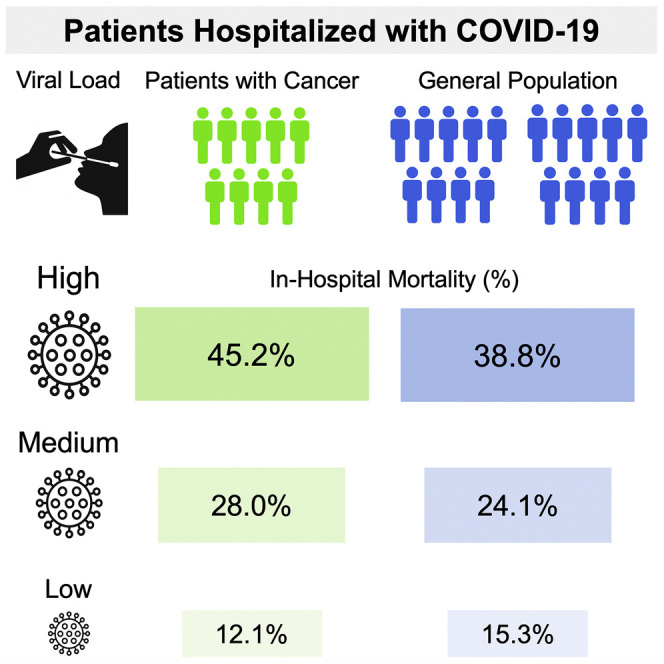
Westblade et al. reveal that admission viral load independently predicts mortality in hospitalized patients with and without cancer who have COVID-19, and that patients with hematologic malignancies have higher admission viral loads than patients with solid tumors or without cancer. Providing viral load information to clinicians may guide the care of hospitalized patients with COVID-19.
Introduction
Severe acute respiratory syndrome coronavirus 2 (SARS-CoV-2) has caused a devastating pandemic of coronavirus disease 2019 (COVID-19), leading to more than 26 million infections and nearly 900,000 deaths in 8 months (World Health Organization, 2020). Initial reports indicated that patients with cancer may be more likely to develop severe COVID-19 than patients without cancer (Dai et al., 2020; Deng et al., 2020; Liang et al., 2020; Mehta et al., 2020; Tian et al., 2020). Subsequent studies identified that older age, male sex, smoking status, and comorbidities, such as hypertension and cardiovascular disease are risk factors for severe disease and mortality among patients with cancer and COVID-19; whereas, the impact of specific cancer therapies remains unclear (Kuderer et al., 2020; Lee et al., 2020b; Mehta et al., 2020; Robilotti et al., 2020). We previously reported that high SARS-CoV-2 viral load upon presentation to the emergency department (ED) was independently associated with in-hospital mortality among the general inpatient population (Magleby et al., 2020); however, the impact of admission viral load on outcomes of patients with cancer who are hospitalized with COVID-19 is unknown. Furthermore, our initial report characterized the relationship between admission viral load and in-hospital mortality using only a single reverse-transcription polymerase chain reaction (RT-PCR) assay (cobas SARS-CoV-2 assay, Roche Molecular Systems, Inc., Branchburg, NJ).
To expand upon our initial report and investigate the relationship between admission viral load and in-hospital mortality in patients with cancer, we conducted an observational cohort study of patients admitted to three New York City (NYC) hospitals during the height of the NYC COVID-19 pandemic from March 15 to May 14, 2020. We compared clinical presentations and outcomes of patients with and without cancer and compared admission SARS-CoV-2 viral loads among patients with solid tumors, with hematologic malignancies, and without cancer. Viral loads were measured through surrogate markers of cycle threshold (CT) values for SARS-CoV-2-specific gene targets using RT-PCR assays applied to nasopharyngeal swab specimens. We also assessed the relationships between admission viral load and in-hospital mortality using two different RT-PCR assays: cobas SARS-CoV-2 (cobas) and Xpert Xpress SARS-CoV-2 (Xpert Xpress; Cepheid, Inc., Sunnyvale, CA).
Results
Patients with Active Cancer Had Different Comorbid Illnesses and Clinical Presentations, but Similar Outcomes Compared with Patients without Cancer
Among 4,342 patients who presented to the ED at the three study hospitals, 3,014 (69.4%) were eligible for inclusion in this study (Figure 1 ). The median age of the entire cohort was 65 years (interquartile range [IQR] = 53–77), 43.6% of patients were female, and 78.1% were non-white. Characteristics of the 100 patients with active cancer and the 2,914 patients without active cancer who were hospitalized with COVID-19 are presented in Table 1 . Patients with cancer were more likely to be non-Hispanic white (42.0% versus 21.2%; p < 0.001), be former smokers (29.0% versus 16.5%; p = 0.001), have coronary artery disease (25.0% versus 14.8%; p = 0.004), and have congestive heart failure (14.0% versus 6.2%; p = 0.002) than patients without cancer. Fever, cough, dyspnea, headache, and myalgias were significantly less common upon admission among patients with cancer than those without cancer. Laboratory parameters were generally similar between groups, but patients with cancer were less likely to have increased aspartate aminotransferase levels and had higher procalcitonin levels than patients without cancer. A similar proportion of patients with cancer required supplemental oxygen upon presentation to the hospital, but patients with cancer were less likely to have bilateral infiltrates on chest X-ray than patients without cancer (62.0% versus 72.9%; p = 0.016).
Figure 1.

Flow Diagram of Patients Included in the Study and Reasons for Exclusion
Table 1.
Patient Characteristics, Presentations, and Outcomes of Patients with and without Active Cancer Who Were Hospitalized with COVID-19
| Variable | Active Cancer (n = 100) | No Active Cancer (n = 2,914) | p Value |
|---|---|---|---|
| Demographics | |||
| Age | 72 (66–80) | 65 (53–77) | 0.09 |
| Female | 47 (47.0) | 1,230 (42.2) | 0.34 |
| Race/ethnicity | |||
| White (non-Hispanic) | 42 (42.0) | 619 (21.2) | <0.001 |
| Black (non-Hispanic) | 14 (14.0) | 303 (10.4) | 0.25 |
| Asian (non-Hispanic) | 15 (15.0) | 600 (20.6) | 0.17 |
| Hispanic | 23 (23.0) | 1,055 (36.2) | 0.007 |
| Other (or missing data) | 6 (6.0) | 337 (11.6) | 0.09 |
| Comorbidities | |||
| Obesitya (BMI > 30; n = 2,832) | 28 (28.3) | 891 (32.6) | 0.11 |
| Coronary artery disease | 25 (25.0) | 422 (14.8) | 0.004 |
| Congestive heart failure | 14 (14.0) | 180 (6.2) | 0.002 |
| Diabetes mellitus | 33 (33.0) | 935 (32.1) | 0.85 |
| Hypertension | 48 (48.0) | 1,232 (42.3) | 0.26 |
| Chronic pulmonary disease | 21 (21.0) | 450 (15.4) | 0.13 |
| Chronic kidney disease | 8 (8.0) | 270 (9.3) | 0.67 |
| Cirrhosis | 2 (2.0) | 26 (0.9) | 0.24 |
| HIV infection | 0 | 28 (1.0) | 1.00 |
| Solid organ transplant | 3 (3.0) | 47 (1.6) | 0.23 |
| Inflammatory bowel disease | 1 (1.0) | 7 (0.2) | 0.24 |
| Rheumatic disease | 2 (2.0) | 94 (3.2) | 0.77 |
| Home Medications | |||
| Inhaled or nasal steroid | 4 (4.0) | 137 (4.7) | 1.00 |
| Oral steroid | 5 (5.0) | 99 (3.4) | 0.39 |
| Calcineurin inhibitor | 1 (1.0) | 43 (1.5) | 1.00 |
| Mycophenolate | 1 (1.0) | 46 (1.6) | 1.00 |
| Social Characteristics | |||
| Active smoker | 2 (2.0) | 88 (3.0) | 0.77 |
| Former smoker | 29 (29.0) | 485 (16.5) | 0.001 |
| Recent international travel | 0 | 24 (0.8) | 1.00 |
| Known exposure to COVID-19-positive patient | 15 (15.0) | 411 (14.1) | 0.80 |
| Healthcare worker | 1 (1.0) | 74 (2.5) | 0.52 |
| Undomiciled | 3 (3.0) | 43 (1.5) | 0.20 |
| Nursing home/rehabilitation facility resident | 15 (15.0) | 383 (13.1) | 0.59 |
| Symptoms | |||
| Fever | 55 (55.0) | 1,916 (65.8) | 0.026 |
| Cough | 57 (57.0) | 1,982 (68.0) | 0.021 |
| Dyspnea | 55 (55.0) | 1,929 (66.2) | 0.020 |
| Headache | 2 (2.0) | 242 (8.3) | 0.023 |
| Myalgias | 11 (11.0) | 592 (20.3) | 0.022 |
| Nausea or vomiting | 13 (13.0) | 490 (16.8) | 0.31 |
| Diarrhea | 20 (20.0) | 699 (24.0) | 0.36 |
| Altered mental status | 16 (16.0) | 370 (12.7) | 0.33 |
| Days of symptoms before ED presentationa (n = 2,602) | 5 (2–9) | 7 (3–10) | 0.08 |
| ED Presentation | |||
| Relationship to apex of COVID-19 infections in New York City | <0.001 | ||
| Pre-apex (March 15–29) | 13 (13.0) | 727 (25.0) | |
| Apex (March 30–April 8) | 30 (30.0) | 1,162 (39.9) | |
| Post-apex (April 9–May 14) | 57 (57.0) | 1,025 (35.2) | |
| Hospital | <0.001 | ||
| NYP/Queens | 32 (32.0) | 1,796 (61.6) | |
| NYP/WCMC | 51 (51.0) | 718 (24.6) | |
| NYP/LMH | 16 (16.0) | 390 (13.4) | |
| Need for supplemental oxygen within 3 h of ED presentation | 64 (64.0) | 1,794 (61.6) | 0.62 |
| Laboratory findings | |||
| Leukocytosisa: WBC > 11 × 109 cells/L (n = 2,963) | 18 (18.2) | 574 (20.0) | 0.65 |
| Lymphopeniaa: ALC < 1 × 10⁹ cells/L (n = 2,550) | 50 (53.2) | 1,297 (52.7) | 0.93 |
| AST elevationa,b (n = 2,794) | 43 (44.8) | 1,676 (62.1) | 0.001 |
| ALT elevationa,c (n = 2,793) | 17 (17.4) | 635 (23.6) | 0.15 |
| Troponin I > 0.5 ng/mLa (n = 1,052) | 5 (8.9) | 48 (4.8) | 0.20 |
| Inflammatory markers | |||
| Procalcitonina, ng/mL (n = 2,773) | 0.24 (0.12–0.76) | 0.18 (0.08–0.47) | 0.012 |
| Ferritina, ng/mL (n = 1,786) | 656 (335–1,592) | 808 (395–1,511) | 0.57 |
| C-Reactive proteina, mg/dL (n = 1,783) | 11.3 (5.4–19.2) | 10.5 (5.4–17.5) | 0.40 |
| Initial chest radiograph findings | |||
| Clear | 16 (16.0) | 261 (9.0) | 0.017 |
| Unilateral infiltrates | 14 (14.0) | 303 (10.4) | 0.25 |
| Bilateral infiltrates | 62 (62.0) | 2,125 (72.9) | 0.016 |
| SARS-CoV-2 PCR assay | 0.28 | ||
| cobas SARS-CoV-2 | 54 (54.0) | 1,731 (59.4) | |
| Xpert Xpress SARS-CoV-2 | 46 (46.0) | 1,183 (40.6) | |
| Outcomes | |||
| Intubation | 15 (15.0) | 544 (18.7) | 0.35 |
| Need for vasopressors | 15 (15.0) | 510 (17.5) | 0.52 |
| In-hospital mortality | 30 (30.0) | 725 (24.9) | 0.25 |
Values are expressed as number (percentage of total) or as median (interquartile range). Bold p values indicate those that meet statistical significance.
Abbreviations: ALC, absolute lymphocyte count; ALT, alanine aminotransferase; AST, aspartate aminotransferase; BMI, body mass index; ED, emergency department; HIV, human immunodeficiency virus; IQR, interquartile range; LMH, Lower Manhattan Hospital; NYP, NewYork-Presbyterian Hospital; WBC, white blood cell count; WCMC, Weill Cornell Medical Center.
This variable was not assessed in all participants. The denominator is listed next to the variable.
AST elevation indicates a value > 34 units/L.
ALT elevation indicates a value > 55 units/L.
There were no statistically significant differences in the risk of intubation, need for vasopressors, or in-hospital mortality between patients with and without cancer, although the numerical mortality rate was higher in patients with cancer (30.0% in patients with solid tumors [18/60] and hematologic malignancies [12/40] versus 24.9% [725/2,914] in patients without cancer; p = 0.25).
Patients with Hematologic Malignancies Had Higher SARS-CoV-2 Viral Loads Than Patients without Cancer, Particularly Those Receiving Chemotherapy or Targeted Therapy
The median admission CT value for the SARS-CoV-2-specific gene target (cobas, ORF1ab; Xpert Xpress, N2) was 25.0 (IQR = 20.2–31.3) in patients with hematologic malignancies, compared with a median CT value of 29.2 (IQR = 24.5–33.1; p = 0.0039) in patients without active cancer and compared with a median CT value of 28.4 (IQR = 22.6–34.5; p = 0.08) in patients with solid tumors (Figure 2A), indicating that patients with hematologic malignancies had the highest viral loads. Patients with hematologic malignancies had lower CT values (i.e., higher viral load) using both the cobas and Xpert Xpress assays (Figure S1). Patients with hematologic malignancies had a median of 7 days of symptoms before ED presentation, compared with a median of 5 days in patients with solid tumors, and 7 days in patients without cancer. Thus, the higher viral loads observed in patients with hematologic malignancies were not due to earlier presentations during the course of their illness.
Figure 2.

Admission SARS-CoV-2 CT Values in Patients with Solid Tumors, with Hematologic Malignancies, and without Active Cancer
(A) These CT values are of the SARS-CoV-2-specific gene target (ORF1ab or N2) derived from nasopharyngeal swab specimens obtained upon admission to the hospital, stratified by whether the patient had no active cancer, a solid tumor, or a hematologic malignancy; (B) SARS-CoV-2-specific gene target CT values displayed by type of cancer. The most common other solid tumors were thoracic (n = 5) and gynecologic (n = 4), and the most common other hematologic malignancies were lymphoma (n = 6) and acute leukemia (n = 4); (C) SARS-CoV-2-specific gene target CT values among patients with solid tumors and hematologic malignancies who received chemotherapy or targeted therapies and among those who did not receive these therapies. Median values are represented by horizontal lines and boxes represent 25th–75th percentiles. The Wilcoxon rank-sum test was used for viral load comparisons with two-sided p values.
Among patients with hematologic malignancies, median CT values were similar among patients with chronic leukemia, myeloma, and other hematologic malignancies (Figure 2B), but patients who had received chemotherapy or targeted therapy within the previous 6 months had lower median CT values than those who had not (22.6 versus 28.8; p = 0.032; Figure 2C). In contrast, patients with solid tumors who had recently received chemotherapy or targeted therapy had similar median CT values to those who had not (28.1 versus 28.9; p = 0.96). Notably, patients with hematologic malignancies and patients with solid tumors who had recently received chemotherapy or targeted therapy had a median of 3 days of symptoms before ED presentation, compared with 7 days in patients with hematologic malignancies who had not received these therapies and 5 days in patients with solid tumors who had not received these therapies. The most common classes of chemotherapy received in patients with hematologic malignancies were antimetabolite drugs (n = 6), thalidomide derivatives (n = 6), proteasome inhibitors (n = 5), and alkylating agents (n = 4). An additional seven patients received monoclonal antibodies, five received ibrutinib, three received venetoclax, and two were hematopoietic stem cell transplant recipients.
For data generated using the cobas assay, we used viral load cutoffs based on CT values for the ORF1ab gene target that were previously shown to correlate with in-hospital mortality among hospitalized patients with COVID-19: high, CT value < 25; medium, CT value 25–30; low, CT value > 30 (Magleby et al., 2020). For data generated using the Xpert Xpress assay, we established different cutoffs based on CT values for the N2 gene target that are approximately two cycles higher than CT values for the cobas ORF1ab target (Smithgall et al., 2020): high, CT value < 27; medium, CT value 27–32; low, CT value > 32.
Using these cutoffs, 21 (52.5%) of 40 patients with hematologic malignancies presented with a high viral load upon admission, compared with 21 (35.0%) of 60 patients with a solid tumor (p = 0.08) and compared with 30.9% of patients without cancer (p = 0.003). The presence of a hematologic malignancy was independently associated with having a high viral load upon admission (adjusted odds ratio [aOR] = 2.52; 95% confidence interval [CI], 1.30–4.88; p = 0.006; Table 2 ) compared with patients without cancer, even after adjusting for potential confounders. In contrast, having a solid tumor was not associated with having a high viral load in univariate or multivariate analyses compared with patients without cancer. The association between the presence of a hematologic malignancy and a high viral load was also observed in an additional multivariate model that adjusted for duration of symptoms (Table S1). A secondary analysis using the same cutoff (CT value < 25) to define high viral load for both the cobas and Xpert Xpress assays also demonstrated that the presence of a hematologic malignancy, but not solid tumor, was associated with a high admission viral load (aOR = 2.90; 95% CI, 1.48–5.69; p = 0.002; Table S2).
Table 2.
Factors Associated with High SARS-CoV-2 Viral Load (cobas SARS-CoV-2 Assay, CT < 25; Xpert Xpress SARS-CoV-2 Assay, CT < 27) on Admission
| Variable | Univariate Model: Unadjusted OR (95% CI) | p Value | Multivariate Model: Adjusted OR (95% CI) | p Value |
|---|---|---|---|---|
| Cancer Status | ||||
| No active cancer | Reference | Reference | ||
| Solid tumor | 1.21 (0.71–2.06) | 0.49 | 0.96 (0.54–1.69) | 0.88 |
| Hematologic malignancy | 2.48 (1.33–4.63) | 0.004 | 2.52 (1.30–4.88)b | 0.006 |
| Demographics | ||||
| Age, per year increase | 1.03 (1.02–1.03) | <0.001 | 1.02 (1.02–1.03) | <0.001 |
| Female | 1.03 (0.88–1.21) | 0.67 | ||
| Race/ethnicity | ||||
| White (non-Hispanic) | Reference | Reference | ||
| Black (non-Hispanic) | 0.71 (0.53–0.95) | 0.019 | 0.76 (0.56–1.04) | 0.09 |
| Asian (non-Hispanic) | 1.04 (0.83–1.30) | 0.74 | 1.17 (0.91–1.49) | 0.23 |
| Hispanic | 0.49 (0.40–0.61) | <0.001 | 0.70 (0.56–0.89) | 0.004 |
| Other or missing | 0.64 (0.48–0.84) | 0.002 | 0.88 (0.65–1.19) | 0.41 |
| Comorbidities | ||||
| Obesity (BMI > 30: n = 2,832)a | 0.79 (0.66–0.94) | 0.007 | ||
| Coronary artery diseasea | 1.71 (1.39–2.10) | <0.001 | ||
| Congestive heart failure | 2.39 (1.79–3.21) | <0.001 | 1.46 (1.06–2.00) | 0.019 |
| Diabetes mellitus | 1.64 (1.40–1.93) | <0.001 | 1.68 (1.32–2.14) | <0.001 |
| Hypertension | 1.54 (1.32–1.79) | <0.001 | 0.78 (0.61–0.99) | 0.042 |
| Chronic pulmonary diseasea | 1.53 (1.25–1.87) | <0.001 | ||
| Chronic kidney disease | 2.41 (1.88–3.09) | <0.001 | 2.00 (1.53–2.62) | <0.001 |
| Cirrhosis | 0.73 (0.31–1.73) | 0.48 | ||
| HIV infection | 0.88 (0.39–2.01) | 0.76 | ||
| Solid organ transplanta | 1.90 (0.99–3.07) | 0.052 | ||
| Inflammatory bowel disease | 2.21 (0.55–8.85) | 0.26 | ||
| Rheumatic disease | 1.16 (0.76–1.78) | 0.50 | ||
| Home medications | ||||
| Inhaled or nasal steroid | 1.89 (1.35–2.66) | <0.001 | 1.64 (1.14–2.36) | 0.007 |
| Oral steroid | 1.86 (1.25–2.76) | 0.002 | 1.62 (1.06–2.48) | 0.025 |
| Calcineurin inhibitora | 1.85 (1.02–3.37) | 0.043 | ||
| Mycophenolatea | 1.96 (1.10–3.50) | 0.022 | ||
| Social Characteristics | ||||
| Active smoker | 1.16 (0.75–1.81) | 0.50 | ||
| Former smokera | 1.34 (1.10–1.63) | 0.004 | ||
| Recent international travel | 0.91 (0.37–2.19) | 0.83 | ||
| Known exposure to COVID-positive patient | 0.99 (0.79–1.23) | 0.91 | ||
| Healthcare worker | 0.91 (0.55–1.51) | 0.72 | ||
| Undomiciled | 1.30 (0.71–2.37) | 0.40 | ||
| Nursing home/rehabilitation facility resident | 2.06 (1.66–2.55) | <0.001 | 1.47 (1.15–1.87) | 0.002 |
| Duration of symptoms before admission, per dayb | 1.00 (1.00–1.00) | 0.57 | ||
| ED Presentation | ||||
| Relationship to apex of COVID-19 in New York City | ||||
| Pre-apex (March 15–29) | 1.25 (1.03–1.52) | 0.025 | 1.60 (1.28–1.99) | <0.001 |
| Apex (March 30–April 8) | Reference | Reference | ||
| Post-apex (April 9–May 14) | 0.92 (0.77–1.10) | 0.38 | 0.76 (0.63–0.92) | 0.006 |
| Hospital | ||||
| NYP/Queens | Reference | Reference | ||
| NYP/WCMC | 1.09 (0.91–1.31) | 0.33 | 1.27 (1.02–1.59) | 0.035 |
| NYP/LMH | 1.81 (1.45–2.25) | <0.001 | 1.67 (1.30–2.13) | <0.001 |
| cobas SARS-CoV-2 assay (versus Xpert Xpress assay)a | 1.23 (1.05–1.44) | <0.001 | ||
High viral load is designated as having a CT value < 25 using the cobas SARS-CoV-2-specific gene target (ORF1ab) and a CT value < 27 using the Xpert Xpress SARS-CoV-2 assay-specific gene target (N2). The different definitions were derived from published data that indicate CT values for the Xpert Xpress assay (N2 gene) are approximately two cycles greater than CT values for the cobas assay (ORF1ab gene; Smithgall et al., 2020). Bolded p values indicate those that meet statistical significance.
Abbreviations: BMI, body mass index; CI, confidence interval; ED, emergency department; HIV, human immunodeficiency virus; LMH, Lower Manhattan Hospital; NYP, NewYork-Presbyterian; OR, odds ratio; WCMC, Weill Cornell Medical Center.
Removed from final multivariate model because p value > 0.1 in multivariate analysis.
In a sensitivity analysis that added duration of symptoms to the multivariate model, having a hematologic malignancy was still independently associated with a high admission viral load (aOR = 2.37; 95% CI, 1.13–4.99; p = 0.023) compared with not having cancer (Table S1). See Table S2 for this analysis using the cobas viral load cutoffs for both the cobas and Xpert Xpress assays.
In addition to having a hematologic malignancy, other variables that were independently associated with having a high viral load upon admission (Table 2) included increased age, congestive heart failure, diabetes, chronic kidney disease, home use of inhaled, nasal, or oral steroids, residence in a nursing home or rehabilitation facility, and presentation from March 15 to 29 (before the apex of number of new daily infections in NYC; New York City Department of Health and Mental Hygiene, 2020). In contrast, Hispanic patients were less likely to have a high admission viral load (aOR = 0.70; 95% CI, 0.56–0.89; p = 0.004) than white patients.
High SARS-CoV-2 Viral Load Was Associated with In-Hospital Mortality in Patients with and without Cancer
In the overall cohort, using assay-specific CT value cutoffs, 38.8% of patients with a high viral load died during their hospitalization, compared with 24.1% of patients with a medium viral load, and 15.3% of patients with a low viral load (p < 0.001; Table 3 ). These associations were observed for patients whose RT-PCR tests were performed using either the cobas or Xpert Xpress assays. Similar results were obtained when applying the cobas CT value cutoffs to both assays (Table S3). Furthermore, this association was also observed in patients with cancer, where the in-hospital mortality rate was 45.2% in patients with a high viral load, 28.0% in patients with a medium viral load, and 12.1% in patients with a low viral load (Table 3; p = 0.008). When mortality was assessed in patients with cancer over time during the hospitalization (Figure 3 ), having a high viral load was associated with a hazard ratio (HR) of 5.20 (95% CI, 1.65–16.44; p = 0.005) for in-hospital mortality compared with a low viral load; whereas, a medium viral load was not significantly associated with mortality compared with a low viral load (HR = 2.67; 95% CI, 0.78–9.20; p = 0.12). In a multivariate logistic regression model among patients with active cancer that adjusted for age and need for supplemental oxygen within 3 h of presentation to the ED (Table 4 ), we found that having a high viral load was independently associated with increased in-hospital mortality (aOR = 5.00; 95% CI, 1.42–8.85; p = 0.012) compared with having a low viral load. The risk of in-hospital mortality was also higher in patients with a medium viral load compared with a low viral load, but this association was not statistically significant (aOR = 2.13; 95% CI, 0.51–8.85; p = 0.30).
Table 3.
In-Hospital Mortality and SARS-CoV-2 Admission Viral Load, Stratified by RT-PCR Assay
| cobas SARS-CoV-2 Assaya (%) | Xpert Xpress SARS-CoV-2 Assayb (%) | Combined Data from Both Assays (%) | |
|---|---|---|---|
| All Patients | |||
| High viral load (n = 941) | 37.5c | 40.9c | 38.8c |
| Medium viral load (n = 825) | 23.5 | 25.4 | 24.1 |
| Low viral load (n = 1,248) | 12.4 | 18.3 | 15.3 |
| Patients with Cancer | |||
| High viral load (n = 42) | 44.4 | 46.7 | 45.2d |
| Medium viral load (n = 25) | 35.3 | 12.5 | 28.0 |
| Low viral load (n = 33) | 20.0 | 8.7 | 12.1 |
Variables are expressed as in-hospital mortality percentage.
See Table S3 for this analysis using the cobas viral load cutoffs for both the cobas and Xpert Xpress assays.
High viral load, CT value < 25; medium viral load, CT value 25–30; low viral load, CT value > 30, using the ORF1ab gene target.
High viral load, CT value < 27; medium viral load, CT value 27–32; low viral load, CT value > 32, using the N2 gene target.
p value comparing mortality by viral load using a trend analysis was < 0.001.
p value comparing mortality by viral load using a trend analysis was 0.008.
Figure 3.
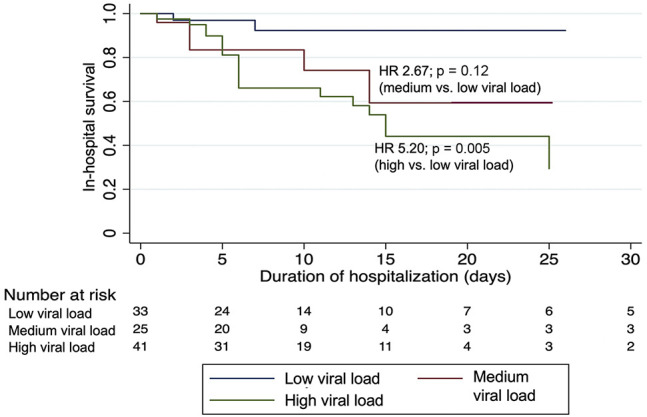
Probability of In-Hospital Survival Over Time Among Patients with Cancer Stratified by Admission Viral Load
Viral loads are grouped into categories based on CT values of the SARS-CoV-2-specific gene target (cobas SARS-CoV-2 assay, ORF1ab: high, CT < 25; medium, CT 25–30, low, CT > 30; and Xpert Xpress SARS-CoV-2 assay, N2: high, CT < 27; medium, CT 27–32, low, CT > 32). Hazard ratios (HR) were generated using a Cox proportional hazards model with two-sided p values.
Table 4.
Factors Associated with In-Hospital Mortality in Patients with Cancer Who Were Hospitalized with COVID-19
| Variable | Univariate Model: Unadjusted OR (95% CI) | p Value | Multivariate Model: Adjusted OR (95% CI) | p Value |
|---|---|---|---|---|
| Admission Viral Loada,b | ||||
| Low (cobas, CT value > 30; Xpert Xpress, CT value > 32) | Reference | Reference | ||
| Medium (cobas, CT value 25–30; Xpert Xpress, CT value 27–32) | 2.82 (0.72–11.01) | 0.14 | 2.13 (0.51–8.85) | 0.30 |
| High (cobas, CT value < 25; Xpert Xpress, CT value < 27) | 5.99 (1.79–20.07) | 0.004 | 5.00 (1.42–17.61) | 0.012 |
| Type of Active Cancer | ||||
| Solid tumor | Reference | |||
| Hematologic malignancy | 1.00 (0.42–2.39) | 1.00 | ||
| Chemotherapy within previous 6 months | 1.56 (0.64–3.79) | 0.33 | ||
| Demographics | ||||
| Age, per year increase | 1.06 (1.01–1.10) | 0.011 | 1.05 (1.00–1.10) | 0.037 |
| Femalec | 0.45 (0.18–1.09) | 0.08 | ||
| Race/ethnicity | ||||
| White (non-Hispanic) | Reference | |||
| Black (non-Hispanic) | 0.87 (0.20–3.76) | 0.86 | ||
| Asian (non-Hispanic) | 2.80 (0.81–9.66) | 0.10 | ||
| Hispanic | 1.71 (0.56–6.20) | 0.35 | ||
| Other or missing | 1.6 (0.25–10.07) | 0.62 | ||
| Comorbiditiesd | ||||
| Obesity (BMI > 30)c | 2.38 (0.94–6.01) | 0.07 | ||
| Coronary artery diseasec | 2.31 (0.90–5.96) | 0.08 | ||
| Congestive heart failurec | 2.74 (0.87–8.66) | 0.09 | ||
| Diabetes mellitus | 1.26 (0.51–3.10) | 0.61 | ||
| Hypertension | 0.93 (0.39–2.18) | 0.86 | ||
| Chronic pulmonary disease | 1.59 (0.58–4.37) | 0.37 | ||
| Chronic kidney disease | 2.54 (0.59–10.91) | 0.21 | ||
| Social Characteristicsd | ||||
| Active or former smoker | 1.17 (0.47–2.91) | 0.74 | ||
| Known exposure to COVID-positive patient | 1.69 (0.54–5.28) | 0.36 | ||
| Nursing home/rehabilitation facility residentc | 3.27 (1.06–10.08) | 0.039 | ||
| Symptoms | ||||
| Fever | 0.91 (0.39–2.14) | 0.83 | ||
| Cough | 1.19 (0.50–2.84) | 0.69 | ||
| Dyspnea | 0.75 (0.32–1.77) | 0.51 | ||
| Duration of symptoms, per day increase | 1.00 (0.92–1.09) | 0.96 | ||
| ED Presentation | ||||
| Need for supplemental oxygen within 3 h of ED presentation | 3.97 (1.36–11.58) | 0.011 | 3.16 (1.02–9.82) | 0.047 |
| Laboratory findingse | ||||
| Leukocytosis: WBC > 11 × 109 cells/L | 1.19 (0.40–3.53) | 0.76 | ||
| Lymphopenia: ALC < 1 × 10⁹ cells/L | 0.83 (0.34–2.02) | 0.69 | ||
| AST elevation | 1.12 (0.57–2.66) | 0.80 | ||
| ALT elevation | 0.43 (0.11–1.62) | 0.21 | ||
| Chest X-ray results | ||||
| No infiltrates | Reference | |||
| Unilateral infiltrates | 0.63 (0.11–3.80) | 0.62 | ||
| Bilateral infiltrates | 2.24 (0.74–6.81) | 0.16 | ||
| Relationship to apex of COVID-19 in New York Cityc | ||||
| Pre-apex (March 15–29) | 3.20 (0.83–12.35) | 0.09 | ||
| Apex (March 30–April 8) | Reference | |||
| Post-apex (April 9–May 14) | 0.53 (0.20–1.44) | 0.21 | ||
| Hospitalc | ||||
| Hospital no. 1 | Reference | |||
| Hospital no. 2 | 0.33 (0.13–0.86) | 0.023 | ||
| Hospital no. 3 | 0.40 (0.11–1.50) | 0.18 | ||
Bold p values indicate those that meet statistical significance.
Abbreviations: ALC, absolute lymphocyte count; ALT, alanine aminotransferase; AST, aspartate aminotransferase; BMI, body mass index; CI, confidence interval; cobas, cobas SARS-CoV-2 assay; CT, cycle threshold; ED, emergency department; OR, odds ratio; WBC, white blood cell count; Xpert Xpress, Xpert Xpress SARS-CoV-2 assay.
CT values based on SARS-CoV-2-specific targets (cobas, ORF1ab gene; Xpert Xpress, N2 gene).
In a sensitivity analysis that applies the cobas CT value viral load cutoffs (high, CT < 25; medium, CT < 25–30; low, CT > 30) to both the cobas and Xpert Xpress assays, having a high viral load was also independently associated with in-hospital mortality (aOR = 4.71; 95% CI, 1.44–15.44; p = 0.01) compared with having a low viral load.
Removed from final model because p value ≥ 0.1 in multivariate analysis.
Only comorbidities or social characteristics that were present in ≥5 patients with active cancer were considered for analysis.
Only laboratory findings that were available in ≥90% of patients were considered in this model.
Discussion
In this multicenter observational study of more than 3,000 hospitalized patients with COVID-19 in NYC, we found that admission SARS-CoV-2 viral load was highly predictive of in-hospital mortality in patients with and without cancer. This study confirms those of previous reports (Magleby et al., 2020; Pujadas et al., 2020) in a larger cohort and expands upon these previous reports in two important ways. First, both previous studies evaluated the relationship between viral load and mortality using the cobas assay. Others have questioned whether this relationship would persist using different SARS-CoV-2 diagnostic assays and gene targets (Rhoads et al., 2020). We found that admission viral load was not only associated with mortality using the cobas assay, but was also associated with mortality using the commonly used Xpert Xpress assay (Table 3). The association between viral load and mortality was similar regardless of whether the cobas assay-derived viral load cutoffs were applied to both the cobas and Xpert Xpress assays or if modified viral load cutoffs were applied to the Xpert Xpress assay that incorporate the higher CT values for the Xpert Xpress N2 target compared with the cobas ORF1ab target (Tables 3 and 4 and Table S3; Smithgall et al., 2020; Rhoads et al., 2020).
Second, we found that admission viral load not only correlates with in-hospital mortality overall, but is also associated with in-hospital mortality among patients with active cancer. In fact, admission viral load was an independent predictor of in-hospital mortality in patients with cancer even after adjusting for important confounders, such as age and hypoxia upon arrival to the ED. Despite the fact that CT values are generated with SARS-CoV-2 RT-PCR diagnostic assays, results of these tests are currently reported as a dichotomous result of detected/positive or not detected/negative. We believe reporting CT values from these assays in patients with and without cancer would provide valuable information that could be used by clinicians to identify patients at high risk of clinical decompensation who may benefit from more intensive monitoring. This information could also be used when allocating scarce resources, such as the antiviral agent remdesivir (Ison et al., 2020).
Another finding from our study is that patients with hematologic malignancies had higher admission viral loads than patients without cancer; whereas, patients with solid tumors had similar viral loads as patients without cancer. We suspect this finding may be from the underlying immunodeficiencies conferred by the hematologic malignancies and the therapies administered that confer a decreased ability to inhibit proliferation of SARS-CoV-2, as viral loads were increased only in patients with hematologic malignancies who had recently received chemotherapy or targeted therapy (Figure 2C). It is also possible that earlier presentations of patients with hematologic malignancies who received these therapies accounted for their higher viral loads upon hospital admission, although earlier presentations were not associated with higher viral loads among patients with solid tumors who received these therapies. A larger cohort of patients with hematologic malignancies is required to confirm our findings and better understand the impact of specific malignancies and their associated therapies on SARS-CoV-2 viral load.
Despite the observed association between hematologic malignancy and higher viral load and the association of admission viral load and mortality, we did not observe a statistically significant increase in mortality among patients with hematologic malignancies compared with patients with solid tumors or patients without cancer. It is possible that the modest sample size of patients with hematologic malignancies limited our ability to detect differences in mortality, as there was a numerically increased in-hospital mortality rate for patients with hematologic malignancies compared with patients without cancer (30.0% versus 24.9%). Notably, two recent publications demonstrated a significantly increased mortality risk among patients with hematologic malignancies compared with patients with solid tumors (Jee et al., 2020; Lee et al., 2020a). It is also possible that certain targeted therapies may not prevent viral replication, but may mitigate immune-mediated injury after COVID-19. For example, five patients with hematologic malignancies in this study were receiving ibrutinib, which may protect against pulmonary injury in COVID-19-infected patients (Treon et al., 2020), and only one of these five patients died. Additional studies with large sample sizes of patients with hematologic malignancies are needed to more definitely assess whether these patients have increased mortality when hospitalized with COVID-19.
In addition to the presence of a hematologic malignancy, we identified other patient characteristics that were associated with a high admission SARS-CoV-2 viral load, including increased age and comorbidities, such as congestive heart failure, diabetes, and chronic kidney disease. We also found that use of inhaled/nasal and oral steroids before admission was independently associated with having a high viral load. Although steroid use correlated with chronic lung disease, the association between inhaled or nasal steroid use and high viral load was also observed in a post-hoc analysis limited to patients with asthma or chronic obstructive pulmonary disease. In a randomized trial of dexamethasone in hospitalized patients with COVID-19, although dexamethasone improved outcomes of hypoxic patients, there was a trend toward increased mortality in patients who did not require oxygen therapy (RECOVERY Collaborative Group et al., 2020). Furthermore, glucocorticoid therapy has been associated with prolonged clearance of SARS-CoV-2 (Zheng et al., 2020). Thus, it is possible that local use of steroids in the respiratory tract promotes increased SARS-CoV-2 replication. However, the clinical significance of this finding is uncertain, particularly given that use of inhaled or nasal steroids was not associated with increased mortality in our study.
A surprising finding was that Hispanic patients were less likely to present with a high viral load, even though COVID-19 has disproportionately affected this population in NYC and other locations (Martinez et al., 2020; New York City Department of Health and Mental Hygiene, 2020). Additional research is needed to confirm this observation and compare SARS-CoV-2 viral loads among different racial/ethnic and socioeconomic groups on a larger scale.
A limitation of this study is that we used CT values as surrogate markers for viral load, instead of measuring viral load directly. However, SARS-CoV-2 RT-PCR assays used in clinical laboratories generate CT values, not direct viral load measurements, therefore we believe CT value results have greater potential to be incorporated into patient care. We also only evaluated a single nasopharyngeal swab specimen per patient at the time of hospital admission. Thus, we were unable to assess viral load at the onset of symptoms or changes in viral load over time. We caution that our findings may not apply to outpatients with COVID-19 who are not sick enough to be hospitalized, because a recent study demonstrated that CT values were similar among symptomatic and asymptomatic SARS-CoV-2-infected patients who did not require hospitalization (Lee et al., 2020c). We encourage subsequent studies to assess the potential role of using SARS-CoV-2 viral load to guide care for outpatients with and without cancer. Although we have now identified strong associations between admission viral load and mortality using two commonly used diagnostic platforms, we also encourage investigations of this association using other SARS-CoV-2 RT-PCR assays. Another potential role for reporting SARS-CoV-2 viral loads through CT values is to inform infection prevention practices, given that viral load correlates with infectivity (Bullard et al., 2020; He et al., 2020). This study was not designed to assess this potential additional role for reporting CT values, but we believe that this is an important area of future research. An additional limitation is that we did not capture deaths that occurred after hospital discharge.
In conclusion, using two different diagnostic platforms, we found that admission SARS-CoV-2 viral load, as assessed by CT values that are generated by routine RT-PCR diagnostic assays, was highly associated with in-hospital mortality in COVID-19 patients with and without cancer. Furthermore, patients with hematologic malignancies had higher viral loads than patients without cancer, particularly those who had received chemotherapy or targeted therapies. These findings highlight the critical role of viral load in SARS-CoV-2 pathogenesis and suggest that providing CT value results to clinicians could serve as a valuable tool in the care of hospitalized patients with COVID-19.
STAR★Methods
Key Resources Table
| REAGENT or RESOURCE | SOURCE | IDENTIFIER |
|---|---|---|
| Biological Samples | ||
| Nasopharyngeal swab specimens collected and analyzed for routine clinical care from participants at three NewYork-Presbyterian hospitals | Clinical Microbiology Laboratories of NewYork-Presbyterian Hospital | N/A |
| Critical Commercial Assays | ||
| cobas SARS-CoV-2 RT-PCR Assay | Roche Molecular Systems, Inc. | Platform: cobas 6800 |
| Xpert Xpress SARS-CoV-2 RT-PCR Assay | Cepheid, Inc. | Platform: GeneXpert Infinity |
| Software and Algorithms | ||
| STATA, version 15.1 | StataCorp | Stata/IC 15.1 |
| Other | ||
| REDCap database of clinical data of patients presenting to affiliated hospitals with COVID-19 under a Weill Cornell Medicine (WCM) Institutional Review Board (IRB)-approved protocol |
Harris et al., 2009 Goyal et al., 2020 |
WCM IRB #20-03021681 |
Resource Availability
Lead Contact
Further information and requests for resources and reagents should be directed to and will be fulfilled by the Lead Contact, Michael Satlin (mjs9012@med.cornell.edu).
Materials Availability
This study did not generate new unique reagents.
Data and Code Availability
This study did not generate any new code and datasets are outlined in the primary manuscript and Supplemental Information.
Experimental Model and Subject Details
Study Population and Setting
This is a retrospective observational study of patients who were hospitalized with COVID-19 at NewYork-Presbyterian Hospital (NYP)/Weill Cornell Medical Center, NYP Lower Manhattan Hospital, or NYP Queens from March 15, 2020 until May 14, 2020. Patients who had a nasopharyngeal swab specimen that was collected within one day of hospital presentation and was positive for SARS-CoV-2 by RT-PCR using the cobas assay (Roche Molecular Systems, Inc.) or Xpert Xpress assay (Cepheid, Inc.) were eligible for study inclusion. March 15th corresponds to the first date that the cobas assay was implemented and the Xpert Xpress assay was added as a clinical diagnostic test at different time periods during the study at each hospital. Patients who were not admitted to the hospital, who did not have signs or symptoms of COVID-19, or who were lost to follow-up after being transferred to a different hospital were excluded. Only a patient’s first hospitalization with COVID-19 that met inclusion criteria was analyzed. The institutional policy during the study period was to perform SARS-CoV-2 RT-PCR tests on all patients who were hospitalized with signs or symptoms of COVID-19.
Method Details
Viral Load Assessment
The cobas and Xpert Xpress assays were performed according to the manufacturer’s instructions (cobas SARS-CoV-2 Assay Instructions for Use, 2020; Xpert Xpress SARS-CoV-2 Assay Instructions for Use, 2020). For our primary analysis, we utilized CT values for the ORF1ab gene using the cobas assay and CT values for the N2 gene using the Xpert Xpress assay. Both gene targets are specific for SARS-CoV-2. For the cobas assay, we converted the CT values into qualitative assessments of viral load (high, CT value < 25; medium, CT value 25-30; low, CT value > 30) based on prior work using this assay that separated these values into terciles and correlated these terciles with the risk of intubation and mortality among hospitalized patients with COVID-19 (Magleby et al., 2020).
In order to derive viral load cutoffs for data generated using the Xpert Xpress assay, we reviewed data from Smithgall and colleagues who compared CT values of the SARS-CoV-2-specific targets of the cobas and Xpert Xpress assays using 88 clinical specimens that tested positive for SARS-CoV-2 (Smithgall et al., 2020). These specimens spanned the range of CT values that correspond to high, medium, and low viral loads as defined for the cobas assay above. CT values for the N2 target on the Xpert Xpress assay were greater than CT values for the ORF1ab target on the cobas assay, and the median difference in CT values between assays was approximately 2 cycles. A similar difference was noted in a survey performed by the College of American Pathologists using proficiency testing specimens (Rhoads et al., 2020). Therefore, we established an adjusted qualitative assessment of viral load for the Xpert Xpress assay (high, CT value < 27; medium, CT value 27-32; and low, CT value > 32) that accounts for this difference. Using these different cutoffs for each assay, we found that the viral load categorical agreement (high, medium, and low) between the cobas and Xpert Xpress assays for the 88 specimens analyzed by Smithgall and colleagues was 88.6% (kappa 0.83). When we applied the cobas assay cutoff criteria (high, CT value < 25; medium, CT value 25-30; low, CT value > 30) to both the cobas and Xpert Xpress assay results for the 88 specimens, the categorical agreement decreased to 84.1% (kappa 0.75). Based on these findings, we conducted our primary analysis using different viral load cutoff criteria for the cobas and Xpert Xpress assay results, and conducted a secondary analysis where we applied the cobas viral load cutoffs to results from both assays.
We did not use CT value terciles of the N2 gene target from specimens in this study to derive viral load cutoffs for the Xpert Xpress assay because this assay was primarily used after the apex of infections in New York City. Thus, these terciles were not deemed to be representative of the full range of CT values among hospitalized patients throughout the pandemic in NYC.
Collection of Clinical Data
Data were abstracted manually from the electronic medical record at each hospital using the same quality-controlled protocol at each hospital and entered into a REDCap database (Harris et al., 2009). All data collectors were trained and a random re-sampling of data previously showed high interrater reliability (mean kappa of 0.92; Goyal et al., 2020). Data collected included demographics, comorbidities, outpatient medications on admission, social characteristics, presenting symptoms and duration of symptoms upon arrival to the hospital, laboratory parameters, chest radiograph findings, in-hospital complications, and in-hospital mortality. We defined patients with active cancer as having received cancer-directed therapy (e.g., chemotherapy, targeted therapy, immunotherapy, radiotherapy, or surgery) within six months of admission for COVID-19 or who were receiving active surveillance for their malignancy (e.g., patient with chronic lymphocytic leukemia or prostate cancer). All patients with active cancer who met inclusion criteria were included in the study and we also recorded their cancer type (e.g., genitourinary, breast, thoracic, gastrointestinal, chronic leukemia, myeloma) and receipt of cancer therapies (e.g., chemotherapy, targeted therapy, steroids) in the previous 6 months. The study was approved by the Institutional Review Board (#20-03021681) at Weill Cornell Medicine with a waiver of informed consent.
Quantification and Statistical Analysis
We first compared characteristics and outcomes of patients with and without active cancer who were hospitalized with COVID-19. Categorical variables were represented as proportions and continuous variables were represented with medians and IQRs. We then compared median CT values of the SARS-CoV-2-specific gene targets (cobas assay, ORF1ab; Xpert Xpress assay, N2) among patients with hematologic malignancies, those with solid tumors, and those without active cancer, and compared the proportions of patients with a high viral load upon hospital admission among these groups. Chi-square or Fisher’s exact tests were used for categorical variables and the Wilcoxon rank-sum test for continuous variables. A two-sided P value of < 0.05 was used to indicate statistical significance. We then constructed a multivariate logistic regression model to identify variables that were independently associated with having a high viral load on admission, with having a hematologic malignancy or solid tumor being the primary variable of interest. All variables that had a P value < 0.1 in univariate analysis were initially included in a multivariate model. Variables were then removed from this multivariate model in a stepwise fashion until only variables with P < 0.1 were retained in the final model. The primary model utilized different viral load cutoffs for data generated using the cobas and Xpert Xpress assays (see Viral Load Assessment), and a secondary analysis applied the cobas viral load cutoffs to data acquired using both assays.
We then compared in-hospital mortality rates in patients who presented with high, medium, and low viral loads, using the non-parametric nptrend command in STATA (StataCorp, version 15.0., College Station, TX) that tests for trend across ordered groups. The analysis was repeated among patients with active cancer. We also constructed a multivariate logistic regression model to identify variables that were independently associated with mortality among patients with cancer, with having a high admission viral load being the primary variable of interest. The method used to construct the multivariate model was the same as the model reported above. Finally, we constructed a Cox proportional hazards model to compare in-hospital survival among patients with high, medium, and low admission viral loads.
Acknowledgments
We would like to acknowledge the work of our data abstraction team at Weill Cornell Medicine, who are highlighted by name in our Supplemental Information, and the NewYork-Presbyterian Medical Technologists who performed the testing. This work was partially supported by the National Center for Advancing Translational Sciences (UL1 TR002384 to Julianne Imperato-McGinley) at the NIH.
Author Contributions
L.F.W., G.B., L.C.P., and M.J.S. designed the study. L.F.W., L.C.P., M.R., J.L.S., D.L., S.W., J.H.R., M.M.C., M.L., and M.J.S. collected the laboratory data. G.B., L.C.P., D.P., P.G., L.Z., G.G., M.P., J.C., M.M.S., and M.J.S. collected clinical data. L.F.W., G.B., L.C.P., M.R., and M.J.S. performed the data analysis. All co-authors participated in the drafting and editing of the manuscript.
Declaration of Interests
L.F.W. reports receiving consulting and grant support from Roche Molecular Systems, Inc. M.M.S. receives grant support from Amgen, Inc. All other authors declare no competing interests.
Published: November 9, 2020
Footnotes
Supplemental Information can be found online at https://doi.org/10.1016/j.ccell.2020.09.007.
Supplemental Information
References
- Bullard J., Dust K., Funk D., Strong J.E., Alexander D., Garnett L., Boodman C., Bello A., Hedley A., Schiffman Z., et al. Predicting infectious SARS-CoV-2 from diagnostic samples. Clin. Infect. Dis. 2020 doi: 10.1093/cid/ciaa638. [DOI] [PMC free article] [PubMed] [Google Scholar]
- cobas cobas SARS-CoV-2 Assay Instructions for Use v1.0. 2020. https://www.fda.gov/media/136049/download
- Dai M., Liu D., Liu M., Zhou F., Li G., Chen Z., Zhang Z., You H., Wu M., Zheng Q., et al. Patients with cancer appear more vulnerable to SARS-CoV-2: a multicenter study during the COVID-19 outbreak. Cancer Discov. 2020;10:783–791. doi: 10.1158/2159-8290.CD-20-0422. [DOI] [PMC free article] [PubMed] [Google Scholar]
- Deng G., Yin M., Chen X., Zeng F. Clinical determinants for fatality of 44,672 patients with COVID-19. Crit. Care. 2020;24:179. doi: 10.1186/s13054-020-02902-w. [DOI] [PMC free article] [PubMed] [Google Scholar]
- Goyal P., Choi J.J., Pinheiro L.C., Schenck E.J., Chen R., Jabri A., Satlin M.J., Campion T.R., Jr., Nahid M., Ringel J.B., et al. Clinical characteristics of COVID-19 in New York City. N. Engl. J. Med. 2020;382:2372–2374. doi: 10.1056/NEJMc2010419. [DOI] [PMC free article] [PubMed] [Google Scholar]
- Harris P.A., Taylor R., Thielke R., Payne J., Gonzalez N., Conde J.G. Research electronic data capture (REDCap)—a metadata-driven methodology and workflow process for providing translational research informatics support. J. Biomed. Inform. 2009;42:377–381. doi: 10.1016/j.jbi.2008.08.010. [DOI] [PMC free article] [PubMed] [Google Scholar]
- He X., Lau E.H.Y., Wu P., Deng X., Wang J., Hao X., Lau Y.C., Wong J.Y., Guan Y., Tan X., et al. Temporal dynamics in viral shedding and transmissibility of COVID-19. Nat. Med. 2020;26:672–675. doi: 10.1038/s41591-020-0869-5. [DOI] [PubMed] [Google Scholar]
- Ison M.G., Wolfe C., Boucher H.W. Emergency use authorization of remdesivir: the need for a transparent distribution process. JAMA. 2020;323:2365–2366. doi: 10.1001/jama.2020.8863. [DOI] [PubMed] [Google Scholar]
- Jee J., Foote M.B., Lumish M., Stonestrom A.J., Wills B., Narendra V., Avutu V., Murciano-Goroff Y.R., Chan J.E., Derkach A., et al. Chemotherapy and COVID-19 outcomes in patients with cancer. J. Clin. Oncol. 2020 doi: 10.1200/JCO.20.01307. [DOI] [PMC free article] [PubMed] [Google Scholar]
- Kuderer N.M., Choueiri T.K., Shah D.P., Shyr Y., Rubinstein S.M., Rivera D.R., Shete S., Hsu C.Y., Desai A., de Lima Lopes G., Jr., et al. Clinical impact of COVID-19 on patients with cancer (CCC19): a cohort study. Lancet. 2020;395:1907–1918. doi: 10.1016/S0140-6736(20)31187-9. [DOI] [PMC free article] [PubMed] [Google Scholar]
- Lee L.Y.W., Cazier J.B., Starkey T., Briggs S.E.W., Arnold R., Bisht V., Booth S., Campton N.A., Cheng V.W.T., Collins G., et al. COVID-19 prevalence and mortality in patients with cancer and the effect of primary tumour subtype and patient demographics: a prospective cohort study. Lancet Oncol. 2020 doi: 10.1016/S1470-2045(20)30442-3. [DOI] [PMC free article] [PubMed] [Google Scholar]
- Lee L.Y.W., Cazier J.B., Starkey T., Turnbull C.D., UK Coronavirus Cancer Monitoring Project Team. Kerr R., Middleton G. COVID-19 mortality in patients with cancer on chemotherapy or other cancer treatments: a prospective cohort study. Lancet. 2020;395:1919–1926. doi: 10.1016/S0140-6736(20)31173-9. [DOI] [PMC free article] [PubMed] [Google Scholar]
- Lee S., Kim T., Lee E., Lee C., Kim H., Rhee H., Park S.Y., Son H.J., Yu S., Park J.W., et al. Clinical course and molecular viral shedding among asymptomatic and symptomatic patients with SARS-CoV-2 infection in a community treatment center in the Republic of Korea. JAMA Intern. Med. 2020 doi: 10.1001/jamainternmed.2020.3862. [DOI] [PMC free article] [PubMed] [Google Scholar]
- Liang W., Guan W., Chen R., Wang W., Li J., Xu K., Li C., Ai Q., Lu W., Liang H., et al. Cancer patients in SARS-CoV-2 infection: a nationwide analysis in China. Lancet Oncol. 2020;21:335–337. doi: 10.1016/S1470-2045(20)30096-6. [DOI] [PMC free article] [PubMed] [Google Scholar]
- Magleby R., Westblade L.F., Trzebucki A., Simon M.S., Rajan M., Park J., Goyal P., Safford M.M., Satlin M.J. Impact of SARS-CoV-2 viral load on risk of intubation and mortality among hospitalized patients with coronavirus disease 2019. Clin. Infect Dis. 2020 doi: 10.1093/cid/ciaa851. [DOI] [PMC free article] [PubMed] [Google Scholar]
- Martinez D.A., Hinson J.S., Klein E.Y., Irvin N.A., Saheed M., Page K.R., Levin S.R. SARS-CoV-2 positivity rate for Latinos in the Baltimore-Washington, DC region. JAMA. 2020;324:392–395. doi: 10.1001/jama.2020.11374. [DOI] [PMC free article] [PubMed] [Google Scholar]
- Mehta V., Goel S., Kabarriti R., Cole D., Goldfinger M., Acuna-Villaorduna A., Pardhan K., Thota R., Reissman S., Sparano J.A., et al. Case fatality rate of cancer patients with COVID-19 in a New York hospital system. Cancer Discov. 2020;10:935–941. doi: 10.1158/2159-8290.CD-20-0516. [DOI] [PMC free article] [PubMed] [Google Scholar]
- New York City Department of Health and Mental Hygiene. (n.d.) COVID-19: Data: Main Data Page. https://www1.nyc.gov/site/doh/covid/covid-19-data.page.
- Pujadas E., Chaudhry F., McBride R., Richter F., Zhao S., Wajnberg A., Nadkarni G., Glicksberg B.S., Houldsworth J., Cordon-Cardo C. SARS-CoV-2 viral load predicts COVID-19 mortality. Lancet Respir. Med. 2020;8:e70. doi: 10.1016/S2213-2600(20)30354-4. [DOI] [PMC free article] [PubMed] [Google Scholar]
- RECOVERY Collaborative Group. Horby P., Lim W.S., Emberson J.R., Mafham M., Bell J.L., Linsell L., Staplin N., Brightling C., Ustianowski A., et al. Dexamethasone in hospitalized patients with COVID-19—preliminary report. N. Engl. J. Med. 2020 doi: 10.1056/NEJMoa2021436. [DOI] [PMC free article] [PubMed] [Google Scholar]
- Rhoads D., Peaper D.R., She R.C., Nolte F.S., Wojewoda C.M., Anderson N.W., Pritt B.S. College of American Pathologists (CAP) microbiology committee perspective: caution must be used in interpreting the cycle threshold (Ct) value. Clin. Infect Dis. 2020 doi: 10.1093/cid/ciaa1199. [DOI] [PubMed] [Google Scholar]
- Robilotti E.V., Babady N.E., Mead P.A., Rolling T., Perez-Johnston R., Bernardes M., Bogler Y., Caldararo M., Figueroa C.J., Glickman M.S., et al. Determinants of COVID-19 disease severity in patients with cancer. Nat. Med. 2020;26:1218–1223. doi: 10.1038/s41591-020-0979-0. [DOI] [PMC free article] [PubMed] [Google Scholar]
- Smithgall M.C., Scherberkova I., Whittier S., Green D.A. Comparison of Cepheid Xpert Xpress and Abbott ID now to Roche cobas for the rapid detection of SARS-CoV-2. J. Clin. Virol. 2020;128:104428. doi: 10.1016/j.jcv.2020.104428. [DOI] [PMC free article] [PubMed] [Google Scholar]
- Tian J., Yuan X., Xiao J., Zhong Q., Yang C., Liu B., Cai Y., Lu Z., Wang J., Wang Y., et al. Clinical characteristics and risk factors associated with COVID-19 disease severity in patients with cancer in Wuhan, China: a multicentre, retrospective, cohort study. Lancet Oncol. 2020;21:893–903. doi: 10.1016/S1470-2045(20)30309-0. [DOI] [PMC free article] [PubMed] [Google Scholar]
- Treon S.P., Castillo J.J., Skarbnik A.P., Soumerai J.D., Ghobrial I.M., Guerrera M.L., Meid K., Yang G. The BTK inhibitor ibrutinib may protect against pulmonary injury in COVID-19-infected patients. Blood. 2020;135:1912–1915. doi: 10.1182/blood.2020006288. [DOI] [PMC free article] [PubMed] [Google Scholar]
- World Health Organization Coronavirus Disease (COVID-19) Weekly Epidemiological Update. 2020. https://www.who.int/docs/default-source/coronaviruse/situation-reports/20200907-weekly-epi-update-4.pdf?sfvrsn=f5f607ee_2
- Cepheid Xpert Xpress SARS-CoV-2 Assay Instructions for Use v1.0. 2020. https://www.fda.gov/media/136314/download
- Zheng S., Fan J., Yu F., Feng B., Lou B., Zou Q., Xie G., Lin S., Wang R., Yang X., et al. Viral load dynamics and disease severity in patients infected with SARS-CoV-2 in Zhejiang province, China, January-March 2020: retrospective cohort study. BMJ. 2020;369:m1443. doi: 10.1136/bmj.m1443. [DOI] [PMC free article] [PubMed] [Google Scholar]
Associated Data
This section collects any data citations, data availability statements, or supplementary materials included in this article.
Supplementary Materials
Data Availability Statement
This study did not generate any new code and datasets are outlined in the primary manuscript and Supplemental Information.