

Abstract
Background:
We have previously shown that the effect of an HDL genetic risk score depends upon whether the phenotype (HDL-cholesterol) is high or low relative to its distribution (quantile-dependent expressivity).
Objective:
Evidence for quantile-dependent expressivity was sought using a more inclusive genetic measure (quantile-specific heritability, h2) in a larger population (Framingham cohort).
Methods:
Quantile regression was used to test whether the offspring-parent (βOP) and full-sib (βFS) regression slopes increased with the percentiles of the offspring’s HDL distribution in 10,650 parent-offspring pairs and 2130 sibships. Quantile-specific heritability was estimated by 2βOP/(1+rspouse) and [(8βFSrspouse+1)0.5−1]/(2rspouse) where rspouse is the spouse correlation.
Results:
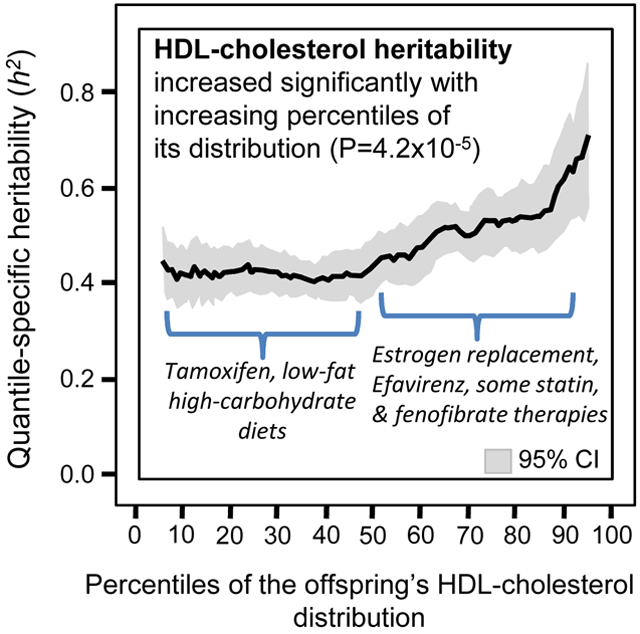
HDL-cholesterol heritability estimated from βOP increased significantly (P=4.2x10⁻⁵) from the 10th (h2±SE: 0.44±0.03), 25th (0.45±0.03), 50th (0.47±0.03), 75th (0.56±0.04), to the 90th percentiles (0.65±0.06) of the offspring’s age- and sex-adjusted HDL-cholesterol distribution. Heritability estimated from βFS also increased significantly with the percentiles of the offspring’s HDL-cholesterol (P=0.002), apo A1 (P=0.006), HDL2-cholesterol (P=0.003), and HDL3-cholesterol distribution (P=0.02). Consistent with quantile-dependent expressivity, published pharmacologic and nutritional interventions that raised (e.g., statin, fibrates, estrogen replacement therapy, Efavirenz, dietary fat) or lowered HDL-cholesterol concentrations (tamoxifen, dietary carbohydrate) correspondingly increased and decreased genetic effects.
Conclusion:
HDL-cholesterol heritability increased with increasing percentile of the offspring’s HDL distribution. Whereas precision medicine is based on the premise that genetic markers identify patients most likely to benefit from drugs and diet, quantile-dependent expressivity postulates that the strong signals from these genetic markers simply trace the heritability increase with increasing plasma HDL concentrations. Thus quantile-dependent expressivity provides an alternative interpretation to these genotype-specific effects.
Keywords: high density lipoprotein cholesterol, heritability, gene-environment interactions, apolipoprotein A1, HDL2, HDL3
Graphical Abstract
Introduction
Higher high-density lipoprotein (HDL) cholesterol is associated with lower coronary heart disease and stroke risk [1]. Statin [1], fibrates [1], efavirenz [2,3], estrogen replacement therapy [1], dietary fat [4,5], and the Mediterranean diet increase HDL-cholesterol [6], whereas tamoxifen [7] and dietary carbohydrate decrease its concentrations [4,5]. Individual responses vary substantially, however, which may be due in part to genetic differences, providing a potential basis for personalized or precision medicine, including pharmacogenetics (genotypically driven drug prescriptions) [8] and nutrigenetics (genotypically driven diet prescriptions) [9].
We have shown that the effect size of a 47-SNP genetic risk score (GRSHDL) increased with the percentile of the HDL distribution, i.e., whether HDL-cholesterol concentrations were high or low relative to its population distributions [10]. Compared to the GRSHDL’s phenotypic effect at the 10th population percentile, its effect was 1.9-fold greater at the 90th percentile of the HDL-distribution. The effect of the rs3764261 cholesterol ester transfer protein (CETP) risk allele was 2.4-fold greater at the 90th than 10th HDL percentile. We refer to this phenomenon as quantile-dependent expressivity (AKA quantile-dependent penetrance) [10-14].
Quantile-dependent expressivity represents an alternative perspective to precision medicine. It postulates that pharmacogenetic or nutrigenetic genetic markers simply trace the heritability increase with increasing plasma HDL-cholesterol concentrations. For example, a smaller genetic effect size at a lower (pre-treatment) than higher (post-treatment) HDL concentrations requires that the effects of the genotypes do not move in parallel when pharmacologically treated [11,12]. In this case, subtracting pre-treatment from the post-treatment HDL levels will necessarily create a relatively greater HDL increase for the genotype with the higher pre-treatment HDL.
Genomewide association studies have identified 63 single nucleotide polymorphisms (SNPs) associated with HDL-cholesterol, however, only about 14% of the HDL-cholesterol variance is explained by these 63 loci [15,16]. Verification of quantile-dependent expressivity was therefore sought using a more inclusive genetic measure in a larger population. To this end, we applied quantile regression [17,18] to sibships and offspring-parent pairs from the Framingham Study [19,20] to estimate quantile-specific heritability in the narrow sense (h2) for HDL-cholesterol, HDL-subfractions, and apo A-1. We then demonstrate the general applicability and external validity of quantile-dependent expressivity in fifteen clinically relevant published examples, originally interpreted from a precision medicine perspective, which might be more simply explained by quantile-dependent expressivity.
Methods
The Framingham Study data were obtained from the National Institutes of Health FRAMCOHORT, GEN3, FRAMOFFSPRING Research Materials from the National Heart, Lung, and Blood (NHLBI) Biologic Specimen and Data Repository Information Coordinating Center. The hypothesis tested is exploratory and not considered as part of the initial Framingham Study design. The Framingham Study included three cohorts. The Offspring Cohort consisted of 5,124 adult children of the original participants and their spouses who were first examined between 1971 and 1975, reexamined eight years later, and then every three to four years thereafter [19]. Children of the Offspring Cohort were recruited to form the Third Generation cohort [20]. Subjects used in the current analyses were at least 16 years of age, were not taking medications to control lipid levels, and were self-identified as non-Hispanic white. Individual subject values were taken as the average of the age- and sex-adjusted HDL concentrations over all available exams (i.e. the average of up to eight exams for the Offspring Cohort, and up to two exams for the Third Generation Cohort). Apolipoprotein A-1 concentrations were measured by noncompetitive enzyme-linked immunoabsorbent assay (ELISA), using affinity-purified polyclonal antibodies that were averaged for the 3rd and 4th examinations, and HDL2- and HDL3-cholesterol concentrations were the average of the 4th and 5th examinations of the Offspring Cohort. Full-sibling regression slopes (βFS) were obtained by forming all ki(ki-1) sibpair combinations for the ki siblings in sibship i and assigning equal weight to each individual [21].
Simultaneous quantile regression was performed using the sqreg command of Stata (version. 11, StataCorp, College Station, TX) with one thousand bootstrap samples drawn to estimate the variance-covariance matrix for the 91 quantile regression coefficients between the 5th and 95th percentiles of the offspring’s HDL-cholesterol distribution [17,18]. Postestimation procedures (test and lincom) were used to test linear combinations of the slopes after estimation with Σki-2 degrees of freedom for offspring-parent regression slopes and Σ(ki-1) degrees of freedom for sibship regression slopes. Quantile-specific expressivity was assessed by: 1) estimating quantile-specific β-coefficient (±SE) for the 5th, 6th,…, 95th percentiles of the sample distribution using simultaneous quantile regression; 2) plotting the quantile-specific β coefficient vs. the quantile of the trait distribution; and 3) testing whether the resulting graph was constant, or changed as a linear, quadratic, or cubic function of the percentile of the trait distribution using orthogonial polynomials [22]. Falconer and Mackay’s formula [23] equate heritability in the narrow sense (h2) to 2βOP/(1+rspouse) and [(8βFSrspouse+1)0.5−1]/(2rspouse) where rspouse is the correlation between spouses. “Quantile-specific heritability” refers to the heritability (h2) statistic, whereas “quantile-dependent expressivity” is the biological phenomenon of a trait expression being quantile-dependent.
Gene-environment interactions within the Framingham cohort were test by the significance of the interaction between the parents effect and environmental effect in predicting offspring HDL-cholesterol concentrations in a standard regression model that included their main effects.
Results
Classical point estimates
Supplementary Table S1 presents the sample characteristics. Spouse concordances were significant but not strong for HDL-cholesterol (rspouse=0.12), HDL2-cholesterol (rspouse=0.09), HDL3-cholesterol (rspouse=0.13), and apo A-1 concentrations (rspouse=0.10). Table 1 presents the offspring-parent (βOP), offspring midparent (βOM), and full-sib regression slopes (βFS), from which heritability in the narrow sence (h2) was calculated, i.e., h2=2βOP/(1+rspouse) from offspring-parent slope, h2=βOM from the offspring-midparent slope, and {(1+8βFSrspouse)0.5−1}/2rspouse from the full-sib slope [23]. All three estimates gave similar results for HDL-cholesterol heritability: h2=0.52 when estimated from βOM, h2=0.51 when estimated from βOP, and h2=0.53 when estimated from βFS. Estimated heritability from βFS was h2=0.46 for HDL2-cholesterol, h2=0.52 for HDL3-cholesterol, and h2=0.52 for apo A1 concentrations.
Table 1.
Classical and quantile regression analyses of HDL-cholesterol and apolipoprotein A1
| Traditional regression analysis |
Quantile regression analysis | |||||||
|---|---|---|---|---|---|---|---|---|
| Classical regression slope, all observations |
Increase in slope per 1% increase in the percentile of the dependent variable’s distribution |
Difference in slope between the 90th and 10th percentiles |
||||||
| Correlation | Linear effect | Nonlinear effects | ||||||
| Slope±SE | Slope±SE | Linear P | Quadratic P |
Cubic P |
Difference ±SE |
P | ||
| Offspring-parent | ||||||||
| HDL-cholesterol* | 0.27 | 0.288±0.013¶ | 0.0013±0.0003 | 4.2x10⁻⁵ | 0.003 | 0.68 | 0.119±0.034 | 0.0005 |
| Offspring midparental- | ||||||||
| HDL-cholesterol* | 0.35 | 0.522±0.022¶ | 0.0021±0.0006 | 0.0006 | 0.09 | 0.05 | 0.199±0.054 | 0.0002 |
| Sibling | ||||||||
| HDL-cholesterol† | 0.29 | 0.285±0.016¶ | 0.0013±0.0004 | 0.002 | 0.77 | 0.62 | 0.101±0.030 | 0.0006 |
| Apo A1§ | 0.27 | 0.273±0.026¶ | 0.0018±0.0006 | 0.006 | 0.34 | 0.47 | 0.166±0.062 | 0.007 |
| HDL2-cholesterol‡ | 0.24 | 0.241±0.027¶ | 0.0025±0.0008 | 0.003 | 0.19 | 0.65 | 0.196±0.120 | 0.10 |
| HDL3-cholesterol‡ | 0.28 | 0.279±0.027¶ | 0.0017±0.0007 | 0.02 | 0.66 | 0.67 | 0.131±0.061 | 0.03 |
2800 parent-child pairs in 1372 families with one parent, 7850 parent-child pairs in 1745 families with both parents.
5941 siblings in 2130 families with two or more children per family
2179 siblings in 819 families
2084 siblings in 789 families
P<10−15
Quantile regression analyses
Quantile regression provides three useful statistical outcomes: βOP for individual quantiles between the 5th and 95th percentiles of the HDL distribution, βOP differences between quantiles, and βOP trends (increasing or decreasing) when going from the lowest to highest quantiles. βOP at the 90th percentile of the offspring’s age- and sex-adjusted HDL-cholesterol distribution (slope±SE: 0.367±0.033) was significantly greater than the βOP at the offspring’s 10th percentile (0.247±0.015). This difference (0.119±0.034, P=0.0005, Table 1) represents nearly a 50% increase in βOP between the upper and lower tails of the HDL-cholesterol distribution, and nearly a 50% increase in heritability. On average, quantile-specific heritability increased an average of 0.0023±0.0005 for every 1% increment in the percentile of the offspring’s HDL-cholesterol distribution (P=4.2x10⁻⁵) and the increase was somewhat nonlinear (a quadratic effect reflecting the acceleration at higher percentiles, P=0.003, Table 1).
The quantile regression results are presented in Figure 1A as a graph of βOP on the right Y-axis vs. the percentiles (quantiles) of the offspring’s HDL-concentrations on the X-axis. The corresponding heritability estimates are displayed on the left. If the classical model of constant heritability over all quantiles applied, then Figure 1A would show a flat line with zero slope and Table 1 would show no significant linear, quadratic and cubic changes in slope per 1% increase in the percentile of the offspring’s HDL-cholesterol distribution (P>0.05). In fact, the Figure 1A shows that quantile-specific heritability remained relatively level through the 50th percentile of the offspring’s HDL-distribution, and then increased thereafter. Each one of the 91 βPO’s between the 5th and 95th percentiles was individually significant at P<10−15. HDL-cholesterol heritability estimated from βOP increased from the 10th (h2±SE: 0.44±0.03), 25th (0.45±0.03), 50th (0.47±0.03), 75th (0.56±0.04), to the 90th percentiles (0.65±0.06) of the offspring’s age- and sex-adjusted HDL-cholesterol distribution.
Figure 1A.

Offspring-parent regression slopes (βOP) by quantiles of the offspring’s HDL concentrations, with corresponding estimates of heritability (h2=2βOP/(1+rspouse) where rspouse is the spouse correlation). The slopes became progressively greater (i.e., steeper) with increasing quantiles of the HDL distribution, particularly above the 50th percentile. Figure 1B presents the full-sib regression slopes (βFS, vertical axis) by quantiles of the sib’s HDL-cholesterol. Significance of the linear, quadratic and cubic trends and the 95% confidence intervals (shaded region) determined by 1000 bootstrap samples.
Quantile regression analyses of full-sibling HDL-cholesterol.
Table 1 shows that βFS was significantly greater at the 90th than the 10th percentile (P=0.0006) and increased linearly an average of 0.0013±0.0004 for every 1% increment in the percentile of the sib’s HDL-cholesterol (0.0026±0.0008 increase in heritability assuming no dominance or common environmental effects). Figure 1B displays the significant increase in HDL-cholesterol heritability when estimated from βFS. HDL-cholesterol heritability estimated from βFS increased from the 10th (h2±SE: 0.44±0.04), 25th (0.50±0.04), 50th (0.53±0.04), 75th (0.61±0.05), to the 90th percentiles (0.62±0.05) of the age- and sex-adjusted HDL-cholesterol distribution.
Quantile regression analyses of sibling HDL subfractions and apoprotein A1 concentrations.
Other HDL measurements were available for sibships but not parent-offspring pairs. Table 1 shows that the classical point-estimates of βFS were significant for apo A1, and HDL2- and HDL3-cholesterol. Figure 2 displays the increases in heritability βFS with increasing quantiles of the HDL2- and HDL3-cholesterol. Quantile regression analyses shows significant sibling concordance for all individual quantiles between the 12th and 95th percentiles of the apo A1 distribution (not displayed), the 5th through the 90th percentiles of the HDL2-cholesterol distribution (Figure 2A), and between the 8th and 90th percentiles of the HDL3-cholesterol distribution (Figure 2B). Heritability increased an average of 0.0036±0.0012 per each percent increase in the offspring’s Apo A-1 concentration (P=0.006), 0.0050±0.0016 per each percent increase in the offspring’s HDL2-cholesterol concentration (P=0.003), and 0.0034±0.0014 per each percent increase in the offspring’s HDL3-cholesterol concentration (P=0.02).
Figure 2.

Full sib regression slopes (βFS) by quantiles of the sibs’ HDL2- and HDL3-cholesterol concentrations, with corresponding estimates of heritability {(8βFSrspouse+1)0.5−1}/(2rspouse) where rspouse is the spouse correlation, 2084 siblings in 789 families). Significance of the linear, quadratic and cubic trends and the 95% confidence intervals (shaded region) determined by 1000 bootstrap samples.
Replication of the HDL-cholesterol results.
There were 2917 offspring from the Framingham Offspring Cohort with one or both parents, and 3679 offspring from the Framingham Third Generation Cohort with one or both parents. When analyzed separately, the increase in h2 with increasing percentiles of the HDL-cholesterol distribution was significant in both the Offspring Cohort (0.0013±0.0007 increase per 1 percent increase in the percentile of the population distribution, P=0.05) and the Third Generation Cohort (0.0030±0.0009 increase, P=0.001). Other HDL components were measured in the Offspring Cohort only and therefore could not be tested for replication.
Gene-environment interaction.
As classically measured by the offspring-parent regression slope, the heritability for HDL-cholesterol increased 0.0091±0.0025 with each unit increase in the Framingham Study physical activity index and decreased −0.0108±0.0029 with every kg/m2 increase in BMI (both P<0.05). These interactions are consistent with quantile-specific heritability of Figure 1A and the increase in HDL-cholesterol concentrations with the Framingham physical activity index (not displayed, P=7.1x10⁻⁶) and its decrease with BMI (not displayed, P<10−16). HDL-cholesterol heritability was also significantly lower in smokers (0.376±0.031) than nonsmokers (0.534±0.019). Intakes of alcohol, carbohydrates and total and saturated fat intake did not interact with HDL heritability in these data.
Discussion
This paper confirms and expands upon our initial findings of quantile-dependent expressivity of HDL-cholesterol based upon its GRSHDL [10]. Nonparametric estimates of offspring-parent and full-sib regression slopes were used as simple robust estimates of heritability. The nearly identical significant increases in slopes we observed for βOP and βFS, and the significant increases in βOP across the two generations when analysed separately, lend strong support to the hypothesis. Quantile specific effects were also suggested for HDL-cholesterol subfractions and apo A1. An important caveat to our analyses is that heritability lacks the specificity of directly measured genotypes. This concern is partly addressed by re-analyzing published studies that measured genetic variants directly from the perspective of quantile-dependent expressivity. Their re-analysis also demonstrates external validity and generalizability. The discussion to follow examines clinically relevant published examples originally interpreted from a precision medicine perspective that might be more simply explained by quantile-dependent expressivity. Specifically, it examines whether the gene-drug and gene-diet interactions they report are attributable to a larger genetic effect size at higher HDL concentrations.
Precision medicine
Precision medicine seeks to individualize drug prescriptions through the use of genetic markers that identify patients most likely to benefit from specific treatments [8,9]. Quantile-dependent expressivity postulates that some genetic markers simply trace the heritability increase with increasing plasma HDL concentrations [10]. For example, Herrington et al. proposed that a sequence variant (IVS1–401) for the gene encoding estrogen receptor α (ER-α) could be used to identify postmenopausal women most likely to benefit from estrogen replacement therapy [24]. The histogram in Figure 3A presents their result from their precision medicine perspective, i.e., that women who had the IVS1–401C/C genotype had over twice the increase in HDL-cholesterol on estrogen treatment as other postmenopausal women (0.34 vs. 0.16 mmol/L, P=0.004) [24]. The Figure 3A line graph shows an alternative interpretation of the results from the perspective of quantile-dependent expressivity, i.e. that average HDL-cholesterol levels were higher post-treatment (1.39 mmol/L) than pre-treatment (1.20 mmol/L) and that the HDL-cholesterol difference between genotypes was greater at the higher post-treatment HDL levels (1.57-1.34=0.23 mmol/L) than at the lower pre-treatment HDL levels (1.24-1.19=0.05 mmol/L), consistent with quantile-dependent expressivity. The larger genetic effect size at the higher (post-treatment) than lower (pre-treatment) HDL concentrations mandates that the effects of the genotypes cannot move in parallel when HDL is increased pharmacologically. Subtracting the pre-treatment from the post-treatment HDL-cholesterol levels will necessarily create a relatively greater HDL increase for the CC genotype with the higher post-treatment HDL level vis-à-vis carriers of the T-allele with the lower post-treatment level.
Figure 3.

Precision medicine perspective of mean HDL-cholesterol change by genotype (histogram inserts) and the quantile-dependent expressivity perspective (line graph) of larger genetic effect size when average HDL-cholesterol concentrations were high vs. low, requiring nonparallel HDL change by genotype, for: A) Herrington et al.’s 2002 report [24] of significantly greater HDL-cholesterol increase during estrogen replacement therapy in 58 CC homozygotes than 247 carriers of the T-allele for intervening sequence 1 at position 401 of the estrogen receptor α gene (ER-α) (P=0.004); B) Mahungu et al. 2009 report [2] of significantly greater HDL-cholesterol increase during first-line Efavirenz-based regimine in five TT homozygotes than in 71 G-carriers of the cytochrome P450 2B6 (CYP2B6) gene (Pinteraction=0.024); C) Chang et al.’s 2011 report [7] of significantly greater HDL-cholesterol reduction during tamoxifen therapy in 12 carriers of the G-allele than 22 AA homozygotes of the epidermal growth factor receptor ErbB-2 (HER2) codon 655 (P=0.04); D) Brautbar et al.’s 2011 report [26] of significantly greater HDL-cholesterol increases during statin/fenofibrate treatment per dose of the G-allele of rs3741298 in the APOA5-ZNF259 gene region (P=1.8x10⁻⁷); E) Ballantyne et al.’s 2000 report [27] of significantly greater HDL-cholesterol increase during fluvastatin treatment in 9 APOE e2e3 than both 90 E3E3 or 46 e3e3 or e4e4 genotypes; and F) Nicklas et al.’s 2002 report [30] of loss of significant HDL-cholesterol difference from going from their usual to a AHA step1 diet in 18 APOE ε4-carriers and 61 noncarriers.
Figure 3B presents the results for Efavirenz, a non-nucleoside reverse transcriptase inhibitor (NNRTI) for treating immunodeficiency virus (HIV) infection that increases HDL-cholesterol concentrations. Mahungu et al. [2] reported that first-line Efavirenz-based regimines produced significantly greater HDL increases in TT homozygotes of the cytochrome P450 2B6 (CYP2B6) gene than G-carriers (0.72±0.28 vs. 0.28±0.05 mmol/L increases, P=0.03, Figure 3B histogram). However, the line-graph shows that this could be due in part to a larger post-treatment CYP2B6 genetic effect size (0.42 mmol/L) when average HDL-concentrations were high (1.45 mmol/L) compared to the smaller pre-treatment effect size (−0.02 mmol/L) when average HDL-cholesterol concentrations were low (1.14 mmol/L). Another study, by Alonso-Villaverde et al., reported that C3435T polymorphism of the multidrug resistance gene 1 (MDR-1) affected efavirenz-induced HDL increases in HIV-infected patients: a 0.07 mmol/L increase in TT homozygotes, a 0.13 mmol/L increase in CT heterozygotes, and a 0.45 mmol/L increase in CC homozygotes (Pinteraction=0.02) [3]. In part, this could be due to a larger post-treatment effect size (0.2 mmol/L per dose of the C allele) when average post-treatment HDL-cholesterol was high (average 1.22 mmol/L) compared to smaller pre-treatment effect size (0.01 mmol/L per dose) when average pre-treatment HDL-cholesterol concentrations were lower (average 1.03 mmol/L, estimated from their figure).
Tamoxifen is a partial estrogen receptor agonist that lowers the risk for breast cancer reoccurrence, but may adversely affect triglyceride and HDL-cholesterol concentrations. Chang et al. [7] reported that breast cancer patients who carried the G-allele of the epidermal growth factor receptor ErbB-2 (HER2) codon 655 experienced larger reductions in plasma HDL-cholesterol levels under tamoxifen therapy than AA homozygotes (P=0.04, Figure 3C histogram). They advised considering the HER2 655 polymorphism to prevent cardiovascular events in breast cancer patients after tamoxifen therapy. However, tamoxifen decreased average HDL-cholesterol concentration from 1.42±0.07 to 1.21±0.05 mmol/L while the difference between G-carriers and AA homozygotes went from 0.245 to 0.071 mmol/L, consistent with quantile-dependent expressivity.
We have previously reported that the effect of CETP rs3764261 risk allele was 2.4-fold greater at the 90th than the 10th percentile of the HDL-cholesterol distribution [10]. This quantile dependence could account for Leusink et al. report that each copy of the rs3764261 T-allele increased HDL-cholesterol an additional 0.02 mmol/L in response to statin treatment (P=6x10⁻⁵) [25]. Cross-sectionally, each copy of the T allele is associated with an HDL-cholesterol increase of 0.089 mmol/L in untreated patients (P=7x10−380) [16], and the additional increase reported by Leusink et al. would accentuate the effect of the T-allele in statin-treated patients cross-sectionally, in accordance with quantile-dependent expressivity
Figure 3D present results for treating dyslipoproteinemia with a statin-fenofibrate combination therapy. Brautbar et al. reported that the HDL-cholesterol response to combined statin and fenofibrate therapy in patients with mixed dyslipidemia was significantly associated with rs3741298 in the APOA5-ZNF259 gene region (P=1.8x10⁻⁷) [26]. From a precision medicine perspective, the histogram shows significantly greater increases in HDL in accordance with zero, one or two doses of the G-allele. Alternatively, from the perspective of quantile-dependent expressivity, the genetic effect size was greater following treatment when average HDL-cholesterol concentration were elevated, and smaller before treatment when HDL-cholesterol concentrations were low.
Figure 3E presents Ballantyne et al. report of significantly greater HDL-cholesterol increases in APOE ε2ε3 genotypes than ε3ε3 (P=0.002) or ε4-carriers (P=0.02) from 40 mg/d fluvastatin [27]. The treatment significantly increased average HDL-cholesterol concentrations from 1.12±0.02 to 1.17±0.02 mmol/L, and consistent with quantile dependent expressivity, increased the genetic effect size (ε2/3 minus ε4-carriers) from 0.03±0.14 to 0.13±0.13 mmol/L).
Diet
Meta-analyses by Mensink et al. show that each 1% isoenergetic replacement of carbohydrates with fat increases plasma HDL-cholesterol concentrations by an average of 0.010 mmol/L for saturated, 0.008 for monounsaturated, and 0.006 mmol/L for polyunsaturated fat [4]. Adherence to a Mediterranean diet increases plasma HDL concentrations by an average of 0.030 mmol/L [6]. Low carbohydrate intake may cause HDL-cholesterol to accumulate when cholesteryl ester-triglyceride exchange is reduced due to lower hepatic VLDL production when hepatic fatty acid oxidation is increased [5]. Several papers show gene-diet interactions that might also be explained, at least in part, by larger genetic effects when HDL-cholesterol concentrations are elevated due to higher fat diets.
Whether APOE genotypes actually affect the HDL response to replacing fat with carbohydrate is unclear. The two studies that show that ε4-carriers have the greatest HDL-decrease are also the studies in which ε4-carriers have higher HDL-cholesterol on higher fat diet [28,29], and the two that show non-ε4-carriers have the greatest HDL-decrease are the ones in which non-ε4-carriers have the higher HDL-cholesterol on higher fat diet [30,31]. All four studies suggest that reducing HDL-cholesterol by exchanging carbohydrate for fat produces smaller APOE genotype differences. Specifically, Nicklas et al. reported that noncarriers of the APOE ε4 allele (ε4-) showed larger decreases in HDL-cholesterol (−0.26 mmol/L) than carriers (−0.08 mmol/L, Figure 3F histogram), in going from their usual diet to a low-fat, low-cholesterol AHA Step 1 diet (Pinteraction<0.01) [30]. Figure 4F’s graph shows the effect size (ε4 non-carriers minus carriers) was smaller on the Step 1 than the usual diet (0.03±0.06 vs. 0.21±0.07 mmol/L) in accordance with the lower average HDL-cholesterol concentration of the Step 1 diet (1.23±0.03 vs. 1.45±0.04 mmol/L).
Figure 4.

Precision medicine perspective of mean HDL-cholesterol change by genotype (histogram inserts) and the quantile-dependent expressivity perspective (line graph) of larger genetic effect size when average HDL-cholesterol concentrations were high vs. low, requiring nonparallel HDL change by genotype, for: A) Lopez-Miranda et al.’s 1994 report [31] of HDL-cholesterol decrease in switching from an average American diet of 39% fat to a 26% fat diet in 13 APOE ε3ε2, 60 ε3ε3, and 10 ε3ε4 males (Pinteraction <0.05); B) Cobb et al.’s 1992 report [28] on switching from a 48% carbohydrate, 37% fat, 0.2 P:S-ratio diet to a 60% carbohydrate, 28% fat, 2.4 P:S-ratio diet in 13 APOE ε2-carriers, 44 ε3ε3, and 8 ε4-carriers; C) Tamasawa et al.’s 2003 report [29] of the greater HDL-cholesterol reduction from going on a 50–55% carbohydrate, 20% protein and 25–30% fat diet in 24 APOE ε4 carriers than 80 non-carriers; D) Tikkanen et al.’s report [32] of significantly greater HDL-cholesterol reductions from switching from a regular to low-fat low-cholesterol diet in 64 X2 carriers of the cutting site (X2+) of the APOB XbaI polymorphism vs 39 X1X1 homozygotes; E) Xu et al.’s 1990 report [33] of significantly greater apo A1 reductions in switching from a basal to low-fat high P/S-ratio diet in 16 X+X+, 50X+X−, and 41X−X− genotypes of the APOB XbaI polymorphism (P<0.05); F) Silver et al.’s 2012 report [35] of a significantly greater HDL-cholesterol increases in females switching from a low-fat to high-fat diet in 36 carriers of the H3-haplotype of the CB1 G protein-coupled receptors of the endocannabinoid system vs. 35 noncarriers.
Lopez-Miranda et al. also reported that switching from a 39% fat diet to a 26% fat diet produced a significantly greater HDL-cholesterol decrease in ε3ε3 than ε3ε4 males (0.21 vs. 0.13 mmol/L, P<0.05) [31]. Figure 4A suggest the their results may be attributable to a reduction in the genotype difference (ε2ε3/ε3ε3-ε3ε4: 0.103 vs. 0.026 mmol/L) in accordance with a decrease in average HDL-cholesterol concentrations between diets (from 1.229±0.039 to 1.031±0.030 mmol/L). Among studies suggesting a greater effect in ε4 carriers is Cobb et al.’s report of switching from a 48% carbohydrate, 37% fat, low P:S ratio diet to a 60% carbohydrate, 28% fat, high P:S ratio [28]. Figure 4B suggest the genotype difference they reported could be attributable to a larger effect size on the higher fat diet. Another example is Tamasawa et al.’s report (Figure 4C) before and after a 4-6 week 50–55% carbohydrate, 20% protein and 25–30% fat diet that decreased HDL-cholesterol by 0.125 mmol/L in ε4-carriers vs. 0.03 mmol/L in noncarriers [29]. Quantile-dependent expressivity would attribute their results to the reduction in the APOE effect size (ε4 carriers minus noncarriers) from 0.17±0.11 mmol/L at baseline to 0.08±0.10 mmol/L post-diet while average HDL-cholesterol decreased from 1.41 mmol/L at baseline to 1.36 mmol/L.
Several reports describe gene-diet interactions for the APOB XbaI polymorphism that are consistent with quantile-dependent expressivity. Figure 4D shows that switching to a low-fat low-cholesterol diet produced significantly greater HDL-cholesterol reductions in X2 carriers (restriction site present) than X1X1 homozygotes (0.26±0.02 vs. 0.17±0.02 mmol/L, P=0.008) in Tikkanen et al.’s 1990 report [32]. As predicted, the genotype difference between X2 carriers vs X1X1 homozygotes was greater on the baseline diet than on the low-fat diet (0.12±0.06 vs. 0.02±0.05) consistent with their higher HDL-cholesterol on the baseline diet (1.44±0.03 vs. 1.22±0.03 mmol/L). In another study, Xu et al. reported that switching to the low-fat diet reduced average apo A1 concentrations from 1.58±0.01 to 1.51±0.02 g/L [33]. Figure 4E shows that apo A1 reductions also differed by APOB XbaI genotype, which again can be attributed to the smaller genetic effect size at the lower post-treatment apo A1 concentrations. A subsequent study by Pajukanta et al. also reported significant APOB XbaI genotype differences in the HDL2-cholesterol response to lower dietary fat intake [34], although this time the HDL2-reductions was reported to be greater in the X1X1 homozygotes. Nevertheless, difference between genotypes remained greater on the higher fat diets when the average HDL-cholesterol levels were high vis-à-vis the lower fat diets when overall concentrations were reduced [34].
Finally, the histogram of Figure 4F displays Silver et al.’s 2012 findings of significantly greater HDL increases when switching to a high-fat from a low-fat diet for female carriers of the H3 haplotype of the CB1 G protein-coupled receptor (CNR1) of the endocannabinoid system vs. noncarriers (P=0.007) [35]. The high-fat diet increased the average HDL-cholesterol concentration from 1.28±0.03 to 1.56±0.03 mmol/L (P<0.001) and increased the effect size between carriers and noncarriers from −0.02±0.06 to 0.13±0.06 mmol/L. In men, switching from the low to the high-fat diet increased average HDL-cholesterol from 1.04±0.01 to 1.20±0.01 mmol/L, with the increase again being significantly larger in H3 carriers than noncarriers (0.19±0.01 vs. 0.16±0.01 mmol/L, P=0.03). Quantile-dependent expressivity suggests that the difference between genotypes may be partially due to a larger effect size on the high-fat than low-fat diet (0.05±0.03 vs. 0.01±0.03 mmol/L).
Limitations.
It is well recognized that statistical interactions need not imply the existence of biological interactions [36,37]. It is not our contention that all purported markers of drug or diet efficacy are attributable to quantile-dependent expressivity. With the possible exception of CETP polymorphisms, the proportion of the HDL heritability attributable to any specific SNP is generally too small to noticeably affect h2 [15,16]. The paper does not consider the interactive effects of triglycerides and HDL. The competing effects of HDL and triglyceride quantile-dependent expressivity in the context of their inverse relationship are complicated and warrants further investigated [11,12]. We also caution that HDL cholesterol levels are not an adequate surrogate measure of the HDL particle metabolism, physiology, or functionality. Functional properties of HDL are more important physiologically than their cholesterol-carrying capacity, and on occasion very large, cholesterol-rich, HDL particles are dysfunctional [38].
In conclusion, our analyses show that HDL-heritability differs depending upon whether the level of the phenotype (HDL) is high or low relative to its population distribution. Precision medicine is based on the premise that genetic markers identify patients most likely to benefit from drugs, diet, or other treatments [8], whereas quantile-dependent expressivity postulates that these genetic markers simply trace the heritability increase with increasing plasma HDL concentrations. From a clinical perspective, claims that genetic markers can identify patients most likely to benefit from estrogen replacement therapy, non-nucleoside reverse transcriptase inhibitors, tamoxifen, statin, or diet therapy should warrant caution.
Supplementary Material
Acknowledgement
The Framingham Heart Study is conducted and supported by the National Heart, Lung, and Blood Institute (NHLBI) in collaboration with Boston University (Contract No. N01-HC-25195 and HHSN268201500001I). This manuscript was not prepared in collaboration with investigators of the Framingham Heart Study and does not necessarily reflect the opinions or views of the Framingham Heart Study, Boston University, or NHLBI.
Funding: This research was supported by grant R21ES020700 from the National Institute of Environmental Health Sciences, and an unrestricted gift from HOKA ONE ONE.
Footnotes
Publisher's Disclaimer: This is a PDF file of an unedited manuscript that has been accepted for publication. As a service to our customers we are providing this early version of the manuscript. The manuscript will undergo copyediting, typesetting, and review of the resulting proof before it is published in its final form. Please note that during the production process errors may be discovered which could affect the content, and all legal disclaimers that apply to the journal pertain.
Conflicts of interest: None to report.
Ethics Statement: Human Research. Use of the Framingham Cohort data for analysis was approved by the Lawrence Berkeley National Laboratory Human Subjects Committee (HSC). Approval 107H021-13MR20. The data were analyzed anonymously
References
- 1.National Cholesterol Education Program (NCEP) Expert Panel on Detection, Evaluation, and Treatment of High Blood Cholesterol in Adults (Adult Treatment Panel III). Third Report of the National Cholesterol Education Program (NCEP) Expert Panel on Detection, Evaluation, and Treatment of High Blood Cholesterol in Adults (Adult Treatment Panel III) final report. Circulation. 2002;106:3143–421. [PubMed] [Google Scholar]
- 2.Mahungu TW, Nair D, Smith CJ, Egan D, Youle M, Johnson MA, et al. The relationships of ABCB1 3435C>T and CYP2B6 516G>T with high-density lipoprotein cholesterol in HIV-infected patients receiving Efavirenz. Clin Pharmacol Ther. 2009;86:204–11. [DOI] [PubMed] [Google Scholar]
- 3.Alonso-Villaverde C, Coll B, Gómez F, Parra S, Camps J, Joven J, Masana L. The efavirenz-induced increase in HDL-cholesterol is influenced by the multidrug resistance gene 1 C3435T polymorphism. AIDS. 2005;19:341–2. [PubMed] [Google Scholar]
- 4.Mensink RP, Zock PL, Kester AD, Katan MB. Effects of dietary fatty acids and carbohydrates on the ratio of serum total to HDL cholesterol and on serum lipids and apolipoproteins: a meta-analysis of 60 controlled trials. Am J Clin Nutr 2003;77:1146–55. [DOI] [PubMed] [Google Scholar]
- 5.Siri PW, Krauss RM. Influence of dietary carbohydrate and fat on LDL and HDL particle distributions. Curr Atheroscler Rep 2005;7:455–9. [DOI] [PubMed] [Google Scholar]
- 6.Kastorini CM, Milionis HJ, Esposito K, Giugliano D, Goudevenos JA, Panagiotakos DB. The effect of Mediterranean diet on metabolic syndrome and its components: a meta-analysis of 50 studies and 534,906 individuals. J Am Coll Cardiol. 2011;57:1299–313. [DOI] [PubMed] [Google Scholar]
- 7.Chang NW, Chen DR, Chen FN, Lin C, Wu CT. HER2 codon 655 G-allele is associated with reductions in plasma high-density lipoprotein levels in breast cancer patients treated with tamoxifen. J Investig Med. 2011;59:1252–7. [DOI] [PubMed] [Google Scholar]
- 8.Antman EM, Loscalzo J. Precision medicine in cardiology. Nat Rev Cardiol. 2016;13:591–602. [DOI] [PubMed] [Google Scholar]
- 9.Ferguson JF, Allayee H, Gerszten RE, Ideraabdullah F, Kris-Etherton PM, Ordovás JM, et al. Nutrigenomics, the microbiome, and gene-environment interactions: New directions in cardiovascular disease research, prevention, and treatment: A scientific statement from the American Heart Association. Circ Cardiovasc Genet. 2016;9:291–313. [DOI] [PMC free article] [PubMed] [Google Scholar]
- 10.Williams PT. Quantile-specific penetrance of genes affecting lipoproteins, adiposity and height. PLoS One. 2012;7:e28764. [DOI] [PMC free article] [PubMed] [Google Scholar]
- 11.Williams PT. Gene-environment interactions due to quantile-specific heritability of triglyceride and VLDL concentrations. Sci Rep. 2020;10:4486. [DOI] [PMC free article] [PubMed] [Google Scholar]
- 12.Williams PT. Quantile-dependent expressivity of postprandial lipemia. PLoS One. 2020;15:e0229495. [DOI] [PMC free article] [PubMed] [Google Scholar]
- 13.Williams PT. Quantile-specific heritability may account for gene-environment interactions involving coffee consumption. Behav Genet. 2020;50:119–126 [DOI] [PMC free article] [PubMed] [Google Scholar]
- 14.Williams PT. Spirometric traits show quantile-dependent heritability, which may contribute to their gene-environment interactions with smoking and pollution. Peer J. 2020;8:e9145. [DOI] [PMC free article] [PubMed] [Google Scholar]
- 15.Teslovich TM, Musunuru K, Smith AV, Edmondson AC, Stylianou IM, Koseki M, et al. Biological, clinical and population relevance of 95 loci for blood lipids. Nature 2010; 466:707–713. [DOI] [PMC free article] [PubMed] [Google Scholar]
- 16.Willer CJ, Schmidt EM, Sengupta S, Peloso GM, Gustafsson S, Kanoni S, et al. Discovery and refinement of loci associated with lipid levels. Nat Genet. 2013;45:1274–83. [DOI] [PMC free article] [PubMed] [Google Scholar]
- 17.Koenker R, Hallock KF. Quantile regression. J Economic Perspectives. 2001;15:143–56. [Google Scholar]
- 18.Gould WW. Quantile regression with bootstrapped standard errors. Stata Technical Bulletin. 1992;9:19–21. [Google Scholar]
- 19.Kannel WB, Feinleib M, McNamara PM, Garrison RJ, Castelli WP. An investigation of coronary heart disease in families: the Framingham Offspring Study. Am J Epidemiol 1979;110:281–90. [DOI] [PubMed] [Google Scholar]
- 20.Splansky GL, Corey D, Yang Q, Atwood LD, Cupples LA, Benjamin EJ, et al. The Third Generation Cohort of the National Heart, Lung, and Blood Institute's Framingham Heart Study: design, recruitment, and initial examination. Am J Epidemiol. 2007;165:1328–35. [DOI] [PubMed] [Google Scholar]
- 21.Karlin S, Cameron EC, Williams PT. Sibling and parent-offspring correlation estimation with variable family size. Proc Natl Acad Sci U S A. 1981;78:2664–8. [DOI] [PMC free article] [PubMed] [Google Scholar]
- 22.Winer BJ, Brown DR, Michels KM. 1991. Statistical principles in experimental design. Third edition. McGraw-Hill; New York, NY. [Google Scholar]
- 23.Falconer DS, Mackay TFC. Introduction to Quantative Genetics. 4th edition. 2004. Pearson Education Limited; London: ISBN 978-81-317-2740-9 [Google Scholar]
- 24.Herrington DM, Howard TD, Hawkins GA, Reboussin DM, Xu J, Zheng SL, et al. Estrogen-receptor polymorphisms and effects of estrogen replacement on high-density lipoprotein cholesterol in women with coronary disease. N Engl J Med. 2002;346:967–74. [DOI] [PubMed] [Google Scholar]
- 25.Leusink M, Onland-Moret NC, Asselbergs FW, Ding B, Kotti S, van Zuydam NR, et al. Cholesteryl ester transfer protein polymorphisms, statin use, and their impact on cholesterol levels and cardiovascular events. Clin Pharmacol Ther. 2014;95:314–20. [DOI] [PubMed] [Google Scholar]
- 26.Brautbar A, Covarrubias D, Belmont J, Lara-Garduno F, Virani SS, Jones PH, et al. Variants in the APOA5 gene region and the response to combination therapy with statins and fenofibric acid in a randomized clinical trial of individuals with mixed dyslipidemia. Atherosclerosis 2011;219:37–742. [DOI] [PMC free article] [PubMed] [Google Scholar]
- 27.Ballantyne CM, Herd JA, Stein EA, Ferlic LL, Dunn JK, Gotto AM Jr, Marian AJ. Apolipoprotein E genotypes and response of plasma lipids and progression-regression of coronary atherosclerosis to lipid-lowering drug therapy. J Am Coll Cardiol. 2000;36:1572–8. [DOI] [PubMed] [Google Scholar]
- 28.Cobb MM, Teitlebaum H, Risch N, Jekel J, Ostfeld A. Influence of dietary fat, apolipoprotein E phenotype, and sex on plasma lipoprotein levels. Circulation. 1992;86:849–57. [DOI] [PubMed] [Google Scholar]
- 29.Tamasawa N, Murakami H, Yamato K, Matsui J, Tanabe J, Suda T. Influence of apolipoprotein E genotype on the response to caloric restriction in type 2 diabetic patients with hyperlipidaemia. Diabetes Obes Metab. 2003;5:345–8. [DOI] [PubMed] [Google Scholar]
- 30.Nicklas BJ, Ferrell RE, Bunyard LB, Berman DM, Dennis KE, Goldberg AP. Effects of apolipoprotein E genotype on dietary-induced changes in high-density lipoprotein cholesterol in obese postmenopausal women. Metabolism. 2002;51:853–8. [DOI] [PubMed] [Google Scholar]
- 31.Lopez-Miranda J, Ordovas JM, Mata P, Lichtenstein AH, Clevidence B, Judd JT, et al. Effect of apolipoprotein E phenotype on diet-induced lowering of plasma low density lipoprotein cholesterol. J Lipid Res. 1994;35:1965–75. [PubMed] [Google Scholar]
- 32.Tikkanen MJ, Xu CF, Hämäläinen T, Talmud P, Sarna S, Huttunen JK, et al. XbaI polymorphism of the apolipoprotein B gene influences plasma lipid response to diet intervention. Clin Genet. 1990;37:327–34. [DOI] [PubMed] [Google Scholar]
- 33.Xu CF, Boerwinkle E, Tikkanen MJ, Huttunen JK, Humphries SE, Talmud PJ. Genetic variation at the apolipoprotein gene loci contribute to response of plasma lipids to dietary change. Genet Epidemiol. 1990;7:261–75. [DOI] [PubMed] [Google Scholar]
- 34.Pajukanta PE, Valsta LM, Aro A, Pietinen P, Heliö T, Tikkanen MJ. The effects of the apolipoprotein B signal peptide (ins/del) and XbaI polymorphisms on plasma lipid responses to dietary change. Atherosclerosis. 1996;122:1–10. [DOI] [PubMed] [Google Scholar]
- 35.Silver HJ, Niswender KD, Keil CD, Jiang L, Feng Q, Chiu S, et al. CNR1 genotype influences HDL-cholesterol response to change in dietary fat intake. PLoS One. 2012;7:e36166. [DOI] [PMC free article] [PubMed] [Google Scholar]
- 36.Siemiatycki J, Thomas DC. Biological models and statistical interactions: an example from multistage carcinogenesis. Int J Epidemiol. 1981;10:383–7. [DOI] [PubMed] [Google Scholar]
- 37.Thompson WD. Effect modification and the limits of biological inference from epidemiologic data. J Clin Epidemiol. 1991;44:221–32. [DOI] [PubMed] [Google Scholar]
- 38.Rosenson RS, Brewer HB Jr, Barter PJ, Björkegren JLM, Chapman MJ, Gaudet D, Kim DS, Niesor E, Rye KA, Sacks FM, Tardif JC, Hegele RA. HDL and atherosclerotic cardiovascular disease: genetic insights into complex biology. Nat Rev Cardiol. 2018;15:9–19. [DOI] [PubMed] [Google Scholar]
Associated Data
This section collects any data citations, data availability statements, or supplementary materials included in this article.