

Abstract
Background:
Diffusion MRI is routinely used to evaluate brain injury in neonatal encephalopathy. Though abnormal mean diffusivity (MD) is often attributed to cytotoxic edema, the specific contribution from neuronal pathology is unclear.
Purpose:
To determine whether MD from high-resolution diffusion tensor imaging (DTI) can detect variable degrees of neuronal degeneration and pathology in piglets with brain injury induced by excitotoxicity or global hypoxia-ischemia (HI) with or without overt infarction.
Study Type:
Prospective.
Animal Model:
Excitotoxic brain injury was induced in 6 neonatal piglets by intrastriatal stereotaxic injection of the glutamate receptor agonist quinolinic acid (QA). Three piglets underwent global HI or sham procedure. Piglets recovered for 20–96 hours before undergoing MRI (n=9).
Field Strength/Sequence:
3.0T MRI with DTI, T1- and T2-weighted imaging.
Assessment:
MD, fractional anisotropy (FA), and qualitative T2 injury were measured in putamen and caudate. The cell bodies of normal neurons, degenerating neurons (excitotoxic necrosis, ischemic necrosis, or necrosis-apoptosis cell death continuum), and injured neurons with equivocal degeneration were counted by histopathology.
Statistical Tests:
Spearman correlations were used to compare MD and FA to normal, degenerating, and injured neurons. T2 injury and neuron counts were evaluated by descriptive analysis.
Results:
The QA insult generated titratable levels of neuronal pathology. In QA, HI, and sham piglets, lower MD correlated with higher ratios of degenerating-to-total neurons (p<0.05), lower ratios of normal-to-total neurons (p<0.05), and greater numbers of degenerating neurons (p<0.05). MD did not correlate with abnormal neurons exhibiting nascent injury (p>0.99). Neuron counts were not related to FA (p>0.30) or to qualitative injury from T2-weighted MRI.
Data Conclusion:
MD is more accurate than FA for detecting neuronal degeneration and loss during acute recovery from neonatal excitotoxic and HI brain injury. MD does not reliably detect non-fulminant, nascent, and potentially reversible neuronal injury.
Keywords: magnetic resonance imaging, diffusion tensor imaging, infant, brain injuries, cell death
INTRODUCTION
Hypoxic-ischemic encephalopathy (HIE) from birth asphyxia causes persistent moderate-to-severe disabilities in more than a third of survivors (1). Difficulty in treating the brain injury may be related to the uncertain onset, duration, and severity of the sentinel injury (2) and neural cell degeneration that persists despite therapeutic hypothermia (3–5). Early MRI could help clarify which neonates need adjuvant treatments during therapeutic hypothermia (6).
T2 and diffusion tensor imaging (DTI) MRI are routinely used to evaluate HIE clinically (7–9). DTI uses a Gaussian model to characterize water diffusion profiles in three dimensions. Decreases in the DTI apparent diffusion coefficient (ADC), which are detectable soon after brain hypoxia-ischemia (HI), are often attributed to cytotoxic edema (10). Mean diffusivity (MD) is the average of ADCs measured along multiple directions, and fractional anisotropy (FA) measures the anisotropy of water diffusion in different directions (11,12).
Because the ability to detect brain injury by MRI varies by patient age (13) and time from the sentinel injury (2), the accuracy of clinical MRI for detecting early and emerging HIE is unclear. Nascent irreversible or reversible neuronal injury, small proportions of selectively vulnerable neurons, and a mix of infarcted and non-infarcted regions soon after HI may raise the complexity of MRI interpretation. Moreover, diffusion MRI may not detect all types of cell death (14). HIE causes cell death by ischemic necrosis, apoptosis, and the necrosis-apoptosis cell death continuum (15,16). Neurons, oligodendrocytes, and astrocytes have different vulnerabilities to HI and hypothermia (3,4,17,18), and information on the specific neuronal contribution to the MRI signal is limited. Identifying whether MRI provides information about specific cell types would advance treatment strategies that target certain cell populations.
We sought to develop MRI protocols in piglets recovered from excitotoxic or global HI brain injury to test whether diffusion MRI detects early neuronal injury or irreversible neuronal degeneration in putamen and caudate, two areas commonly injured in HIE (7,8). Excitotoxicity is integral to the pathogenesis of HI brain damage (19). Indeed, the necrosis-apoptosis cell death continuum in HI was identified in part by investigators studying the excitotoxicity induced by NMDA glutamate receptor agonist quinolinic acid (QA) (20). Newborn piglets were chosen for this study because their brains have a developmental status similar to that of human newborns at term gestation (21), and the regional distribution of neuropathology seen in human term newborn HIE is mimicked in piglet HI (22).
This study tested the hypothesis that MD from a clinical scanner would detect irreversible neuronal degeneration, loss of normal neurons, and injured neurons with unclear fate. The injured neuron classification consisted of equivocally degenerating neurons that had the potential to survive, to be therapeutically rescued, or to progress to cell death. (23,24). The study also tested the associations of FA and qualitative injury on T2-weighted MRI with neuronal degeneration, loss, and injury. DTI rather than conventional diffusion-weighted MRI was used because DTI provides more information, including FA.
MATERIALS AND METHODS
Twenty-one neonatal male piglets underwent stereotaxic QA injection, global HI injury, or sham procedure. Three additional male piglets that did not receive surgical anesthesia or brain injury were used to demonstrate the presence of NMDA receptor subunits in target brain regions. The Animal Care and Use Committee approved all protocols, which were in compliance with the United States Public Health Service Policy on the Humane Care and Use of Laboratory Animals and the Guide for the Care and Use of Laboratory Animals.
Anesthesia for the Piglet Encephalopathy Models
Piglets were anesthetized with isoflurane 5% in nitrous oxide/oxygen 50%/50% and intubated for mechanical ventilation. After intubation, the anesthetic was changed to isoflurane 2% with nitrous oxide/oxygen 70%/30%. Catheters were placed in the external jugular vein for administration of fentanyl (20 μg/kg bolus+20 μg/kg/h, intravenous [IV]). A femoral arterial catheter provided continuous heart rate and blood pressure monitoring. Isoflurane was discontinued after catheter placement. Piglets were kept on a warming blanket for a goal rectal temperature of 38.5–39.5°C and recovered from anesthesia after the brain injury protocols described below.
Excitotoxic Brain Injury Model
Six anesthetized piglets (2–4 days old, 1.0–2.2 kg) were placed into a stereotaxic head frame. Bilateral cranial burr holes 2–3 mm in diameter were drilled 12 mm lateral to midline and 10 mm anterior to the bregma suture. A sterile needle was advanced 15 mm ventrally to target the putamen. QA in phosphate-buffered saline (PBS, pH 7.4) was administered into the right brain in one of three doses: 240 nmol (4 μL), 720 nmol (12 μL), or 960 nmol (16 μL). PBS in equal volume was injected into the left brain. The putamens from the first 2 piglets were histologically assessed by investigators experienced in neuropathology (LJM, JKL), and the injection coordinates were subsequently adjusted to be 10 mm lateral to midline to better target the putamen. Piglets then recovered from anesthesia. Twenty to 96 hours later, piglets underwent a second anesthetic for MRI as described below.
Global Hypoxic-Ischemic Brain Injury
Ten separate male piglets (2–3 days old, 1–2 kg) underwent HI according to a previously published protocol (5,17,18,25). The piglets were randomized to HI or sham procedure with recovery times ranging from 6 to 45 hours. In addition to undergoing the anesthetic described above, piglets were administered vecuronium (0.2 mg/kg/h, IV) to prevent ventilatory effort during hypoxia and asphyxia. The inhaled oxygen concentration was reduced to 10% for 45 minutes to induce hypoxia. Then, piglets received 5 minutes of room air. The endotracheal tube was subsequently clamped for 8 minutes to cause asphyxia. The piglets were resuscitated with chest compressions, 50% oxygen, and epinephrine 100 μg/kg IV.
After return of spontaneous circulation, anesthesia was maintained for 3 hours to allow time for the piglets to regain cardiovascular stability and for the neuromuscular blockade to wear off. Temperature, mean arterial blood pressure (MAP), heart rate, end-tidal carbon dioxide (ETCO2), and arterial blood gas data were recorded in 1- to 15-minute intervals during hypoxia and asphyxia and then at least hourly. Five piglets underwent the sham procedure and received the same anesthetic without hypoxia or asphyxia. Piglets that received their MRI 6 hours after HI or sham procedure were transitioned to an IV anesthetic, and those that received their MRI >12 hours later were recovered from anesthesia.
Anesthesia for MRI
Seventeen piglets received MRIs after successful HI, QA injection, or sham procedure protocols. For imaging 6 hours after resuscitation from HI or time equivalent after sham procedure, five piglets were transitioned from nitrous oxide to propofol with continuation of the fentanyl. Twelve recovered from anesthesia and were extubated after their injury protocols. These piglets had anesthesia re-induced with isoflurane 5% and nitrous oxide/oxygen 50%/50% for tracheostomy. A tracheal tube was used to bypass potential post-extubation laryngeal swelling from the first intubation. The inhaled anesthetic was titrated off as the piglets were transitioned to propofol (7.5 mg/kg/h [IV] plus as-needed 1–2 mg/kg boluses and infusion increases by 2 mg/kg/h) and fentanyl (100 μg/kg/h [IV], plus as-needed 12.5 mcg/kg boluses and infusion increases by 12.5 mcg/kg/h). Dopamine was started when necessary at 5 mcg/kg/min and titrated to maintain MAP ≥45 mmHg to minimize the risk of cerebral hypoperfusion (26). During the MRI scan, piglets were mechanically ventilated to maintain normocapnia and administered 50%/50% oxygen/air. Vital signs were recorded every 15 minutes.
MRI Sequences and Interpretation
Coronal T1/T2-weighted and DTI data were obtained in a 3T clinical scanner (Prisma; Siemens, Erlangen, Germany) with a 15-channel knee coil. For T1-weighted MRI, a 3D magnetization-prepared rapid acquisition with gradient echo (MPRAGE) was applied with the following parameters: TR/TE/flip angle = 12 ms/5 ms/9; shot-to-shot interval = 2200 ms; matrix size 128×112×72 and imaging field of view 100×90×72 mm3; generalized auto-calibrating partial parallel acquisition (GRAPPA) factor = 2; number of signal averaged (NEX) = 5; and imaging duration = 14 minutes. For T2-weighted MRI, a 2D turbo-spin-echo (TSE) sequence was applied with the parameters TR = 5920 ms; TE = 92 ms; slice thickness = 1.2 mm; number of slices = 42, matrix size = 256×256 and FOV = 100×100 mm2; GRAPPA factor = 2; NEX = 15; imaging duration = 15 minutes.
Diffusion MRI data were acquired by a single-shot, diffusion-weighted, spin-echo echo-planar sequence using the parameters TR = 4800 ms; TE = 73 ms; in-plane matrix size = 128×128; NEX = 2; and imaging time = 16 minutes. Among piglets in the final analysis, three had imaging with 1×1 mm2 in-plane resolution (40 slices of 1.5 mm thickness and FOV = 128×128 mm2) and six had 1.2×1.2 mm2 in-plane resolution (50 slices of 1.2 mm thickness and FOV = 154×154 mm2) with GRAPPA factor = 2. This change was made to generate isotropic voxel size. The 15% increase in voxel volume and signal-to-noise ratio should not have a large effect on the estimated MD and FA values (12). The diffusion encoding scheme was designed based on the Human Connectome Project protocol (90 diffusion encoding directions and b values of 1000, 2000, and 3000 s/mm2) (27) and included 95 non-collinear diffusion encoding directions and three b-shells with effective b-values of 650, 1350, and 2000 s/mm2 to account for the higher tissue diffusivity in immature brains than in adult brains (28). MD and FA maps were automatically calculated by vendor-specific software without motion and eddy current corrections in anesthetized piglets.
Coronal images were selected that anatomically matched the brain neuropathology slides (Fig. 1). The investigators who interpreted the MRIs were blinded to treatment group and neuron counts. A neuropathologist with 36 years of experience in neuropathology and 20 years of experience in MRI (LJM) and an MRI physicist with 10 years of MRI experience (DL) measured FA and MD in consensus by co-registering the DTI map to the T2-weighted image and manually drawing ROIs containing putamen and caudate using OsiriX DICOM Viewer software (Bernex, Switzerland). Separately, a pediatric neuroradiologist (AT) with 12 years of experience interpreting neonatal brain MRI and 19 years of clinical and research MRI experience and a neuropathologist (LJM, described above) analyzed the images on the PACS workstation to measure MD in manually drawn regions of interest (ROI) encompassing the putamen and caudate in consensus. They also graded qualitative injury in the putamen and caudate as none, mild, moderate, or severe based on T2-weighted images. Thus, three separate investigators analyzed the MRIs. Both right and left sides were analyzed in QA piglets, and only the right side was analyzed in HI and sham piglets. MRI data from the right brain were compared to neuron counts. In QA piglets, the left brain that received PBS alone provided a control comparison for MRI interpretation.
Figure 1.
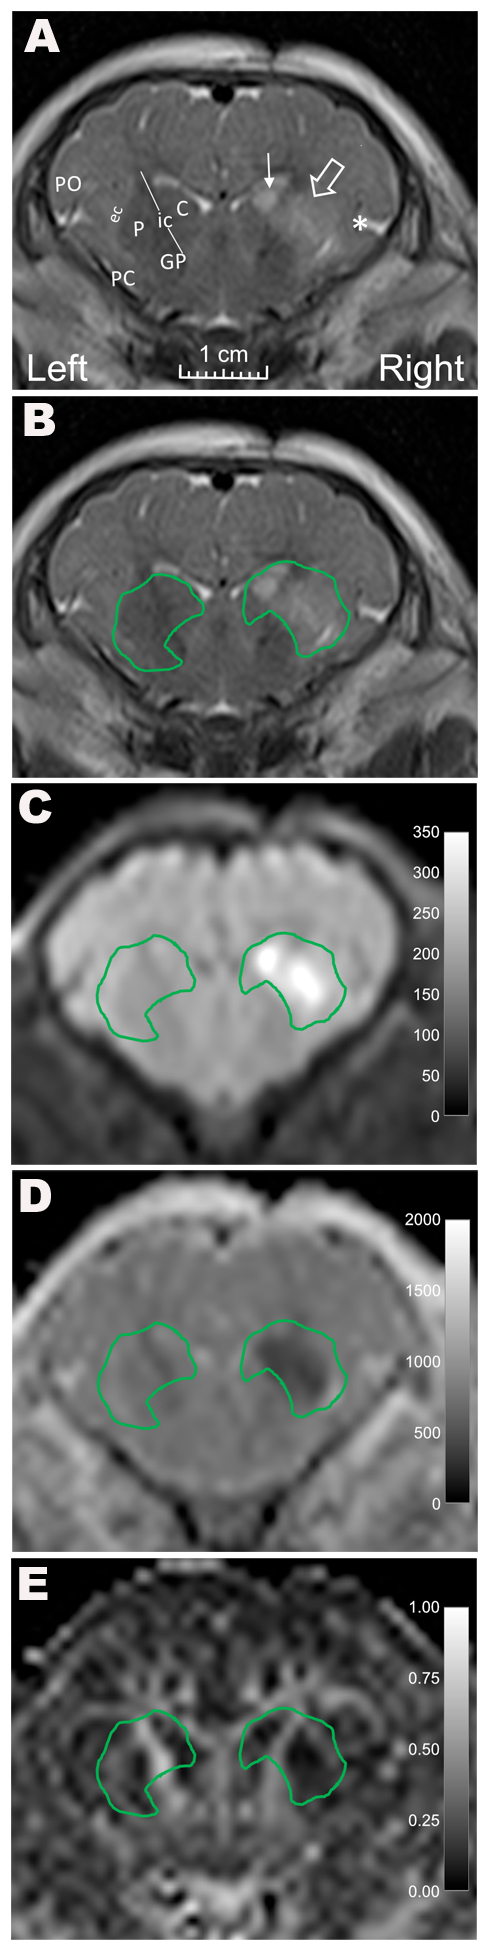
Representative MR images from a piglet that received stereotaxic injections of quinolinic acid (QA; 960 nmol) and contralateral phosphate-buffered saline (PBS, control). (A) A coronal T2-weighted image shows high T2 signal in the putamen (open arrow), caudate (line arrow), and deep insular cortex (asterisk) on the side that received QA. Anatomic landmarks are identified in the PBS-injected side: PO, parietal operculum; PC, pyriform cortex; ec, external capsule; P, putamen; ic, internal capsule; C, caudate; and GP, globus pallidus. B) T2-weighted and C) diffusion-weighted images with manually defined regions of interest containing the putamen and caudate show increased signal in the regions injured by QA. D) Mean diffusivity and E) fractional anisotropy were measured in the regions of interest surrounding the caudate and putamen.
Neuropathology
After the MRI and transport back to the laboratory, anesthetized piglets were euthanized with pentobarbital 50 mg/kg and phenytoin 6.4 mg/kg. The piglets were perfused transcardially with cold PBS for exsanguination followed by 4% paraformaldehyde for brain fixation. After decapitation, the heads were immersed in 4% paraformaldehyde for 12–24 hours for further brain fixation in situ. The brain was then removed from the skull and immersed in fresh 4% paraformaldehyde. Finally, the brains were cut for paraffin processing and sliced into 10-μm-thick coronal sections for hematoxylin and eosin (H&E) staining.
Three investigators analyzed the neuropathology in consensus. The investigators (LJM, JKL, and RCK) have 36, 9, and 25 years of experience, respectively, with experimental neuropathology. The investigators were blinded to treatment group, brain laterality, and the MRI. Neuronal cell bodies were counted in 10 non-overlapping fields spanning the dorsoventral and mediolateral putamen and in 9–10 non-overlapping fields similarly spanning the caudate at 400x magnification. Neurons were classified into one of three categories: 1) normal; 2) degenerating and undergoing irreversible cell death; or 3) injured with uncertain fate and without overt degeneration. The injured neurons of uncertain fate could potentially survive, be therapeutically rescued, or progress to death (23,24). Four types of cell death were included in the degenerating category: excitotoxic necrosis, ischemic necrosis, apoptosis, and the necrosis-apoptosis cell death continuum. Each of these cell death forms have been described in detail and verified by electron microscopy (16).
Western Blot Analysis
Three naïve piglets that did not undergo surgical anesthesia, surgery, or brain injury were euthanized and perfused transcardially with cold PBS. Brains were rapidly removed from the cranium, transected in the midsagittal plane, and placed on ice. Brain slabs were dissected on a cold metal plate to obtain microdissections of putamen and caudate. Samples were immediately frozen in isopentane-chilled dry ice.
Western blotting was carried out according to a published protocol (18) to test for the presence of NMDA glutamate receptor subunits NR1 and NR2A (29,30). Ponceau S stain (Sigma Life Science, St. Louis, MO) confirmed electroelution protein transfer. The nitrocellulose membranes were incubated overnight with primary antibodies for the NMDA glutamate receptor subunits NR2A (1:100; polyclonal rabbit) (31) or NR1 (1:1000; monoclonal mouse; BD Biosciences, San Jose, CA) followed by the appropriate secondary antibodies (anti-rabbit 1:1000 or anti-mouse 1:3000 IgG-horseradish peroxidase [Jackson ImmunoResearch, West Grove, PA]). Immunoreactive proteins were visualized by chemiluminescence (ThermoFisher, San Francisco, CA) and digital imaging on a ThermoFisher imager.
Comparison of One or Two Anesthetics
Seven piglets that received anesthesia for sham procedure or brain injury followed by a second anesthetic for MRI were compared to 14 historic, sham piglets that received anesthesia only once. The historic piglets received a single anesthetic of 70%/30% nitrous oxide/oxygen and fentanyl. The historic piglets’ brains were perfused for neuropathology immediately after anesthesia or 1 day later. For piglets that received brain injections, neurons were counted in the side injected with PBS only (control).
Statistical Methods
Data were analyzed and graphs generated by GraphPad (v.8, San Diego, CA). MAP, heart rate, and ETCO2 that were recorded every 15 minutes during MRI were averaged for each piglet across the duration of the scan. Interrater reliability of MD between the investigators’ ROIs was analyzed by Pearson correlation and Bland-Altman plots to confirm that DTI scalars were measured in the same anatomic region. MD from the clinical PACS system was compared to neuron cell body counts. Spearman correlations were used to compare MD and FA to neuron counts as ratios to total neurons or as absolute numbers. Comparisons of injury level by T2-weighted MRI and neuron counts were graphed in a descriptive analysis. The Mann Whitney test was used to compare putamen neuron counts in piglets that received two anesthetics in the current study to those of historic piglets that received one anesthetic. P<0.05 was considered statistically significant.
Sample Size Calculation
A priori data about the correlation between DTI scalars and neuronal injury or death are not available for neonatal excitotoxic or HI-induced brain injury. A chemotherapy study in mice showed that a 15% change in necrosis was associated with a 30% ADC change (14). This suggests that 6 subjects are needed to reject the null hypothesis of no association between ADC and necrosis at a power of 0.8 and alpha of 0.05. We increased the sample size to account for potential differences in effect size.
RESULTS
Protocol Completion Rate
Among the 21 piglets that received QA, HI, or sham procedure, one HI piglet could not be resuscitated from cardiac arrest, and two HI piglets died within 3 hours after resuscitation from hypotension or cardiac arrhythmia. One HI piglet that successfully recovered from the first anesthetic died during transport to the MRI suite from refractory hypotension. One HI piglet had a cardiac arrest after the MRI and was excluded. Four sham and three HI piglets were used for empirical MRI sequence development and were not included in the final analysis. Thus, nine piglets were used for the final analysis of MRI sequences and neuron classification after 20–96 hours of recovery from QA injury, HI, or sham procedure (Table 1).
Table 1.
Survival time between quinolinic acid injection completion, resuscitation from hypoxia-ischemia, or time equivalent in sham procedure and start of MRI
| Treatment | N | Survival before MRI (h) |
|---|---|---|
| Quinolinic acid | ||
| 240 nmol | 1 | 96 |
| 720 nmol | 3 | 20, 91, 96 |
| 960 nmol | 2 | 24, 25 |
| Hypoxia-ischemia | 2 | 45, 45 |
| Sham procedure | 1 | 23 |
Physiology
Table 2 shows the piglets’ vital signs and arterial blood gas data. At baseline, median hemoglobin concentration was 8.3 g/dL (standard deviation: 1.3) and all piglets had oxyhemoglobin saturations of 100%. Additionally, oxygen saturation was 100% prior to extubation from the first anesthetic and during the MRI scan. Three QA piglets and one HI piglet received dopamine during anesthesia for MRI. The additional anesthetic for MRI did not affect the neuron ratio in putamen when compared to a historic cohort of piglets that received a single anesthetic (p=0.743; Supplemental Fig. 1).
Table 2.
Physiologic data of the piglets
| Parameter | Baselinea (n=9) | Recoveryb (n=9) | MRIc (n=9) |
|---|---|---|---|
| Temperature (°C) | 37.7 (1.2) | 38.0 (1.3) | --- |
| MAP (mmHg) | 60 (12) | 64 (9) | 66 (15) |
| Heart rate (bpm) | 140 (19) | 172 (35) | 102 (31) |
| ETCO2 | 51 (3) | 43 (4) | 44 (11) |
| pH | 7.36 (0.03) | 7.38 (0.03) | 7.32 (0.03)d |
| PaCO2 (mmHg) | 36 (7) | 33 (5) | 36 (5)d |
| Base excess | −4.5 (2.8) | −5.6 (1.7) | −6.9 (2)d |
Data are presented as mean (standard deviation).
bpm, beats per minute; ETCO2, end-tidal carbon dioxide; MAP, mean arterial blood pressure; PaCO2, partial pressure of arterial carbon dioxide.
Prior to initiating brain injections, hypoxia, or time equivalent in sham procedure.
Prior to extubation from first anesthetic for brain injury or sham procedure.
Average vital signs during the MRI scan.
n=5 for arterial blood gas data collected before transport to the MRI suite. Fluid boluses were administered for mild metabolic acidosis.
The two piglets that underwent HI had arterial pH of 7.29 and 7.34 with oxyhemoglobin saturations of 27.4% and 39.2% at 42 minutes of hypoxia. At 7 minutes of asphyxia, the arterial blood gas values were pH 6.84 and 6.90, PaCO2 115 and 110 mmHg, base excess −14.3 and −11.6, and oxyhemoglobin saturations 4.3% and 4.9%. Normocapnia and normal pH were restored before extubation (Table 2).
Biochemistry and Neuropathology
The presence of NMDA receptor subunits was demonstrated in the brain regions that received QA (Fig. 2). The modified coordinates for stereotaxic QA injections produced neuronal degeneration in the putamen (Fig. 3). Normal neurons were identified morphologically by an open nucleus with visible chromatin and ≥1 nucleoli; large size (typical diameter 8–12 μm); apparently intact nuclear and cytoplasmic membranes; and a normal appearing rim of cytoplasm (Fig. 4A, B). Injured neurons were identified by abnormally vacuolated, eosinophilic, or dark cytoplasm; apparently intact nuclear and cytoplasmic membranes; and often dark, basophilic staining in the nucleus with a prominent nucleolus (Fig. 4D, H).
Figure 2.

Western blotting confirmed the presence of NR1 and NR2A N-methyl-D-aspartate receptor subunits in the putamen and caudate of neonatal piglets. Ponceau staining shows protein loading on the membrane.
Figure 3.

Development of the quinolinic acid (QA) injection model for excitotoxic putamen injury in six piglets. Plots show paired ratios of degenerating-to-total, normal-to-total, and injured-to-total neurons after QA or phosphate-buffered saline (PBS, control) injections in putamen (the target region; A-C) and the adjacent caudate (D-F). The ratio of degenerating-to-total neurons in putamen was the primary endpoint to confirm injury (A). QA dose: 240 nmol (triangles), 720 nmol (squares), and 960 nmol (circles). Initial testing with 720 nmoles of QA (open squares, dotted lines) showed minimal difference. Modification of the injection coordinates achieved more reliable putamen injury (filled squares, circles, and triangles; solid lines).
Figure 4.

Neuronal degeneration identified by hematoxylin and eosin stain in piglets that recovered for 45 hours after hypoxia-ischemia (HI) or for 25 hours after quinolinic acid injection (QA, 960 nmol). (A) A piglet that underwent the sham procedure had normal neurons (indicated by black arrows). (B) The caudate in a sham piglet also had normal neurons (black arrows). (C) After HI, the putamen had numerous ischemic necrotic principal neurons (black arrowheads). A large neuron shows the injured phenotype (white arrow). (D) The caudate after HI had many normal principal neurons (black arrows) and some large, injured neurons (white arrows). (E) The putamen after HI had principal neurons that were ischemic necrotic (black arrowhead) or dying from the necrotic-apoptotic cell death continuum (white arrowhead). The inset shows the morphological distinctions between these two cell death forms at higher magnification. (F) The asterisk denotes classic apoptosis associated with white matter bundles (stria) in HI putamen. The higher magnification inset shows chromatin condensation with round, dark, and uniformly stained aggregates that are typical of apoptosis. After QA injection, the putamen (G) had numerous excitotoxic necrotic principal neurons (black arrowheads) and the caudate (H) had normal principal neurons (black arrow) and excitotoxic necrotic neurons (black arrowheads). Other neurons had the injured phenotype (white arrows). The inset shows an injured neuron at higher magnification with dark cytoplasm and an attritional, homogeneously dark, non-fragmented nucleus with a prominent nucleolus. All photos were taken at 400x with the exception of panel E, F, and H insets, which were taken at 1000x with oil immersion. Scale bars = 10 μm.
Excitotoxic and ischemic necrotic neurons had eosinophilic, vacuolated cytoplasm; angular soma; pyknotic, angular, and hematoxylin-stained nuclei; and no perinuclear pallor. Some ischemic necrotic neurons exhibited dissolution of the nuclear and cell membranes and nucleoplasmic matrix speckling (Fig. 4C, G) (3,5). Apoptotic cells were small and round with condensed, eosinophilic cytoplasm and an intact cytoplasmic membrane that was often withdrawing from the extracellular matrix. The apoptotic nuclei consisted of round or crescent-shaped chromatin accretions (≤4; Fig. 4F) (3–5). Neurons dying from the necrosis-apoptosis continuum had ≥5 nuclear fragments of irregularly shaped chromatin clumps alongside a partially intact nuclear membrane, eosinophilic cytoplasm, and intact cell membrane (Fig. 4E) (16,32).
Correlation of Neuropathology to MRI
Lower MD correlated with a higher ratio of degenerating-to-total neurons in putamen and caudate (r= −0.750; p<0.05; n=9; Fig. 5A). Higher MD also correlated with a greater ratio of normal-to-total neurons (r=0.783; p<0.05; Fig. 5B). Lower MD was associated with more degenerating neurons (r= −0.700; p<0.05; Fig. 5D) but not the number of normal neurons (p=0.076; Fig. 5E). The most common forms of cellular degeneration seen histologically were excitotoxic and ischemic necrosis, followed by the necrosis-apoptosis cell death continuum. Gray matter apoptosis among apparent neurons was rare. MD was not related to the ratio of injured-to-total neurons (p>0.99) or the number of injured neurons (p>0.99; Fig. 5C, F).
Figure 5.

Correlation between mean diffusivity (MD) measured by the clinical PACS system and neuron counts in putamen and caudate. MD correlated with the ratio of degenerating-to-total neurons (A; r= −0.750; p<0.05; n=9) and the ratio of normal-to-total neurons (B; r=0.783; p=0.017). MD and the ratio of injured-to-total neurons were not associated (C; r=0; p>0.99). MD correlated with the number of dying neurons (D; r= −0.700; p<0.05) but not with normal (E; r=0.633; p=0.076) or injured (F; r=0; p>0.99) neurons. Circles indicate piglets with quinolinic acid-induced brain injury. Solid squares indicate piglets with global hypoxic-ischemic brain injury. The open square represents a piglet that underwent the sham procedure. The lines of best fit are shown.
MD measurements from different investigators showed good agreement (r=0.876, p<0.05; Fig. 6) and verified that the analyzed FA and MD values were from very similar anatomic regions. FA did not correlate with the ratios of degenerating-to-total neurons (r= −0.183; p=0.644; Fig. 7A), normal-to-total neurons (r=0.117; p=0.776; Fig. 7B), or injured-to-total neurons (r=0.333; p=0.385; Fig. 7C). FA was also unrelated to the number of degenerating (r= −0.083; p=0.843; Fig. 7D), normal (r=0.200; p=0.613; Fig. 7E), and injured (r=0.200; p=0.613; Fig. 7F) neurons.
Figure 6.

The mean diffusivity (10−6 mm2/s) values determined by the two investigators showed high correlation (A; r=0.876, p=0.003; the line of identity is shown). The Bland-Altman plot shows bias as a solid line and 95% limits of agreement as dashed lines (B).
Figure 7.
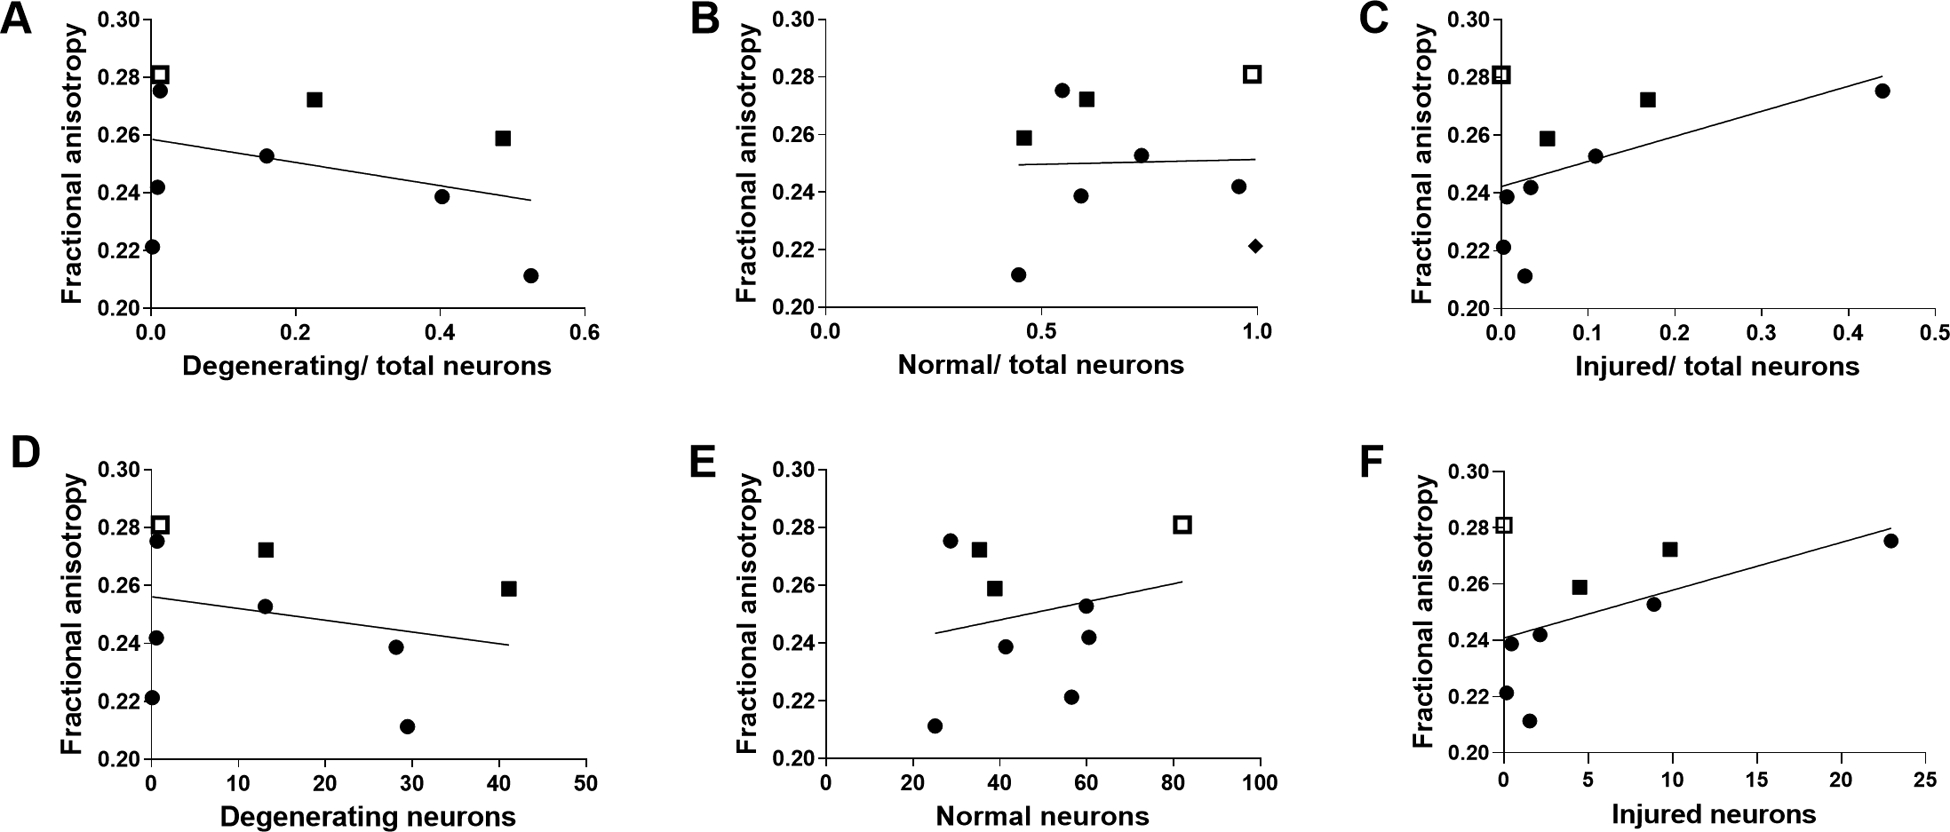
Fractional anisotropy (FA) did not correlate with the ratios of degenerating-to-total neurons (A; r= −0.183; p=0.644), normal-to-total neurons (B; r=0.117; p=0.776), or injured-to-total neurons (C; r=0.333; p=0.385). There was also no correlation between FA and the number of degenerating (D; r= −0.083; p=0.843), normal (E; r=0.200; p=0.613), or injured (F; r=0.200; p=0.613) neurons. Circles indicate piglets with quinolinic acid-induced brain injury. Solid squares indicate piglets with global hypoxic-ischemic brain injury. The open square represents a piglet that underwent the sham procedure. The lines of best fit are shown.
On T2-weighted MRI, three QA piglets had moderate or severe putamen injury and two had severe caudate injury. The other piglets had no or mild injury in these regions. There was no association between T2 injury level and the ratio of dying-, normal-, or injured-to-total neurons (Fig. 8).
Figure 8.

Comparison of injury measured by T2-weighted MRI and ratios of degenerating-, normal-, and injured-to-total neuron counts in putamen (A-C) and caudate (D-F). Circles indicate piglets with quinolinic acid-induced brain injury. Solid squares indicate piglets with global hypoxic-ischemic brain injury. The open square represents a piglet that underwent the sham procedure.
DISCUSSION
Two models of neonatal encephalopathy were used to examine how accurately clinical MRI detects acute neuronal degeneration, loss, and early injury at the cell body domain. Protocols for neonatal piglet MRI were successfully developed. On a 3T clinical MRI scanner, MD detected irreversible neuron degeneration and loss of normal neurons during acute recovery from excitotoxic and hypoxic-ischemic brain injury. However, MD was comparatively ineffective at identifying nuanced and early neuronal injury that lacked florid degeneration but showed apparent subcellular abnormalities (5,23,24). These injured neurons have potentially reversible damage and exhibit neuropathology that is distinct from the stark degeneration of necrosis or the necrosis-apoptosis cell death continuum (16,23,24). FA and qualitative injury on T2-weighted MRI were not associated with normal, degenerating, or injured neurons within 4 days of injury.
Extending MRI-based diagnostic capabilities beyond detection of late or moderate-to-severe brain injury would advance prognostic accuracy. For example, detecting subpopulations of injured or degenerating neurons might assist decision-making about hypothermia use in neonates with mild HIE, for which the utility of therapeutic hypothermia remains under investigation (33). Ideally, physicians would consider the cell death mechanisms that predominate in each cell type when making therapeutic decisions (17,18). Clarifying how accurately MRI detects and distinguishes neuronal degeneration and potentially reversible neuronal injury would advance critical care medicine. This study identified that MD in putamen and caudate correlated with neuronal degeneration and loss 1–4 days after excitotoxic and HI-induced striatal injury. Excitotoxic and ischemic necrotic, necrosis-apoptosis cell death continuum, and apoptotic morphologies were combined into a single category of irreversibly degenerating neurons based on evidence that the neuropathology signals DNA fragmentation incompatible with cell survival (16). This approach was chosen before the analysis began because the proportion of dying neurons is most clinically relevant. However, relationships between DTI-based markers and specific types of cell death could not be examined.
Progression to irreversible cell death with neuronal loss may be required to cause abnormal MD. The injured neurons that were not detected by MRI had emergent and less florid injury that was clearly and microscopically distinguishable from neuronal degeneration (16,32). Injured neurons can be rescued and ultimately survive, or they might progress to death (23,24). Thus, the timing of brain MRI in neonates with HIE must be carefully weighed against the anticipated disease course. Because early MRI soon after therapeutic hypothermia may not detect injured neurons that could subsequently die, additional MRIs may be needed to more accurately gauge the extent of damage.
Relatively few studies have related MRI to neuropathology in neonatal piglet or other large-animal models. One study of piglets with severe HI showed that FA is less accurate than MD for detecting irreversible cellular damage in basal ganglia (34). The current study’s results were in agreement because FA was not associated with neuronal degeneration, injury, or loss in putamen and caudate. Clinical studies show that although FA can detect severe thalamic injury in neonates with HIE, it has limited ability to detect hippocampal injury of a lesser degree (9). However, the thalamus is penetrated extensively by ascending and descending fiber bundle systems. Thus, the ability of MD to reliably measure early gray matter injury in HIE may depend on the regional white matter bundle composition. The amount of white matter injury with myelin and axon perturbations may better correlate with FA (35).
The current study highlights the importance of determining how well MRI techniques detect subcellular compartment abnormalities. MD quantified neuronal degeneration in gray matter, whereas T2-weighted imaging did not. However, most piglets had no or only mild injury on T2 MRI in this study. Fulminant injury with larger regions of infarcted tissue may be required to generate abnormal T2-weighted MRI, as observed in studies of piglets with more severe HI brain damage (34). Nonetheless, the current study suggests that MD from DTI may detect injury better than T2-weighted imaging alone in mild to moderate HIE. Diffusion time-dependent changes in ADC by oscillating-gradient diffusion MRI, which increases sensitivity to acute swelling in neuronal mitochondria and nuclei in the neonatal mouse model of HI (36), may have potential to detect early cytopathology after HI.
The QA model enabled us to generate striatal injury exceeding that of our global HI model but without cardiopulmonary and additional systemic injury. Survival was 100% after QA brain injury, in contrast to survival rates of approximately 80% after global piglet HI (18,25). Global HI is important to study because it mimics the whole body injury that occurs in clinical HIE from perinatal asphyxia. However, the cardiopulmonary injuries from global HI limit survival and the piglets’ ability to tolerate subsequent anesthetics. This constraint can bias global HI survival studies toward less injured subjects.
Limitations
The sample size was small in this pilot study. Future studies with larger sample sizes are needed. MRI evaluations were based on results directly from the scanner in anesthetized piglets, and future studies will need to include additional corrections for motion, eddy current, and geometrical distortion. We created our QA model as a positive control and could not randomize piglets by QA dose to troubleshoot and optimize the protocol based on putamen neuropathology. However, the HI and sham piglets were randomized to treatment in accordance with our routine research practice. Future QA studies will use randomization. In this study, the focus was on putamen and caudate because these regions are vulnerable in HIE (7,8,25). In future work, injury to oligodendrocytes, astrocytes, microglia, axons, and myelin will be examined in striatum and other regions alongside cell type immunophenotyping. H&E stain was used without neuron-specific immunophenotyping. However, published and validated methods to characterize different types of neural cells and cell death morphologically were used (3,4,16–18,25,32,37,38). Neuronal process injury is detected by DTI (34,39), and dendritic injury was not examined.
Conclusion
MD from a clinical 3T MRI scanner detected early neuronal degeneration and loss of normal neurons in putamen and caudate 1–4 days after excitotoxic or HI injury in neonatal piglets. These data support the concept that MD identifies irreversible degenerating neurons in the ischemic core. However, MD did not detect injured neurons with unclear fate that might survive or progress to cell death, even though they exhibit apparent and abnormal cytopathological changes. FA and T2-weighted MRI did not identify neuronal degeneration, injury, or loss.
Supplementary Material
Supplemental figure 1. Comparison of two anesthetics for brain injury and MRI to a historic cohort of piglets that received one anesthetic. The additional anesthetic for MRI did not affect the ratio of normal+injured-to-total neurons in putamen (p=0.743). For piglets that received brain injections, data are shown only for the side injected with phosphate-buffered saline (control).
Acknowledgments:
We are grateful to Claire Levine, MS, ELS, for her editing.
Grant support: NIH grants R01 NS107417, R01 NS109029, R01 NS060703, and R01 HD074593; and the American Heart Association Transformational Project Award (co-funded by the Lawrence J. and Florence A. DeGeorge Charitable Trust)
Footnotes
Financial interests: The authors have nothing to disclose.
REFERENCES
- 1.Shankaran S, Pappas A, McDonald SA, et al. Childhood outcomes after hypothermia for neonatal encephalopathy. N Engl J Med 2012;366:2085–2092. [DOI] [PMC free article] [PubMed] [Google Scholar]
- 2.Okereafor A, Allsop J, Counsell SJ, et al. Patterns of brain injury in neonates exposed to perinatal sentinel events. Pediatrics 2008;121:906–914. [DOI] [PubMed] [Google Scholar]
- 3.Wang B, Armstrong JS, Lee JH, et al. Rewarming from therapeutic hypothermia induces cortical neuron apoptosis in a swine model of neonatal hypoxic-ischemic encephalopathy. J Cereb Blood Flow Metab 2015;35:781–793. [DOI] [PMC free article] [PubMed] [Google Scholar]
- 4.Wang B, Armstrong JS, Reyes M, et al. White matter apoptosis is increased by delayed hypothermia and rewarming in a neonatal piglet model of hypoxic ischemic encephalopathy. Neuroscience 2016;316:296–310. [DOI] [PMC free article] [PubMed] [Google Scholar]
- 5.O’Brien CE, Santos PT, Kulikowicz E, et al. Hypoxia-ischemia and hypothermia independently and interactively affect neuronal pathology in neonatal piglets with short-term recovery. Dev Neurosci 2019;41:17-33-17-33. [DOI] [PMC free article] [PubMed] [Google Scholar]
- 6.Lucke AM, Shetty AN, Hagan JL, et al. Early proton magnetic resonance spectroscopy during and after therapeutic hypothermia in perinatal hypoxic-ischemic encephalopathy. Pediatr Radiol 2019;49(7):941–950. [DOI] [PubMed] [Google Scholar]
- 7.Tekes A, Poretti A, Scheurkogel MM, et al. Apparent diffusion coefficient scalars correlate with near-infrared spectroscopy markers of cerebrovascular autoregulation in neonates cooled for perinatal hypoxic-ischemic injury. AJNR Am J Neuroradiol 2015;36:188–193. [DOI] [PMC free article] [PubMed] [Google Scholar]
- 8.Lee JK, Poretti A, Perin J, et al. Optimizing cerebral autoregulation may decrease neonatal regional hypoxic-ischemic brain injury. Dev Neurosci 2017;39:248–256. [DOI] [PMC free article] [PubMed] [Google Scholar]
- 9.Salas J, Reddy N, Orru E, et al. The role of diffusion tensor imaging in detecting hippocampal injury following neonatal hypoxic-ischemic encephalopathy. J Neuroimaging 2019;29:252–259. [DOI] [PMC free article] [PubMed] [Google Scholar]
- 10.van der Toorn A, Sykova E, Dijkhuizen RM, et al. Dynamic changes in water ADC, energy metabolism, extracellular space volume, and tortuosity in neonatal rat brain during global ischemia. Magn Reson Med 1996;36:52–60. [DOI] [PubMed] [Google Scholar]
- 11.Mori S, Zhang J. Principles of diffusion tensor imaging and its applications to basic neuroscience research. Neuron 2006;51:527–539. [DOI] [PubMed] [Google Scholar]
- 12.Farrell JA, Landman BA, Jones CK, et al. Effects of signal-to-noise ratio on the accuracy and reproducibility of diffusion tensor imaging-derived fractional anisotropy, mean diffusivity, and principal eigenvector measurements at 1.5 T. J Magn Reson Imaging 2007;26:756–767. [DOI] [PMC free article] [PubMed] [Google Scholar]
- 13.Tuor UI, Qiao M, Sule M, Morgunov M, Foniok T. Magnetic resonance imaging of ischemic injury produced by varying severities of photothrombosis differs in neonatal and adult brain. NMR Biomed 2016;29:1700–1708. [DOI] [PubMed] [Google Scholar]
- 14.Papaevangelou E, Almeida GS, Jamin Y, Robinson SP, deSouza NM. Diffusion-weighted MRI for imaging cell death after cytotoxic or apoptosis-inducing therapy. Br J Cancer 2015;112:1471–1479. [DOI] [PMC free article] [PubMed] [Google Scholar]
- 15.Northington FJ, Chavez-Valdez R, Martin LJ. Neuronal cell death in neonatal hypoxia-ischemia. Ann Neurol 2011;69:743–758. [DOI] [PMC free article] [PubMed] [Google Scholar]
- 16.Martin LJ, Al-Abdulla NA, Brambrink AM, Kirsch JR, Sieber FE, Portera-Cailliau C. Neurodegeneration in excitotoxicity, global cerebral ischemia, and target deprivation: A perspective on the contributions of apoptosis and necrosis. Brain Res Bull 1998;46:281–309. [DOI] [PubMed] [Google Scholar]
- 17.Lee JK, Wang B, Reyes M, et al. Hypothermia and rewarming activate a macroglial unfolded protein response independent of hypoxic-ischemic brain injury in neonatal piglets. Dev Neurosci 2016;38:277–294. [DOI] [PMC free article] [PubMed] [Google Scholar]
- 18.Santos PT, O’Brien CE, Chen MW, et al. Proteasome biology is compromised in white matter after asphyxic cardiac arrest in neonatal piglets J Am Heart Assoc 2018;7:e009415–e009415. [DOI] [PMC free article] [PubMed] [Google Scholar]
- 19.Johnston MV. Excitotoxicity in perinatal brain injury. Brain Pathol 2005;15:234–240. [DOI] [PMC free article] [PubMed] [Google Scholar]
- 20.Portera-Cailliau C, Price DL, Martin LJ. Non-NMDA and NMDA receptor-mediated excitotoxic neuronal deaths in adult brain are morphologically distinct: further evidence for an apoptosis-necrosis continuum. J Comp Neurol 1997;378:88–104. [PubMed] [Google Scholar]
- 21.Dobbing J, Sands J. Comparative aspects of the brain growth spurt. Early Hum Dev 1979;3:79–83. [DOI] [PubMed] [Google Scholar]
- 22.Roland EH, Poskitt K, Rodriguez E, Lupton BA, Hill A. Perinatal hypoxic-ischemic thalamic injury: clinical features and neuroimaging. Ann Neurol 1998;44:161–166. [DOI] [PubMed] [Google Scholar]
- 23.Ingvar M, Morgan PF, Auer RN. The nature and timing of excitotoxic neuronal necrosis in the cerebral cortex, hippocampus and thalamus due to flurothyl-induced status epilepticus. Acta Neuropathol 1988;75:362–369. [DOI] [PubMed] [Google Scholar]
- 24.Rubleva EY, Savulev YI, Pylaev AS. Comparative electron microscopic and autoradiographic studies of “dark” and “light” neurons of the cerebral cortex. Neurosci Behav Physiol 1980;10:5–9. [DOI] [PubMed] [Google Scholar]
- 25.Singh R, Kulikowicz E, Santos PT, Koehler RC, Martin LJ, Lee JK. Spatial T-maze identifies cognitive deficits in piglets 1 month after hypoxia-ischemia in a model of hippocampal pyramidal neuron loss and interneuron attrition. Behav Brain Res 2019;369:1–11. [DOI] [PMC free article] [PubMed] [Google Scholar]
- 26.Larson AC, Jamrogowicz JL, Kulikowicz E, et al. Cerebrovascular autoregulation after rewarming from hypothermia in a neonatal swine model of asphyxic brain injury. J Appl Physiol 2013;115:1433–1442. [DOI] [PMC free article] [PubMed] [Google Scholar]
- 27.Van Essen DC, Smith SM, Barch DM, Behrens TE, Yacoub E, Ugurbil K. The WU-Minn Human Connectome Project: an overview. Neuroimage 2013;80:62–79. [DOI] [PMC free article] [PubMed] [Google Scholar]
- 28.Neil JJ, Shiran SI, McKinstry RC, et al. Normal brain in human newborns: apparent diffusion coefficient and diffusion anisotropy measured by using diffusion tensor MR imaging. Radiology 1998;209:57–66. [DOI] [PubMed] [Google Scholar]
- 29.Zhang Z, Sun QQ. Development of NMDA NR2 subunits and their roles in critical period maturation of neocortical GABAergic interneurons. Dev Neurobiol 2011;71:221–245. [DOI] [PMC free article] [PubMed] [Google Scholar]
- 30.Jantzie LL, Talos DM, Jackson MC, et al. Developmental expression of N-methyl-D-aspartate (NMDA) receptor subunits in human white and gray matter: potential mechanism of increased vulnerability in the immature brain. Cereb Cortex 2015;25:482–495. [DOI] [PMC free article] [PubMed] [Google Scholar]
- 31.Portera-Cailliau C, Price DL, Martin LJ. N-methyl-D-aspartate receptor proteins NR2A and NR2B are differentially distributed in the developing rat central nervous system as revealed by subunit-specific antibodies. J Neurochem 1996;66:692–700. [DOI] [PubMed] [Google Scholar]
- 32.Northington FJ, Zelaya ME, O’Riordan DP, et al. Failure to complete apoptosis following neonatal hypoxia-ischemia manifests as “continuum” phenotype of cell death and occurs with multiple manifestations of mitochondrial dysfunction in rodent forebrain. Neuroscience 2007;149:822–833. [DOI] [PMC free article] [PubMed] [Google Scholar]
- 33.El-Dib M, Inder TE, Chalak LF, Massaro AN, Thoresen M, Gunn AJ. Should therapeutic hypothermia be offered to babies with mild neonatal encephalopathy in the first 6 h after birth? Pediatr Res 2019;85:442–448. [DOI] [PubMed] [Google Scholar]
- 34.Munkeby BH, De Lange C, Emblem KE, et al. A piglet model for detection of hypoxic-ischemic brain injury with magnetic resonance imaging. Acta Radiol 2008;49:1049–1057. [DOI] [PMC free article] [PubMed] [Google Scholar]
- 35.Thornton JS, Ordidge RJ, Penrice J, et al. Anisotropic water diffusion in white and gray matter of the neonatal piglet brain before and after transient hypoxia-ischaemia. Magn Reson Imaging 1997;15:433–440. [DOI] [PubMed] [Google Scholar]
- 36.Wu D, Martin LJ, Northington FJ, Zhang J. Oscillating-gradient diffusion magnetic resonance imaging detects acute subcellular structural changes in the mouse forebrain after neonatal hypoxia-ischemia. J Cereb Blood Flow Metab 2019;39:1336–1348. [DOI] [PMC free article] [PubMed] [Google Scholar]
- 37.Lee JK, Yang ZJ, Wang B, et al. Noninvasive autoregulation monitoring in a swine model of pediatric cardiac arrest. Anesth Analg 2012;114:825–836. [DOI] [PMC free article] [PubMed] [Google Scholar]
- 38.Portera-Cailliau C, Price DL, Martin LJ. Excitotoxic neuronal death in the immature brain is an apoptosis-necrosis morphological continuum. Journal Comp Neurol 1997;378:70–87. [PubMed] [Google Scholar]
- 39.Baron CA, Kate M, Gioia L, et al. Reduction of Diffusion-Weighted Imaging Contrast of Acute Ischemic Stroke at Short Diffusion Times. Stroke 2015;46:2136–2141. [DOI] [PubMed] [Google Scholar]
Associated Data
This section collects any data citations, data availability statements, or supplementary materials included in this article.
Supplementary Materials
Supplemental figure 1. Comparison of two anesthetics for brain injury and MRI to a historic cohort of piglets that received one anesthetic. The additional anesthetic for MRI did not affect the ratio of normal+injured-to-total neurons in putamen (p=0.743). For piglets that received brain injections, data are shown only for the side injected with phosphate-buffered saline (control).