Abstract
Purpose:
To evaluate cellular protein changes in response to treatment with an approved drug, ibrutinib, in cells expressing normal or mutated Granulocyte-Colony Stimulating Factor Receptor (G-CSFR). G-CSFR mutations are associated with some hematological malignancies. Previous studies showed the efficacy of ibrutinib (a Bruton’s tyrosine kinase inhibitor) in mutated G-CSFR leukemia models but did not addressed broader signaling mechanisms.
Experimental design:
A label-free quantitative proteomics workflow to evaluate the cellular effects of ibrutinib treatment was established. This included 3 biological replicates of normal and mutated G-CSFR expressed in a mouse progenitor cell (32D cell line) with and without ibrutinib treatment.
Results:
The proteomics dataset showed about 1,000 unique proteins quantified with nearly 400 significant changes (p value < 0.05), suggesting a highly dynamic network of cellular signaling in response to ibrutinib. Importantly, the dataset was very robust with coefficients of variation (CVs) for quantitation at 13.0-20.4% resulting in dramatic patterns of protein differences among the groups.
Conclusions and clinical relevance:
This robust data set is available for further mining, hypothesis generation, and testing. A detailed understanding of the restructuring of the proteomics signaling cascades by ibrutinib in leukemia biology will provide new avenues to explore its use for other related malignancies.
Granulocyte colony stimulating factor receptor (protein: G-CSFR, gene: CSF3R) is a cytokine receptor which mediates the proliferation and differentiation of neutrophils after binding to its ligand granulocyte-colony stimulating factor (G-CSF) or, colony-stimulating factor-3 (CSF-3)1. Mutations in CSF3R have been reported in several hematological diseases, e.g. Severe Congenital Neutropenia (SCN), Chronic Neutrophilic Leukemia (CNL), Myelodysplastic Syndrome (MDS), Acute Myeloid Leukemia (AML), atypical Chronic Myelogenous Leukemia (aCML)1–4. Previous studies have reported somatic mutations in CSF3R cytoplasmic domain (most frequent Q741x) in the SCN patient cohorts undergoing prolong G-CSF therapy5. In our previous studies6,7, we have presented phosphoproteomics datasets pointing to aberrant signaling through Bruton’s Tyrosine Kinase (BTK)6 and many of other phospho-Ser/Thr signaling changes between the normal and mutated G-CSFRs7. Aberrant activation of BTK was validated in mouse as well as human models6. Furthermore, a significant reduction in the overall leukemic potential of the mutated G-CSFRs expressing primary cells were reported after ibrutinib (FDA approved BTK inhibitor) treatment6. However, the signaling mechanism of ibrutinib’s action is not fully known. Here we present a label-free SWATH-MS (Sequential Window Acquisition of all Theoretical fragment ion-Mass Spectrometry)8–9 study analyzing a global proteome changes in the WT, and truncated (Q741x) G-CSFRs in response with ibrutinib treatment.
To design an in vitro model system expressing WT and Q741x expressing receptors, we choose a murine myeloid progenitor cell line (32D) which does not have endogenous expression of the G-CSFRs6. The experimental details pertaining to the generation of normal and mutated G-CSFR expressing 32D cell lines and culture conditions have been described in our previously published work6. Each experimental condition where the cells were either treated or non-treated with ibrutinib and then stimulated with G-CSF denoted as following: WT treated with ibrutinib and stimulated with G-CSF (WT+inh), WT not treated with ibrutinib and stimulated with G-CSF (WT), Q741x treated with ibrutinib and stimulated with G-CSF (Q741x+inh), Q741x not treated with ibrutinib and stimulated with G-CSF (Q741x). The overall experimental design combined ibrutinib treatment (1 hour), G-CSF induction (15 min), SWATH-MS using a high-resolution nano-LC-MS/MS, and proteomic data as well as bioinformatics exploratory analyses. Please refer to supplementary file 2 for the details of sample preparation (cell lysis, protein assay, gel electrophoresis, and protein digestion10) and the LC-MS analyses. Briefly, 2.5 ug of the tryptic digests from each sample were prepared for comparative mass spectrometry analysis. Nano LC-ESI-MS/MS analysis was performed on a TripleTof 5600+ mass spectrometer (Sciex; Concord, Ontario, Canada) coupled with a nanoLC-ultra nanoflow system (Eksigent, Dublin, CA) in data dependent acquisition (DDA) or data independent acquisition (DIA) modes. 2.5 μg of extracted peptides from the in-gel digestion were loaded on to column trap (Eksigent Chrom XP C18-CL-3 μm 120 Å, 350 μm x 0.5 mm; Sciex, Toronto, Canada) at 2 μL/min in 0.1% formic acid for 15 min to desalt and concentrate the sample via Eksigent NanoLC-AS-2 autosampler. The desalted samples were further directed to Acclaim PepMap100 C18 LC column (75 μm x 15 cm, C18 particle sizes of 3 μm, 120 Å) (Dionex; Thermo Fisher Scientific, Inc.) for chromatographic separation. The peptides elution was carried out at a flow rate of 300 nL/min using a variable mobile phase (MP) gradient from 95% phase A (0.1% formic acid) to 40% phase B (99.9% acetonitrile in 0.1% formic acid) for 70 minutes, from 40% phase B to 85% phase B for 5 minutes, and then keeping 85% phase B for 5 minutes. The nanoESI source parameters used during the gradient run were ion source gas 1 (GS1), ion source gas 2 (GS2) and curtain gas (CUR) at 13, 0 and 35 respectively. Furthermore, interface heater temperature and ion spray voltage were maintained at 150 °C and at 2.6 kV respectively.
MS was operated in positive ion mode set for 1,929 cycles for 90 minutes gradient duration, where each cycle performed 1 time of flight (TOF) scan type (250 ms accumulation time, 350–1250 m/z window with a charge state of 2+ to 4+) followed by information dependent acquisition of the most 50 intense candidate ions. The minimum MS signal was set to 150 counts. High sensitivity mode was used for each MS/MS scan with an accumulation time of 50 ms and a mass tolerance of 100 ppm. Former MS/MS-analyzed candidate ions were excluded for 12 sec after its first occurrence to reduce the redundancy of the identified peptides. The DDA data (.wiff) was recorded by Analyst-TF (v.1.7) software. DIA method was performed as previously published7. Briefly, a mass window width of 8 m/z with overlapping of 1 m/z for 57 transmission windows was used during data independent acquisition. MS scan was set to 1,715 cycles, with each cycle performing 1 TOF-MS scan type (250 ms accumulation time, across the 350–750 precursor mass range) acquired in every cycle for a total cycle time of ~3.15 s. A 50 ms per SWATH window width was used to collect MS spectra from 100–1250 m/z. Resolution for MS1 and SWATH-MS2 scan were 30,000 and 15,000, respectively. The rolling collision energy with the collision energy spread of 15 was applied. The DIA data (.wiff) was recorded by Analyst-TF (v.1.7) software. Please refer to supplemental method section for detailed SWATH methodology.
Data was preprocessed by quantile normalization and missing values were replaced by zero. Data visualization, functional annotation, and statistical analysis were performed in Excel, R packages (Supplementary File 1_R notebook). Overall, p-value < 0.05 after Benjamini-Hochberg correction was considered statistically significant. A custom code was written in R programming language to preprocess, analyze and visualize the SWATH data automatically, as presented in this study (Supplementary File 1_R notebook). The code is made available via github (https://github.com/schuti/ibrutinib_swath.R) and also provided as supplementary material (Supplementary File 1_R notebook). The raw data (.wiff), group searched files (Protein Pilot .group files) resulting from SWATH experiments have been deposited to the ProteomeXchange Consortium (http://proteomecentral.proteomexhange.org) via the PRIDE partner repository.
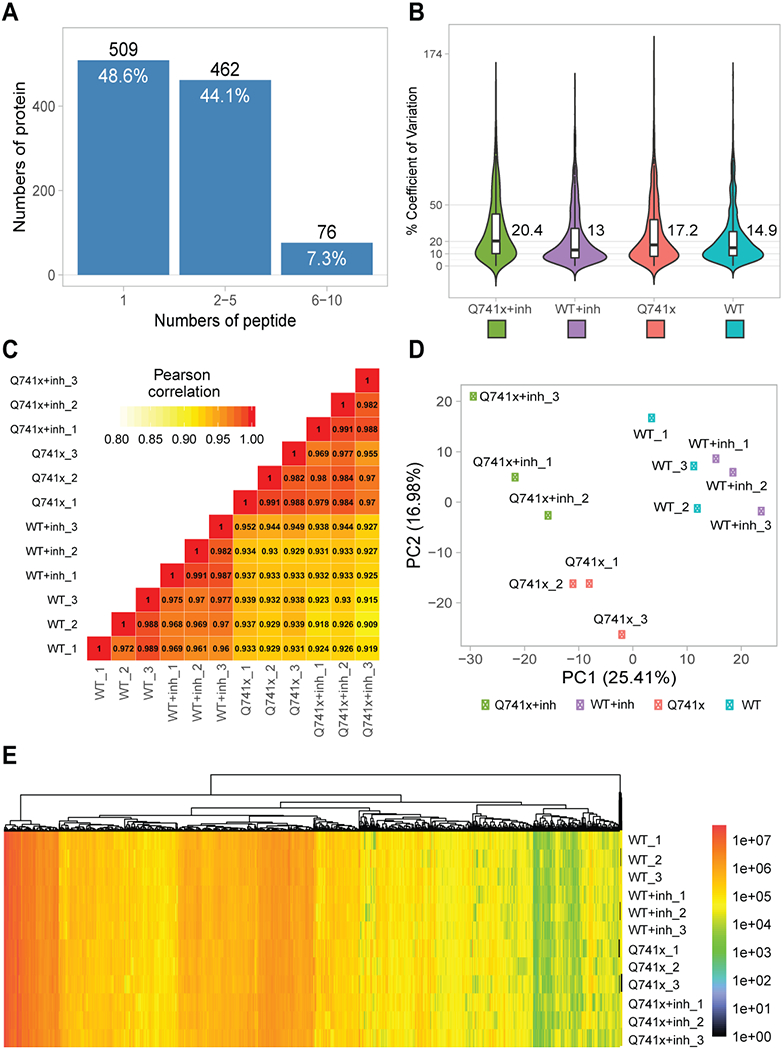
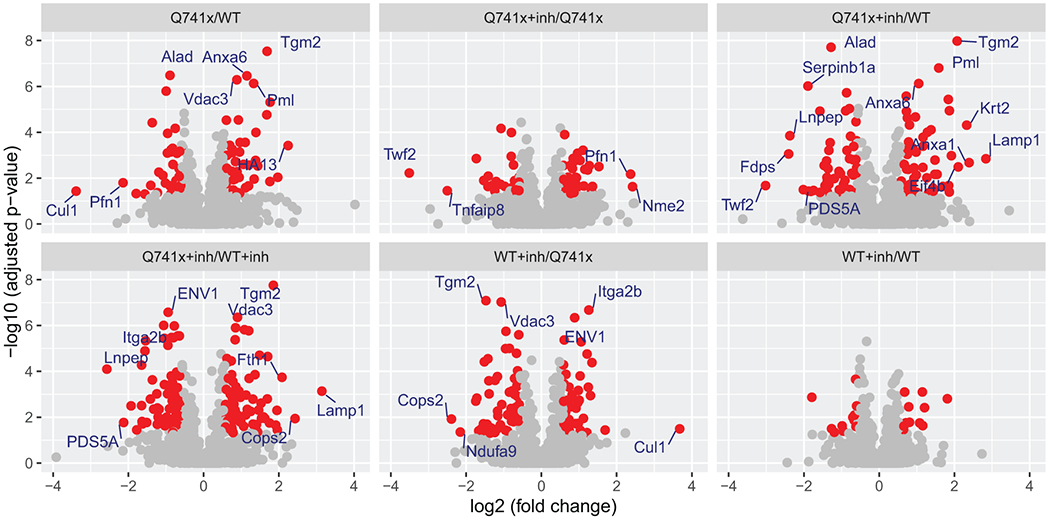
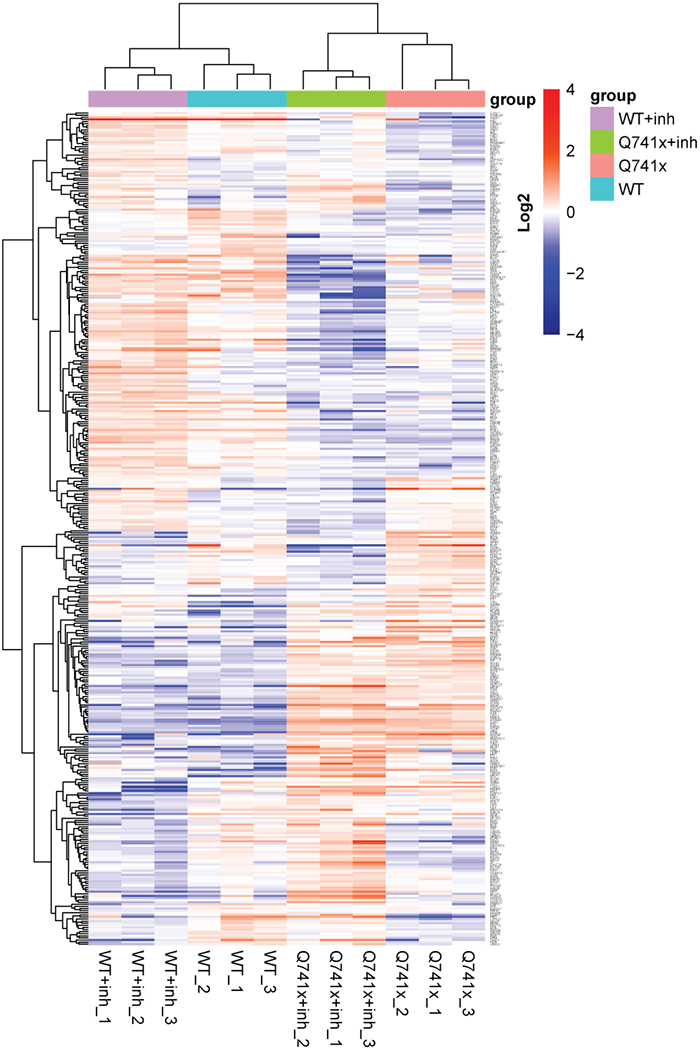
Collectively, more than 12,000 unique data points were collected (Figure 1). Our SWATH-proteomic dataset showed upward of 1,000 unique protein detected and quantified in each group and ~400 proteins showing significant changes (p value < 0.05), suggesting a highly dynamic network of cellular signaling that is affected by ibrutinib between the WT and mutant receptors. The CV analysis for the peptide retention time was performed which showed the median-CVs of 0.7% - 1.5% among four treatment conditions, suggesting the highly consistent chromatography of SWATH/DIA analysis (Supplementary Figure 1). Furthermore, in principal component analysis (PCA) plots, we observed a distinct cluster based PC1 (25.41%) and PC2 (16.98%) separation showing the differential effect of ibrutinib in WT and Q741x expressing 32D cells (Figure 1). There is a distinct separation between PC1 and PC2 based on the ibrutinib treatment to mutation carrying cells (most of WT: either non-treated or treated and Q741x cluster in 1 group and belong to PC1, whereas treated Q741x forms a separate cluster). This separation based PC1 and PC2 demonstrates a variable biological response against ibrutinib in the mutated cells. Different proteins were also observed in pair wise quantitative comparisons across the different experimental groups using volcano plot analysis involving fold changes and p-value as determiner (Figure 2, supplementary table 1). We also performed an unsupervised hierarchical clustering heat map analyses on the significant proteins passing the p value cut-off of 0.05 (Figure 3). Similar to the pattern shown in PCA and volcano plot, a distinct cluster were observed for the Q741x treated with ibrutinib compared to WT groups (Figure 3). Additionally, the overall distribution of log2FC of the peptides across the samples showed a normal distribution, as expected (Supplementary Figure 2).
Figure 1.

Quality control steps utilized to check the overall validity of SWATH data set: (a) Total proteins identified and quantified based on the indicated number of corresponding peptides; (b) Coefficient of variation for quantitative reproducibility as violin plots; (c) Pearson correlation coefficient (r) for three independent biological replicates; (d) Principal Component Analysis (PCA) plot showing the overall clustering of the each experimental groups; (e) A single heat map of all the identified and quantified proteins to show nominal missing values at only 0.06%.
Figure 2.

Volcano plot analysis of pair wise quantitative comparisons across the different experimental groups to identify the significant changes in protein expression after ibrutinib treatment and G-CSF induction. The analysis used the 3 independent replicates data set for each group: WT, Q741x, WT+inh, and Q741x+inh. Significant proteins (>=2 fold change) are labeled in the volcano plot and their expression related details are provided with supplementary table 1. The red colored dots in the volcano plot indicate the proteins with 1.5-fold changes with adjusted p-value < 0.05. The WT+inh/WT group does not display any significant proteins reflecting that ibrutinib is not sensitivity towards the normal proteome of WT-GCSFR signaling.
Figure 3.

R-based unsupervised hierarchical clustering heat map analyses were performed on the 397 significantly changed protein (ANOVA p < 0.05) with clustering based on correlation distance and average linkage. A full table of the gene identification and relative abundance of each protein is provided as supplementary table 1.
In conclusion, the dataset presented here is the first of its kind in the field of ibrutinib’s mechanism of action (MOA) on the cellular proteome level. This data set exhibits robustness on the biological relevance as well as the model system. Correlation analysis showed good reproducibility of the independent biological replicates (Figure 1). Volcano plot, PCA analysis, and heat map showed a distinct ibrutinib mediated effect on the cellular proteomes (Figure 2, 3). We anticipate that this data set can be mined further to advance the clinical understanding of ibrutinib against leukemia biology. Evidentially, the MOA of ibrutinib is still not very clear to the leukemia research community, the data set presented here may play an instrumental role in the understanding of the cellular proteome under the effect of this drug. As described in previous paragraph where we reported several proteins showing changes in their expression under ibrutinib treatment, a detailed understanding of ibrutinib’s mediated restructuring of the proteomics signaling cascades in the leukemia biology would provide new avenues to improvise the use of this drug in other related malignancies.
Supplementary Material
Supplementary Dataset 1. SWATH dataset containing information regarding transitions, peptides, proteins, score, FDR and observed RT.
Supplementary Table 1. Expression data of 397 significant proteins corresponding to the Heatmap showed in figure 4 of the manuscript. The table provides two levels of data; log2-transformed data (which directly used for the heatmap) and their relative protein intensities (calculated from log2-transformed values). All values are based on quantile normalization and missing value replaced by zero.
Supplementary File 2. Detailed methodology section.
Supplementary Figure 1. Overall % coefficient of variation of peptide retention time (RT) to reassure a consistent chromatography applied in SWATH acquisition.
Supplementary File 1_R Notebook. The custom R script to preprocess, analyze and visualize SWATH proteomic dataset (as provided in supplementary dataset 1). This script can be used as a starting point for further bioinformatic analysis and biological.
Statement of Clinical Relevance.
Ibrutinib is a kinase inhibitor that targets Bruton’s Tyrosine Kinase (BTK) and is used clinically for the treatment of chronic lymphocytic leukemia (CLL) and other lymphomas. More recently ibrutinib has been shown to effectively target neutrophilic leukemias associated with mutated to the Granulocyte-Colony Stimulating Factor Receptor (G-CSFR) in both mouse and human cell models, however, the broader impact of ibrutinib on cell signaling and the disruption of cellular function has not been evaluated. This dataset brief provides a robust comparative proteomics profiling data set documenting nearly 400 significant protein changes across cell systems expressing WT or mutated receptors, with and without ibrutinib treatment. It is anticipated that this data set can be mined further to advance the clinical understanding of ibrutinib’s action in leukemia biology. In addition, given that the full mechanism of action of ibrutinib is not clear in the leukemia research community, the data set presented here may play an instrumental role in the understanding of the cellular impact of this drug and may lead to other therapeutic targets and/or opportunities to repurpose this drug.
Acknowledgments
The authors thank Dr. Fan Dong (University of Toledo, Ohio) for providing 32D cell line. This article and our research work associated with G-CSFR are supported by National Institutes of Health (NIH) Grant 1S10 RR027015-01 (KDG), the University of Cincinnati Millennium Scholars Fund (KDG), the Cincinnati Children’s Hospital Research Foundation (KDG), National Institutes of Health T32 ES007250-06 (DEM), R01 CA196658 (HLG) and a grant from CancerFree Kids (HLG). SC was financially supported by Faculty staff development program of Ramathibodi Hospital, Mahidol University, Thailand.
Footnotes
Competing Interests
The authors declare no competing interests.
References
- 1.Beekman R, Valkhof MG, Sanders MA, van Strien PM, Haanstra JR, Broeders L, Geertsma-Kleinekoort WM, Veerman AJ, Valk PJ, Verhaak RG, Lowenberg B, Touw IP, Blood, 2012, 119, 5071. [DOI] [PubMed] [Google Scholar]
- 2.Beekman R, Touw IP, Blood, 2010, 115, 5131. [DOI] [PubMed] [Google Scholar]
- 3.Touw IP, Beekman R, Haematologica, 2013, 98, 1490. [DOI] [PMC free article] [PubMed] [Google Scholar]
- 4.Dwivedi P, Greis KD, Experimental Hematology, 2017, 46, 9. [DOI] [PMC free article] [PubMed] [Google Scholar]
- 5.Deeks ED, Drugs, 2017, 77(2), 225. [DOI] [PubMed] [Google Scholar]
- 6.Dwivedi P, Muench DE, Wagner M, Azam M, Grimes HL, Greis KD, Leukemia, 2019, 33, 75. [DOI] [PMC free article] [PubMed] [Google Scholar]
- 7.Dwivedi P, Muench DE, Wagner M, Azam M, Grimes HL, Greis KD, Scientific Data, 2019, 6, 21. [DOI] [PMC free article] [PubMed] [Google Scholar]
- 8.Collins BC, Hunter CL, Liu Y, Schilling B, Rosenberger G, Bader SL, Chan DW, Gibson BW, Gingras AC, Held JM, Hirayama-Kurogi M, Hou G, Krisp C, Larsen B, Lin L, Liu S, Molloy MP, Moritz RL, Ohtsuki S, Schlapbach R, Selevsek N, Thomas SN, Tzheng SC, Zhang S,H, Aebersold R, Nature Communication, 2017, 8, 291. [DOI] [PMC free article] [PubMed] [Google Scholar]
- 9.Chutipongtanate S, Greis KD, Scientific Reports, 2018, 8(1), 15039. [DOI] [PMC free article] [PubMed] [Google Scholar]
- 10.Eismann T, Huber N, Shin T, Kuboki S, Galloway E, Wyder M, Edwards MJ, Greis KD, Shertzer HG, Fisher AB, Lentsch AB. Am J Physiol Gastrointest Liver Physiol, 2008, 296(2), G266–74. [DOI] [PMC free article] [PubMed] [Google Scholar]
Associated Data
This section collects any data citations, data availability statements, or supplementary materials included in this article.
Supplementary Materials
Supplementary Dataset 1. SWATH dataset containing information regarding transitions, peptides, proteins, score, FDR and observed RT.
Supplementary Table 1. Expression data of 397 significant proteins corresponding to the Heatmap showed in figure 4 of the manuscript. The table provides two levels of data; log2-transformed data (which directly used for the heatmap) and their relative protein intensities (calculated from log2-transformed values). All values are based on quantile normalization and missing value replaced by zero.
Supplementary File 2. Detailed methodology section.
Supplementary Figure 1. Overall % coefficient of variation of peptide retention time (RT) to reassure a consistent chromatography applied in SWATH acquisition.
Supplementary File 1_R Notebook. The custom R script to preprocess, analyze and visualize SWATH proteomic dataset (as provided in supplementary dataset 1). This script can be used as a starting point for further bioinformatic analysis and biological.


