

Abstract
BACKGROUND:
Elevated triglycerides (TG) are associated with increased risk of cardiovascular disease (CVD), but the best way to both measure TG and assess TG-related risk remains unknown.
OBJECTIVE:
To evaluate the association between TG and CVD, and determine whether the average of a series of TG measurements is more predictive of CVD risk than a single TG measurement.
METHODS:
We examined 15,792 study participants, ages 40–65, free of CVD from the Atherosclerosis Risk in Communities and Framingham Offspring studies, using fasting TG measurements across multiple exams over time. With up to 10 years follow-up, we assessed time-to-first CVD event, as well as a composite of myocardial infarction, stroke, or cardiovascular death.
RESULTS:
Compared with a single TG measurement, average TG over time had greater discrimination for CVD risk (C-statistic 0.60 vs 0.57). Risk for CVD increased as average TG rose until an inflection point of ~100 mg/dL in men and ~200 mg/dL in women, above which this risk association plateaued. The relationship between average TG and CVD remained statistically significant in multivariable modeling adjusting for LDL-C, and interactions were found by sex and high-density lipoprotein cholesterol level.
CONCLUSIONS:
The average of several TG readings provides incremental improvements for the prediction of CVD relative to a single TG measurement. Regardless of the method of measurement, higher TG were associated with increased CVD risk, even at levels previously considered “optimal” (<150mg/dL).
Keywords: triglyceride measurement, CVD risk prediction, sex, high-density lipoprotein, cholesterol level
Introduction
Despite longstanding epidemiologic data demonstrating the association between elevations in serum triglycerides (TG) and cardiovascular disease (CVD),1-3 many details about the relationship between TG and CVD risk remain unanswered. First, the exact level at which risk begins to increase is unclear. When lipid guidelines for CVD prevention first emerged, elevated TG were defined as >250 mg/dL, based on observational data showing the association between elevated TG and CVD.3-5 Subsequent cohort studies prompted the National Cholesterol Education Program Adult Treatment Panel to modify this definition to >150 mg/dL.6,7 This new definition was consistent with trends observed for TG in publications of the National Health and Nutrition Examination Survey.8-10 Since then, a multitude of observational studies have assessed the CVD risk associated with TG using various measures, including quartiles of TG and log-transformed TG level.,11-16 The exact threshold above which CVD risk increases is less clear; other work has shown increasing risk with elevated TGs above 88 mg/dL and above 133 mg/dL,17,18 Clinical trials evaluating the impact of TG-lowering therapies have used a cutoff around 150 mg/dL to identify adults in need of TG-lowering therapies,19,20 however, specific inflection points or cutoffs, around which the rise in risk associated with TG changes, have not been systematically evaluated with regard to incident CVD risk.
A second unclear detail about the relationship between TG and CVD risk is that TG measurements can be highly variable, depending on when and what a patient’s most recent meal was, as well as other factors. Variation among serial samples for TG is much higher than what is seen with cholesterol (25% vs. 8%).21 Consequently, it is expected that serial measures may perform better than single assessments. Finally, whether the association of TG and CVD risk is relatively stable in all patient types is unclear. Specifically, whether the association of TG and outcomes is constant by age, sex, and factors such body mass index (BMI) or other lipid parameters is not well characterized.
Using data from two well characterized national cohort studies, we performed a detailed examination into the association of TG and CVD risk by: 1) assessing whether an average of several TG measures was more associated with CVD risk than a single assessment either at baseline or using a participant’s highest prior TG level; 2) evaluating the continuous association between TG levels and cardiovascular events across time to determine key inflection points; and 3) assessing whether this association was similar by age, sex, BMI, and low-density lipoprotein cholesterol (LDL-C).
Methods
Study design and sample
We selected patients from two large observational cohort studies: the Atherosclerosis Risk in Communities (ARIC) study and the Framingham Offspring Study. The first visit in the ARIC study was conducted between 1987 and 1989, with follow-up visits every 2–3 years until 1998, and a final visit conducted between 2011 and 2013. In the Framingham Offspring study, participant exam 1 visits were conducted between 1971 and 1975, with follow-up visits occurring approximately every 3–4 years, and a final visit conducted between 2005 and 2008.
In order to evaluate the association between multiple TG measurements over time and future CVD, we selected a baseline visit from each study that would allow us to capture multiple prior TG measurements, as well as sufficient follow-up to assess events. The baseline visit for ARIC was exam 4 (1996–1998, n=10,912), and the baseline visit for Framingham Offspring was exam 6 (1983–1987, n=5,013). These visits were chosen as baseline in order to allow for sufficient time with exposure (to TG) as well as allow for sufficient follow-up time to observe cardiovascular events. From this cohort, we excluded patients younger than 40 years and older than 65 years (n=3818 in ARIC, n=2570 in Framingham Offspring), patients with prevalent CVD (defined as prior myocardial infarction, angina, coronary artery disease, transient ischemic attack, stroke, percutaneous coronary intervention, peripheral artery disease, and heart failure [n=894 in ARIC, n=194 in Framingham Offspring]), and patients with fewer than two available fasting triglyceride measurements at baseline (n=88 in ARIC, n=193 in Framingham Offspring). After exclusions, the final cohort was comprised of 8,068 patients (n=6,012 from ARIC, n=2,056 from Framingham Offspring).
Outcomes and exposures
Our primary endpoint of interest was incident hard cardiovascular events, defined as a composite of myocardial infarction, stroke, and cardiovascular death, with follow-up of up to 10 years. Baseline TG were defined as: TG level at exam 4 for ARIC and exam 6 for Framingham Offspring. Average TG were calculated using the average of all prior TG measurements. Max TG were defined as the highest prior value, regardless of timing.
When TG measurements were missing, linear approximations were used to impute the values. If a subject attended the exam where TG were missing, then the value was approximated using the slope between non-missing visits and the date of the exam. If the subject missed the exam entirely, then the TG value was approximated as the average of the values at the exams prior to and after the missing exam.
Statistical analysis
Descriptive statistics were run on both ARIC and Framingham Offspring cohorts. Continuous variables were reported as median (25th, 75th percentiles). Categorical variables were presented as a number (percentage of the total cohort) falling within the specified subcategory. The distribution of TG levels was assessed in both cohorts.
In order to compare single vs. average TG, univariable Cox proportional hazards models were used to assess the relationship between each measure of TG level and CVD events. Each measure was tested for linearity, and any non-linear relationships were modeled using restricted cubic splines. The relative strength of the measures of TG was then determined by looking at the c-index, Akaike Information Criterion, hazard ratio (HR) for a 1 standard deviation change, and p-value from each univariable model. The measure most closely related to CVD risk (average TG) was then selected for further investigation.
To describe the rate of incident ASCVD by TG level, Kaplan-Meier event curves were generated by quartile of average TG. To account for the nonlinear relationship between average TG and CVD risk, average TG were modeled two ways: first, using restricted cubic splines, and second, using the log2 transformation. The restricted cubic spline analysis was done to assess for potential inflection points in the shape of the association between TG and CVD risk. The log2 transformation was used for multivariable modeling. Multivariable Cox proportional hazards modeling was performed to evaluate the association between the log2 transformed average TG and CVD risk, adjusting for the following variables from the baseline exam: age, sex, BMI, history of diabetes, high-density lipoprotein cholesterol (HDL-C), LDL-C, statin use, blood pressure medication use, ounces of ethanol per week, cholesterol medication (three levels: on statin, not on statin but on non-statin lipid lowering agent, no lipid lowering agent), and cohort. The following interactions were considered in the unadjusted Cox proportional hazards model between TG and CVD risk: age, sex, BMI, diabetes, HDL-C, LDL-C, and statin use. Where interactions were detected, unadjusted spline plots were created by subgroup. HRs with 95% confidence intervals (CIs) were presented per 1 unit change in log2 (average TG; i.e., per doubling of TG). For interactions with continuous covariates, HRs per doubling of TG were presented at specific values of the covariate. In sensitivity analysis, we substituted non-HDL cholesterol for LDL cholesterol in multivariable modeling.
To further understand the interaction between TG and HDL-C, we evaluated the association between the TG:HDL-C ratio and CVD events in univariable and multivariable modeling, adjusting for age, sex, BMI, diabetes, non-HDL-C, statin use and cohort. Unadjusted spline plots were created to visually assess the relationship between TG:HDL-C ratio and CVD events. Kaplan-Meier event rates by subgroup were also calculated stratifying by tertiles of TG and HDL-C.
Institutional review board approval was obtained by all participating centers for the ARIC and Framingham Offspring studies. All participants provided consent prior to enrollment. Data were obtained from the National Institutes of Health Biologic Specimen and Data Repository Information Coordinating Center repository. All analyses were conducted by the Duke Clinical Research Institute (Duke University, Durham, NC) using SAS version 9.4 (SAS Institute, Inc., Cary, NC).
Results
Characteristics of the study population
Our study population consisted of 8,068 participants, including 6,012 from ARIC and 2,056 from Framingham Offspring, with a median follow up of 10 years (Table 1). Very few participants (7.8% overall) were on statin therapy at baseline. Compared with the ARIC population, those in Framingham had less diabetes, less hypertension, more alcohol intake, and included more whites. In both cohorts, use of lipid lowering therapy was low (7.3% in Framingham Offspring and 10.7% in ARIC). The average number of TG measurements available was 4.0 in ARIC and 5.8 in Framingham Offspring. The median age was 58 years; 56.5% were female and 84.2% were white. The distribution of TG values was skewed, with a median TG level of 116 (25th–75th percentile 86–160) in ARIC and 94 (69–132) in Framingham Offspring (Figure 1). The 10th, 25th, 50th, 75th, and 90th percentiles of TGs in males were: 65, 86, 118, 167, and 228 mg/dL and in females were 62, 79, 105, 144, and 196 (Supplement figure 1).
Table 1.
Characteristics of analytic cohort
| Characteristic | Total (n=8068) |
Framingham ARIC (n=2056) |
Offspring (n=6012) |
P-value |
|---|---|---|---|---|
| Age (median 25th 75th, years) | 58, ( 55-62) | 54, (50-60) | 59, (56-62) | <.001 |
| Female (n, %) | 4556 (56.5%) | 1111 (54.0%) | 3445 (57.3%) | 0.010 |
| White (n, %) | 6790 (84.2%) | 2056 (100.0%) | 4734 (78.7%) | <.001 |
| Smoking (n, %) | 1308 (16.3%) | 336 (16.3%) | 972 (16.2%) | 0.912 |
| Diabetes (n, %) | 970 (12.1%) | 123 (6.0%) | 847 (14.1%) | <.001 |
| Systolic BP (median 25th and 75th, mmHg) | 122, 112-135 | 123, 112-135 | 122, 112-135 | 0.486 |
| Diastolic BP (median 25th and 75th, mmHg) | 73, 66-79 | 76, 70-82 | 72, 65-78 | <.001 |
| BMI (median 25th and 75th) | 28, 25-31 | 28, 25-31 | 28, 25-32 | <.001 |
| Ounces of Ethanol per week | 0, 0-2 | 1, 0-3 | 0, 0-1 | <.001 |
| Hypertension treatment (n, %) | 2170 (27.0%) | 393 (19.1%) | 1777 (29.7%) | <.001 |
| Lipid Lowering Medication (n, %) | <.001 | |||
| On Statin | 629 (7.8%) | 120 (5.8%) | 509 (8.5%) | |
| Not on Statin, on other lipid lowering medication | 161 (2.0%) | 31 (1.5%) | 130 (2.2%) | |
| No lipid lowering medicaiton | 7623 (90.2%) | 1904 (92.7%) | 5359 (89.3%) | |
| Fasting Glucose | 99, 92-108 | 96, 90-104 | 99, 93-109 | <.001 |
| Total cholesterol (median 25th and 75th, mg/dL) | 200, 178-225 | 204, 181-230 | 199, 177-224 | <.001 |
| HDL-C (median 25th and 75th, mg/dL) | 48, 39-61 | 50, 40-61 | 47, 39-60 | 0.003 |
| Non-HDL-C (medin 25th and 75th, mg/dL) | 149, 126-174 | 152, 127-178 | 148, 125-173 | <.001 |
| Triglyceride:HDL-C Ratio (medin 25th and 75th) | 2.29, 1.43-3.70 | 1.89, 1.18-3.08 | 2.44, 1.54-3.89 | <.001 |
| LDL-C (median 25th and 75th, mg/dL) | 122, 101-145 | 125, 104-148 | 121, 100-143 | <.001 |
| Average TG (median 25th and 75th, mg/dL) | 110, 82-154 | 94, 69-132 | 116, 86-160 | <.001 |
| Number of TG measurements pre-imputation | Mean: 4.4 | Mean: 5.8 | Mean: 4.0 | |
| Median: 4 | Median: 6 | Median: 4 | ||
| Follow-up time | 10 years | 10 years | 10 years |
ARIC, Atherosclerosis Risk in Communities; BMI, body mass index; BP, blood pressure; HDL-C, high-density lipoprotein cholesterol; LDL-C, low-density lipoprotein cholesterol; TG, triglyceride
Figure 1. Distribution of Baseline TG in Framingham Offspring and ARIC Participants Free of CVD.
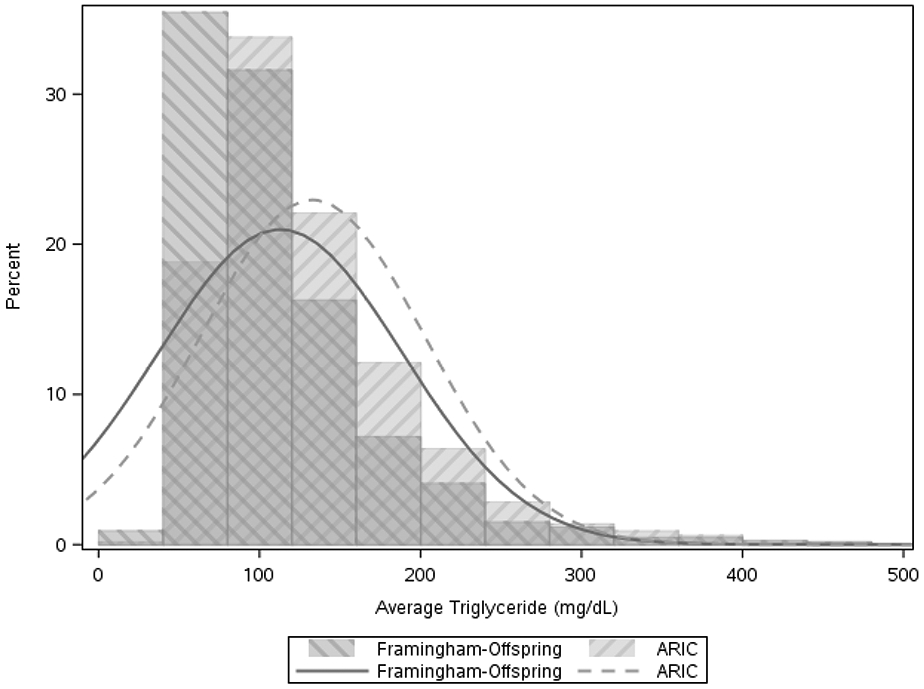
Histogram of distribution of distribution of prior average TG at baseline in Framingham Offspring and ARIC.
ARIC, Atherosclerosis Risk in Communities; TG, triglyceride
Association between triglyceride measures and CVD
Table 2 shows results from univariable analyses of different TG measures and cardiovascular events. Compared with baseline TG, average serum TG level was more highly correlated with CVD events (c-statistic 0.60 vs. 0.57), and had a higher c-statistic than that for TG at baseline (c-statistic 0.57) or maximum prior TG (c-statistic 0.58). Therefore, the average serum TG level was chosen as the primary exposure variable of interest for subsequent analyses.
Table 2.
Association between TG and CVD events
| TG measurement | C- statistic | AUC | p-value | HR (per 1 SD) | SD |
|---|---|---|---|---|---|
| Baseline (mg/dL) | 0.565 | 10273.0 | 0.0007 | 1.06 (1.02 -1.09) | 104.2 mg/dL |
| Average (mg/dL) | 0.603 | 10208.7 | <0.0001 | 1.02 (1.01 – 1.02) | 71.8 mg/dL |
| Log2Average (per doubling of TG) | 0.603 | 10207.4 | <0.0001 | 1.40 (1.30 – 1.51) | 0.67 |
| Maximum* (mg/dL) | 0.584 | 10234.1 | <0.0001 | 1.01 (1.00 – 1.01) | 136.2 mg/dL |
AUC, area under curve, defined as triglycerides x years of exposure using trapezoid rule; COV, coefficient of variation defined as standard deviation/mean; CVD, cardiovascular disease; HR, hazard ratio; SD, standard deviation; TG, triglyceride
Relationship non-linear; modeled using restricted cubic splines using 4 knots.
Characteristics of patients by quartile of average TG are presented in Supplement table 1. Those in the highest quartile of triglycerides included more males, more diabetes, and higher rates of use of cholesterol medication, higher fasting glucose, higher non-HDL cholesterol, and higher LDL cholesterol than those in the lowest quartile.
Figure 2 shows Kaplan-Meier results for cardiovascular risk by quartile of average prior TG (<82 mg/dL, 82–110 mg/dL, 110–153 mg/dL, and ≥153 mg/dL), with increasing event rates by increasing average TG level (p<0.0001). Figure 3 shows the shape of the relationship between TG and CVD risk in univariable analysis using restricted cubic splines. Overall, the risk of CVD increased in proportion with elevation of average TG level until an inflection point around 150mg/dL, at which point the slope of the relationship was attenuated. In univariable analyses, each doubling of serum TG increased CVD risk by 65% (HR 1.65, 95% CI 1.47–1.85). In multivariable modeling including LDL cholesterol, the association remained statistically significant with a 24% increase in CVD risk per doubling of TG (HR 1.24, 95% CI 1.06–1.45). In a sensitivity analysis, we substituted non-HDL as an alternative to LDL cholesterol. After adjusting for non-HDL, the association between TG and CVD events was no longer statistically significant (HR 1.14 per doubling of TG, 95% CI 0.97-1.34, p=0.11).
Figure 2. Kaplan-Meier Analysis of Time to CVD Event by Quartile of Average TG.

Kaplan-Meier curves modeling probability of event over the study period by quartile of prior average TG
CVD, cardiovascular disease; TG, triglyceride
Figure 3. Cubic Splines Model of Association between Average TG and CVD Risk.

Univariable association between average TG and CVD risk
*Dotted lines represent 95% CI
CI, confidence interval; CVD, cardiovascular disease; TG, triglyceride
Interaction Analyses and Impact of HDL-C
Table 3 shows results of interaction analyses for the association between TG and CVD risk. Statistically significant interactions were found between average TG level and sex (p=0.01), as well as average TG level and HDL-C (p=0.01). The relationship between average TG level and CVD risk was stronger for women (HR 1.79, 95% CI 1.50–2.14 vs. HR 1.34, 95% CI 1.15–1.55) and with successively higher levels of HDL-C (HR 1.68, 95% CI 1.37–2.06; HR 1.55, 95% CI 1.29–1.86; and HR 1.32, 95% CI 1.13–1.53 at HDL-C levels of 60 mg/dL, 50 mg/dL, and 40 mg/dL, respectively). Figure 4a displays the association between TG and CVD risk in men and women. In men, risk appeared to increase with increasing TG to around 100 mg/dL, whereas in women, risk increased to around 200 mg/dL. Figure 4b shows the association between TG and CVD risk by HDL-C group. In those with low HDL-C, the association between TG level and risk was steepest until around 100 mg/dL, whereas in those with higher HDL-C, CVD risk increased with increasing TG levels. Interactions between TG and age, BMI, diabetes, LDL-C, and statin use were not statistically significant.
Table 3.
Interaction analysis of association between TG and CVD risk
| Covariate | HR* (95% CI) |
p-value |
|---|---|---|
| Age @ | ||
| 50 years | 1.82 (1.37 - 2.42) | 0.178 |
| 60 years | 1.50 (1.33 - 1.69) | |
| Sex | ||
| Female | 1.76 (1.47 - 2.12) | 0.021 |
| Male | 1.33 (1.14 - 1.56) | |
| BMI @ | ||
| 25 kg/m2 | 1.56 (1.34 - 1.82) | 0.607 |
| 30 kg/m2 | 1.52 (1.34 - 1.72) | |
| Diabetes | ||
| No | 1.45 (1.25 - 1.68) | 0.274 |
| Yes | 1.25 (1.00 - 1.56) | |
| Statins | ||
| No | 1.58 (1.40 - 1.79) | 0.673 |
| Yes | 1.44 (0.95 - 2.18) | |
| LDL-C @ | ||
| 80 mg/dL | 1.57 (1.29 - 1.91) | 0.682 |
| 120 mg/dL | 1.62 (1.42 - 1.85) | |
| 165 mg/dL | 1.68 (1.36 - 2.07) | |
| HDL-C @ | ||
| 40 mg/dL | 1.32 (1.13 - 1.53) | 0.014 |
| 50 mg/dL | 1.55 (1.29 - 1.86) | |
| 60 mg/dL | 1.68 (1.37 - 2.06) | |
BMI, body mass index; CI, confidence interval; CVD, cardiovascular disease; HDL-C, high-density lipoprotein cholesterol; HR, hazard ratio; LDL-C, low-density lipoprotein cholesterol; TG, triglyceride
Hazard ratio represents the change in hazard due to a doubling of triglyceride levels.
Figure 4. Association between Average TG and CVD Risk According to A) Sex and B) HDL-C Level.


Association between average TG level and CVD risk by: A) sex; and B) HDL-C level.
CVD, cardiovascular disease; HDL-C, high-density lipoprotein cholesterol; TG, triglyceride
Supplement Figure 3 shows Kaplan Meier event rates stratified by tertiles of average TG and HDL-C. Risk was lowest in those in the lowest tertile of TG and highest tertile of HDL-C. In univariable analysis, TG:HDL-C ratio was associated with CVD risk, with a steep increase in risk up to a ratio around 4 (HR 1.44, 95% CI 1.33-1.56) and no additional increase in risk beyond that point (Supplement figure 2). In unadjusted analysis, the association between TG:HDL-C ratio and 10-year CVD risk was significant (1.48, 95% CI 1.37-1.60) and in multivariable analysis, this relationship was attenuated, but remained significant after adjustment for age, sex, BMI, antihypertensives, cholesterol medications, ethanol use, diabetes, hyperlipidemia, and non-HDL (HR 1.16, 95% CI 1.05-1.28).
Discussion
While elevated TG have long been known to be associated with increased risk of CVD, how to best quantify TG-associated CVD risk remains unclear. In this analysis of a large, prospectively-followed sample of patients from two observational cohort studies, we found that using the average of multiple prior TG measurements improved risk prediction more so than a single measurement. Additionally, the association of TG and CVD risk continued well below TG levels of 150 mg/dL, consistent with what has been seen previously.17, 18, 22, 23 Our study extends these findings by modeling risk by average TG to show that risk behaves linearly prior to an inflection point of about 150mg/dL in a cohort of participants free of pre-existing CVD.
Measuring and Interpreting TG
Our finding that average TG levels over time proved to be a better approximation of CVD risk than a one-time measurement, a maximum value, or variability across values is not surprising, in light of the inherent variability of TG and given how the biology of TG impacts its own measurement. Since fasting status impacts TG levels, TG may vary significantly between measurements. Averaging TG minimizes the noise in these measurements and decreases the impact of outliers. With increasing capture of all lab values in an electronic health record, the use of average prior TG may become more clinically viable. Future epidemiologic studies and clinical trials using TG as inclusion criteria may consider using average TG rather than single point-in-time measurements.
When patients receive reports of their lipid levels, these reports are often accompanied by descriptors of how their levels compare with “normal” ranges. Typically, TG levels <150 mg/dL are described as “normal” or “optimal” in these lab reports; however, we found that the association between TG levels and CVD risk continued well below TG levels of 150 mg/dL. Thus, even at what is considered within a “normal” range, risk is increased with increasing TG levels, suggesting that widely accepted “normal” TG ranges may not be biologically optimal.
Our data are consistent with other studies that have found increasing CVD with increasing TG levels starting below 150 mg/dL.17,18,22,23 This supports the American Heart Association’s statement that an “optimal” fasting TG level is less than 100 mg/dL, and further suggests that an “optimal” level may be even lower .8
The variability across previous studies may reflect differences in the study populations used. As we found, the slope of the relationship between TG and CVD risk can vary across groups, including non-HDL and sex. Another explanation for this variability may be differences in the method used to select the reference group for analysis. For this reason, rather than bin patients by groups, we chose to analyze TG as a continuous measure.
Interactions with Sex and HDL-C
Another series of questions revolves around whether the association of TG and CVD risk varies as a function of age, sex, BMI, diabetes, LDL-C, HDL-C, or statin use. While diabetes and BMI are both associated with increasing TG, we found no interaction between these factors and the association between TG and CVD; this finding suggests that regardless of diabetes status or BMI, the risk associated with increasing TG was similar. On the other hand, two statistically significant interactions were found according to sex and HDL-C, with the association between CVD and TG being stronger in women and individuals with higher HDL-C levels. We show that the relationship between TG and CVD risk appeared steeper in men compared with women. In women, the TG-to-CVD risk association was flatter but plateaued at a higher value than men. Given the smaller sample size of adults with TG over 150 mg/dL, the exact location of this inflection point by sex remains unclear. However, importantly, in both men and women, increasing TG were associated with increased CVD risk even among those with TG well below 150 mg/dL. Sex-specific differences in the TG/CVD association are not unprecedented. TG levels and CVD risk are known to vary significantly by sex. Previous observational data have demonstrated that TG are more strongly associated with CVD risk in women vs. men.3,11 On the other hand, trials of fibrate therapy have found conflicting results for a sex-based interaction in the association between triglyceride-lowering therapy and CVD events.16,19,24 One explanation for sex-based variance may be related to hormonal differentiation between men and women leading to differences in the relative atherogenicity of TG, as well as the type and composition of particles contributing to increasing TG. Overall, the differences we find between TG and CVD risk in men compared to women suggest that using different cutoffs by sex may allow for more accurate risk prediction.
We also identified a key interaction between HDL-C and TG. The interaction between HDL-C and TG is interesting in light of prior trials demonstrating a greater impact of triglyceride-lowering therapies on CVD event rates in participants with lower HDL-C.15,19 In this analysis, overall increasing TG were associated with greater increases in CVD risk among those with higher HDL-C; this association may be partially explained by the multivariable modeling performed adjusting for BMI and diabetes status. Low HDL-C and high TG are both part of metabolic syndrome, and often co-exist. Therefore, in patients with lower HDL-C, some of the TG-related risk may be explained by the presence of metabolic syndrome and accounted for in multivariable modeling. Importantly, regardless of HDL-C level, increasing TG were associated with increasing CVD risk. Nevertheless, both TG and HDL-C appear to have a role in CVD risk prediction. Isolated low HDL-C has not been shown to be a predictor of CVD independent of TG and LDL-C,25 while hypertriglyceridemia, in more recent studies, has been shown to be a predictor of CVD, even when adjusting for HDL-C.24,26 We also demonstrate that greater TG:HDL-C ratio associates with increased CVD risk with an inflection point that occurs around a ratio of 4. This relationship remains significant after adjustment for a variety of key variables, supporting that TG elevation and reduced HDL-C in combination represent a higher-risk phenotype, but only up until a certain point where conferred risk then levels off.
Our data support the use of TG to identify patients at highest risk of CVD events. However, whether TG themselves are a modifiable risk factor for cardiovascular disease or if they serve as a marker for other risk factors remains unclear. Adjusting for factors associated with both CVD and high TG such as diabetes, BMI, alcohol use, LDL-C and HDL-C attenuated but did not fully account for the association between TG and CVD events. However, using non-HDL-C, rather than LDL-C, in our models, did appear to attenuate the apparent independent association between TG and CVD risk. That non-HDL-C, but not LDL-C, appeared to account for much of the association between TG and CVD suggests that much of the apparent risk “captured” by TG measurements may be due to elevations in VLDL and IDL particles, triglyceride-rich, apoB containing lipoproteins. This is consistant with genetic studies suggesting that the risk associated with elevated TG can be accounted for through their association with elevations in apoB.27 Ultimately, a shift to increased use of non-HDL or apoB to assess lipid-related CVD risk may decrease the need to measure TG to evaluate CVD risk. However, current clinical practice continues to rely on the measurement of LDL-C, TG, and HDL-C , not non-HDL-C, to assess lipid-related CVD risk.
Limitations
This study has several limitations. First, despite the large sample size, relatively few patients had TG levels above 250 mg/dL; therefore, CIs are wide around the shape of the relationship between TG and CVD risk above this level. Thus, this study cannot answer the question of whether increasing TG above 250 mg/dL continues to increase risk. However, due to the large numbers of patients with TG <200 mg/dL, the study is well powered to demonstrate the association between TG and CVD risk in what would otherwise be considered a “normal” level. Second, this analysis is limited to individuals free of CVD, and cannot be extrapolated to those with prevalent disease. Third, all of the measurements used were from fasting samples. Several studies have shown that non-fasting TG measurements may also provide important data regarding CVD risk.28,29 Fourth, we did not adjust for all potential factors associated with triglyceride levels including certain medications (i.e. hormone replacement therapy, beta blockers). These factors may both mediate and confound the relationship between TG and CVD.
Finally, we evaluated the concentration of TG, but due to lack of apolipoprotein B measurements at the baseline exam used in Framingham, we were unable to determine the composition of the TG-containing particles in these subjects. There are significant differences in the atherogenicity of chylomicrons compared with very low-density lipoprotein cholesterol particles, and using TG concentration overall fails to capture the differences in these particle types.
Conclusion
In conclusion, we demonstrate a direct linear relationship between average TG and CVD risk even at levels well below what would be considered “normal” i.e. 150mg/dL, potentially due to the association between TG and elevations in non-HDL cholesterol. Our work adds to the body of evidence supporting an independent relationship between TG level and CVD risk and expands upon previous observations of lowered CVD risk in patients with TG far below the 150mg/dL cutoff. We find this relationship to be most pronounced in women and those with higher HDL-C, suggesting that TG may play a stronger role in these specific populations.
Supplementary Material
Highlights.
Averaging triglycerides (TG) improves risk prediction over single measurements
TG are associated with increased CVD risk, even in “normal” range (<150 mg/dL)
The population distribution of TG and its association with CVD events differ by sex
Acknowledgments
The authors would like to thank Erin Campbell, MS, for her editorial contributions to this manuscript.
Sources of funding
This study was funded by Amarin, and Dr. Navar receives support from NIH K01HL133416. The study sponsor co-authors participated in the design of the study, interpretation of the results, and contributed to the manuscript. DCRI investigators controlled all analyses and the decision to publish.
Footnotes
Publisher's Disclaimer: This is a PDF file of an unedited manuscript that has been accepted for publication. As a service to our customers we are providing this early version of the manuscript. The manuscript will undergo copyediting, typesetting, and review of the resulting proof before it is published in its final form. Please note that during the production process errors may be discovered which could affect the content, and all legal disclaimers that apply to the journal pertain.
Conflict of interest disclosures
T Aberra reports no relevant conflicts of interest.
ED Peterson reports research grants from Amgen, Sanofi, Astrazeneca, Merck. Consultant/advisory board from Amgen. Consultant/advisory board from AstraZeneca, Merck, and Sanofi Aventis.
NJ Pagidipati reports research grants from Alexion Pharmaceuticals, Inc., Amarin Pharmaceutical Company, Amgen, Inc., AstraZeneca, Baseline Study LLC, Boehringer Ingelheim, Duke Clinical Research Institute, Eli Lilly & Company, Novo Nordisk Pharmaceutical Company, Regeneron Pharmaceuticals, Inc., Sanfofi-S.A., and Verily Life Sciences Research Company.
H Mulder reports no relevant disclosures.
DM Wojdyla reports no relevant disclosures.
S Philip reports being an employee and stock shareholder of Amarin Pharma, Inc.
C Granowitz reports being an employee and stock shareholder of Amarin Pharma, Inc.
AM Navar reports research grant from Amarin, Janssen, Amgen, Sanofi, and Regeneron Pharmaceuticals. Consultant/advisory board from Amarin, Amgen, Esperion, Novartis, New Amsterdam, Pfizer, BI, Novonordisk, AstraZeneca, Janssen, The Medicines Company, Sanofi, and Regeneron.
References
- 1.Sniderman AD, Couture P, Martin SS, et al. Hypertriglyceridemia and cardiovascular risk: a cautionary note about metabolic confounding. J Lipid Res. 2018;59(7):1266–1275. [DOI] [PMC free article] [PubMed] [Google Scholar]
- 2.Sarwar N, Danesh J, Eiriksdottir G, et al. Triglycerides and the risk of coronary heart disease: 10,158 incident cases among 262,525 participants in 29 Western prospective studies. Circulation. 2007;115(4):450–458. [DOI] [PubMed] [Google Scholar]
- 3.Castelli WP. Epidemiology of triglycerides: a view from Framingham. Am J Cardiol. 1992;70(19):3H–9H. [DOI] [PubMed] [Google Scholar]
- 4.Assmann G, Schulte H. The Prospective Cardiovascular Munster (PROCAM) study: prevalence of hyperlipidemia in persons with hypertension and/or diabetes mellitus and the relationship to coronary heart disease. Am Heart J. 1988; 116(6 Pt 2):1713–24. [DOI] [PubMed] [Google Scholar]
- 5.Assmann G, Schulte H, von Eckardstein A. Hypertriglyceridemia and elevated lipoprotein(a) are risk factors for major coronary events in middle-aged men. Am J Cardiol. 1996;77(14):1179–84. [DOI] [PubMed] [Google Scholar]
- 6.Expert Panel on Detection, Evaluation, and Treatment of High Blood Cholesterol in Adults. Executive Summary of The Third Report of The National Cholesterol Education Program (NCEP) Expert Panel on Detection, Evaluation, And Treatment of High Blood Cholesterol In Adults (Adult Treatment Panel III). JAMA. 2001;285(19):2486–2497. [DOI] [PubMed] [Google Scholar]
- 7.Stone NJ, Bilek S, Rosenbaum S. Recent National Cholesterol Education Program Adult Treatment Panel III update: adjustments and options. Am J Cardiol. 2005;96(4A):53E–59E. [DOI] [PubMed] [Google Scholar]
- 8.Miller M, Stone NJ, Ballantyne C, et al. Triglycerides and cardiovascular disease: a scientific statement from the American Heart Association. Circulation. 2011;123(20):2292–2333. [DOI] [PubMed] [Google Scholar]
- 9.Carroll MD, Lacher DA, Sorlie PD, Cleeman JI, Gordon DJ, Wolz M, Grundy SM, Johnson CL. Trends in serum lipids and lipoproteins of adults, 1960–2002. JAMA. 2005; 294: 1773–1781. [DOI] [PubMed] [Google Scholar]
- 10.Cohen JD, Cziraky MJ, Cai Q, Wallace A, Wasser T, et al. 30-year trends in serum lipids among United States adults: results from the National Health and Nutrition Examination Surveys II, II, and 1999-2006. Am J Cardiol. 2010;106(7): 969–75. [DOI] [PubMed] [Google Scholar]
- 11.Hokanson JE, Austin MA. Plasma triglyceride level is a risk factor for cardiovascular disease independent of high-density lipoprotein cholesterol level: a meta-analysis of population-based prospective studies. J Cardiovasc Risk. 1996;3(2):213–219. [PubMed] [Google Scholar]
- 12.Jorgensen AB, Frikke-Schmidt R, West AS, Grande P, Nordestgaard BG, Tybjaerg-Hansen A. Genetically elevated non-fasting triglycerides and calculated remnant cholesterol as causal risk factors for myocardial infarction. Eur Heart J. 2013;34(24):1826–1833. [DOI] [PubMed] [Google Scholar]
- 13.Stavenow L, Kjellström T. Influence of serum triglyceride levels on the risk for myocardial infarction in 12,510 middle aged males: interaction with serum cholesterol. Atherosclerosis. 1999;147(2):243–247. [DOI] [PubMed] [Google Scholar]
- 14.Sharrett AR, Ballantyne CM, Coady SA, et al. Coronary heart disease prediction from lipoprotein cholesterol levels, triglycerides, lipoprotein(a), apolipoproteins A-I and B, and HDL density subfractions: The Atherosclerosis Risk in Communities (ARIC) Study. Circulation. 2001;104(10):1108–1113. [DOI] [PubMed] [Google Scholar]
- 15.ACCORD Study Group, Ginsberg HN, Elam MB, et al. Effects of combination lipid therapy in type 2 diabetes mellitus. N Engl J Med. 2010;362(17):1563–1574. [DOI] [PMC free article] [PubMed] [Google Scholar]
- 16.Bezafibrate Infarction Prevention (BIP) study. Secondary prevention by raising HDL cholesterol and reducing triglycerides in patients with coronary artery disease. Circulation. 2000;102(1):21–27. [DOI] [PubMed] [Google Scholar]
- 17.Pedersen SB, Langsted A, Nordestgaard BG. Nonfasting Mild-to-Moderate Hypertriglyceridemia and Risk of Acute Pancreatitis. JAMA Intern Med. 2016;176(12): 1834–1842. [DOI] [PubMed] [Google Scholar]
- 18.Lawler PR, Kotrri G, Koh M, Goodman SG, Farkouh ME, Lee DS, Austin PC, Udell JA, Ko DT. Real-world risk of cardiovascular outcomes associated with hypertriglyceridaemia among individuals with atherosclerotic cardiovascular disease and potential eligibility for emerging therapies, European Heart Journal. 2020;41(1):86–94 [DOI] [PubMed] [Google Scholar]
- 19.Scott R, O'Brien R, Fulcher G, et al. Effects of fenofibrate treatment on cardiovascular disease risk in 9,795 individuals with type 2 diabetes and various components of the metabolic syndrome: the Fenofibrate Intervention and Event Lowering in Diabetes (FIELD) study. Diabetes Care. 2009;32(3):493–498. [DOI] [PMC free article] [PubMed] [Google Scholar]
- 20.Bhatt DL, Steg PG, Miller M, et al. Cardiovascular risk reduction with icosapent ethyl for hypertriglyceridemia. N Engl J Med. 2019;380(1):11–22. [DOI] [PubMed] [Google Scholar]
- 21.Jacobs DR Jr, Barrett-Connor E. Retest reliability of plasma cholesterol and triglyceride. The Lipid Research Clinics Prevalence Study. Am J Epidemiol. 1982;116(6):878–885. [DOI] [PubMed] [Google Scholar]
- 22.Kajikawa M, Maruhashi T, Kishimoto S, et al. Target of triglycerides as residual risk for cardiovascular events in patients with coronary artery disease - post hoc analysis of the FMD-J Study A. Circ J. 2019;83(5):1064–1071. [DOI] [PubMed] [Google Scholar]
- 23.Jeppesen J, Hein HO, Suadicani P, Gyntelberg F. Low triglycerides-high density lipoprotein cholesterol and risk of ischeic heart disease. Arch Intern Med. 2001;161(3):361–6. [DOI] [PubMed] [Google Scholar]
- 24.Klempfner R, Erez A, Sagit BZ, et al. Elevated triglyceride level is independently associated with increased all-cause mortality in patients with established coronary heart disease: twenty-two-year follow-up of the Bezafibrate Infarction Prevention Study and Registry. Circ Cardiovasc Qual Outcomes. 2016;9(2):100–108. [DOI] [PubMed] [Google Scholar]
- 25.Bartlett J, Predazzi IM, Williams SM, et al. Is isolated low high-density lipoprotein cholesterol a cardiovascular disease risk factor? New insights from the Framingham Offspring Study. Circ Cardiovasc Qual Outcomes. 2016;9(3):206–212. [DOI] [PMC free article] [PubMed] [Google Scholar]
- 26.Toth PP, Philip S, Hull M, Granowitz C. Association of elevated triglycerides with increased cardiovascular risk and direct costs in statin-treated patients. Mayo Clin Proc. 2019;94(9):1670–1680. [DOI] [PubMed] [Google Scholar]
- 27.Ference BA, Kastelein JJP, Ray KK, et al. Association of Triglyceride-Lowering LPL Variants and LDL-C-Lowering LDLR Variants With Risk of Coronary Heart Disease. JAMA. 2019;321(4):364–373. [DOI] [PMC free article] [PubMed] [Google Scholar]
- 28.Stensvold I, Tverdal A, Urdal P, Graff-Iversen S. Non-fasting serum triglyceride concentration and mortality from coronary heart disease and any cause in middle aged Norwegian women. BMJ. 1993;307(6915):1318–1322. [DOI] [PMC free article] [PubMed] [Google Scholar]
- 29.Nordestgaard BG, Benn M, Schnohr P, Tybjaerg-Hansen A. Nonfasting triglycerides and risk of myocardial infarction, ischemic heart disease, and death in men and women. JAMA. 2007;298(3):299–308. [DOI] [PubMed] [Google Scholar]
Associated Data
This section collects any data citations, data availability statements, or supplementary materials included in this article.