

Abstract
Childhood Pb exposure is associated with a multitude of poor health outcomes. In food-insecure areas, growing fresh produce in backyard gardens or on vacant industrial properties are seen as options for parents. The question arises, could Pb accumulate in consumable tissues of common produce when grown in metals-rich soils at concentrations that would pose a risk to children. This study investigated factors contributing to the accumulation of Pb in consumable tissues of nine common produce crops grown in metals-rich soils from backyard gardens and a former industrial property. Pb in consumable tissues was directly quantified at concentrations less than 1 μg g-1 via X-ray fluorescence (XRF) using protocols specifically developed for use in plant matrices. The accumulation of Pb in prepared raw consumable tissues in three Pb-rich soils was the greatest in modified taproot crops (mean Pb of 11.8 ± 14.6 μg g-1; turnip, beetroot, radish, carrot), with lesser concentrations in fruits (mean Pb of 2.0 ± 3.0 μg g-1; tomato, pepper), and potatoes (mean Pb of 0.7 ± 1.1 μg g-1). An exposure risk evaluation using the USDFA IRL for Pb indicates that consumption of less than 1g of certain produce grown in this study, including produce grown in garden soils from residential properties, drastically increases the risk of Pb exposure in children. This study further indicates the proportion of Pb contributed to the daily body burden in children from food is far greater than previously understood, and in all modeled cases, the contribution of Pb from food on a daily basis far outweighs the contribution of Pb from drinking water. For an average child, after addressing over-riding soil/dust impacts, addressing food quality is critical to minimizing Pb exposure.
Keywords: Urban agriculture, XRF, Heavy metals, Child lead exposure, USFDA
Graphical abstract
1.0. INTRODUCTION
Growing produce in urban centers is actively encouraged in order to increase food security and strengthen communities (Ghose and Pettygrove, 2014; Pettygrove and Ghose, 2018). However, for community members with limited mobility and/or financial resources, few options exist for growing produce other than to use in-place soils at residential properties, which could result in produce cultivation in metals-rich soils. A multitude of poor health outcomes in children are associated with Pb exposure (Amato et al., 2013; Keller et al., 2017; Lane et al., 2008; Magzamen et al., 2015; Sampson and Winter, 2018; Schnur and John, 2014), and although much progress has been made since the 1970s in reducing blood Pb in children (Dignam et al., 2019), Pb exposure continues to be a critical environmental justice issue in minority/low-income neighborhoods (Whitehead and Buchanan, 2019).
Blood lead concentrations in children have been shown to be strongly associated with the concentration of Pb in soil (Laidlaw et al., 2016; Zahran et al., 2015) and the presumption is that ingestion of soil+dust is the most significant exposure route in children. The concentration of Pb in urban soils is known to be highly variable (Clark et al., 2008, 2006; Defoe et al., 2014; Finster et al., 2004; Huang et al., 2012; McBride et al., 2014; Perroy et al., 2014; Sharma et al., 2015) and the sources of Pb in urban soils represent a broad continuum of historic land uses/spills/releases. Several studies have broadly attributed the primary sources of Pb in urban soils to weathering paint (Clark et al., 2008, 2006; Laidlaw et al., 2018); transportation (Clark et al., 2006); stormwater or river water used for irrigation (Ratul et al., 2018; Tom et al., 2014); soil amendments (Murray et al., 2011); or anthropogenic fill, such as foundry sand and industrial waste/debris. More localized spills/releases associated with industry/mining (Augustsson et al., 2015; Mombo et al., 2016; Pizarro et al., 2016; Yuan et al., 2019) and the use of fertilizers/pesticides (Reboredo et al., 2019) are also acknowledged inputs of Pb to agricultural soils.
In the context of urban agriculture, the mobility, toxicity, and bioavailability of Pb in soil (especially anthrosols) is a function of the solubility of the Pb source and the availability of the Pb+2 cation (or very rarely as Pb4OH4+4), which is strongly regulated in soil by pH, cation exchange capacity, and the presence of organic and inorganic ligands. Common crops grown in metals-rich soils have the potential to accumulate Pb in consumable tissues (Clark et al., 2006; Ferri et al., 2015; Finster et al., 2004; Jolly et al., 2013; Lima et al., 2009; Nabulo et al., 2011; Rodriguez-Iruretagoiena et al., 2015; Sekara et al., 2005; Yousaf et al., 2016). Accumulation of Pb in consumable produce is strongly associated with crop type, with more commonly studied modified taproot crops (e.g. carrots) tending to accumulate more Pb than fruit crops (e.g. tomatoes, beans); however, very little is known about the potential for Pb accumulation in beetroots and in potatoes grown in metals-rich soils. In addition, although parents are encouraged to feed children brightly colored produce, little is known about the role pigments may play in accumulating Pb in select root crop cultivars. Several best management practices have been recommended to reduce the potential for Pb exposure (Abdel-Rahman et al. 2018; Brown et al. 2016; Mombo et al. 2016); however, as the risk for Pb exposure cannot be eliminated, continued evaluation of best management practices in the context of home-grown produce grown in residential soils is warranted. Therefore, a study growing a wide variety of produce in soils collected from urban sources, including existing residential vegetable gardens, is warranted so that a more realistic evaluation of exposure risk can be completed.
Estimates suggest that consumption of vegetables is a secondary, less critical exposure route (Augustsson et al., 2015; Brown et al., 2016; Chopra and Pathak, 2015; Ferri et al., 2015; Jolly et al., 2013). However, prior work (e.g. Attanayake et al., 2015; Entwistle et al., 2019; Mombo et al., 2016; Yousaf et al., 2016) did not evaluate the accumulation of Pb in produce grown in soils with Pb concentrations representative of soil from inner-city residential neighborhoods (e.g. Brinkmann, 1994; Augustsson et al. 2015; Finster et al. 2004; Obrycki et al. 2017). Of work evaluating Pb accumulation in produce grown in soils close to the range of Pb found in urban soils, the sample sizes and diversity of produce was limited (Finster et al., 2004) or the source of Pb was associated with an acidic spill (Lima et al., 2009) or discharge from mining (Augustsson et al., 2015).
Recent work summarizing the literature has pointed out the importance of food as an exposure route (Rai et al., 2019). Although commercial foods in the United States are generally considered safe, work has identified Pb in commercially-sourced spices, ethnic foods, folk medicines, and other foods (Dignam et al., 2019; Hore et al., 2019). Further, the United States Food and Drug Administration (USFDA) recently established an Interim Reference Level (IRL) for Pb for children aimed at achieving the Center for Disease Control’s blood lead reference value of 5 μg dL−1 (USFDA, 2019). An IRL was also established for “adults”, which specifically targets women of childbearing age. Therefore, further evaluation of potential Pb exposure from consumption of home-grown produce is clearly warranted.
X-Ray fluorescence (XRF) spectroscopy is a non-destructive rapid quantitation technique commonly used in geologic studies for determining element concentrations in rocks and soil. Prior work has used XRF to quantify heavy metals in foods; however, previous studies that used XRF spectroscopy to measure Pb in produce failed to reach limits of detection less than 1 μg g−1 due to several critical factors (Marguí et al., 2009; Palmer et al., 2009; Singh et al., 2017). By managing critical factors described in Byers et al. (2019) associated with XRF, this study validates the usefulness of this analytical technique in evaluating the risk for Pb exposure though ingestion of produce.
This study addresses the above limitations by: (1) using newly-developed XRF sample preparation techniques and quantification routines to measure Pb in a variety of common crops grown in a range of Pb-rich residential and former industrial urban soils, (2) evaluating factors predicting the accumulation of Pb in consumable crop tissues, and (3) assessing the potential Pb exposure to a child through consumption of produce grown in metals-rich soil in the context of other exposure vectors.
2.0. METHODS
2.1. Identification of Project Area
Minority (non-white) children less than 3 years of age, living in older homes, from low-income families, are at the greatest risk for lead poisoning (Amato et al., 2013; City of Milwaukee, 2017). The lead poisoning rate of children in the City of Milwaukee, and in particular those living in Census Tract 90, is nearly ten times the rate of the United States (Table 1). Demographics from Census Tract 90 characterize the target area as a high-density, low-income, minority, environmental justice community, which is supported by a recent study of the overall area by Pettygrove and Ghose (2018). Therefore, using soils from vegetable gardens collected from occupied residential properties in Census Tract 90 is considered a practical way to evaluate the risk for Pb exposure through consumption of produce grown at residential properties. As estimated by Dignam et al. (2019), upwards of 23 million homes in the US are estimated to pose a risk for Pb exposure due to lead-bearing paint; therefore, the applicability of the results of this study extend far beyond the project area.
Table 1.
Demographics of the target Census Tract compared to the City of Milwaukee, Milwaukee County, the State of Wisconsin, and the United States
| Population Demographic | Census Tract 90 |
City of Milwaukee |
Milwaukee County |
State of Wisconsin |
United States |
|---|---|---|---|---|---|
| Population Density | 13,314 | 6,191 | 3,943 | 107 | 92 |
| Median age | 23 | 32 | 35 | 40 | 38 |
| Percent of Population < 6 | 16% | 8% | 7% | 6% | 6% |
| Percent of Population < 9 | 26% | 15% | 14% | 12% | 13% |
| Percent of Population <18 | 44% | 26% | 24% | 22% | 23% |
| Percent non-white | 96 % | 64 % | 49 % | 19 % | 39 % |
| Median household income | $28,113 | $39,093 | $47,591 | $59,305 | $60,336 |
| Percent poverty | 40 % | 25 % | 19 % | 11 % | 13 % |
| Percent of Homes Built Pre-1969 | 81 % | 80 % | 73 % | 46 % | 39 % |
| 2013-2016 Lead Poisoning Rate for Children (age 1-6 years) | 29 % | 12 % | 9 % | 8 % | 3 % |
Note: Demographic data from the 2017 American Community Survey (US Census Bureau, 2019); population density is the estimated number of people per square mile; 2013-2016 blood lead poisoning rate is the percent of children with a blood lead concentration greater than 5 μg dl−1 per the number of children tested (CDC, 2019; City of Milwaukee, 2017; WDHS, 2018).
2.2. Acquisition of Metals-Rich Soil
Soil samples were collected from 14 owner-occupied properties in Census Tract 90 with active vegetable gardens. The concentrations of heavy metals in these soil samples were determined for screening purposes using wavelength dispersive XRF (WD-XRF) using procedures and custom calibrations as described in Byers et al. (2016). Owners of two of the properties were willing to donate their garden soil to this study. The garden at Residence 1 was located adjacent to a painted garage constructed prior to 1978 and visible white paint chips were present in the garden soil. The total Pb in soil from Residence 1 ranged from 1,300 to 13,400 μg g−1, with a mean of 5,950 ± 4,922 μg g−1. The garden at Residence 2 was located adjacent to a retaining wall and a painted wood deck constructed prior to 1978 and visible brown paint chips were present in the garden soil. The total Pb in soil from Residence 2 ranged from 1,800 to 6,300 μg g−1, with a mean of 5,017 ± 1,608 μg g−1. Although the concentrations of Pb in the two garden soils are much greater than health-based direct contact soil standards set by USEPA and the Wisconsin Department of Natural Resources (WDNR, the state environmental regulatory agency), the concentrations are considered representative of the variability of Pb in soils in cultivated vegetable gardens located at residential properties under similar circumstances and are within ranges of Pb concentrations in urban soils identified by others (e.g. Augustsson et al. 2015; Finster et al. 2004; Obrycki et al. 2017) and are similar to previous soil studies in Milwaukee (Brinkmann, 1994). Soil from each vegetable garden was dug by hand using a stainless-steel shovel, transported to the University of Wisconsin – Milwaukee (UWM) greenhouse, and placed into lined 5-gallon plastic horticulture pots.
To evaluate a possible exposure scenario where children could consume produce grown on former industrial land without permission of the landowner (referred to as “guerilla gardening”), soil was collected from an abandoned former metal foundry undergoing cleanup/remediation, transported, and placed in lined horticulture pots at the UWM greenhouse. The total Pb in soil from the Former Foundry ranged from 724 to 2,900 μg g−1, with a mean of 1,825 ± 556 μg g−1.
A common best management practice to increase the safety of urban agriculture is to replace urban soil with commercial topsoil. To simulate this practice, bags of Scotts® Premium Topsoil (The Scotts Company LLC; Marysville, Ohio) were purchased, and placed in lined horticulture pots at the UWM greenhouse. The total Pb concentration in commercial topsoil ranged from 4 to 5 μg g−1, with a mean of 4.5 ± 0.4 μg g−1.
2.3. Cultivation of Produce
Produce was selected for this study to represent a variety of consumable tissue types common in urban gardens. Cultivars were selected to represent a variety of pigments. Produce grown in this study includes the following: carrot (Daucus carota subsp. sativus var. 'Scarlet Nantes'; var. ‘Pusa Asita Black’; and var. ‘Lunar White’); beetroot (Beta vulgaris L. var. 'Detroit'; var. ‘Chioggia’: and var. ‘Albino’); turnip (Brassica rapa var. 'Purple Top White Globe’); radish (Raphanus sativus var. 'Champion'); potato (Solanum tuberosum L. var. ‘Yukon Gold’); tomato (Solanum lycopersicum L. var. ‘Better Boy’); and sweet pepper (Capsicum annuum L. var. 'Sweet Banana'). Vegetable seeds packaged by W. Atlee Burpee & Co. (Warminster, PA), seedlings (tomato and sweet pepper), and seed potatoes were purchased from a big-box home-improvement retailer located in the City of Milwaukee, Wisconsin. Seeds of heirloom beetroot cultivars (var. ‘Bulls Blood’ and var. ‘Albino’) and carrot cultivars (var. ‘Pusa Asita Black’ and var. ‘Lunar White’) were purchased from Baker Creek Heirloom Seeds (Mansfield, MO). Common produce names will be used, except for denoting cultivars. Beetroots will be referred to by their cultivar variety name. Carrots will be referred to by color whereby var. Scarlet Nantes will be referred to as “orange,” var. Lunar White will be referred to as “white” and var. Pusa Asita Black will be referred to as “purple.”
Seeds and seed potatoes were sowed directly in the pots of soil and tomato and pepper seedlings were transplanted in pots of soil at the UWM greenhouse. Plants were grown to maturity in a dedicated area outside of the UWM greenhouse to represent atmospheric stress normally experienced by produce grown in backyard gardens. Each pot was mulched with a commercial blend of shredded hardwood mulch to control dust. Plants were watered as necessary during the growing season and fertilized with Miracle-Gro® Water Soluble All Purpose Plant Food Topsoil (The Scotts Company LLC; Marysville, Ohio) at approximately 15 d and 45 d after seed germination per manufacturer recommendations as would be expected in backyard gardens.
2.4. Acquisition of Commercial Produce
The most common alternative to urban produce cultivation is to purchase produce from a commercial grocer; therefore, the concentration of Pb in purchased produce serves as the control for this study. Produce grown in this study was purchased from local grocery stores located in or within a mile of Census Tract 90 periodically during the study and processed and analyzed identical to sample tissues. Although data for all crops grown in this study are not available, Pb concentrations in raw produce reported in the United States Food and Drug Administration Total Diet Study (USFDA TDS) serves as an additional control for this study (USFDA, 2018).
2.5. Preparation of Produce Samples
At maturity, produce was harvested and processed according to tissue using methods common in a residential kitchen, as described by Attanayake et al. (2014, 2015). Leaves, stems, and fruits were cut from the plant with scissors, rinsed in fast running tap water, scrubbed by hand, chopped, and placed in labeled Ziploc baggies for freezing/storage. Belowground tissues of beetroots, carrots, radishes, turnips, and potatoes were pulled from the pots, scrubbed with a plastic scrub brush under fast running tap water, peeled, washed a second time to remove latent dust, chopped, and placed in in labeled Ziploc baggies for freezing/storage. Skins were chopped and placed in labeled Ziploc baggies for freezing/storage; however, due to the quantity of material needed for quantification with WD-XRF (3.2 g, dry weight), skins of the same crop were often composited based on soil source and year of cultivation for analysis.
2.6. Quantification of Heavy Metals in Produce with WD-XRF
Heavy metals in produce were quantified as described in Byers et al. (2019). In short, plant tissues were dried at 60° C for 48 h, milled in a tungsten carbide shatterbox for 30 s, and 3.20 g of powdered sample was pressed at 25-T for 60s in a 40 mm diameter hydraulic die press to create a pressed pellet 1.9 mm thick. The intensities of characteristic secondary X-rays were measured by WD-XRF (Pioneer S4 WD-XRF; Bruker AXS, Inc.; Fitchburg, Wisconsin, USA) and concentrations determined using custom measurement and calibration routines described in Byers et al. (2019). Concentrations of heavy metals in produce discussed in this study are expressed as dry-weight, except where explicitly noted. The limits of detection for Pb, Cr, and Ni in produce were 0.3, 0.6, and 0.4 μg g−1, respectively. Quality assurance for these data and validation of the XRF measurement routines included paired measurements with inductively coupled plasma mass spectrometry (ICP-MS) and energy dispersive XRF, as described in Byers et al. (2019).
2.7. Characterization of Soil Chemistry
The characterization of soil chemistry and fertility of soils used in this study included determining the bioavailable (plant-available) concentrations of Ca, Cd, Cr, Cu, Fe, K, Mg, Mn, Na, Ni, P, Pb, S, and Zn in soil using ICP-OES following digestion/extraction using the Mehlich-3 method (Mehlich, 1984); soil pH, and the cation exchange capacity (CEC; Sumner and Miller, 2018). Soil analytical work was completed by the University of Georgia Soil, Plant and Water Laboratory (Athens, GA).
A representative sample of each soil was analyzed using X-Ray Diffraction (XRD) to determine the minerals present in the soils. Samples were prepared and analyzed using procedures and equipment described by McHenry (2009). In summary, samples were dried, powdered in a tungsten-carbide mill, and analyzed using a Bruker D8 Focus X-Ray Diffractometer.
2.8. Statistical Analysis – Urban Soil Quality
Analysis of Variance models for soil CEC and soil bioavailable Pb, Cd, Cr, Mg, and Zn were developed in SAS (SAS Institute; Cary, NC) to identify significant differences between the mean values of each parameter between the soils used in this study. A post-hoc Tukey analysis was completed to determine which corresponding mean values are significantly different from each other.
2.9. Statistical Analysis – Consumable Produce
A general linear model (GLM) was developed in SAS (SAS Institute; Cary, NC) to predict the concentration of Pb in produce based on categorical (produce tissue and soil source) and continuous (soil bioavailable Pb, Cd, Cr, Mg, and Zn and soil CEC) predictors. A description of how each model predictor is expected to influence the accumulation of Pb in crop tissues is provided in Table S1. The GLM model was refined to eliminate predictors with potential multicollinearity and an additional evaluation confirmed that the remaining predictors did not mediate the influence of soil bioavailable Pb on the concentration of Pb in produce. The model indicates that the interaction between bioavailable Pb in soil and produce tissue is significant suggesting that the change in Pb accumulation in produce due to the change in soil bioavailable Pb is crop-specific. As such, to give meaning to the parameter estimate simple slopes in model outputs, the bioavailable Pb in soil was mean-centered. SAS GLM outputs and simple slopes of model predictors are presented on Table S1 and S2, respectively.
2.10. Human Health Risk Evaluation
In late September 2018, the USFDA established an IRL (μg Pb d−1) for the quantity of Pb considered safe for a child or an adult to consume daily in food (USFDA, 2019). However, the IRL is not based on concentration of Pb in produce; therefore, using the IRL as a surrogate for an oral reference dose, the maximum daily ingestion rate (IRfood) in grams of food per day on a dry-weight basis that could be consumed by children and adults so as not to exceed a Target Health Quotient (THQ) of 1 can be described by:
| Equation 1 |
The maximum daily ingestion rate (g d−1) for children and adults for each crop grown in this study in soil from Residence 1 was calculated based on a THQ = 1; the mean concentration of Pb (μg g−1 dry weight) in each consumable produce (Cfood); and the USFDA Pb IRL for children and adults (3 and 12.5 μg d−1, respectively). For ease of comparison, cultivars were lumped together based on the produce type.
In the context of daily Pb ingestion, Equation 1 only considers ingestion of food. The total daily Pb body burden (BPb) in children is the sum of Pb ingested from food, water, and soil+dust as follows:
| Equation 2 |
The total daily Pb body burden (μg Pb d−1) was calculated for 10 exposure scenarios likely to be encountered by children by varying the concentration of Pb in each of the three terms on the right side of Equation 2. The concentration of Pb in food (Cfood) was represented by the Pb concentrations in produce, and includes the mean Pb in commercial raw produce measured in the FDA TDS (USFDA, 2018), the mean Pb in produce grown in Commercial Topsoil, the mean Pb in produce grown in soil from Residence 1, the mean Pb in taproots of root crops grown in soil from Residence 1, the mean Pb in leaves of root crops grown in soil from Residence 1, and the mean Pb in non-root crops grown in soil from Residence 1 (Table S7 and Figure S4). The concentration of Pb in water (Cwater) was represented by the mean Pb in household tap water samples collected in the City of Milwaukee (Milwaukee Water Works, 2017), the USEPA Action Level for Pb in drinking water (USEPA, 2019a), or the upper 90th percentile Pb concentration in drinking water in Flint, Michigan (Pieper et al., 2018). The concentration of Pb in soil+dust (Csoil+dust) was represented by the mean Pb in Commercial Topsoil, mean Pb in soil from Residence 1, or the WDNR Residual Contaminant Level for Direct Contact at residential properties (WDNR, 2018), which is also equal to the USEPA regional screening level for direct contact at residential properties (USEPA, 2019b). The ingestion rate for food (IRfood) assumes a child eats the USFDA recommended 2 cups of produce (wet weight) per day. The mass is converted to dry weight for use in Equation 2 assuming 85% water. The ingestion rate for water (IRwater) and soil+dust (IRsoil+dust) is calculated per the USEPA Exposure Factors Handbook ( Moya et al. 2019).
3.0. RESULTS
3.1. Urban Soil Quality
Bioavailable Pb, Cd, Cr, Zn, and Mg in soil and the CEC in soil contribute significantly to the prediction of Pb in produce. The mean bioavailable Pb concentrations in soil from Residence 1, Residence 2, the Former Foundry, and in the Commercial Topsoil are 394 ± 125, 564 ± 169, 121 ± 74, and 6 ± 12 μg g−1, respectively, which are all significantly different from each other (p<0.001; Figure 1). The bioavailable concentration of Pb represented between 3% and 36% of the total Pb in metals-rich soil from the two residential properties and the Former Foundry. The mean CEC in the two residential soils are not significantly different from each other (Figure 1); however, the mean CEC in the Commercial Topsoil of 55 ± 5 meq 100g−1 is significantly greater than the Former Foundry and the two residential soils (p < 0.001). The mean bioavailable concentrations of Cd, Cr, and Zn in soil from the Former Foundry are each significantly greater compared to the other three soils, which is not surprising considering the soil source (Figure S1). The mean bioavailable concentration of Mg in the Commercial Topsoil is 2184 ± 229 μg g−1, which is significantly (p < 0.001) greater than the mean Mg concentrations in soil from the two residences and the Former Foundry.
Figure 1. Distribution of bioavailable Pb (μg g−1) and cation exchange capacity (meq 100g−1) in three urban soils (Residence 1, Residence 2, and Former Foundry) and in a Commercial Topsoil.

Note: The three horizontal lines of the box from the top to the bottom represent the 75th percentile, the median, and the 25th percentile. The whiskers represent the 10th and 90th percentile. Circles represent the 5th and 95th percentile. The mean is illustrated as a dashed black line. The mean values considered significantly different at an alpha value of 0.05 are denoted by a different symbol (*, †, ‡, or §) above the boxplot. The number of soil samples represented by the boxplots for Residence 1, Residence 2, the Former Foundry, and the Commercial Topsoil are 29, 9, 20, and 17, respectively.
The means of soil pH ranged from 7.73 to 7.43. Additional soil quality parameters are summarized on Table S3. No crystalline Pb-bearing phases were identified in XRD patterns, though this technique as applied in this study is only capable of identifying phases at the percent concentration or higher. The XRD patterns confirm the presence of quartz in soil from the Former Foundry and confirms the presence of quartz and/or dolomite in residential soils and the Commercial Topsoil (Figures S2a-S2d).
3.2. Concentrations of Pb in Produce-determination of Cfood
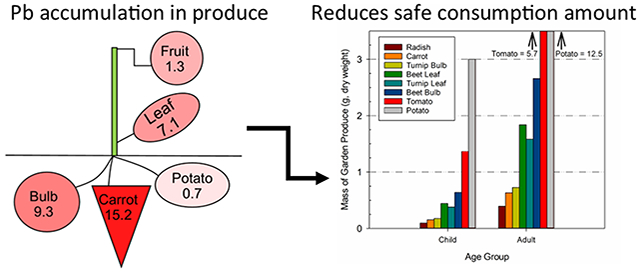
The mean concentration of Pb accumulated in aboveground tissues is less than the mean concentration of Pb in below ground taproot crops grown in metals-rich soils (Figure 2), with the largest Pb concentration noted in peeled carrots (15.2 ± 14.2 μg g−1). Although grown belowground, the smallest mean concentration of Pb in produce was noted in peeled potatoes (0.7 ± 1.1 μg g−1).
Figure 2. Mean Pb concentrations (μg g−1) in produce grown in three metals-rich soils.

Note: Concentrations summarized above are given on a dry-weight basis and concentrations represent the mean of crop tissues grown in soils from Residence 1, Residence 2, and the Former Foundry. “Fruit” is the average lead concentration of tomatoes and peppers (n=11); “leaf” is the average lead concentration in all produce leaves (n=144); “Bulb” is the average lead concentration of four beetroot cultivars, radishes, and turnips (n=76); and “carrot” is the average lead concentration of the three cultivars of carrots (n=56). The sample size for potatoes is 20. Increasing shading intensity in the figure reflects an increase in lead in prepared consumable tissues. The bioavailable Pb in the three soils (n=58) ranged from 32 μg g−1 to 786 μg g−1 with a mean of 326 ± 199 μg g−1.
Pb was detected in nearly every crop tissue grown in metals-rich soils collected from Residence 1, Residence 2, and the Former Foundry, with the overall greatest mean concentrations noted in produce grown in residential garden soils (Table 2). Conversely, Pb was rarely detected in crop tissues grown in Commercial Topsoil, and when detected, the concentration of Pb was just slightly greater than the WD-XRF limit of detection (0.3 μg g−1).
Table 2.
Concentration of lead (μg g−1) in prepared consumable garden produce grown in three urban soils and in Commercial Topsoil.
| Garden Produce | Mean ± SD (n) |
|||
|---|---|---|---|---|
| Residence 1 | Residence 2 | Former Foundry | Commercial Topsoil |
|
| Radish | 31.8 ± 23.9 (6) | 74.8* | 4.2 ± 2.9 (3) | 0.6* |
| Carrot | 19.8 ± 13.1 (29) | 19.1 ± 17.0 (12) | 3.2 ± 2.6 (15) | < 0.3 (13) |
| White | 26.7 ± 16.2 (5) | 28.0 ± 32.6 (3) | 6.4 ± 1.6 (4) | < 0.3 (3) |
| Purple | 20.1 ± 9.9 (8) | 6.2 ± 5.9 (2) | 1.2 ± 1.1 (2) | < 0.3 (3) |
| Orange | 17.6 ± 13.6 (16) | 19.0 ± 8.5 (7) | 2.2 ± 1.8 (9) | < 0.3 (7) |
| Turnip Bulb | 17.2 ± 9.8 (9) | 16.8 ± 21.5 (2) | 3.4 ± 1.8 (5) | < 0.3 (2) |
| Turnip Leaf | 7.9 ± 5.1 (13) | 4.2 ± 4.5 (2) | 2.2 ± 1.8 (6) | 0.7 ± 0.2 (3) |
| Beetroot Bulb | 4.7 ± 5.0 (22) | 8.3 ± 9.9 (13) | 0.8 ± 0.9 (15) | < 0.3 (11) |
| Bulls Blood | 5.5 ± 3.9 (4) | 16.4 ± 13.4 (4) | 0.8 ± 0.8 (3) | < 0.3* |
| Chioggia | 9.1 ± 7.3 (6) | NA | 1.0 ± 1.1 (4) | < 0.3 (2) |
| Detroit | 1.9 ± 1.6 (7) | 3.7 ± 2.3 (6) | 0.5 ± 0.5 (5) | < 0.3 (5) |
| Albino | 2.7 ± 1.2 (5) | 6.7 ± 10.2 (3) | 1.1 ± 1.4 (3) | < 0.3 (3) |
| Beetroot Leaf | 6.8 ± 5.5 (21) | 10.3 ± 11.4 (11) | 3.4 ± 3.2 (14) | 0.5 ± 0.2 (13) |
| Bulls Blood | 8.9 ± 2.2 (4) | 9.3 ± 10.8 (4) | 2.0 ± 0.9 (3) | 0.4 ± 0.2 (2) |
| Chioggia | 5.7 ± 7.2 (5) | NA | 2.3 ± 1.6 (5) | < 0.3 (2) |
| Detroit | 6.4 ± 7.1 (8) | 10.0 ± 13.4 (5) | 4.7 ± 5.1 (4) | 0.5 ± 0.3 (7) |
| Albino | 6.9 ± 2.7 (4) | 13.1 ± 14.3 (2) | 5.7 ± 4.3 (2) | 0.5 ± 0.2 (2) |
| Tomato | 2.2 ± 3.5 (8) | NA | 3.2* | < 0.3* |
| Pepper | < 0.3* | NA | 1.2* | 0.7* |
| Potato | 1.0 ± 1.3 (13) | < 0.3 (3) | 0.3 ± 0.1 (4) | 0.3 ± 0.1 (9) |
Note: NA; value not quantifiable as produce failed to grow to maturity in soil; SD, standard deviation.
The XRF limit of detection is 0.3 μg g−1 and mean values of “< 0.3” indicate lead concentrations were all less than the laboratory limit of detection. The n value represents the total number of samples analyzed and a star indicates the value represents the concentration in a single sample. Concentrations are given on a dry weight basis. For ease of labeling, common produce names are used, except for denoting cultivars in italics. Beetroots are referred to by their cultivar name (var. Bulls Blood; var. Chioggia; var. Detroit; var. Albino). Carrots are referred to by pigment color where “White” corresponds to var. Lunar White, “Orange” corresponds to var. Scarlet Nantes, and “Purple” corresponds to var. Pusa Asita Black.
Radishes accumulated the greatest amount of Pb in consumable tissues, especially in residential soils, followed by carrots, turnips, and beetroots (Table 2). Fruits accumulated the least amount of Pb, and although potatoes are found belowground, they accumulated significantly less Pb than other belowground tissues. Between the carrot cultivars, white carrots accumulated more Pb compared to pigment-rich orange and purple cultivars. The mean concentrations of Pb in beetroot bulbs did not vary greatly, though the concentrations of Pb tended to follow the opposite trend noted in carrots, with the greatest amount of Pb accumulating in pigment-rich beetroots (Table 2).
The mean concentration of Pb in carrot skins was less than the Pb concentration in the corresponding consumable root, and in addition, the accumulation of Pb in carrot skins is not cultivar-specific (Table S4). The mean Pb concentration in carrot leaves was greatest in the orange cultivar compared to the purple or white cultivar, with the greatest accumulation of Pb in carrot leaves grown in the two residential soils.
The concentrations of Pb in produce purchased from local grocery stores (n=19) were all less than the WD-XRF limit of detection (0.3 μg g−1), except for one turnip bulb purchased from one grocery store with a measured Pb concentration of 0.6 μg g−1. The average concentration of Pb in raw produce from the USFDA TDS is 5.5 ± 2.6 μg kg−1 (wet weight) (n=472; Figure S3), which is toequivalent to 37 μg kg−1 dry weight. This is less than the concentrations of Pb in similar vegetables purchased from markets and characterized by Hadayat et al. (2018).
Several groups of transporters are described in the literature for their role in transporting metals and maintaining metal-homeostasis in plant cells, including several metals transporters associated with Cd and Ni. As metabolically important trace nutrients, it is not surprising Cd and Ni accumulated in produce tissues. However, the mean concentrations of Cd and Ni in plant tissues were much less compared to Pb (Table S5 and S6).
3.3. Predicting the Accumulation of Pb in Produce
The continuous (soil bioavailable Pb, Cd, Cr, Mg, and Zn and soil CEC) and categorical (produce tissue and soil source) predictors in the GLM predicts a statistically significant (F=7.83, DF=25,180, p< 0.001) 52% of the variability of Pb in consumable plant tissues in produce grown in evaluated soils. After controlling for these eight predictors, adding the interaction between bioavailable Pb in soil and produce tissue increases the predictability of Pb in consumable tissues to 66% (F=7.65, DF=41,164, p< 0.001; Table S1). From this it is clear that the relationship between bioavailable Pb in soil and Pb accumulation in produce depends on produce tissue; therefore, the interaction parameter must be included in the model.
3.4. Evaluation of Risk Due to Consumption of Produce
The acceptable dry weight mass of produce grown in soil from Residence 1 that could be consumed by a child such that the USFDA IRL is not exceeded ranges from 0.1 g d−1 of radishes to 3.0 g d−1 of potatoes (Figure 3). Similarly, in adults, the maximum dry weight mass of produce grown in this study in soil from Residence 1 that could be consumed per day on a dry weight ranges from 0.4 g d−1 of radishes to 12.5 g d−1 of potatoes.
Figure 3. Mass of each prepared garden produce grown in soil from Residence 1 that could be consumed (g d−1) so as not to exceed the USFDA IRL.

Note: The mass of produce is calculated based on the mean concentrations of Pb in each crop grown in soil from Residence 1. The USFDA IRL (USFDA, 2019) is 3 μg d−1 for children and 12.5 μg d−1 for adults.
However, the total daily ingestion of Pb by a child depends on the concentrations of Pb ingested through a summation of water, food, and soil+dust (Equation 2). The total daily ingestion of Pb by children was further evaluated by modeling the total daily intake of Pb under 10 plausible scenarios. Model scenarios are explained in Table 3 and model factors further explained on Figures S3, S4, and S5 and Tables S7 and S8. Scenario 1 and 2 represent a child consuming commercial produce, drinking tap water in the City of Milwaukee, and living in an area with minimum Pb in soil (Scenario 1) or Pb-rich soil (Scenario 2). Scenario 3 and 4 represent cases where a child lives in an area with Pb-rich residential soil, drinks tap water in the City of Milwaukee, and eats produce grown in commercial topsoil (Scenario 3) or metals-rich residential soil (Scenario 4). Scenarios 5, 6, and 7 compare the differences in exposure to a child from Scenario 4 who is eating different produce types grown in Pb-rich residential soil. Scenarios 8, 9, and 10 represent cases where a child drinks water with varying Pb concentrations, eats produce grown in commercial topsoil, and lives in an area where the Pb concentration is not considered by USEPA or the state regulatory agency to pose a threat to human health. The total Pb intake for each scenario varied between 3 μg d−1 and 1,173 μg d−1 (Figure 4). In the control (Scenario 1), food contributed 60% and water contributed 40% to the daily Pb ingestion (Figure 5). Water consistently contributes the least amount of Pb ingested per day, contributing <1% or less to the daily Pb load, except in the control (Scenario 1) and in two scenarios with significantly compromised water quality (Scenario 9 and Scenario 10), and even then, water contributes <15% of the total Pb ingestion load (Figure 5).
Table 3.
Exposure scenarios used to evaluate the total daily Pb ingested by a child from three exposure vectors.
| Scenario | Vector |
||
|---|---|---|---|
| Food | Water | Soil+Dust | |
| Scenario 1 | Mean Pb in raw produce from | Mean Pb in Water in | Mean Pb in Comm. Topsoil |
| Scenario 2 | USFDA TDS | City of Milwaukee | Mean Pb in Soil at Res. 1 |
| Scenario 3 | Mean Pb in produce grown in commercial topsoil | Mean Pb in Water in | Mean Pb in Soil at |
| Scenario 4 | Mean Pb in produce grown in soil from Residence 1 | City of Milwaukee | Residence 1 |
| Scenario 5 | Mean Pb in root crops grown in soil from Residence 1 | Mean Pb in Water in City of Milwaukee | Mean Pb in Soil at Residence 1 |
| Scenario 6 | Mean Pb in root crop leaves grown in soil from Residence 1 | ||
| Scenario 7 | Mean Pb in non-root crops grown in soil from Residence 1 | ||
| Scenario 8 | Mean Pb in produce grown in commercial topsoil | Mean Pb in Water in City of Milwaukee | USEPA RCL |
| Scenario 9 | USEPA Action Level | ||
| Scenario 10 | Flint, Michigan | ||
Note: USFDA TDS, Mean Pb in 2003-2016 raw produce from Food and Drug Administration Total Diet Study (USFDA, 2018); USEPA Action Level for lead per (USEPA, 2019a); USEPA RCL, USEPA Regional Screening Level for direct contact at residential properties (USEPA, 2019b). Model factors are further described in Table S7.
Figure 4. Estimated total Pb ingested by a child (μg d−1) based on ten modeled exposure scenarios.

Note: Due to the difference in magnitude between scenarios, the y-axis is log-transformed. This model assumes that all Pb ingested by a child is from ingestion of water, food, and soil+dust. Model scenarios are explained on Table 3 and concentrations of Pb in each vector are described in Table S7.
Figure 5. Contributions of each vector to the daily ingestion of Pb by a child based on ten exposure scenarios.

Note: USEPA RSL, USEPA regional screening level for direct contact at residential properties (USEPA, 2019b). Scenarios are categorized based on the soil used to model total Pb ingestion. Model scenarios are explained on Tables 3 and S7.
4.0. DISCUSSION
4.1. Quantification of Pb in Prepared Produce
By controlling for matrix effects and controlling significant potential sources of bias in quantification of Pb with WD-XRF, this study validates XRF quantification routines described in Byers et al. (2019) and shows that this analytical tool can detect Pb in prepared produce samples as low as 0.3 μg g−1 and can quantify Pb in prepared samples as low as 1 μg g−1. As described in Byers et al. (2019), the quantification routine used in this study required the development of custom reference materials with commutability to produce; selecting secondary characteristic X-rays to eliminate peak overlaps and possible bias from spectrometer shielding/housing; and confirming the viability of the measurement routine
4.2. Urban Soil Quality
The concentrations of bioavailable Pb in the four soils are reflective of soil origins and anthropogenic inputs. Numerous studies have suggested a primary source of Pb in soil is weathering paint (e.g. Clark et al. 2006, 2008; Laidlaw et al. 2018). Pb paint primarily enters the soil system through weathering (e.g. chipping, peeling) or by mechanical disturbance. The Manufacture’s House Paint Reference Collection database (Hall and Tinklenberg, 2003) indicates Pb in historic house paint is primarily Pb-carbonate (~61% by weight) and pigments used in Pb paint are Pb-sulfate (PbO*PbSO4), leaded-zinc oxide (ZnO+Pb*PbSO4), and leaded titanite (PbTiO3). Phoenicochroite [Pb2O (CrO4)] was identified by Clark et al. (2006) in urban soils with abundant lead-bearing paint. As paint chips were visually apparent in soil from Residence 1 and Residence 2, similar to observations by Clark et al. (2006), the presence of phoenicochroite in soil from Residence 1 and Residence 2 might explain the strong bivariate relationship between bioavailable Pb and bioavailable Cr (r2=0.64).
The Pb source in soil from the Former Foundry is not visually apparent and the XRD diffraction pattern suggests the predominant mineralogy of the soil is quartz. The bioavailable concentrations of heavy metals associated with metalwork (Cd, Cr, Cu, Fe, Ni, and Zn) are all significantly greater (p < 0.001) in soil from the Former Foundry compared to the soil from the residential properties. These results indicate the soils collected from the Former Foundry were likely involved in industrial processes and support the XRD data suggesting the soil contains mostly foundry sand. The pH of the Former Foundry soil (7.43 ± 0.2; Table S3) does not suggest the Pb is associated with a spill of metals-rich acidic solution.
Additional sources of Pb in urban residential soils are associated with transportation (e.g. weathering tires and worn engine components and historic uses of Pb to enhance the octane of gasoline (Clark et al., 2006); leaching from weathered plastics; use of Pb-rich urban stormwater for irrigation purposes (Tom et al., 2014) or urban runoff; use of municipal compost as a soil amendment (Murray et al., 2011); historic use of Pb-bearing herbicides (Yokel and Delistraty, 2003); and anthropogenic fill) cannot be eliminated, but are considered minor compared to the presumed sources.
The CEC is a common soil fertility parameter used to describe the amount of exchangeable cation sites in soil. The mean CEC values are not significantly different between the two residential soils; however, the mean CEC of the Topsoil is significantly greater than the CEC of the residential soils and soil from the Former Foundry. Soils with a greater CEC have an increased capacity to retain and exchange cations in soil solution, and in the context of urban agriculture, CEC sites have the potential to retain Pb and prevent uptake into plant roots.
4.3. Accumulation and Distribution of Pb in Produce
The accumulation of Pb in produce varies widely in the literature and the most likely explanation for the large variability is the heterogenous and anisotropic nature of soil quality. The concentrations of Pb accumulated in produce in this study is within the ranges previously documented for target crops. The mean concentrations of Pb in carrots grown in this study range from less than 0.3 μg g−1 to 20 μg g−1, which is within ranges of Pb concentrations in carrots noted by others (Antoniadis et al., 2017; Attanayake et al., 2014; Ding et al., 2015; Finster et al., 2004; Jolly et al., 2013; Lima et al., 2009; Murray et al., 2011; Zwolak et al., 2019). Previous accumulation studies involving beetroot are limited; however, Chopra and Pathak (2015) noted the mean Pb concentration in beetroot grown in fields irrigated with wastewater was 50 μg g−1 and Lima et al. (2009) noted the mean concentration of Pb in beetroot grown in soil contaminated with battery residues was 108 μg g−1. Accumulation of Pb in radishes in the literature ranges from less than 1 μg g−1 upwards to 154 μg g−1 (Anjos et al., 2002; Jolly et al., 2013). Concentrations of Pb in non-root crops in this study (tomatoes and potatoes) are significantly less than concentrations found in root crops, which agrees with previous literature (Attanayake et al., 2014; Augustsson et al., 2015; Finster et al., 2004; Jolly et al., 2013; McBride et al., 2014; Rodriguez-Iruretagoiena et al., 2015; Zwolak et al., 2019).
The trend in accumulation of Pb in produce follows a recognizable pattern, with the greatest Pb accumulation in modified taproot tissues and decreasing Pb concentrations in tissues associated with aboveground biomass, similar to observation made by Finster et al. (2004). The general consensus in the literature is that Pb moves into and through the root cortex in the apoplast pathway by root pressure and bulk flow of water through transpiration from aboveground biomass (Bhargava et al., 2012; Bovenkamp et al., 2013). During transport in the apoplast pathway, Pb could either enter the symplast pathway through a membrane protein or could continue in the apoplast pathway towards the stele until the Casparian strip, at which point Pb must enter the symplast pathway. Scanning electron microscopy images have shown that the Casparian strip plays a significant role in restricting transport of Pb into the stele (Meyers et al., 2008; Pierart et al., 2018). By restricting Pb transport into the xylem, the Casparian strip effectively concentrates Pb in the root cortex, possibly as insoluble precipitates. Therefore, vegetables with modified taproots (e.g. radish, turnip, beetroot, carrot) accumulated more Pb compared to the corresponding aboveground tissues.
Although grown underground, a potato tuber forms on the tip of a stolon, which is morphologically a modified stem (Struik, 2007). Pb accumulating in a potato tuber likely passes into and through the plant root, cross the Casparian strip, enters the phloem, and then is transported through the vascular plant tissue to the tuber. Because of the multitude of defense mechanisms used by plants to prevent accumulation of Pb, the concentrations of the Pb in potato tubers are significantly less than concentrations in modified taproots. These data support prior work suggesting limited mobility of Pb in the phloem (Peralta-Videa et al., 2009; Sharma and Dubey, 2005). Fibrous roots can form on stolons and sometimes on tubers of potatoes (Struik 2007). These fibrous roots are thought to be critical in nutrient transport during the later stages of tuber growth; therefore, if these roots are in contact with metals-rich soil solution, accumulation of Pb in potatoes could occur later in tuber growth.
As suggested by others in the literature, tomatoes and peppers can accumulate Pb in the consumable fruits; however, the concentrations are much less compared to modified taproot vegetables (Table 2). Although the overall mean concentrations of Pb in fruiting crops were greater than the mean concentrations of Pb in potatoes, the relatively minor Pb accumulation in fruiting crops provides additional evidence of limited mobility of Pb in the phloem.
The difference in the accumulation of Pb across morphologically different tissues suggests selection of crop type is critical to minimizing Pb exposure in consuming urban-grown produce. However, little is known about the difference in Pb accumulation in different root crop cultivars. Toxicity in plants due to Pb uptake comes in the form of oxidative stress. Plants increase carotenoid and anthocyanin pigments to scavenge reactive oxygen species and mitigate stress in leaf tissues (Kumar et al., 2012). Betalains are nitrogen-based pigments uniquely present in the beetroot family and have been shown to be positively correlated with Pb accumulation in beetroots (Száková et al., 2010). Use of pigments to alleviate stress suggests that root crop cultivars rich in these compounds grown in metals rich soil could tolerate more Pb and therefore accumulate more Pb in tissues compared to corresponding white (albino) cultivars. However, across metals-rich soils, white carrots grown in this study accumulated more Pb in peeled root tissues compared to purple or orange cultivars. The apparent sequestration of Pb in the root of white carrots may explain why the concentrations of Pb in aboveground tissues of white carrots were smaller compared to purple or orange cultivars. The accumulation of Pb in beetroot cultivars did not follow a clear trend; however, the mean Pb concentration in the highly pigmented cultivar (var. Bulls Blood) was generally greater than the mean Pb in the white beetroot (var. Albino). The concentrations of Pb in beetroot leaves were similar between cultivars, with no discernable difference due to pigmentation.
4.4. Evaluation of Best Management Practices Through Evaluation of GLM Predictors Contributing to the Accumulation of Pb in Produce
The GLM model indicates the relationship between bioavailable soil Pb and Pb accumulation in produce is significantly stronger in some produce tissues than others. The fact that produce tissue moderates the influence of bioavailable soil Pb on the accumulation of Pb in crops is one explanation as to why previous researchers have struggled to predict the accumulation of Pb based on soil chemistry alone and why the standard deviations of Pb concentrations measured in this study are relatively large (Table 2). In GLM models with categorical interactions like the ones in this study, the continuous dependent variable (bioavailable soil Pb) is often mean-centered. For this model, the bioavailable soil Pb was mean-centered using the mean concentration of 260.4 ug g-1. Mean-centering sets the bioavailable soil Pb mean equal to zero., thus predictor estimates (simple slopes) and estimates of the interaction between soil bioavailable Pb and Pb in produce can be interpreted. The soil from Residence 1 was selected as the reference soil in the GLM because this soil represents typical soil quality in gardens at residential properties and therefore allows an evaluation of the change in Pb accumulation if different soils are used for growing food. Potato was selected as the reference produce because potatoes had the lowest mean Pb in consumable tissues. The GLM predicts the concentration of Pb in potatoes grown in soil from Residence 1 at the mean bioavailable soil Pb of 260.4 μg g−1 will be 1.0 μg g−1, which is not statistically different than zero (t=0.16, p = 0.88, Table S2). Furthermore, the model indicates that if the bioavailable concentration of Pb in soil increased by 100 μg g−1, the accumulation of Pb in potatoes in the reference soil is expected to only increase by a statistically insignificant 1 μg g−1 (t=0.94, p=0.35). Because Pb accumulation in potatoes in effect does not change with increasing bioavailable Pb, potatoes were used as a reference to evaluate the change in accumulated Pb when other crops are grown in similar soils.
Comparison of GLM estimates for varying produce types allows for an evaluation of the predicted change in Pb accumulation in alternative produce tissues compared to potatoes, if an alternative crop is grown in soil from Residence 1 with a bioavailable Pb soil concentration of 260.4 ug g−1 (Table S2). The predicted increase in Pb accumulation is the greatest in taproot crops, with comparatively lower increases of Pb in fruit crops. For example, the model predicts the Pb concentration in a tomato grown in the reference soil to be only 1.4 ug g−1 greater, which is not a statistically significant increase (p = 0.71). Alternatively, if a purple or a white carrot was grown in the reference soils, the model predicts the concentrations of Pb in these carrots to be 11.3 and 15.6 ug g−1 greater than potatoes, both of which are statistically significant increases (p < 0.05). The interpretation of the model provides further evidence that crop selection is critical in reducing Pb exposure in urban agriculture and supports previous recommendations that selecting non-root crops for cultivation in metals-rich urban soils is an important best management practice (Entwistle et al., 2019).
The significant interaction between bioavailable soil Pb and produce tissue means that an increase in the mean soil Pb will not increase Pb in crop tissues equally. Therefore, crop selection is even more important in soils with higher bioavailable Pb. Interaction parameter estimates allow for a prediction of the influence of increasing the bioavailable Pb in soil from Residence 1 by 100 μg g−1 on Pb accumulation in each crop, compared to potatoes (Table 4). For example, the model predicts that if the bioavailable soil Pb increases by 100 μg g−1, the Pb concentration in white carrots is expected to increase a statistically significant (t=4.72, P < 0.0001) 6.9 μg g−1 (to 7.9 μg g−1) . Similar relationships hold true across taproot crops including carrot cultivars, most beetroot cultivars, radishes, and turnips indicating that as the bioavailable soil Pb increases, more Pb will accumulate in taproot crops compared to potatoes. As such, growing taproot crops in increasingly metals-rich soils significantly increases the risk for Pb exposure through consumption of root crops.
Table 4.
Predicted increase in mean Pb concentrations in produce compared to potatoes grown in soil from Residence 1 when the mean concentration of bioavailable Pb in soil increases by 100 ug g−1.
| Produce | Predicted Change in Mean Pb (ug g−1) |
p > ∣t∣ |
|---|---|---|
| Radish | 6.9 ± 1.5 | <0.0001 |
| Carrot | ||
| White | 6.8 ± 1.4 | <0.0001 |
| Purple | 4.3 ± 1.8 | 0.0204 |
| Orange | 3.1 ± 1.1 | 0.0044 |
| Turnip Bulb | 6.0 ± 1.5 | <0.0001 |
| Turnip Leaf | 2.2 ± 1.4 | 0.1232 |
| Beetroot Bulb | ||
| Bulls Blood | 3.3 ± 1.2 | 0.0092 |
| Chioggia | 2.9 ± 1.4 | 0.0421 |
| Beetroot Leaf | ||
| Bulls Blood | 1.7 ± 1.2 | 0.1772 |
| Potato | 0.9 ± 1.0 | 0.349 |
Note. As noted on Table S2 and reflected in the table above, the predicted increase in the mean Pb concentration in potatoes grown in soil from Residence 1 is 0.9 ± 1.0 ug g−1 when the mean concentration of bioavailable Pb in soil increases by 100 ug g−1. Predicted changes in mean Pb concentrations in other produce tissues given in the table are relative to the change in the mean Pb concentration in potatoes. T-values for each simple slope are given on Table S2 and p-values summarized above are based on 164 degrees of freedom. The simple slopes of additional beetroot cultivar bulbs and leaves; the simple slope of tomato; and the simple slope of pepper are not significantly different from potatoes (p > 0.25; Table S2) and are omitted from this table.
As noted previously, the model predicts potatoes will not accumulate a significant amount of Pb when grown in soil from Residence 1 with a bioavailable soil Pb concentration of 260.4 ug g−1. Therefore, using potatoes as the reference vegetable in the model somewhat limits the interpretation of changes in soil chemistry on Pb accumulation. Though as expected, the model suggests that increasing the CEC in soil will significantly decrease the accumulation of Pb in potatoes grown in soil from Residence 1 (p < 0.05; Table S2). Rather surprisingly however, the model suggests a significant positive relationship exists between the concentration of bioavailable Mg in soil and the concentration of Pb in potatoes grown in soil at Residence 1 (p < 0.05). This apparent positive relationship cannot be immediately explained and may not hold true across all produce types. The simple slopes of the other soil chemistry parameters used in the model, were not statistically different from zero suggesting increasing or decreasing the concentration of bioavailable Cd, Cr, or Zn in soil will have no significant effect on the concentration of Pb in potatoes grown in soil from Residence 1 with a bioavailable soil Pb concentration of 260.4 ug g−1.
4.5. Evaluation of Risk Due to Consumption of Produce
Consuming even a small amount of produce grown in soil from Residence 1 could put a child or an adult at risk for Pb exposure. Using Equation 1, a child can consume no more than 0.2 g d−1 (dw) of carrots grown in soil from Residence 1. At 85% water content, this equates to 1.3 g (wet weight; ww) of carrots, or approximately one thin 2-5 mm slice of a small-size carrot (Figure 3). Conversely, a child could consume no more than 1.3 g d−1 (dw) of tomato grown in soil from Residence 1, which at 85% water content, this equates to 8.6 g (ww) of tomato, or roughly one thin slice from a medium tomato. General guidelines recommend children eat 2 cups of vegetables per day, which if that intake is represented by tomatoes grown in soil from Residence 1 (approximately 400g ww of tomato), the Pb dose would far exceed the USFDA IRL. Although the USFDA IRL includes a safety factor of 10, this evaluation shows that although the concentration of Pb in tomatoes is comparatively minor, even consuming a small quantity of tomatoes grown in metals-rich soil could pose an exposure risk to children. The IRL of an adult is 4.3 times the value for children indicating an adult could safely eat a slightly thicker slice of carrot or tomato grown in soil from Residence 1 and not exceed the daily IRL for Pb (Figure 3).
Scenarios modeling the daily intake of Pb in a child from ingestion of water, food, and soil+dust vary significantly based on the concentrations of Pb in each vector (Figure 4). Although much attention has been placed on controlling drinking water quality, food quality has the potential for contributing an equal or greater proportion to the daily ingestion of Pb in children (Figure 5). Without changing food or water quality, simply replacing all metals-rich topsoil in the yard with soil of significantly better quality is a best management practice to quickly reduce overall Pb exposure. This is quantified by the decrease in ingestion of Pb between Scenario 2 and Scenario 1 of 476 μg d−1.
Homeowners who are unable to replace all the metals-rich topsoil at their property, but who also want to grow produce, are encouraged to grow crops in raised beds of replacement topsoil of significantly better quality. Without changing water quality or soil quality in the yard, growing produce in raised beds of commercial topsoil is estimated to decrease the ingestion of Pb by 462 μg d−1 (which is the difference between Scenario 3 and Scenario 4).
Produce selection is critical in lowering the risk of Pb exposure when growing produce in metals-rich soil If water quality is the average water quality in Milwaukee and soil quality is represented by the average soil at Residence 1, a child eating 2 cups of root crops grown in soil from Residence 1 would ingest 1173 μg d−1 (Scenario 5). Simply by eating the leaves of the root crops (Scenario 6) instead of the taproot (Scenario 5) grown in soil from Residence 1, the Pb ingestion rate of a child would decrease to 801 μg d−1 The Pb ingestion rate would decrease to 541 μg d−1 if a child eats a non-root crop (Scenario 7) compared to the taproot of a root crop (Scenario 5) grown in soil from Residence 1.
Scenario 8, Scenario 9, and Scenario 10 estimate the daily ingestion of Pb based solely on changes in drinking water quality if soil quality meets state and federal quality guidelines and produce is grown in replacement topsoil. Water quality in Scenario 8 is represented by the mean water quality in Milwaukee, Wisconsin, which meets the USEPA Action level for Pb. Water quality in Scenario 9 and Scenario 10 is represented by the USEPA Action level for lead and the 90th percentile for Pb in water from Flint, Michigan, respectively. The difference in Pb ingestion between Scenarios 9 and 10 and Scenario 8 is between 3 and 7 μg d−1. This decrease is dwarfed compared to the decrease in daily Pb ingestion rate by replacing metals rich topsoil with soil of better quality or by growing crops in raised beds.
5.0. CONCLUSION
This study used newly-developed XRF routines to directly measure Pb in produce grown in metals-rich urban soils. Because of the non-destructive nature of XRF and the low limits of detection obtained in this study, XRF shows great potential for use in regulatory food quality/security studies not only for Pb but also for other metals of concern. The statistical model developed in this study predicts 66% of the variability in Pb accumulation in produce. In addition, the influence of bioavailable soil Pb on the accumulation of Pb in produce is a strong function of crop type with taproots accumulating much more Pb than either leaf or fruit crops. Crop selection is even more important in soils with increasing bioavailable Pb concentrations, and as such, provides further evidence that consuming taproot crops grown in Pb-rich soils should be avoided. Consumption of produce could pose a potential health risk to children and adults, especially in the context of overall Pb body burden. This study highlights the relatively high proportion of Pb potentially ingested by children from consuming food grown in urban residential and non-residential soils. In all simulated scenarios for children living in Pb-rich environments, the contribution of daily Pb load from consuming food is less than the exposure from Pb-rich soil/dust, but far outweighs the contribution of daily Pb load from drinking tap water. Therefore, after addressing over-riding soil/dust impacts for an average child living in a Pb-rich environment, addressing food quality is critical in minimizing Pb exposure.
Supplementary Material
HIGHLIGHTS.
Consumption of produce from metals-rich soil poses a Pb exposure risk to children.
Daily ingestion of Pb from food can outweigh the Pb contribution from drinking water.
Addressing food quality is vital to maximizing positive health outcomes in children.
A non-destructive XRF routine was validated for rapid assessment of Pb in food.
6.0. ACKNOWLEDGEMENTS
The authors would like to thank Mr. Paul Engevold, the manager of the University of Wisconsin Milwaukee Department of Biological Science Greenhouse, for his assistance in growing fruits and vegetables in this study.
7.0 FUNDING
This work was supported in part by the Children’s Health Environmental Core Center at the University of Wisconsin Milwaukee, which was funded through the National Institute of Environmental Health Sciences [grant number P30ES004184].
Footnotes
Publisher's Disclaimer: This is a PDF file of an unedited manuscript that has been accepted for publication. As a service to our customers we are providing this early version of the manuscript. The manuscript will undergo copyediting, typesetting, and review of the resulting proof before it is published in its final form. Please note that during the production process errors may be discovered which could affect the content, and all legal disclaimers that apply to the journal pertain.
Declaration of competing interests
The authors declare that they have no known competing financial interests or personal relationships that could have appeared to influence the work reported in this paper.
8.0 REFERENCES
- Amato MS, Magzamen S, Imm P, Havlena JA, Anderson HA, Kanarek MS, Moore CF, 2013. Early lead exposure (<3 years old) prospectively predicts fourth grade school suspension in Milwaukee, Wisconsin (USA). Environ. Res 126, 60–65. 10.1016/j.envres.2013.07.008 [DOI] [PubMed] [Google Scholar]
- Anjos MJ, Lopes RT, Jesus EFO, Simabuco SM, Cesareo R, 2002. Quantitative determination of metals in radish using x-ray fluorescence spectrometry. X-Ray Spectrom. 31, 120–123. 10.1002/xrs.567 [DOI] [Google Scholar]
- Antoniadis V, Shaheen SM, Boersch J, Frohne T, Du Laing G, Rinklebe J, 2017. Bioavailability and risk assessment of potentially toxic elements in garden edible vegetables and soils around a highly contaminated former mining area in Germany. J. Environ. Manage 186, 192–200. 10.1016/j.jenvman.2016.04.036 [DOI] [PubMed] [Google Scholar]
- Attanayake CP, Hettiarachchi GM, Harms A, Presley DA, Martin S, Pierzynski GM, 2014. Field evaluations on soil plant transfer of lead from an urban garden soil. J. Environ. Qual 43, 475–487. 10.2134/jeq2013.07.0273 [DOI] [PubMed] [Google Scholar]
- Attanayake CP, Hettiarachchi GM, Martin S, Pierzynski GM, 2015. Potential bioavailability of lead, arsenic, and polycyclic aromatic hydrocarbons in compost-amended urban soils. J. Environ. Qual 44, 930–944. 10.2134/jeq2014.09.0400 [DOI] [PubMed] [Google Scholar]
- Augustsson ALM, Uddh-Söderberg TE, Hogmalm KJ, Filipsson MEM, 2015. Metal uptake by homegrown vegetables - The relative importance in human health risk assessments at contaminated sites. Environ. Res 138, 181–190. 10.1016/j.envres.2015.01.020 [DOI] [PubMed] [Google Scholar]
- Bhargava A, Carmona FF, Bhargava M, Srivastava S, 2012. Approaches for enhanced phytoextraction of heavy metals. J. Environ. Manage. 10.1016/j.jenvman.2012.04.002 [DOI] [PubMed] [Google Scholar]
- Bovenkamp GL, Prange A, Schumacher W, Ham K, Smith AP, Hormes J, 2013. Lead uptake in diverse plant families: A study applying X-ray absorption near edge spectroscopy. Environ. Sci. Technol 47, 4375–4382. 10.1021/es302408m [DOI] [PubMed] [Google Scholar]
- Brinkmann R, 1994. Lead pollution in soils in milwaukee county, Wisconsin. J. Environ. Sci. Heal. Part A Environ. Sci. Eng. Toxicol 29, 909–919. 10.1080/10934529409376083 [DOI] [Google Scholar]
- Brown SL, Chaney RL, Hettiarachchi GM, 2016. Lead in urban soils: A real or perceived concern for urban agriculture? J. Environ. Qual 45, 26–36. 10.2134/jeq2015.07.0376 [DOI] [PubMed] [Google Scholar]
- Byers HL, McHenry LJ, Grundl TJ, 2019. XRF techniques to quantify heavy metals in vegetables at low detection limits. Food Chem. X 1, 100001. 10.1016/J.FOCHX.2018.100001 [DOI] [Google Scholar]
- Byers HL, McHenry LJ, Grundl TJ, 2016. Forty-Nine Major and Trace Element Concentrations Measured in Soil Reference Materials NIST SRM 2586, 2587, 2709a, 2710a and 2711a Using ICP-MS and Wavelength Dispersive-XRF. Geostand. Geoanalytical Res 40, 433–445. 10.1111/j.1751-908X.2016.00376.X [DOI] [PMC free article] [PubMed] [Google Scholar]
- CDC, 2019. National Environmental Public Health Tracking Network [WWW Document]. URL https://ephtracking.cdc.gov/DataExplorer/index.html?c=6&i=-1&m=-1#/ (accessed 10.10.19).
- Chopra AK, Pathak C, 2015. Accumulation of heavy metals in the vegetables grown in wastewater irrigated areas of Dehradun, India with reference to human health risk. Environ. Monit. Assess 187 10.1007/s10661-015-4648-6 [DOI] [PubMed] [Google Scholar]
- City of Milwaukee, 2017. Childhood Lead Poisoning Dashboard [WWW Document]. City Milwaukee Child. Lead Poisoning Data Reports. URL https://city.milwaukee.gov/health/Lead-Poisoning-Prevention-Data/Childhood-Lead-Poisoning-Dashboard.htm (accessed 10.7.19).
- Clark HF, Brabander DJ, Erdil RM, 2006. Sources, sinks, and exposure pathways of lead in urban garden soil. J. Environ. Qual 35, 2066–2074. 10.2134/jeq2005.0464 [DOI] [PubMed] [Google Scholar]
- Clark HF, Hausladen DM, Brabander DJ, 2008. Urban gardens: Lead exposure, recontamination mechanisms, and implications for remediation design. Environ. Res 107, 312–319. 10.1016/j.envres.2008.03.003 [DOI] [PubMed] [Google Scholar]
- Defoe PP, Hettiarachchi GM, Benedict C, Martin S, 2014. Safety of gardening on lead- and arsenic-contaminated urban brownfields. J. Environ. Qual 43, 2064–2078. 10.2134/jeq2014.03.0099 [DOI] [PubMed] [Google Scholar]
- Dignam T, Kaufmann RB, Lestourgeon L, Brown MJ, 2019. Control of Lead Sources in the United States, 1970–2017: Public Health Progress and Current Challenges to Eliminating Lead Exposure. J. Public Heal. Manag. Pract 25, S13–S22. 10.1097/PHH.0000000000000889 [DOI] [PMC free article] [PubMed] [Google Scholar]
- Ding C, Li X, Zhang T, Wang X, 2015. Transfer model of lead in soil-carrot (Daucus carota L.) system and food safety thresholds in soil. Environ. Toxicol. Chem 34, 2078–2086. 10.1002/etc.3031 [DOI] [PubMed] [Google Scholar]
- Entwistle JA, Amaibi PM, Dean JR, Deary ME, Medock D, Morton J, Rodushkin I, Bramwell L, 2019. An apple a day? Assessing gardeners’ lead exposure in urban agriculture sites to improve the derivation of soil assessment criteria. Environ. Int 122, 130–141. 10.1016/j.envint.2018.10.054 [DOI] [PubMed] [Google Scholar]
- Ferri R, Hashim D, Smith DR, Guazzetti S, Donna F, Ferretti E, Curatolo M, Moneta C, Beone GM, Lucchini RG, 2015. Metal contamination of home garden soils and cultivated vegetables in the province of Brescia, Italy: Implications for human exposure. Sci. Total Environ 518–519, 507–517. 10.1016/j.scitotenv.2015.02.072 [DOI] [PMC free article] [PubMed] [Google Scholar]
- Finster ME, Gray KA, Binns HJ, 2004. Lead levels of edibles grown in contaminated residential soils: A field survey. Sci. Total Environ 320, 245–257. 10.1016/j.scitotenv.2003.08.009 [DOI] [PubMed] [Google Scholar]
- Ghose R, Pettygrove M, 2014. Urban Community Gardens as Spaces of Citizenship. Antipode 46, 1092–1112. 10.1111/anti.12077 [DOI] [Google Scholar]
- Hadayat N, De Oliveira LM, Da Silva E, Han L, Hussain M, Liu X, Ma LQ, 2018. Assessment of trace metals in five most-consumed vegetables in the US: Conventional vs. organic. Environ. Pollut 243, 292–300. 10.1016/j.envpol.2018.08.065 [DOI] [PubMed] [Google Scholar]
- Hall GS, Tinklenberg J, 2003. Determination of Ti, Zn, and Pb in lead-based house paints by EDXRF. J. Anal. At. Spectrom 18, 775–778. 10.1039/b300597f [DOI] [Google Scholar]
- Hore P, Alex-Oni K, Sedlar S, Nagin D, 2019. A Spoonful of Lead: A 10-Year Look at Spices as a Potential Source of Lead Exposure. J. Public Heal. Manag. Pract 25, S63–S70. 10.1097/PHH.0000000000000876 [DOI] [PubMed] [Google Scholar]
- Huang ZY, Chen T, Yu J, Qin DP, Chen L, 2012. Lead contamination and its potential sources in vegetables and soils of Fujian, China. Environ. Geochem. Health 34, 55–65. 10.1007/s10653-011-9390-6 [DOI] [PubMed] [Google Scholar]
- Jolly YN, Islam A, Akbar S, 2013. Transfer of metals from soil to vegetables and possible health risk assessment. Springerplus 2, 1–8. 10.1186/2193-1801-2-385 [DOI] [PMC free article] [PubMed] [Google Scholar]
- Keller B, Faciano A, Tsega A, Ehrlich J, 2017. Epidemiologic Characteristics of Children with Blood Lead Levels ≥45 μg/dL. J. Pediatr 180, 229–234. 10.1016/j.jpeds.2016.09.017 [DOI] [PubMed] [Google Scholar]
- Kumar A, Prasad MNV, Sytar O, 2012. Lead toxicity, defense strategies and associated indicative biomarkers in Talinum triangulare grown hydroponically. Chemosphere 89, 1056–1065. 10.1016/j.chemosphere.2012.05.070 [DOI] [PubMed] [Google Scholar]
- Laidlaw MAS, Alankarage DH, Reichman SM, Taylor MP, Ball AS, 2018. Assessment of soil metal concentrations in residential and community vegetable gardens in Melbourne, Australia. Chemosphere 199, 303–311. 10.1016/j.chemosphere.2018.02.044 [DOI] [PubMed] [Google Scholar]
- Laidlaw MAS, Filippelli GM, Sadler RC, Gonzales CR, Ball AS, Mielke HW, 2016. Children’s blood lead seasonality in flint, Michigan (USA), and soil-sourced lead hazard risks. Int. J. Environ. Res. Public Health 13, 358 10.3390/ijerph13040358 [DOI] [PMC free article] [PubMed] [Google Scholar]
- Lane SD, Webster NJ, Levandowski BA, Rubinstein RA, Keefe RH, Wojtowycz MA, Cibula DA, Kingson J, Aubry RH, 2008. Environmental Injustice: Childhood Lead Poisoning, Teen Pregnancy, and Tobacco. J. Adolesc. Heal 42, 43–49. 10.1016/j.jadohealth.2007.06.017 [DOI] [PubMed] [Google Scholar]
- Lima F, Nascimento C, Silva F, Carvalho V, Filho M, 2009. Lead concentration and allocation in vegetables grown in a soil contaminated by battery residues. Hortic. Bras 27, 362–365. [Google Scholar]
- Magzamen S, Amato MS, Imm P, Havlena JA, Coons MJ, Anderson HA, Kanarek MS, Moore CF, 2015. Quantile regression in environmental health: Early life lead exposure and end-of-grade exams. Environ. Res 137, 108–119. 10.1016/j.envres.2014.12.004 [DOI] [PubMed] [Google Scholar]
- Marguí E, Queralt I, Hidalgo M, 2009. Application of X-ray fluorescence spectrometry to determination and quantitation of metals in vegetal material. TrAC - Trends Anal. Chem 28, 362–372. 10.1016/j.trac.2008.11.011 [DOI] [Google Scholar]
- McBride MB, Shayler HA, Spliethoff HM, Mitchell RG, Marquez-Bravo LG, Ferenz GS, Russell-Anelli JM, Casey L, Bachman S, 2014. Concentrations of lead, cadmium and barium in urban garden-grown vegetables: The impact of soil variables. Environ. Pollut 194, 254–261. 10.1016/j.envpol.2014.07.036 [DOI] [PMC free article] [PubMed] [Google Scholar]
- McHenry LJ, 2009. Element mobility during zeolitic and argillic alteration of volcanic ash in a closed-basin lacustrine environment: Case study Olduvai Gorge, Tanzania. Chem. Geol 265, 540–552. 10.1016/j.chemgeo.2009.05.019 [DOI] [Google Scholar]
- Mehlich A, 1984. Mehlich 3 soil test extractant: A modification of Mehlich 2 extractant. Commun. Soil Sci. Plant Anal 15, 1409–1416. 10.1080/00103628409367568 [DOI] [Google Scholar]
- Meyers DER, Auchterlonie GJ, Webb RI, Wood B, 2008. Uptake and localisation of lead in the root system of Brassica juncea. Environ. Pollut 153, 323–332. 10.1016/j.envpol.2007.08.029 [DOI] [PubMed] [Google Scholar]
- Milwaukee Water works, 2017. Water Quality [WWW Document]. URL https://city.milwaukee.gov/water/WaterQuality (accessed 10.19.19).
- Mombo S, Foucault Y, Deola F, Gaillard I, Goix S, Shahid M, Schreck E, Pierart A, Dumat C, 2016. Management of human health risk in the context of kitchen gardens polluted by lead and cadmium near a lead recycling company. J. Soils Sediments 16, 1214–1224. 10.1007/s11368-015-1069-7 [DOI] [Google Scholar]
- Moya J, Phillips L, Schuda L, 2019. Exposure Factors Handbook. USEPA Office of Research and Development, Washington, DC. [Google Scholar]
- Murray H, Pinchin T, Macfie S, 2011. Compost application affects metal uptake in plants grown in urban garden soils and potential human health risk. J. Soils Sediments 11, 815–829. 10.1007/s11368-011-0359-y [DOI] [Google Scholar]
- Nabulo G, Black CR, Young SD, 2011. Trace metal uptake by tropical vegetables grown on soil amended with urban sewage sludge. Environ. Pollut 159, 368–376. 10.1016/j.envpol.2010.11.007 [DOI] [PubMed] [Google Scholar]
- Obrycki JF, Basta NT, Culman SW, 2017. Management options for contaminated urban soils to reduce public exposure and maintain soil health. J. Environ. Qual 46, 420–430. 10.2134/jeq2016.07.0275 [DOI] [PubMed] [Google Scholar]
- Palmer PT, Jacobs R, Baker PE, Ferguson K, Webber S, 2009. Use of field-portable XRF analyzers for rapid screening of toxic elements in fda-regulated products. J. Agric. Food Chem 57, 2605–2613. 10.1021/jf803285h [DOI] [PubMed] [Google Scholar]
- Peralta-Videa JR, Fopez MF, Narayan M, Saupe G, Gardea-Torresdey J, 2009. The biochemistry of environmental heavy metal uptake by plants: Implications for the food chain. Int. J. Biochem. Cell Biol 10.1016/j.biocel.2009.03.005 [DOI] [PubMed] [Google Scholar]
- Perroy RL, Belby CS, Mertens CJ, 2014. Mapping and modeling three dimensional lead contamination in the wetland sediments of a former trap-shooting range. Sci. Total Environ 487, 72–81. 10.1016/j.scitotenv.2014.03.102 [DOI] [PubMed] [Google Scholar]
- Pettygrove M, Ghose R, 2018. From “Rust Belt” to “Fresh Coast”: Remaking the City through Food Justice and Urban Agriculture. Ann. Am. Assoc. Geogr 108, 591–603. 10.1080/24694452.2017.1402672 [DOI] [Google Scholar]
- Pieper KJ, Martin R, Tang M, Walters L, Parks J, Roy S, Devine C, Edwards MA, 2018. Evaluating Water Lead Levels during the Flint Water Crisis. Environ. Sci. Technol 52, 8124–8132. 10.1021/acs.est.8b00791 [DOI] [PubMed] [Google Scholar]
- Pierart A, Dumat C, Maes AQM, Roux C, Sejalon-Delmas N, 2018. Opportunities and risks of biofertilization for leek production in urban areas: Influence on both fungal diversity and human bioaccessibility of inorganic pollutants. Sci. Total Environ 624, 1140–1151. 10.1016/j.scitotenv.2017.12.100 [DOI] [PubMed] [Google Scholar]
- Pizarro I, Gómez-Gómez M, León J, Román D, Palacios MA, 2016. Bioaccessibility and arsenic speciation in carrots, beets and quinoa from a contaminated area of Chile. Sci. Total Environ 565, 557–563. 10.1016/j.scitotenv.2016.04.199 [DOI] [PubMed] [Google Scholar]
- Rai PK, Lee SS, Zhang M, Tsang YF, Kim KH, 2019. Heavy metals in food crops: Health risks, fate, mechanisms, and management. Environ. Int 365–385. 10.1016/j.envint.2019.01.067 [DOI] [PubMed] [Google Scholar]
- Ratul AK, Hassan M, Uddin MK, Sultana MS, Akbor MA, Ahsan MA, 2018. Potential health risk of heavy metals accumulation in vegetables irrigated with polluted river water. Int. Food Res. J 25, 329–338. [Google Scholar]
- Reboredo F, Simões M, Jorge C, Mancuso M, Martinez J, Guerra M, Ramalho JC, Pessoa MF, Lidon F, 2019. Metal content in edible crops and agricultural soils due to intensive use of fertilizers and pesticides in Terras da Costa de Caparica (Portugal). Environ. Sci. Pollut. Res 26, 2512–2522. 10.1007/s11356-018-3625-3 [DOI] [PubMed] [Google Scholar]
- Rodriguez-Iruretagoiena A, Trebolazabala J, Martinez-Arkarazo I, Diego A, Madariaga JM, 2015. Metals and metalloids in fruits of tomatoes (Solanum lycopersicum) and their cultivation soils in the Basque Country: Concentrations and accumulation trends. Food Chem. 173, 1083–1089. 10.1016/j.foodchem.2014.10.133 [DOI] [PubMed] [Google Scholar]
- Sampson RJ, Winter AS, 2018. POISONED DEVELOPMENT: ASSESSING CHILDHOOD LEAD EXPOSURE AS A CAUSE OF CRIME IN A BIRTH COHORT FOLLOWED THROUGH ADOLESCENCE. Criminology 56, 269–301. 10.1111/1745-9125.12171 [DOI] [Google Scholar]
- Schnur J, John RM, 2014. Childhood lead poisoning and the new centers for disease control and prevention guidelines for lead exposure. J. Am. Assoc. Nurse Pract 10.1002/2327-6924.12112 [DOI] [PubMed] [Google Scholar]
- Sekara A, Poniedzialek M, Ciura J, Jedrszczyk E, 2005. Cadmium and lead accumulation and distribution in the tissues of nine crops: Implications for phytoremediation. Polish J. Environ. Stud 14, 509–516. [Google Scholar]
- Sharma K, Basta NT, Grewal PS, 2015. Soil heavy metal contamination in residential neighborhoods in post-industrial cities and its potential human exposure risk. Urban Ecosyst. 18, 115–132. 10.1007/s11252-014-0395-7 [DOI] [Google Scholar]
- Sharma P, Dubey RS, 2005. Lead Toxicity in Plants. Brazilian J. Plant Physiol 14, 35–52. [Google Scholar]
- Singh VK, Rai PK, Pathak AK, Tripathi DK, Singh SC, Singh JP, 2017. Application of wavelength dispersive X ray fluorescence spectrometry to biological samples. Spectrosc. (Santa Monica) 32, 41–47. [Google Scholar]
- Struik PC, 2007. Above-ground and below-ground plant development, in: Potato Biology and Biotechnology: Advances and Perspectives. Elsevier, pp. 219–236. 10.1016/B978-044451018-1/50053-1 [DOI] [Google Scholar]
- Sumner ME, Miller WP, 2018. Cation Exchange Capacity and Exchange Coefficients, in: Sparks DL, Page AL, Helmke PA, Loeppert RH, Soltanpour PN, Tabatabai MA, Johnston CT, Sumner ME (Eds.), Methods of Soil Analysis. Soil Science Society of America, pp. 1201–1229. 10.2136/sssabookser5.3.c40 [DOI] [Google Scholar]
- Száková J, Havlík J, Valterová B, Tlustoš P, Goessler W, 2010. The contents of risk elements, arsenic speciation, and possible interactions of elements and betalains in beetroot (Beta vulgaris, L.) growing in contaminated soil. Cent. Eur. J. Biol 5, 692–701. 10.2478/s11535-010-0050-0 [DOI] [Google Scholar]
- Tom M, Fletcher TD, McCarthy DT, 2014. Heavy metal contamination of vegetables irrigated by Urban stormwater: A matter of time? PLoS One 9, e112441 10.1371/journal.pone.0112441 [DOI] [PMC free article] [PubMed] [Google Scholar]
- US Census Bureau, 2019. 2017 ACS 5-year Estimates [WWW Document]. Am. FactFinder. URL https://factfinder.census.gov/faces/nav/jsf/pages/index.xhtml (accessed 10.7.19).
- USEPA, 2019a. Control of Lead and Copper [WWW Document]. URL https://www.ecfr.gov (accessed 11.15.19).
- USEPA, 2019b. Regional Screening Levels (RSLs) - Generic Tables [WWW Document]. URL https://www.epa.gov/risk/regional-screening-levels-rsls-generic-tables (accessed 10.17.19).
- USFDA, 2019. Interim Reference Level [WWW Document]. Lead Food, Foodwares, Diet. Suppl URL https://www.fda.gov/food/metals/lead-food-foodwares-and-dietary-supplements (accessed 10.11.19).
- USFDA, 2018. Total Diet Study [WWW Document]. URL https://www.fda.gov/food/science-research-food/total-diet-study (accessed 10.17.19).
- WDHS, 2018. Lead Poisoning Data and Data Analysis [WWW Document]. URL https://www.dhs.wisconsin.gov/lead/data.htm (accessed 10.7.19).
- WDNR, 2018. Soil Cleanup Standards Chapter 720 Wisconsin Administrative Code, United States. [Google Scholar]
- Whitehead LS, Buchanan SD, 2019. Childhood Lead Poisoning: A Perpetual Environmental Justice Issue? J. Public Heal. Manag. Pract 25, S115–S120. 10.1097/PHH.0000000000000891 [DOI] [PubMed] [Google Scholar]
- Yokel J, Delistraty DA, 2003. Arsenic, lead, and other trace elements in soils contaminated with pesticide residues at the Hanford site (USA). Environ. Toxicol 18, 104–114. 10.1002/tox.10106 [DOI] [PubMed] [Google Scholar]
- Yousaf B, Liu G, Wang R, Imtiaz M, Zia-ur-Rehman M, Munir MAM, Niu Z, 2016. Bioavailability evaluation, uptake of heavy metals and potential health risks via dietary exposure in urban-industrial areas. Environ. Sci. Pollut. Res 23, 22443–22453. 10.1007/s11356-016-7449-8 [DOI] [PubMed] [Google Scholar]
- Yuan Y, Xiang M, Liu C, Theng BKG, 2019. Chronic impact of an accidental wastewater spill from a smelter, China: A study of health risk of heavy metal(loid)s via vegetable intake. Ecotoxicol. Environ. Saf 182 10.1016/j.ecoenv.2019.109401 [DOI] [PubMed] [Google Scholar]
- Zahran S, Laidlaw MAS, McElmurry SP, Filippelli GM, Taylor M, 2015. Linking source and effect: Resuspended soil lead, air lead, and children’s blood lead levels in Detroit, Michigan, in: Everyday Environmental Toxins: Childrens Exposure Risks. Apple Academic Press, pp. 163–179. 10.1201/b18221 [DOI] [PubMed] [Google Scholar]
- Zwolak A, Sarzyńska M, Szpyrka E, Stawarczyk K, 2019. Sources of Soil Pollution by Heavy Metals and Their Accumulation in Vegetables: a Review. Water. Air. Soil Pollut 10.1007/s11270-019-4221-y [DOI] [Google Scholar]
Associated Data
This section collects any data citations, data availability statements, or supplementary materials included in this article.